Product Launch Dashboard
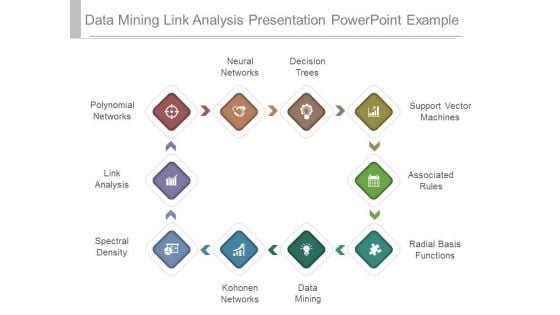
Data Mining Link Analysis Presentation Powerpoint Example
This is a data mining link analysis presentation powerpoint example. This is a ten stage process. The stages in this process are polynomial networks, link analysis, spectral density, kohonen networks, data mining, radial basis functions, associated rules, support vector machines, decision trees, neural network.
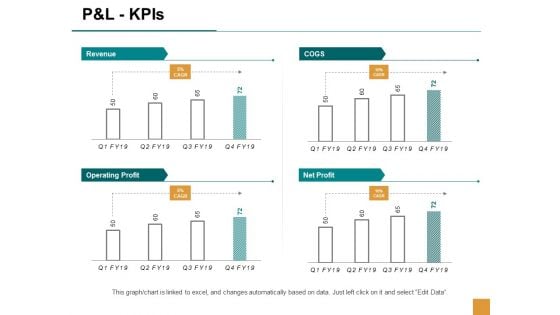
P And L Kpis Ppt Powerpoint Presentation Styles
This is a p and l kpis ppt powerpoint presentation styles. This is a four stage process. The stages in this process are finance, marketing, management, investment, analysis.

Statistical Analysis Presentation Powerpoint Example
This is a statistical analysis presentation powerpoint example. This is a seven stage process. The stages in this process are map results, external agents, statistical analysis, clean data, system boundary, analyze data, major function.

P And L Kpis Ppt PowerPoint Presentation Portfolio Slide
This is a p and l kpis ppt powerpoint presentation portfolio slide. This is a four stage process. The stages in this process are ebitda, profit before tax, profit after tax, expenses, net sales.
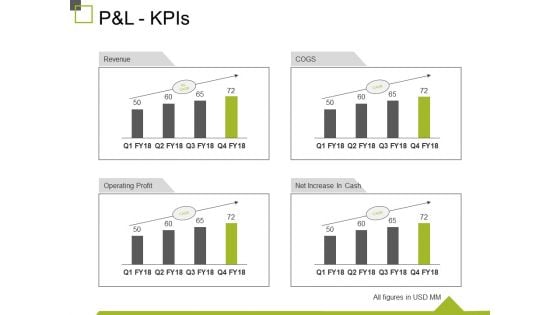
P And L Kpis Ppt PowerPoint Presentation Show Design Inspiration
This is a p and l kpis ppt powerpoint presentation show design inspiration. This is a four stage process. The stages in this process are revenue, operating profit, cogs, net increase in cash, business.
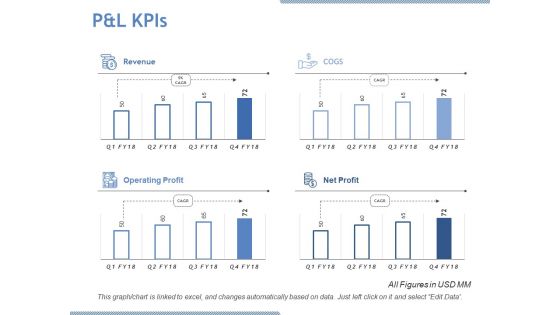
P And L Kpis Ppt PowerPoint Presentation Designs Download
This is a p and l kpis ppt powerpoint presentation designs download. This is a four stage process. The stages in this process are revenue, cogs, operating profit, net profit.
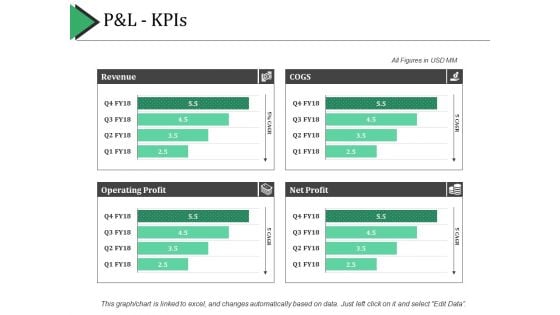
P And L Kpis Ppt PowerPoint Presentation Show Example Introduction
This is a p and l kpis ppt powerpoint presentation show example introduction. This is a four stage process. The stages in this process are revenue, cogs, net profit, operating profit.
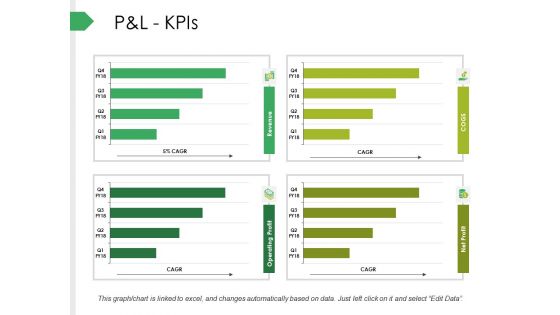
P And L Kpis Ppt PowerPoint Presentation Infographics Background
This is a p and l kpis ppt powerpoint presentation infographics background. This is a four stage process. The stages in this process are net sales, expenses, ebitda, profit before tax, profit after tax.
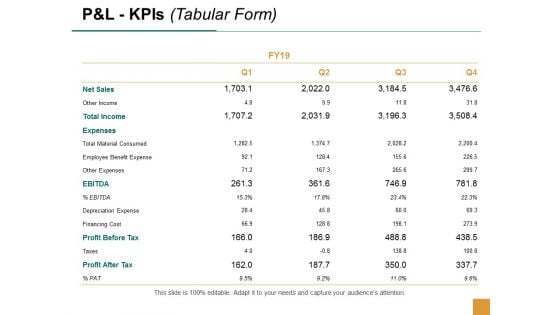
P And L Kpis Expenses Ppt Powerpoint Presentation Gallery Layouts
This is a p and l kpis expenses ppt powerpoint presentation gallery layouts. This is a four stage process. The stages in this process are business, management, planning, strategy, marketing.
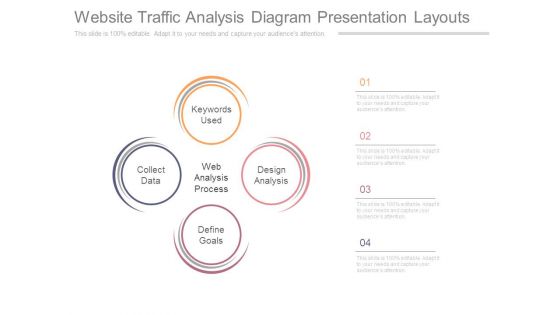
Website Traffic Analysis Diagram Presentation Layouts
This is a website traffic analysis diagram presentation layouts. This is a four stage process. The stages in this process are keywords used, design analysis, define goals, collect data, web analysis process.
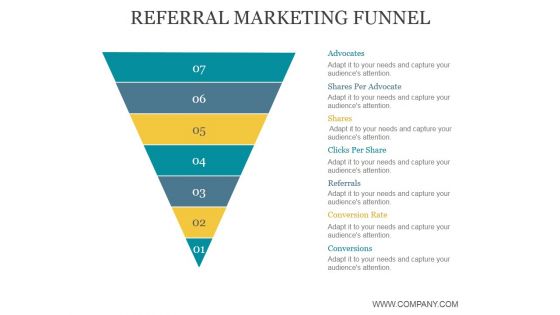
Referral Marketing Funnel Ppt PowerPoint Presentation Templates
This is a referral marketing funnel ppt powerpoint presentation templates. This is a seven stage process. The stages in this process are advocates, shares, clicks per share, conversion rate, conversions.
Key Performance Indicators Of A Shipping Firm Ppt PowerPoint Presentation Background Designs
This is a key performance indicators of a shipping firm ppt powerpoint presentation background designs. This is a eight stage process. The stages in this process are business, strategy, marketing, process, table, management.
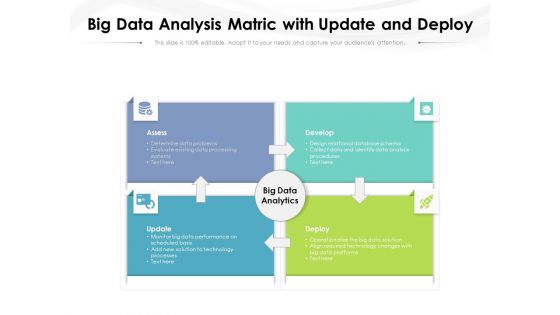
Big Data Analysis Matric With Update And Deploy Ppt PowerPoint Presentation Inspiration Styles PDF
Presenting this set of slides with name big data analysis matric with update and deploy ppt powerpoint presentation inspiration styles pdf. This is a four stage process. The stages in this process are assess, develop, update, deploy, big data analytics. This is a completely editable PowerPoint presentation and is available for immediate download. Download now and impress your audience.

Customizing The Salon Experience Financial Highlights And Marketing Mix Of Salon Business Strategy SS V
This slide presents key monetary results of the organization with a detailed description of services provided by the organization. It includes information about company revenue, net income, per session cost, gross profit margin, resource allocation, cost of services, cost of goods sold. The Customizing The Salon Experience Financial Highlights And Marketing Mix Of Salon Business Strategy SS V is a compilation of the most recent design trends as a series of slides. It is suitable for any subject or industry presentation, containing attractive visuals and photo spots for businesses to clearly express their messages. This template contains a variety of slides for the user to input data, such as structures to contrast two elements, bullet points, and slides for written information. Slidegeeks is prepared to create an impression. This slide presents key monetary results of the organization with a detailed description of services provided by the organization. It includes information about company revenue, net income, per session cost, gross profit margin, resource allocation, cost of services, cost of goods sold.
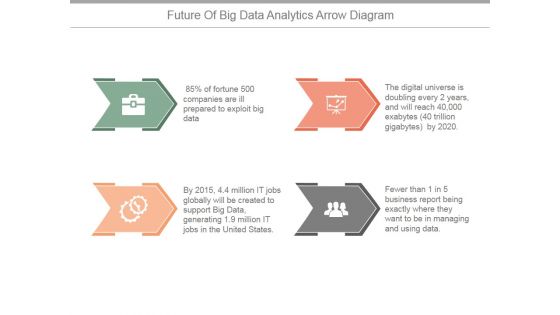
Future Of Big Data Analytics Arrow Diagram Ppt PowerPoint Presentation Summary
This is a future of big data analytics arrow diagram ppt powerpoint presentation summary. This is a four stage process. The stages in this process are big data, process, business, marketing, icons.

Key Performance Indicators Sample Diagram Ppt Slides
This is a Key Performance Indicators Sample Diagram Ppt Slides. This is a four stage process. The stages in this process are strategize, measure, innovate, propagate.
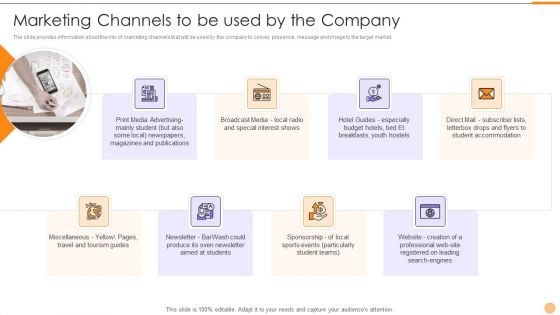
Classified Data Memo Record With Strategic Goals Marketing Channels To Be Used By The Company Demonstration PDF
The slide provides information about the mix of marketing channels that will be used by the company to convey presence, message and image to the target market. Presenting classified data memo record with strategic goals marketing channels to be used by the company demonstration pdf to provide visual cues and insights. Share and navigate important information on eight stages that need your due attention. This template can be used to pitch topics like miscellaneous, newsletter, sponsorship, direct mail, hotel guides, broadcast media. In addtion, this PPT design contains high resolution images, graphics, etc, that are easily editable and available for immediate download.
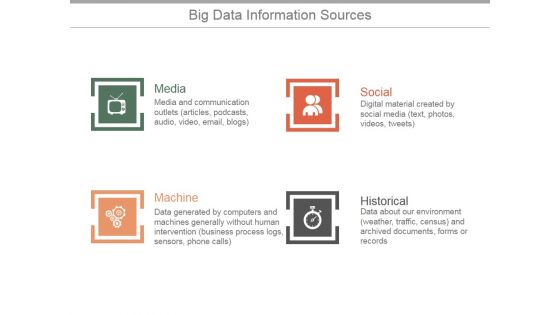
Big Data Information Sources Ppt PowerPoint Presentation Slides
This is a big data information sources ppt powerpoint presentation slides. This is a four stage process. The stages in this process are media, social, machine, historical.
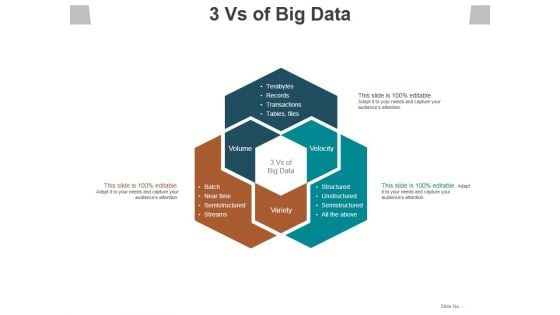
3 Vs Of Big Data Ppt PowerPoint Presentation Slides Samples
This is a 3 vs of big data ppt powerpoint presentation slides samples. This is a three stage process. The stages in this process are volume, variety, velocity, terabytes, transactions.
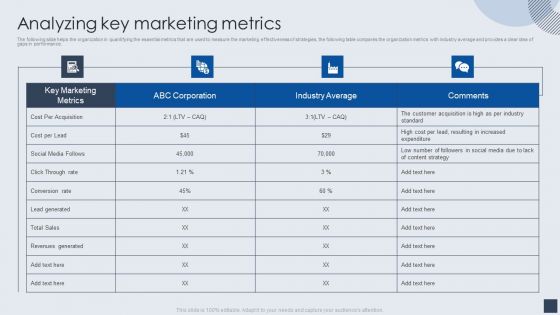
Implementing Marketing Mix Strategy To Enhance Overall Performance Analyzing Key Marketing Metrics Diagrams PDF
The following slide helps the organization in quantifying the essential metrics that are used to measure the marketing effectiveness of strategies, the following table compares the organization metrics with industry average and provides a clear idea of gaps in performance. Deliver an awe inspiring pitch with this creative Implementing Marketing Mix Strategy To Enhance Overall Performance Analyzing Key Marketing Metrics Diagrams PDF bundle. Topics like Key Marketing Metrics, Industry Average, Content Strategy can be discussed with this completely editable template. It is available for immediate download depending on the needs and requirements of the user.
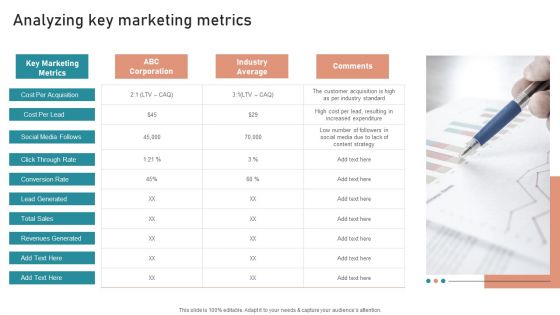
B2B And B2C Startups Marketing Mix Strategies Analyzing Key Marketing Metrics Download PDF
Boost your pitch with our creative B2B And B2C Startups Marketing Mix Strategies Analyzing Key Marketing Metrics Download PDF. Deliver an awe inspiring pitch that will mesmerize everyone. Using these presentation templates you will surely catch everyones attention. You can browse the ppts collection on our website. We have researchers who are experts at creating the right content for the templates. So you do not have to invest time in any additional work. Just grab the template now and use them.
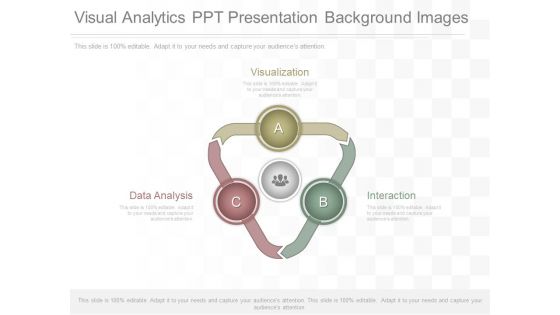
Visual Analytics Ppt Presentation Background Images
This is a visual analytics ppt presentation background images. This is a three stage process. The stages in this process are visualization, interaction, data analysis.
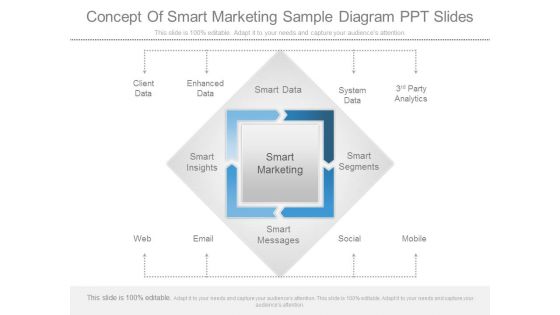
Concept Of Smart Marketing Sample Diagram Ppt Slides
This is a concept of smart marketing sample diagram ppt slides. This is a four stage process. The stages in this process are client data, enhanced data, smart data, system data, party analytics, smart insights, smart marketing, smart segments, web, email, smart messages, social, mobile.
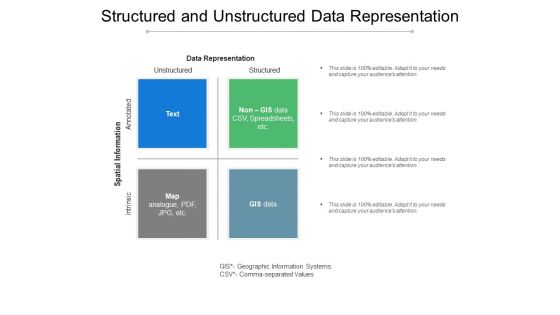
Structured And Unstructured Data Representation Ppt PowerPoint Presentation Styles Gridlines
Presenting this set of slides with name structured and unstructured data representation ppt powerpoint presentation styles gridlines. This is a four stage process. The stages in this process are data sources, database management, marketing. This is a completely editable PowerPoint presentation and is available for immediate download. Download now and impress your audience.
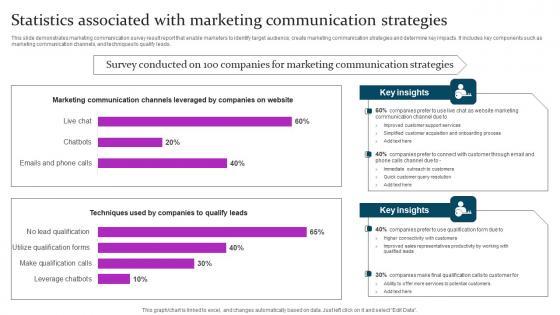
Statistics Associated Marketing Mix Communication Guide Client Brochure Pdf
This slide demonstrates marketing communication survey result report that enable marketers to identify target audience, create marketing communication strategies and determine key impacts. It includes key components such as marketing communication channels, and techniques to qualify leads. Formulating a presentation can take up a lot of effort and time, so the content and message should always be the primary focus. The visuals of the PowerPoint can enhance the presenters message, so our Statistics Associated Marketing Mix Communication Guide Client Brochure Pdf was created to help save time. Instead of worrying about the design, the presenter can concentrate on the message while our designers work on creating the ideal templates for whatever situation is needed. Slidegeeks has experts for everything from amazing designs to valuable content, we have put everything into Statistics Associated Marketing Mix Communication Guide Client Brochure Pdf This slide demonstrates marketing communication survey result report that enable marketers to identify target audience, create marketing communication strategies and determine key impacts. It includes key components such as marketing communication channels, and techniques to qualify leads.
P And L Kpis Template 1 Ppt PowerPoint Presentation Icon Graphics Download
This is a p and l kpis template 1 ppt powerpoint presentation icon graphics download. This is a four stage process. The stages in this process are net sales, total income, expenses, financing cost, profit after tax.
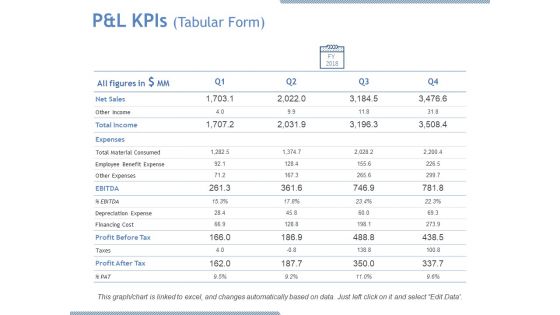
P And L Kpis Tabular Form Ppt PowerPoint Presentation Outline Aids
This is a p and l kpis tabular form ppt powerpoint presentation outline aids. This is a four stage process. The stages in this process are net sales, other income, total income, expenses, taxes.
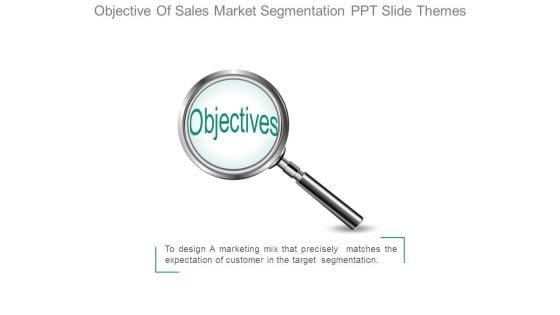
Objective Of Sales Market Segmentation Ppt Slide Themes
This is a objective of sales market segmentation ppt slide themes. This is a one stage process. The stages in this process are objectives, to design a marketing mix that precisely matches the expectation of customer in the target segmentation.
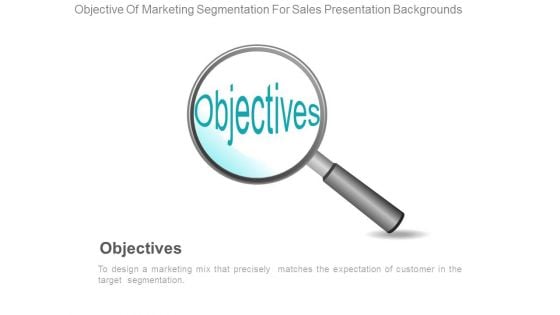
Objective Of Marketing Segmentation For Sales Presentation Backgrounds
This is a objective of marketing segmentation for sales presentation backgrounds. This is a one stage process. The stages in this process are objectives, to design a marketing mix that precisely matches the expectation of customer in the target segmentation.
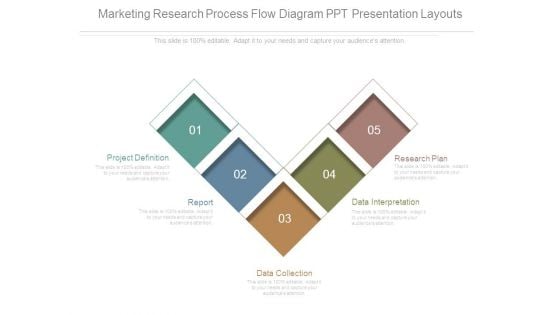
Marketing Research Process Flow Diagram Ppt Presentation Layouts
This is a marketing research process flow diagram ppt presentation layouts. This is a five stage process. The stages in this process are project definition, report, data collection, data interpretation, research plan.
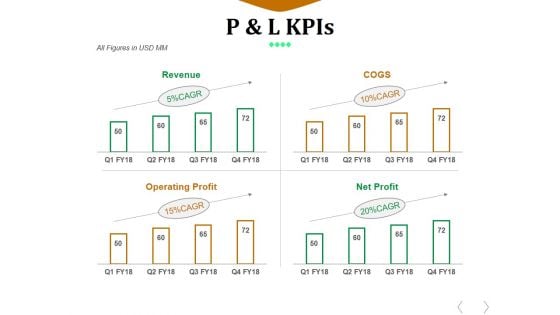
P And L Kpis Template 1 Ppt PowerPoint Presentation Design Ideas
This is a p and l kpis template 1 ppt powerpoint presentation design ideas. This is a four stage process. The stages in this process are revenue, cogs, operating profit, net profit.
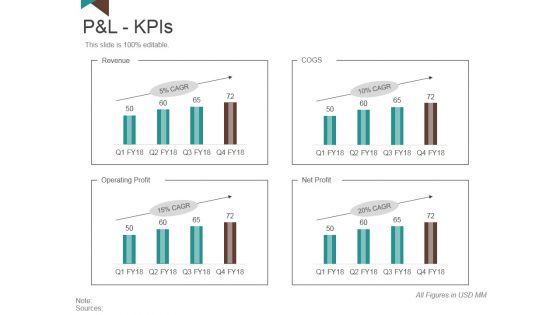
P And L Kpis Template 1 Ppt PowerPoint Presentation Slides Model
This is a p and l kpis template 1 ppt powerpoint presentation slides model. This is a four stage process. The stages in this process are revenue, operating profit, net profit, cogs.
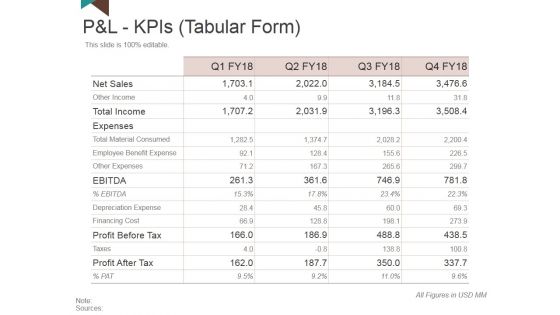
P And L Kpis Template 2 Ppt PowerPoint Presentation Outline Clipart
This is a p and l kpis template 2 ppt powerpoint presentation outline clipart. This is a four stage process. The stages in this process are net sales, total income, expenses, profit before tax, profit after tax.
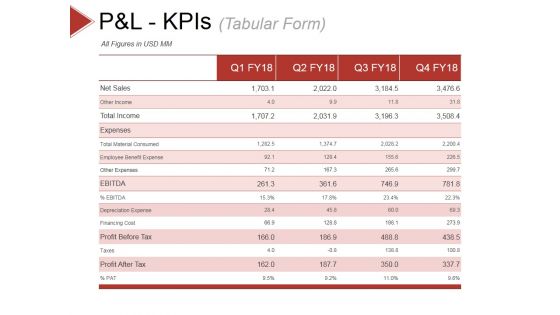
P And L Kpis Template 1 Ppt PowerPoint Presentation Slides Show
This is a p and l kpis template 1 ppt powerpoint presentation slides show. This is a four stage process. The stages in this process are other income, total income, expenses, other expenses, depreciation expense.
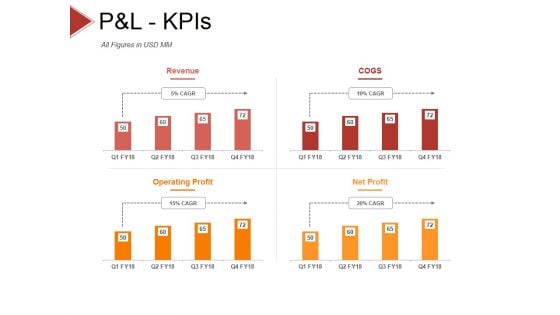
P And L Kpis Template 2 Ppt PowerPoint Presentation Styles Objects
This is a p and l kpis template 2 ppt powerpoint presentation styles objects. This is a four stage process. The stages in this process are revenue, cogs, operating profit, net profit.

P And L Kpis Template 1 Ppt PowerPoint Presentation Model Inspiration
This is a p and l kpis template 1 ppt powerpoint presentation model inspiration. This is a four stage process. The stages in this process are revenue, cogs, operating profit, net profit.
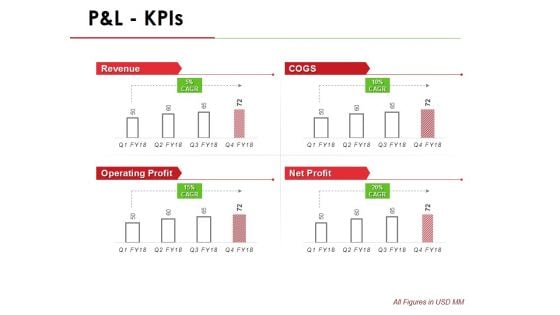
P And L Kpis Template 1 Ppt PowerPoint Presentation Infographic Template Outline
This is a p and l kpis template 1 ppt powerpoint presentation infographic template outline. This is a four stage process. The stages in this process are revenue, operating profit, cogs, net profit.

P And L Kpis Tabular Form Ppt PowerPoint Presentation Ideas Infographics
This is a p and l kpis tabular form ppt powerpoint presentation ideas infographics. This is a four stage process. The stages in this process are other income, expenses, other expenses, depreciation expense, financing cost.
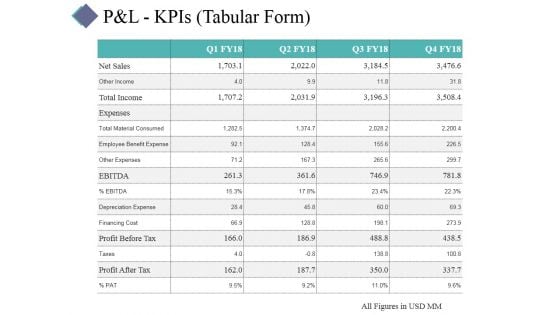
P And L Kpis Template 1 Ppt PowerPoint Presentation Portfolio Visual Aids
This is a p and l kpis template 1 ppt powerpoint presentation portfolio visual aids. This is a four stage process. The stages in this process are business, table, management, analysis, strategy.
P And L Kpis Template 2 Ppt PowerPoint Presentation Summary Icon
This is a p and l kpis template 2 ppt powerpoint presentation summary icon. This is a four stage process. The stages in this process are revenue, cogs, operating profit, net profit.
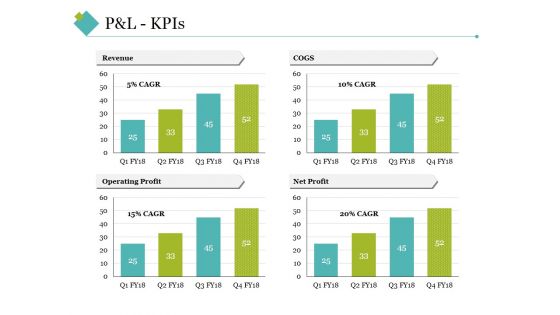
P And L Kpis Template 2 Ppt PowerPoint Presentation Inspiration Grid
This is a p and l kpis template 2 ppt powerpoint presentation inspiration grid. This is a four stage process. The stages in this process are revenue, cogs, operating profit, net profit.
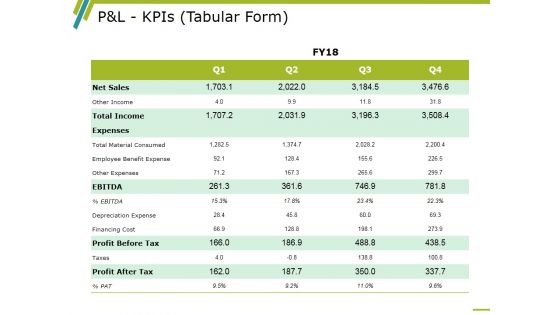
P And L Kpis Template 1 Ppt PowerPoint Presentation Infographics Professional
This is a p and l kpis template 1 ppt powerpoint presentation infographics professional. This is a four stage process. The stages in this process are Other Income, Total Income, Ebitda, Profit Before Tax, Profit After Tax.
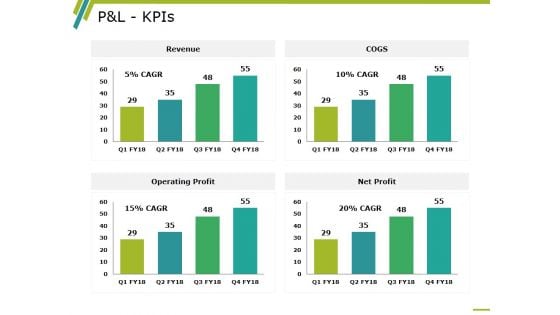
P And L Kpis Template 2 Ppt PowerPoint Presentation Professional Information
This is a p and l kpis template 2 ppt powerpoint presentation professional information. This is a four stage process. The stages in this process are revenue, operating profit, cogs, net profit, business.
P And L Kpis Template 1 Ppt PowerPoint Presentation Icon Background Image
This is a p and l kpis template 1 ppt powerpoint presentation icon background image. This is a four stage process. The stages in this process are business, management, analysis, table, strategy.
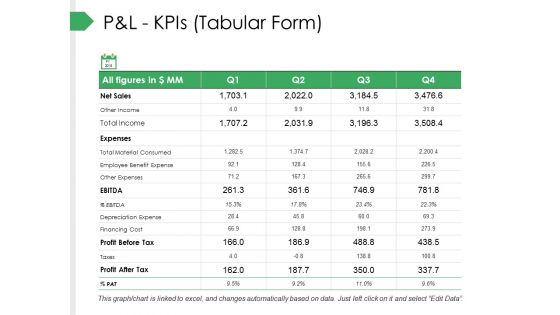
P And L Kpis Tabular Form Ppt PowerPoint Presentation Pictures Gallery
This is a p and l kpis tabular form ppt powerpoint presentation pictures gallery. This is a four stage process. The stages in this process are business, marketing, graph, strategy, finance.

P And L Kpis Tabular Form Ppt PowerPoint Presentation Ideas Brochure
This is a p and l kpis tabular form ppt powerpoint presentation ideas brochure. This is a four stage process. The stages in this process are business, planning, strategy, marketing, management.
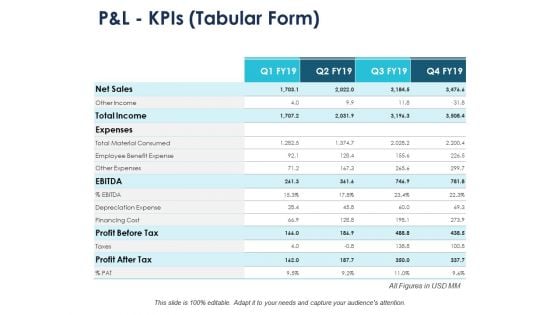
P And L Kpis Tabular Form Compare Ppt PowerPoint Presentation Gallery Maker
This is a p and l kpis tabular form compare ppt powerpoint presentation gallery maker. This is a four stage process. The stages in this process are compare, marketing, business, management, planning.
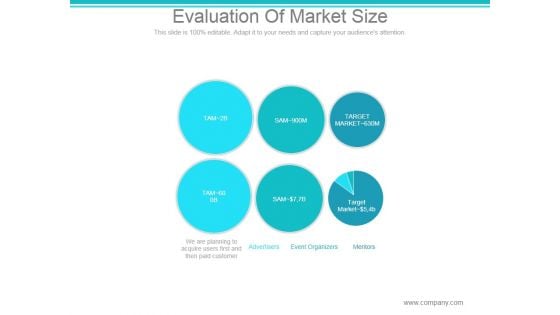
Evaluation Of Market Size Ppt PowerPoint Presentation Ideas
This is a evaluation of market size ppt powerpoint presentation ideas. This is a six stage process. The stages in this process are target market, advertisers, event organizers, mentors.
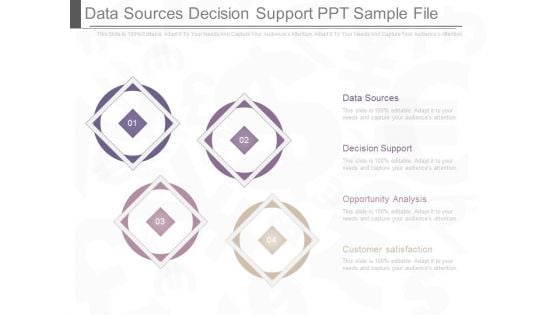
Data Sources Decision Support Ppt Sample File
This is a data sources decision support ppt sample file. This is a four stage process. The stages in this process are data sources, decision support, opportunity analysis, customer satisfaction.
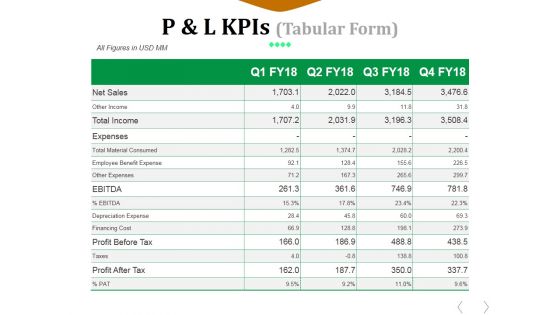
P And L Kpis Template 2 Ppt PowerPoint Presentation File Graphics Example
This is a p and l kpis template 2 ppt powerpoint presentation file graphics example. This is a four stage process. The stages in this process are net sales, expenses, cost of goods sold, employee benefit expense, other expenses, financing cost.
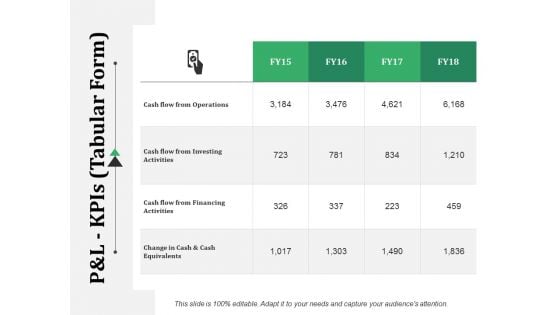
P And L Kpis Template 2 Ppt PowerPoint Presentation Infographic Template Templates
This is a p and l kpis template 2 ppt powerpoint presentation infographic template templates. This is a four stage process. The stages in this process are cash flow from operations, cash flow from investing activities, cash flow from financing activities, change in cash and cash equivalents.
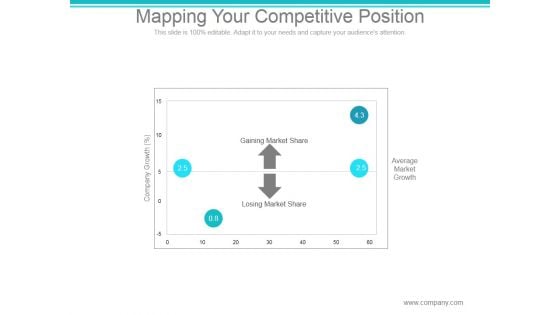
Mapping Your Competitive Position Ppt PowerPoint Presentation Files
This is a mapping your competitive position ppt powerpoint presentation files. This is a four stage process. The stages in this process are gaining market share, losing market share, company growth, average market growth.
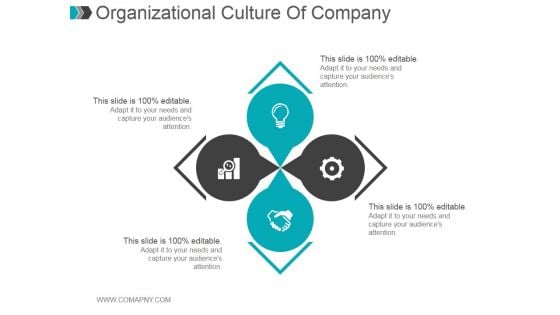
Organizational Culture Of Company Ppt PowerPoint Presentation Designs Download
This is a organizational culture of company ppt powerpoint presentation designs download. This is a four stage process. The stages in this process are organizational, business, company, strategy, marketing.

The Marketing Mix Of Adidas A Comprehensive Analysis Strategy CD V
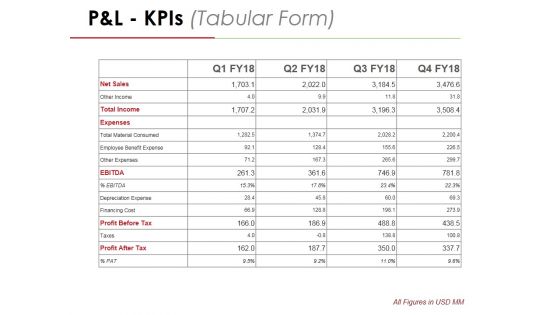
P And L Kpis Template 2 Ppt PowerPoint Presentation Professional Graphics
This is a p and l kpis template 2 ppt powerpoint presentation professional graphics. This is a four stage process. The stages in this process are net sales, other income, total income, expenses, total material consumed.
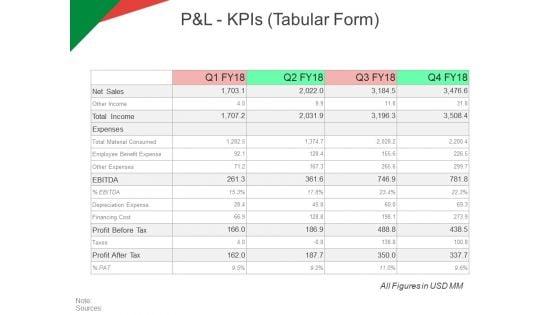
P And L Kpis Tabular Form Ppt PowerPoint Presentation Model Ideas
This is a p and l kpis tabular form ppt powerpoint presentation model ideas. This is a four stage process. The stages in this process are revenue, operating profit, cogs, net profit.
Key Performance Indicator Example Ppt Powerpoint Presentation Icon Grid Cpb
This is a key performance indicator example ppt powerpoint presentation icon grid cpb. This is a four stage process. The stages in this process are key performance indicator example.
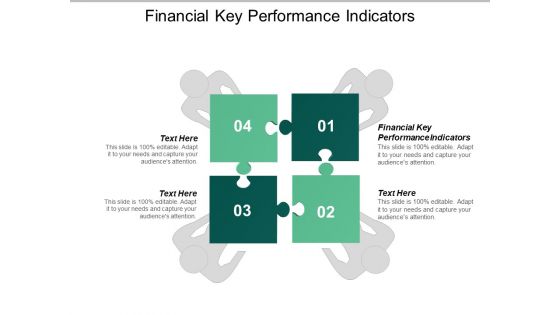
Financial Key Performance Indicators Ppt PowerPoint Presentation Ideas Aids Cpb
This is a financial key performance indicators ppt powerpoint presentation ideas aids cpb. This is a four stage process. The stages in this process are financial key performance indicators.
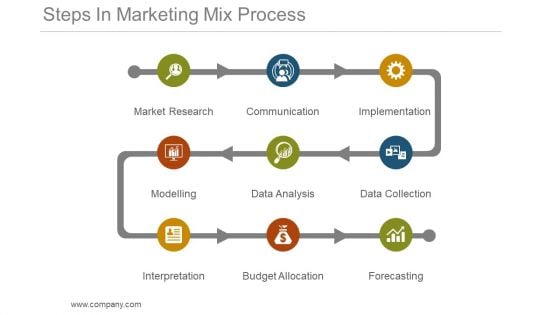
Steps In Marketing Mix Process Powerpoint Slide Deck
This is a steps in marketing mix process powerpoint slide deck. This is a nine stage process. The stages in this process are market research, communication, implementation, data collection, data analysis, modelling, interpretation, budget allocation, forecasting.
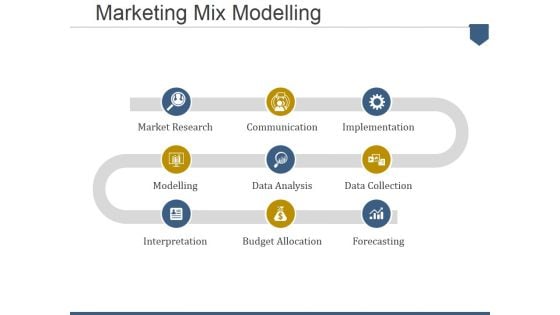
Marketing Mix Modelling Ppt PowerPoint Presentation Portfolio Graphics Template
This is a marketing mix modelling ppt powerpoint presentation portfolio graphics template. This is a three stage process. The stages in this process are market research, communication, implementation, data collection, forecasting, budget allocation, data analysis, modelling, interpretation.


 Continue with Email

 Home
Home


