Product Performance
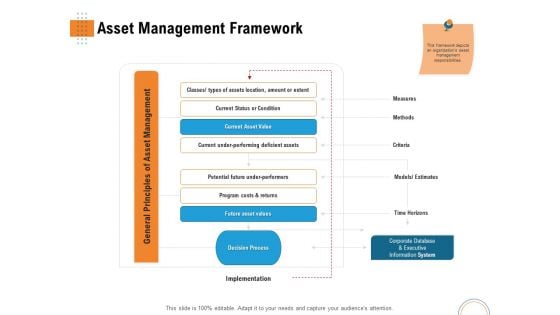
Utilizing Infrastructure Management Using Latest Methods Asset Management Framework Demonstration PDF
Presenting utilizing infrastructure management using latest methods asset management framework demonstration pdf to provide visual cues and insights. Share and navigate important information on one stages that need your due attention. This template can be used to pitch topics like asset management, implementation, program costs and returns, potential future under performers, current asset value, measures, criteria, time horizons. In addition, this PPT design contains high-resolution images, graphics, etc, that are easily editable and available for immediate download.
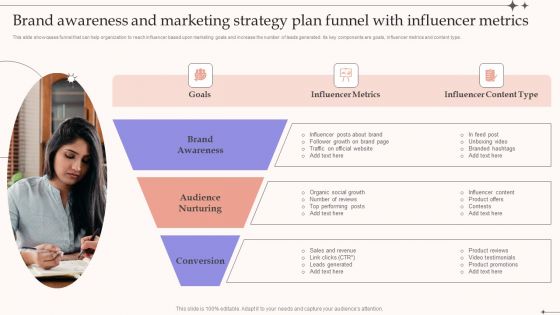
Brand Awareness And Marketing Strategy Plan Funnel With Influencer Metrics Download PDF
This slide showcases funnel that can help organization to reach influencer based upon marketing goals and increase the number of leads generated. Its key components are goals, influencer metrics and content type.Persuade your audience using this Brand Awareness And Marketing Strategy Plan Funnel With Influencer Metrics Download PDF. This PPT design covers three stages, thus making it a great tool to use. It also caters to a variety of topics including Brand Awareness, Audience Nurturing, Influencer Posts. Download this PPT design now to present a convincing pitch that not only emphasizes the topic but also showcases your presentation skills.
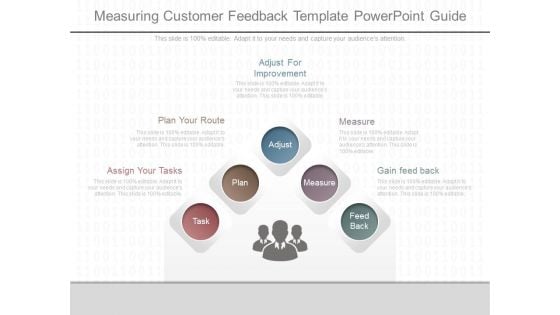
Measuring Customer Feedback Template Powerpoint Guide
This is a measuring customer feedback template powerpoint guide. This is a five stage process. The stages in this process are adjust for improvement, plan your route, assign your tasks, measure, gain feed back, adjust, measure, feed back, plan, task.

Stock Photo Measuring Tape Construction PowerPoint Slide
This image displays graphic of Measuring Tape on white background. Use this image to depict concept of measurement and engineering. Use this image and make an impressive presentation.

Stock Photo Measuring Tape PowerPoint Slide
This image displays graphic of Measuring Tape on white background. Use this image to depict concept of measurement and engineering. Use this image and make an impressive presentation.
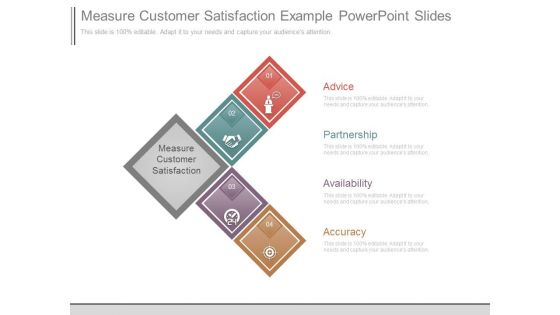
Measure Customer Satisfaction Example Powerpoint Slides
This is a measure customer satisfaction example powerpoint slides. This is a four stage process. The stages in this process are advice, partnership, availability, accuracy, measure customer satisfaction.
Step 2 Measure Ppt PowerPoint Presentation Introduction
This is a step 2 measure ppt powerpoint presentation introduction. This is a five stage process. The stages in this process are measure, strategy, business, marketing, management.
KPI Dashboard To Measure Workforce Increase Ppt Slides Elements PDF
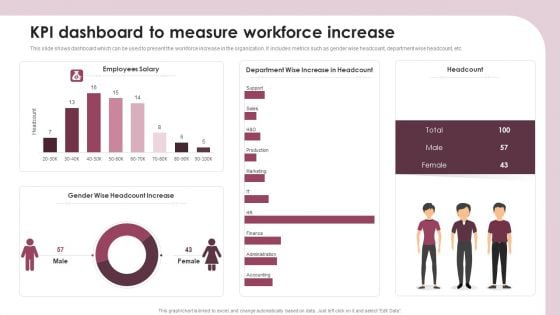
This slide shows dashboard which can be used to present the workforce increase in the organization. It includes metrics such as gender wise headcount, department wise headcount, etc. Showcasing this set of slides titled KPI Dashboard To Measure Workforce Increase Ppt Slides Elements PDF. The topics addressed in these templates are Employees Salary, Headcount, Gender Wise, Headcount Increase. All the content presented in this PPT design is completely editable. Download it and make adjustments in color, background, font etc. as per your unique business setting.
Business Charts Examples PowerPoint Templates Track Record
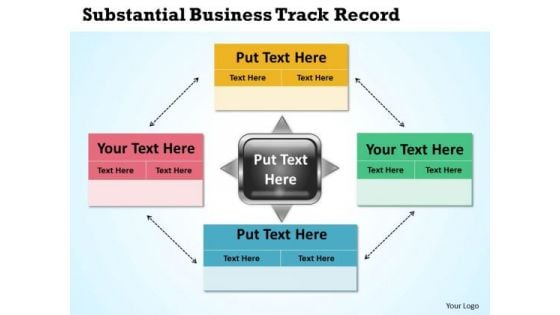
We present our business charts examples powerpoint templates track record.Present our Arrows PowerPoint Templates because a lot of hard work has gone in and you are almost there. Download and present our Boxes PowerPoint Templates because it will demonstrate the strength of character under severe stress. Shine the torch ahead and bring the light to shine on all. Use our Business PowerPoint Templates because this layout helps you to bring some important aspects of your business process to the notice of all concerned. Streamline the flow of information across the board. Download and present our Shapes PowerPoint Templates because we all know that alphabetical order is a time honoured concept. Use our Finance PowerPoint Templates because it shows to your group how they mesh together to drive the whole.Use these PowerPoint slides for presentations relating to Abstract, Background, Blocks, Business, Chart, Color, Concept, Construction, Diagram, Financial, Graph, Green, Group, Growth, Hierarchy, Icon, Illustration, Increase, Innovation, Isolated, Level, Management, Object, Orange, Part, Performance, Progress, Pyramid, Red, Reflection, Results, Shape, Sliced, Stage, Status, Step, Strategy, Structure, Success, Support, Symbol, System, Team, Teamwork. The prominent colors used in the PowerPoint template are Yellow, Red, Green. PowerPoint presentation experts tell us our business charts examples powerpoint templates track record are Spiffy. Professionals tell us our Blocks PowerPoint templates and PPT Slides are the best it can get when it comes to presenting. People tell us our business charts examples powerpoint templates track record are Bright. We assure you our Diagram PowerPoint templates and PPT Slides are Spiffy. PowerPoint presentation experts tell us our business charts examples powerpoint templates track record will impress their bosses and teams. Professionals tell us our Chart PowerPoint templates and PPT Slides are Endearing. Test out the effect of your thoughts. Our Business Charts Examples PowerPoint Templates Track Record will assist in the experiment.
Business Flow Chart PowerPoint Presentations Process Slides
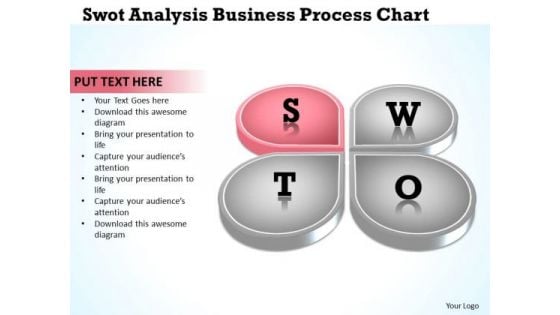
We present our business flow chart powerpoint presentations process Slides.Use our Advertising PowerPoint Templates because this PPt slide can educate your listeners on the relevance and importance of each one as per your plan and how they all contribute as you strive to hit the Bullseye. Present our Business PowerPoint Templates because the great Bald headed Eagle embodies your personality. the eagle eye to seize upon the smallest of opportunities. Download and present our Marketing PowerPoint Templates because that was the well known Musketeers call. Use our Finance PowerPoint Templates because you envisage some areas of difficulty in the near future. The overall financial situation could be a source of worry. Download and present our Shapes PowerPoint Templates because there is a key aspect to be emphasised.Use these PowerPoint slides for presentations relating to Analysis, Business, Concept, Design, Diagram, Direction, Goals, Guide, Icon, Idea, Management, Model, Opportunity, Organization, Performance, Plan, Process, Project, Representation, Resource, Strategy, Swot. The prominent colors used in the PowerPoint template are Blue, Black, Gray. PowerPoint presentation experts tell us our business flow chart powerpoint presentations process Slides are Perfect. Professionals tell us our Diagram PowerPoint templates and PPT Slides are Striking. People tell us our business flow chart powerpoint presentations process Slides are Appealing. We assure you our Icon PowerPoint templates and PPT Slides are Endearing. PowerPoint presentation experts tell us our business flow chart powerpoint presentations process Slides are Appealing. Professionals tell us our Direction PowerPoint templates and PPT Slides effectively help you save your valuable time. Experience fantasy with our Business Flow Chart PowerPoint Presentations Process Slides. Energise the creativity of your audience.
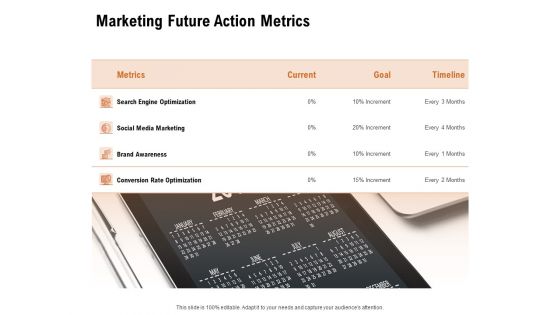
For Launching Company Site Marketing Future Action Metrics Ppt PowerPoint Presentation Template PDF
This is a for launching company site marketing future action metrics ppt powerpoint presentation template pdf template with various stages. Focus and dispense information on one stages using this creative set, that comes with editable features. It contains large content boxes to add your information on topics like search engine optimization, social media marketing, brand awareness, conversion rate optimization, goal, timeline. You can also showcase facts, figures, and other relevant content using this PPT layout. Grab it now.
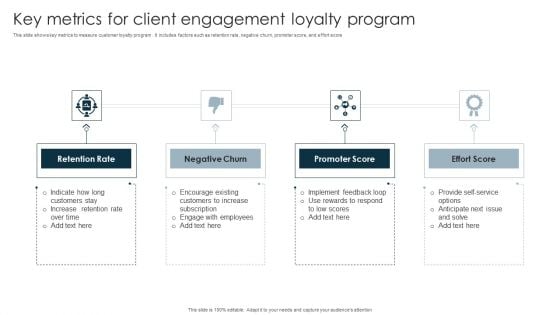
Key Metrics For Client Engagement Loyalty Program Microsoft PDF
This slide shows key metrics to measure customer loyalty program . It includes factors such as retention rate, negative churn, promoter score, and effort score. Persuade your audience using this Key Metrics For Client Engagement Loyalty Program Microsoft PDF. This PPT design covers four stages, thus making it a great tool to use. It also caters to a variety of topics including Retention Rate, Negative Churn, Promoter Score, Effort Score. Download this PPT design now to present a convincing pitch that not only emphasizes the topic but also showcases your presentation skills.
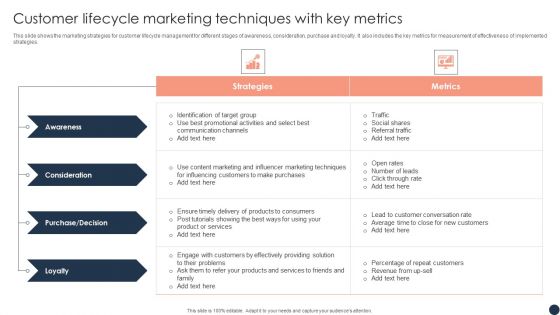
Customer Lifecycle Marketing Techniques With Key Metrics Topics PDF
This slide shows the marketing strategies for customer lifecycle management for different stages of awareness, consideration, purchase and loyalty. It also includes the key metrics for measurement of effectiveness of implemented strategies. Showcasing this set of slides titled Customer Lifecycle Marketing Techniques With Key Metrics Topics PDF. The topics addressed in these templates are Consideration, Awareness, Purchase. All the content presented in this PPT design is completely editable. Download it and make adjustments in color, background, font etc. as per your unique business setting.
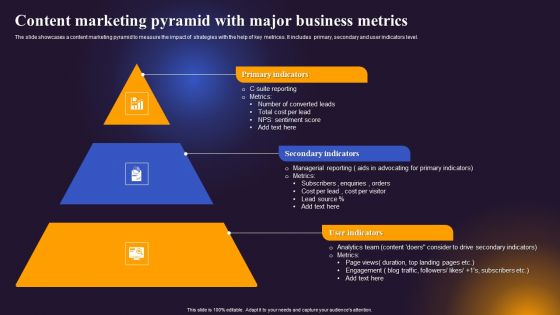
Content Marketing Pyramid With Major Business Metrics Formats PDF
The slide showcases a content marketing pyramid to measure the impact of strategies with the help of key metrices. It includes primary, secondary and user indicators level. Persuade your audience using this Content Marketing Pyramid With Major Business Metrics Formats PDF. This PPT design covers three stages, thus making it a great tool to use. It also caters to a variety of topics including Primary Indicators, Secondary Indicators, User Indicators. Download this PPT design now to present a convincing pitch that not only emphasizes the topic but also showcases your presentation skills.
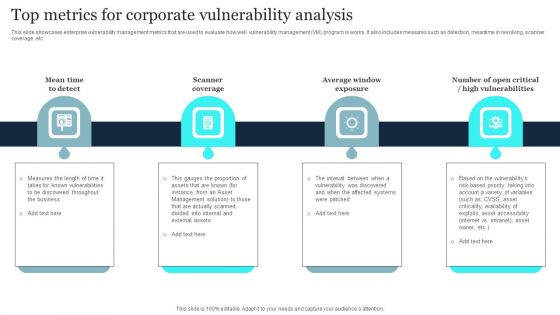
Top Metrics For Corporate Vulnerability Analysis Diagrams PDF
This slide showcases enterprise vulnerability management metrics that are used to evaluate how well vulnerability management VM program is works. It also includes measures such as detection, meantime in resolving, scanner coverage, etc. Presenting Top Metrics For Corporate Vulnerability Analysis Diagrams PDF to dispense important information. This template comprises four stages. It also presents valuable insights into the topics including Scanner Coverage, Average Window Exposure, High Vulnerabilities. This is a completely customizable PowerPoint theme that can be put to use immediately. So, download it and address the topic impactfully.
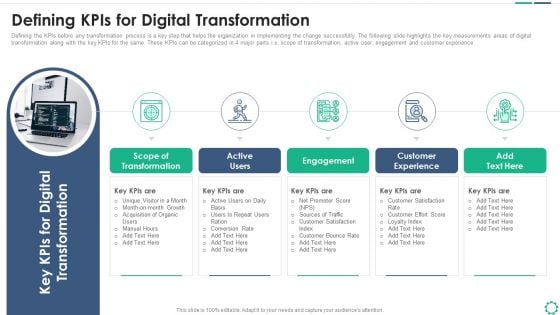
Digitalization Plan For Business Modernization Defining Kpis For Digital Transformation Sample PDF
Defining the KPIs before any transformation process is a key step that helps the organization in implementing the change successfully. The following slide highlights the key measurements areas of digital transformation along with the key KPIs for the same. These KPIs can be categorized in 4 major parts i.e. scope of transformation, active user, engagement and customer experience. This is a digitalization plan for business modernization defining kpis for digital transformation sample pdf template with various stages. Focus and dispense information on five stages using this creative set, that comes with editable features. It contains large content boxes to add your information on topics like scope of transformation, active users, engagement, customer experience. You can also showcase facts, figures, and other relevant content using this PPT layout. Grab it now.
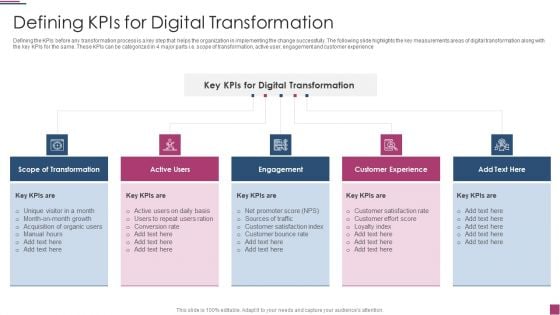
Innovation Procedure For Online Business Defining Kpis For Digital Transformation Summary PDF
Defining the KPIs before any transformation process is a key step that helps the organization in implementing the change successfully. The following slide highlights the key measurements areas of digital transformation along with the key KPIs for the same. These KPIs can be categorized in 4 major parts i.e. scope of transformation, active user, engagement and customer experience This is a Innovation Procedure For Online Business Defining Kpis For Digital Transformation Summary PDF template with various stages. Focus and dispense information on five stages using this creative set, that comes with editable features. It contains large content boxes to add your information on topics like Scope Of Transformation, Customer Experience, Digital Transformation You can also showcase facts, figures, and other relevant content using this PPT layout. Grab it now.
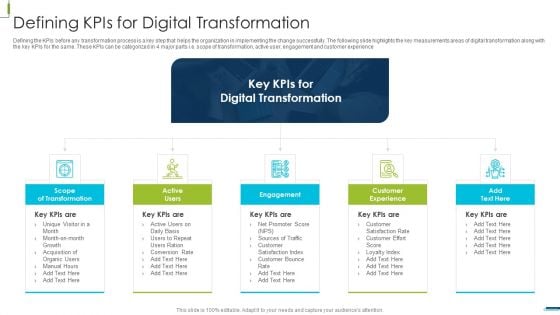
Corporate Digital Transformation Roadmap Defining Kpis For Digital Transformation Summary PDF
Defining the KPIs before any transformation process is a key step that helps the organization in implementing the change successfully. The following slide highlights the key measurements areas of digital transformation along with the key KPIs for the same. These KPIs can be categorized in 4 major parts i.e. scope of transformation, active user, engagement and customer experience This is a Corporate Digital Transformation Roadmap Defining Kpis For Digital Transformation Summary PDF template with various stages. Focus and dispense information on five stages using this creative set, that comes with editable features. It contains large content boxes to add your information on topics like Scope Of Transformation, Customer Experience, Engagement You can also showcase facts, figures, and other relevant content using this PPT layout. Grab it now.
ERP Digital Transformation Journey Defining Kpis For Digital Transformation Sample PDF
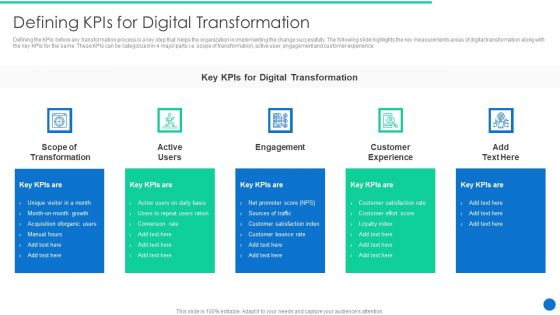
Defining the KPIs before any transformation process is a key step that helps the organization in implementing the change successfully. The following slide highlights the key measurements areas of digital transformation along with the key KPIs for the same. These KPIs can be categorized in 4 major parts i.e. scope of transformation, active user, engagement and customer experience. This is a ERP Digital Transformation Journey Defining Kpis For Digital Transformation Sample PDF template with various stages. Focus and dispense information on five stages using this creative set, that comes with editable features. It contains large content boxes to add your information on topics like Scope Transformation, Engagement, Customer Experience. You can also showcase facts, figures, and other relevant content using this PPT layout. Grab it now.
Digitalization Of Transportation Enterprise Defining Kpis For Digital Transformation Mockup PDF
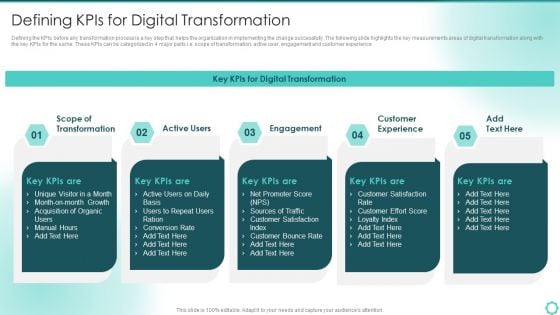
Defining the KPIs before any transformation process is a key step that helps the organization in implementing the change successfully. The following slide highlights the key measurements areas of digital transformation along with the key KPIs for the same. These KPIs can be categorized in 4 major parts i.e. scope of transformation, active user, engagement and customer experience. This is a Digitalization Of Transportation Enterprise Defining Kpis For Digital Transformation Mockup PDF template with various stages. Focus and dispense information on five stages using this creative set, that comes with editable features. It contains large content boxes to add your information on topics like Growth, Conversion Rate, Sources Of Traffic. You can also showcase facts, figures, and other relevant content using this PPT layout. Grab it now.

Financial Measures Powerpoint Slides Background Designs
This is a financial measures powerpoint slides background designs. This is a five stage process. The stages in this process are traditional strategic management, internal processes, customer relationship, learning and growth, financial measures.
Measure And Control Powerpoint Presentation Templates
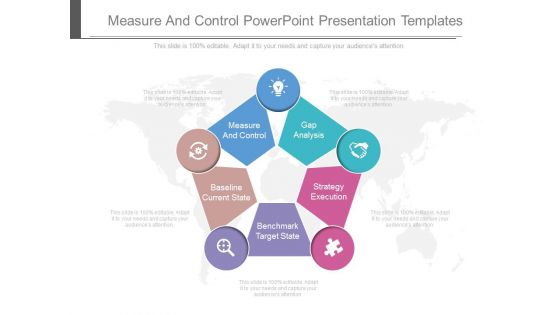
This is a measure and control powerpoint presentation templates. This is a five stage process. The stages in this process are measure and control, baseline current state, benchmark target state, strategy execution, gap analysis.
Customer Satisfaction Measurement Techniques Presentation Graphics
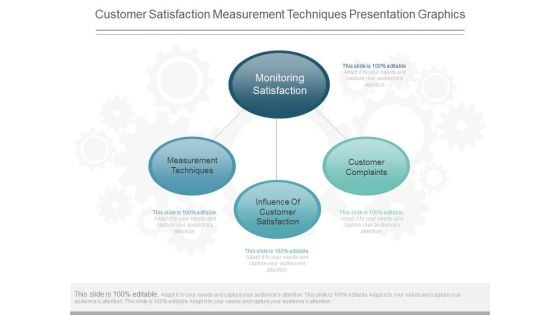
This is a customer satisfaction measurement techniques presentation graphics. This is a four stage process. The stages in this process are monitoring satisfaction, measurement techniques, influence of customer satisfaction, customer complaints.
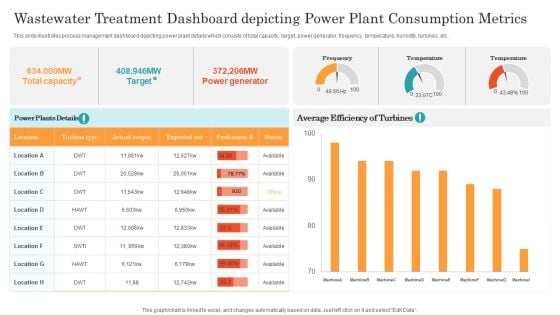
Wastewater Treatment Dashboard Depicting Power Plant Consumption Metrics Ppt Slides Tips PDF
This slide illustrates process management dashboard depicting power plant details which consists of total capacity, target, power generator, frequency, temperature, humidity, turbines, etc. Pitch your topic with ease and precision using this Wastewater Treatment Dashboard Depicting Power Plant Consumption Metrics Ppt Slides Tips PDF. This layout presents information on Power Generator, Target, Actual Output. It is also available for immediate download and adjustment. So, changes can be made in the color, design, graphics or any other component to create a unique layout.
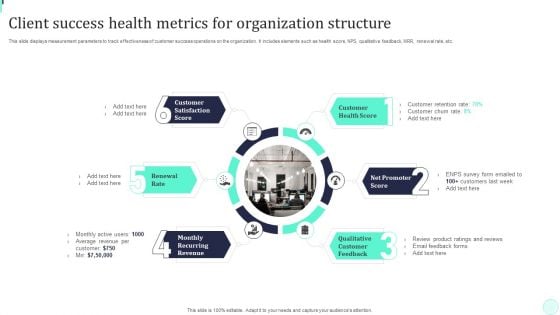
Client Success Health Metrics For Organization Structure Designs PDF
This slide displays measurement parameters to track effectiveness of customer success operations on the organization. It includes elements such as health score, NPS, qualitative feedback, MRR, renewal rate, etc. Persuade your audience using this Client Success Health Metrics For Organization Structure Designs PDF. This PPT design covers six stages, thus making it a great tool to use. It also caters to a variety of topics including Customer Satisfaction, Score Customer Health, Score Renewal Rate. Download this PPT design now to present a convincing pitch that not only emphasizes the topic but also showcases your presentation skills.
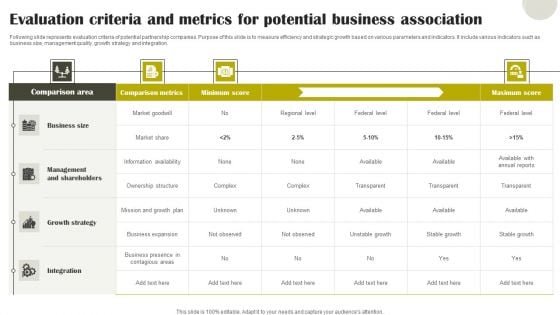
Evaluation Criteria And Metrics For Potential Business Association Diagrams PDF
Following slide represents evaluation criteria of potential partnership companies. Purpose of this slide is to measure efficiency and strategic growth based on various parameters and indicators. It include various indicators such as business size, management quality, growth strategy and integration. Showcasing this set of slides titled Evaluation Criteria And Metrics For Potential Business Association Diagrams PDF. The topics addressed in these templates are Growth Strategy, Management And Shareholders, Business Size. All the content presented in this PPT design is completely editable. Download it and make adjustments in color, background, font etc. as per your unique business setting.
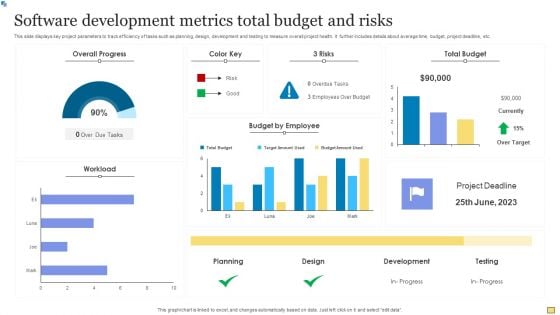
Software Development Metrics Total Budget And Risks Summary PDF
This slide displays key project parameters to track efficiency of tasks such as planning, design, development and testing to measure overall project health. It further includes details about average time, budget, project deadline, etc. Showcasing this set of slides titled Software Development Metrics Total Budget And Risks Summary PDF. The topics addressed in these templates are Overall Progress, Workload Employee, Total Budget. All the content presented in this PPT design is completely editable. Download it and make adjustments in color, background, font etc. as per your unique business setting.
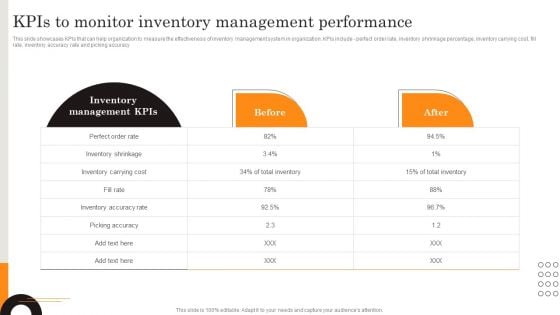
Procurement Strategies For Reducing Stock Wastage Kpis To Monitor Inventory Template PDF
This slide showcases KPIs that can help organization to measure the effectiveness of inventory management system in organization. KPIs include perfect order rate, inventory shrinkage percentage, inventory carrying cost, fill rate, inventory accuracy rate and picking accuracy. Coming up with a presentation necessitates that the majority of the effort goes into the content and the message you intend to convey. The visuals of a PowerPoint presentation can only be effective if it supplements and supports the story that is being told. Keeping this in mind our experts created Procurement Strategies For Reducing Stock Wastage Kpis To Monitor Inventory Template PDF to reduce the time that goes into designing the presentation. This way, you can concentrate on the message while our designers take care of providing you with the right template for the situation.
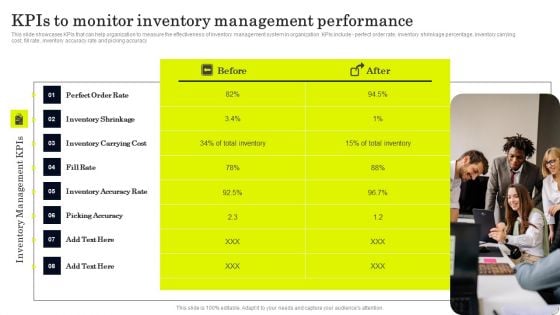
Strategies To Order And Manage Ideal Inventory Levels Kpis To Monitor Inventory Management Mockup PDF
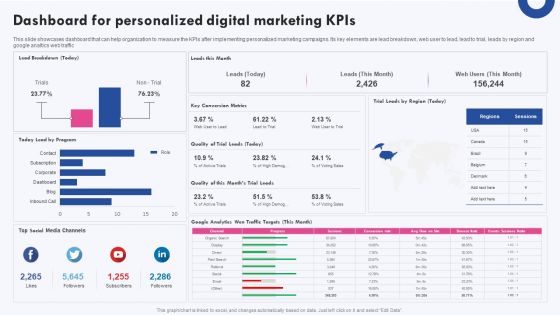
Targeted Marketing Campaigns To Improve Buyers Experience Dashboard For Personalized Digital Marketing Kpis Diagrams PDF
This slide showcases dashboard that can help organization to measure the KPIs after implementing personalized marketing campaigns. Its key elements are lead breakdown, web user to lead, lead to trial, leads by region and google analtics web traffic If you are looking for a format to display your unique thoughts, then the professionally designed Targeted Marketing Campaigns To Improve Buyers Experience Dashboard For Personalized Digital Marketing Kpis Diagrams PDF is the one for you. You can use it as a Google Slides template or a PowerPoint template. Incorporate impressive visuals, symbols, images, and other charts. Modify or reorganize the text boxes as you desire. Experiment with shade schemes and font pairings. Alter, share or cooperate with other people on your work. Download Targeted Marketing Campaigns To Improve Buyers Experience Dashboard For Personalized Digital Marketing Kpis Diagrams PDF and find out how to give a successful presentation. Present a perfect display to your team and make your presentation unforgettable.

3d Men Holding Gift Box Events PowerPoint Templates Ppt Backgrounds For Slides 1212
We present our 3d Men Holding Gift Box Events PowerPoint Templates PPT Backgrounds For Slides 1212.Present our People PowerPoint Templates because Our PowerPoint Templates and Slides will let your words and thoughts hit bullseye everytime. Download our Teamwork PowerPoint Templates because it helps you to reassure the faith of your workers and get them to back you all the way. You have thought it through and outlined a plan of action. Download and present our Festival PowerPoint Templates because you can Set out the goals and your plan of action for teamwork. Present our Holidays PowerPoint Templates because they will help you to organise the logic of your views. Download our Boxes PowerPoint Templates because it helps to churn the mixture to the right degree and pound home your views and expectations in a spectacularly grand and virtuoso fluid performance.Use these PowerPoint slides for presentations relating to Men giving gift to other, people, festival, holidays, boxes, shapes. The prominent colors used in the PowerPoint template are Red, Blue, Green. Professionals tell us our 3d Men Holding Gift Box Events PowerPoint Templates PPT Backgrounds For Slides 1212 are Energetic. Use our other PowerPoint templates and PPT Slides are Majestic. Presenters tell us our 3d Men Holding Gift Box Events PowerPoint Templates PPT Backgrounds For Slides 1212 are readymade to fit into any presentation structure. Professionals tell us our to PowerPoint templates and PPT Slides are Luxurious. Presenters tell us our 3d Men Holding Gift Box Events PowerPoint Templates PPT Backgrounds For Slides 1212 are visually appealing. The feedback we get is that our gift PowerPoint templates and PPT Slides are Perfect. Our 3d Men Holding Gift Box Events PowerPoint Templates Ppt Backgrounds For Slides 1212 are a complete customer delight. They deliver on every account.
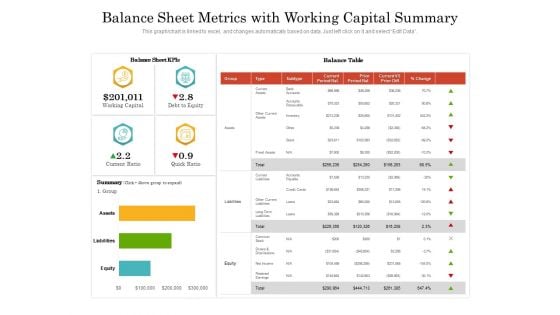
Balance Sheet Metrics With Working Capital Summary Ppt PowerPoint Presentation Inspiration Tips PDF
Presenting this set of slides with name balance sheet metrics with working capital summary ppt powerpoint presentation inspiration tips pdf. The topics discussed in these slides are balance sheet kpis, balance table, current ratio, quick ratio, working capital, debt to equity. This is a completely editable PowerPoint presentation and is available for immediate download. Download now and impress your audience.
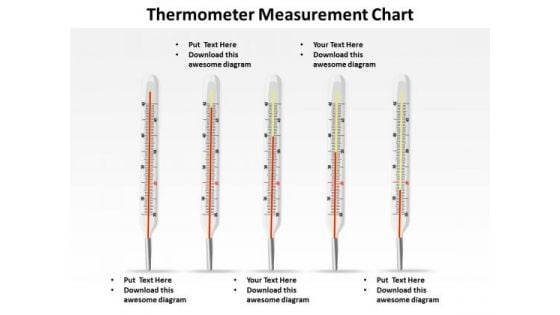
Sales Diagram Thermometer Measurement Chart Marketing Diagram
Your Grasp Of Economics Is Well Known. Help Your Audience Comprehend Issues With Our Sales Diagram Thermometer Measurement Chart Marketing Diagram Powerpoint Templates.
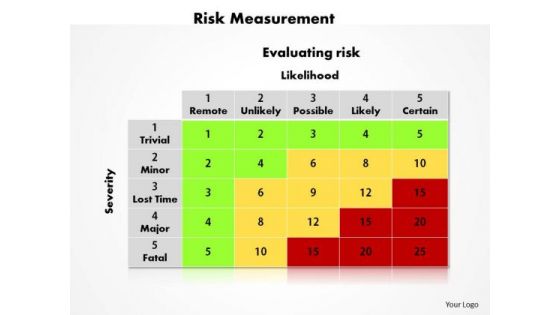
Business Diagram Risk Measurement PowerPoint Ppt Presentation
Put Them On The Same Page With Our Business Diagram Risk Measurement PowerPoint PPT Presentation PowerPoint Templates. Yours Team Will Sing From The Same Sheet.
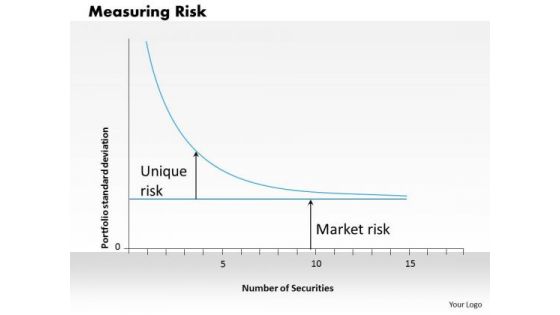
Business Framework Measuring Risk PowerPoint Presentation
This business framework has been crafted with graphic of graph with concept of measuring risk. Use this template for marketing and business related risk calculation.
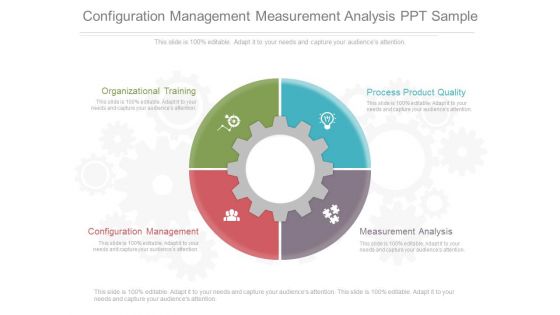
Configuration Management Measurement Analysis Ppt Sample
This is a configuration management measurement analysis ppt sample. This is a four stage process. The stages in this process are gear wheels, technology, business.
Measuring Customer Loyalty Example Of Ppt
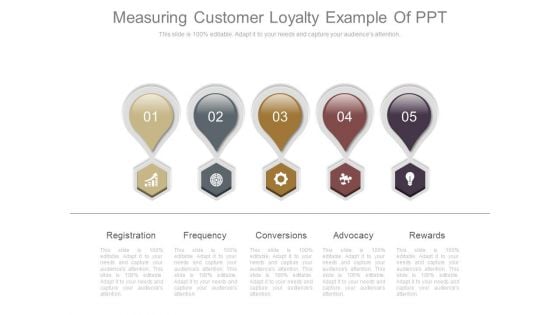
This is a measuring customer loyalty example of ppt. This is a five stage process. The stages in this process are registration, frequency, conversions, advocacy, rewards.
Measuring Customer Feedback Ppt Presentation Powerpoint
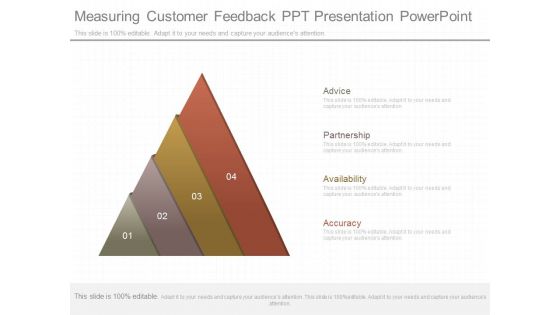
This is a measuring customer feedback ppt presentation powerpoint. This is a four stage process. The stages in this process are advice, partnership, availability, accuracy.
Integrated Measurement Systems Ppt Powerpoint Show
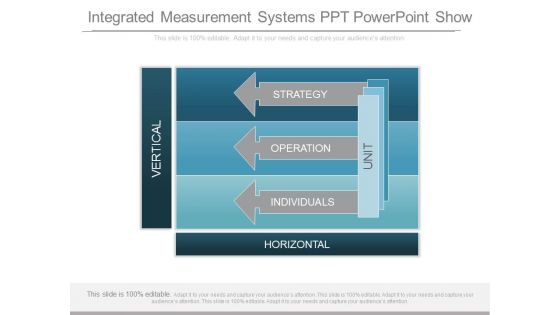
This is a integrated measurement systems ppt powerpoint show. This is a three stage process. The stages in this process are strategy, operation, individuals, horizontal, vertical, unit.
Measuring Sales Effectiveness Ppt Presentation Powerpoint
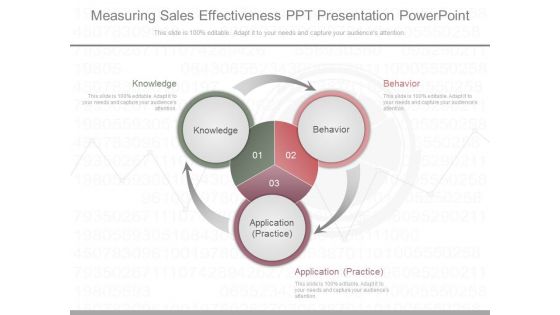
This is a measuring sales effectiveness ppt presentation powerpoint. This is a three stage process. The stages in this process are knowledge, behavior, application practice.
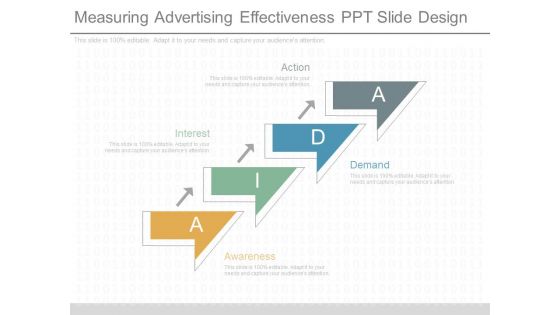
Measuring Advertising Effectiveness Ppt Slide Design
This is a measuring advertising effectiveness ppt slide design. This is a four stage process. The stages in this process are action, interest, demand, awareness.

Incremental Sales Kpi Measures Presentation Backgrounds
This is a incremental sales kpi measures presentation backgrounds. This is a four stage process. The stages in this process are marketing, promotion, sales revenue, social channels.
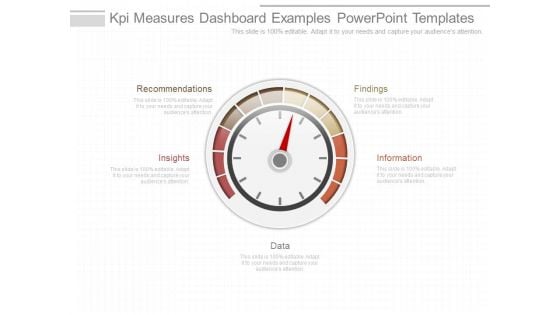
Kpi Measures Dashboard Examples Powerpoint Templates
This is a kpi measures dashboard examples powerpoint templates. This is a four stage process. The stages in this process are recommendations, insights, data, information, findings.
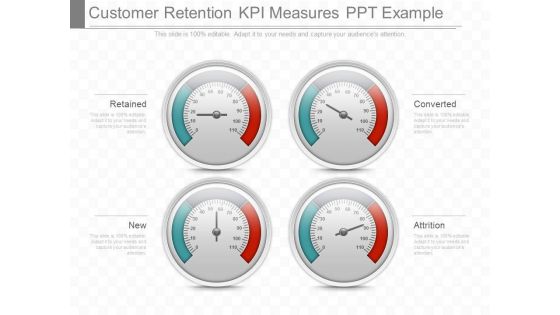
Customer Retention Kpi Measures Ppt Example
This is a customer retention kpi measures ppt example. This is a four stage process. The stages in this process are retained, new, converted, attrition.
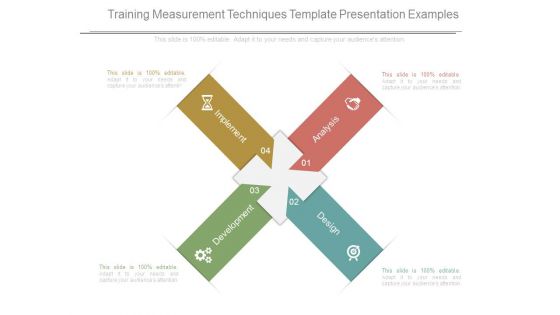
Training Measurement Techniques Template Presentation Examples
This is a training measurement techniques template presentation examples. This is a four stage process. The stages in this process are implement, analysis, development, design.
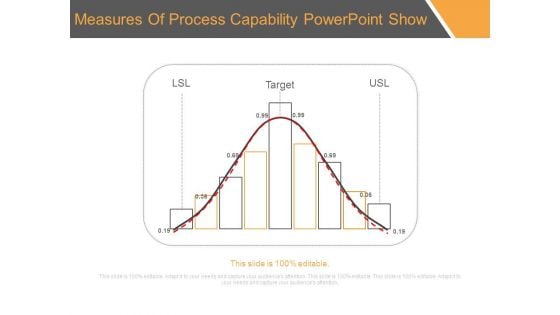
Measures Of Process Capability Powerpoint Show
This is a measures of process capability powerpoint show. This is a nine stage process. The stages in this process are lsl, target, usl.

Value Stream Mapping Measures Diagram Ppt Slides
This is a value stream mapping measures diagram ppt slides. This is a three stage process. The stages in this process are takt time, cycle time, lead time.
Measure Cost Per Acquisition Ppt Icon
This is a measure cost per acquisition ppt icon. This is a three stage process. The stages in this process are rising, steady, falling.
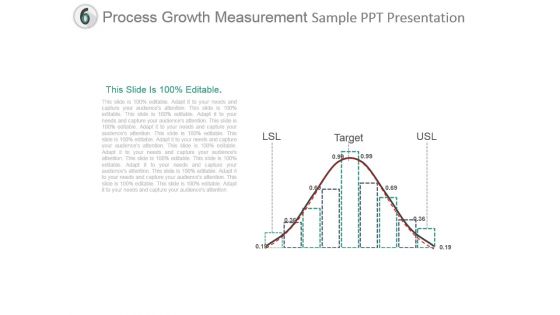
Process Growth Measurement Sample Ppt Presentation
This is a process growth measurement sample ppt presentation. This is a one stage process. The stages in this process are lsl, target, usl.
Measure Ppt PowerPoint Presentation Ideas Background Images
This is a measure ppt powerpoint presentation ideas background images. This is a five stage process. The stages in this process are strategy, process, business, marketing, analysis, icons.
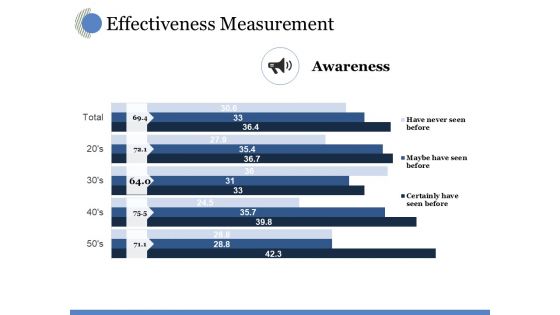
Effectiveness Measurement Ppt PowerPoint Presentation Inspiration Guide
This is a effectiveness measurement ppt powerpoint presentation inspiration guide. This is a five stage process. The stages in this process are awareness, business, marketing, strategy, finance.
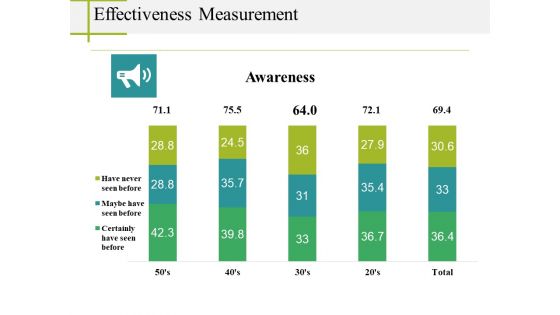
Effectiveness Measurement Ppt PowerPoint Presentation Styles Ideas
This is a effectiveness measurement ppt powerpoint presentation styles ideas. This is a five stage process. The stages in this process are awareness, business, marketing, finance, strategy.

Effectiveness Measurement Ppt PowerPoint Presentation Professional Slide
This is a effectiveness measurement ppt powerpoint presentation professional slide. This is a three stage process. The stages in this process are awareness, business, marketing, strategy, finance.
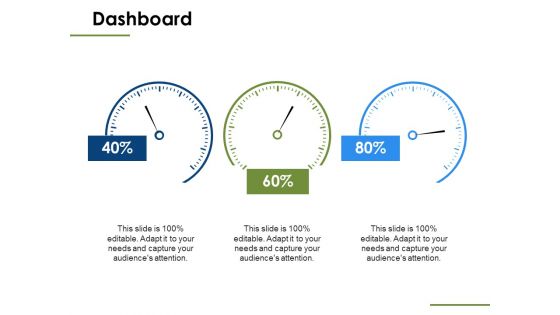
Dashboard Measure Ppt PowerPoint Presentation Ideas Samples
This is a dashboard measure ppt powerpoint presentation ideas samples. This is a three stage process. The stages in this process are dashboard, business, marketing, management, strategy.
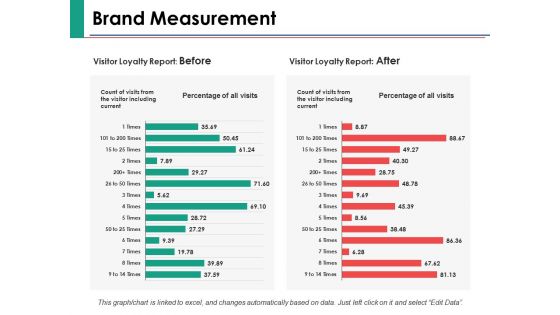
Brand Measurement Ppt PowerPoint Presentation Pictures Shapes
This is a brand measurement ppt powerpoint presentation pictures shapes. This is a two stage process. The stages in this process are finance, marketing, management, investment, analysis.
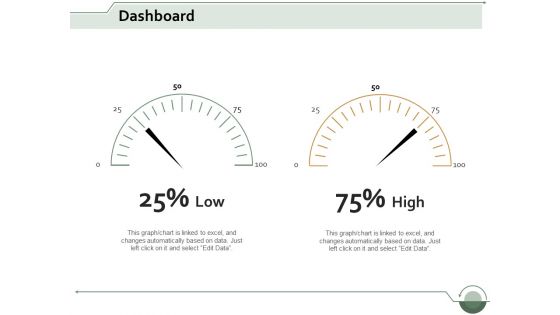
Dashboard Measure Ppt Powerpoint Presentation File Inspiration
This is a dashboard measure ppt powerpoint presentation file inspiration. This is a two stage process. The stages in this process are dashboard, business, marketing, management, planning.
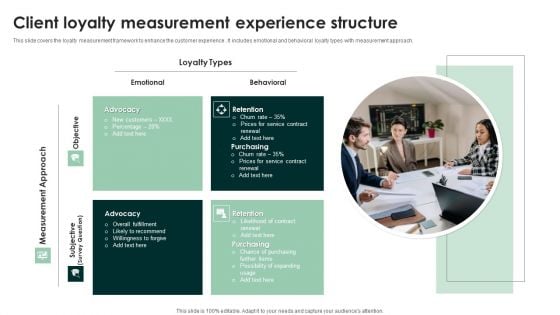
Client Loyalty Measurement Experience Structure Background PDF
This slide covers the loyalty measurement framework to enhance the customer experience . It includes emotional and behavioral loyalty types with measurement approach. Persuade your audience using this Client Loyalty Measurement Experience Structure Background PDF. This PPT design covers Four stages, thus making it a great tool to use. It also caters to a variety of topics including Client Loyalty Measurement, Experience Structure. Download this PPT design now to present a convincing pitch that not only emphasizes the topic but also showcases your presentation skills.
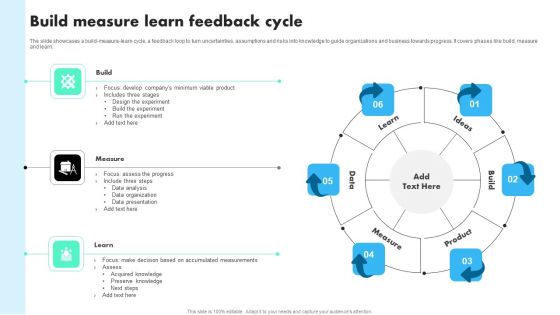
Build Measure Learn Feedback Cycle Template PDF
The slide showcases a build measure learn cycle, a feedback loop to turn uncertainties, assumptions and risks into knowledge to guide organizations and business towards progress. It covers phases like build, measure and learn. Presenting Build Measure Learn Feedback Cycle Template PDF to dispense important information. This template comprises six stages. It also presents valuable insights into the topics including Build, Measure, Learn. This is a completely customizable PowerPoint theme that can be put to use immediately. So, download it and address the topic impactfully.
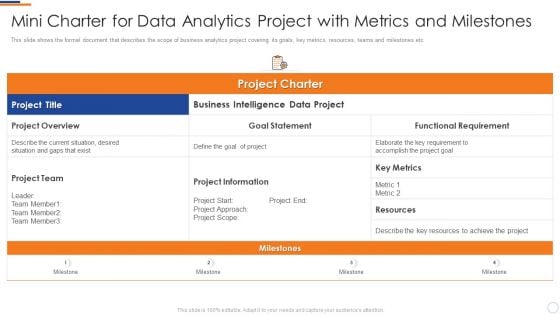
Business Intelligence And Mini Charter For Data Analytics Project With Metrics Professional PDF
This slide shows the formal document that describes the scope of business analytics project covering its goals, key metrics, resources, teams and milestones etc. Deliver an awe inspiring pitch with this creative business intelligence and mini charter for data analytics project with metrics professional pdf bundle. Topics like project overview, project team, project information, goal statement can be discussed with this completely editable template. It is available for immediate download depending on the needs and requirements of the user.
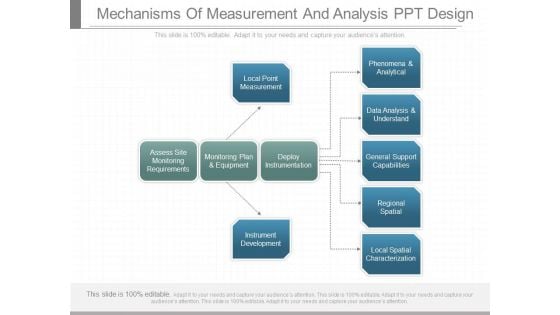
Mechanisms Of Measurement And Analysis Ppt Design
This is a mechanisms of measurement and analysis ppt design. This is a ten stage process. The stages in this process are phenomena and analytical, data analysis and understand, general support capabilities, regional spatial, local spatial characterization, local point measurement, assess site monitoring requirements, monitoring plan and equipment, deploy instrumentation, instrument development.


 Continue with Email

 Home
Home


