Product Performance
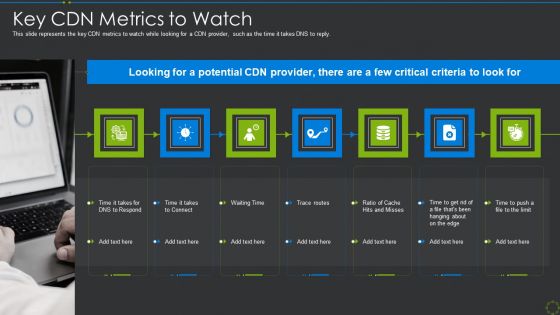
Key Cdn Metrics To Watch Ppt Inspiration Example PDF
This slide represents the key CDN metrics to watch while looking for a CDN provider, such as the time it takes DNS to reply. This is a key cdn metrics to watch ppt inspiration example pdf template with various stages. Focus and dispense information on seven stages using this creative set, that comes with editable features. It contains large content boxes to add your information on topics like key cdn metrics to watch. You can also showcase facts, figures, and other relevant content using this PPT layout. Grab it now.
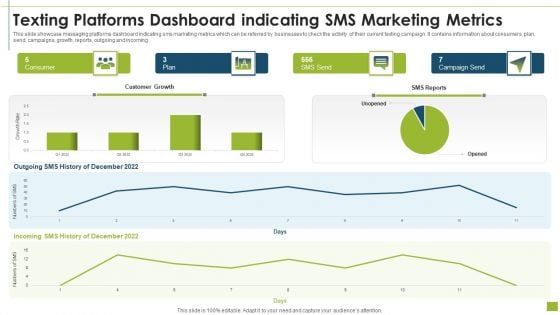
Texting Platforms Dashboard Indicating SMS Marketing Metrics Designs PDF
This slide showcase messaging platforms dashboard indicating sms marketing metrics which can be referred by businesses to check the activity of their current texting campaign. It contains information about consumers, plan, send, campaigns, growth, reports, outgoing and incoming.Pitch your topic with ease and precision using this texting platforms dashboard indicating sms marketing metrics designs pdf This layout presents information on texting platforms dashboard indicating sms marketing metrics It is also available for immediate download and adjustment. So, changes can be made in the color, design, graphics or any other component to create a unique layout.
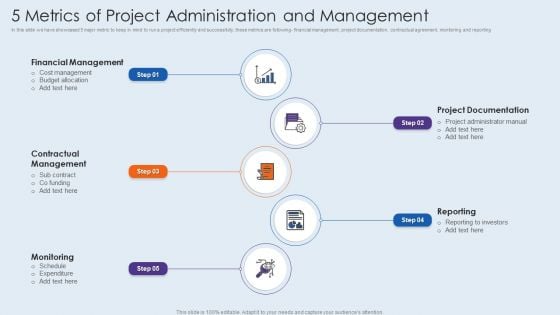
5 Metrics Of Project Administration And Management Structure PDF
In this slide we have showcased 5 major metric to keep in mind to run a project efficiently and successfully, these metrics are following financial management, project documentation, contractual agreement, monitoring and reporting. Persuade your audience using this 5 metrics of project administration and management structure pdf. This PPT design covers five stages, thus making it a great tool to use. It also caters to a variety of topics including financial management, contractual management, monitoring. Download this PPT design now to present a convincing pitch that not only emphasizes the topic but also showcases your presentation skills.

E Commerce Project Planning And Management Metrics Professional PDF
The following slide highlights the ecommerce project planning and management metrics illustrating two metrics which are project planning and project management, it depicts competitor analysis, website planning, payment gateway, website layout, align objectives, talent hiring, time frame, task distribution, testing and iteration. Showcasing this set of slides titled E Commerce Project Planning And Management Metrics Professional PDF. The topics addressed in these templates are Project Planning, Project Management, Social Media Marketing. All the content presented in this PPT design is completely editable. Download it and make adjustments in color, background, font etc. as per your unique business setting.

Employee Feedback Dashboard With Key Metrics Elements PDF
The following slide depicts the key insights of the feedback survey to gauge employee engagement at different department levels. It includes metrics such as engagement score, response rate, no. of comments etc.Showcasing this set of slides titled Employee Feedback Dashboard With Key Metrics Elements PDF The topics addressed in these templates are Employee Feedback Dashboard With Key Metrics All the content presented in this PPT design is completely editable. Download it and make adjustments in color, background, font etc. as per your unique business setting.
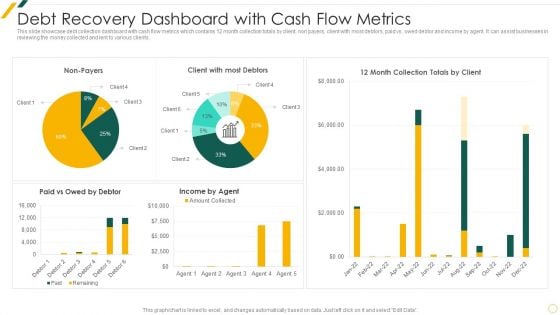
Debt Recovery Dashboard With Cash Flow Metrics Summary PDF
This slide showcase debt collection dashboard with cash flow metrics which contains 12 month collection totals by client, non payers, client with most debtors, paid vs. owed debtor and income by agent. It can assist businesses in reviewing the money collected and lent to various clients.Pitch your topic with ease and precision using this Debt Recovery Dashboard With Cash Flow Metrics Summary PDF This layout presents information on Debt Recovery, Dashboard Cash, Flow Metrics It is also available for immediate download and adjustment. So, changes can be made in the color, design, graphics or any other component to create a unique layout.
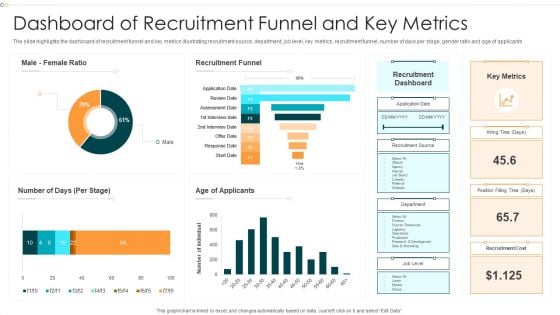
Dashboard Of Recruitment Funnel And Key Metrics Information PDF
The slide highlights the dashboard of recruitment funnel and key metrics illustrating recruitment source, department, job level, key metrics, recruitment funnel, number of days per stage, gender ratio and age of applicants.Pitch your topic with ease and precision using this Dashboard Of Recruitment Funnel And Key Metrics Information PDF This layout presents information on Recruitment Funnel, Recruitment Dashboard, Recruitment Cost It is also available for immediate download and adjustment. So, changes can be made in the color, design, graphics or any other component to create a unique layout.
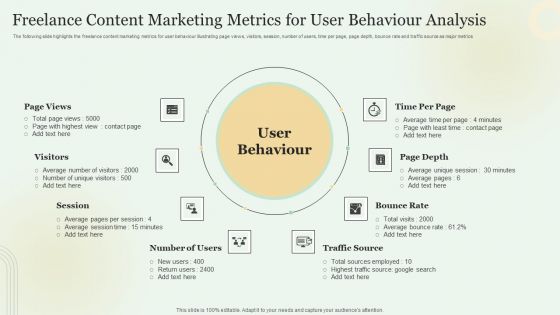
Freelance Content Marketing Metrics For User Behaviour Analysis Mockup PDF
The following slide highlights the freelance content marketing metrics for user behaviour illustrating page views, visitors, session, number of users, time per page, page depth, bounce rate and traffic source as major metrics. Persuade your audience using this Freelance Content Marketing Metrics For User Behaviour Analysis Mockup PDF. This PPT design covers eight stages, thus making it a great tool to use. It also caters to a variety of topics including Bounce Rate, Traffic Source, User Behaviour. Download this PPT design now to present a convincing pitch that not only emphasizes the topic but also showcases your presentation skills.
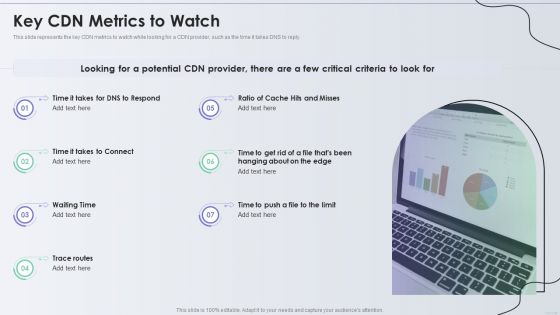
Distribution Network Key CDN Metrics To Watch Themes PDF
This slide represents the key CDN metrics to watch while looking for a CDN provider, such as the time it takes DNS to reply. Presenting Distribution Network Key CDN Metrics To Watch Themes PDF to provide visual cues and insights. Share and navigate important information on seven stages that need your due attention. This template can be used to pitch topics like Key Cdn Metrics, Potential. In addtion, this PPT design contains high resolution images, graphics, etc, that are easily editable and available for immediate download.
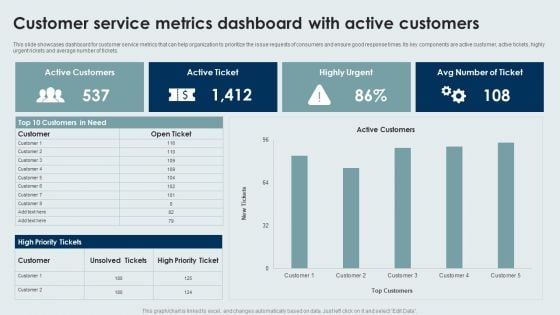
Customer Service Metrics Dashboard With Active Customers Ideas PDF
This slide showcases dashboard for customer service metrics that can help organization to prioritize the issue requests of consumers and ensure good response times. Its key components are active customer, active tickets, highly urgent rickets and average number of tickets. Showcasing this set of slides titled Customer Service Metrics Dashboard With Active Customers Ideas PDF. The topics addressed in these templates are Customer Service, Metrics Dashboard, Active Customers. All the content presented in this PPT design is completely editable. Download it and make adjustments in color, background, font etc. as per your unique business setting.
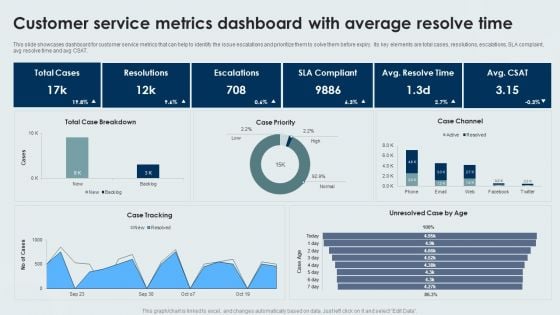
Customer Service Metrics Dashboard With Average Resolve Time Sample PDF
This slide showcases dashboard for customer service metrics that can help to identify the issue escalations and prioritize them to solve them before expiry. Its key elements are total cases, resolutions, escalations, SLA complaint, avg resolve time and avg CSAT. Showcasing this set of slides titled Customer Service Metrics Dashboard With Average Resolve Time Sample PDF. The topics addressed in these templates are Customer Service, Metrics Dashboard, Average Resolve Time. All the content presented in this PPT design is completely editable. Download it and make adjustments in color, background, font etc. as per your unique business setting.
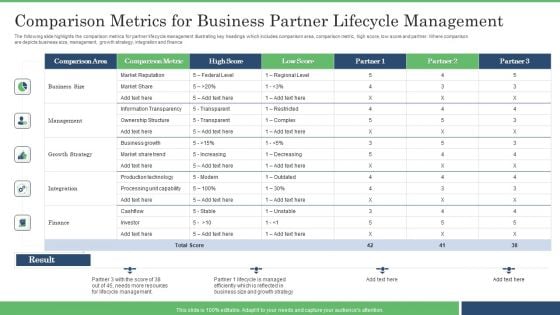
Comparison Metrics For Business Partner Lifecycle Management Guidelines PDF
The following slide highlights the comparison metrics for partner lifecycle management illustrating key headings which includes comparison area, comparison metric, high score, low score and partner. Where comparison are depicts business size, management, growth strategy, integration and finance. Pitch your topic with ease and precision using this Comparison Metrics For Business Partner Lifecycle Management Guidelines PDF. This layout presents information on Business Size, Management, Growth Strategy. It is also available for immediate download and adjustment. So, changes can be made in the color, design, graphics or any other component to create a unique layout.
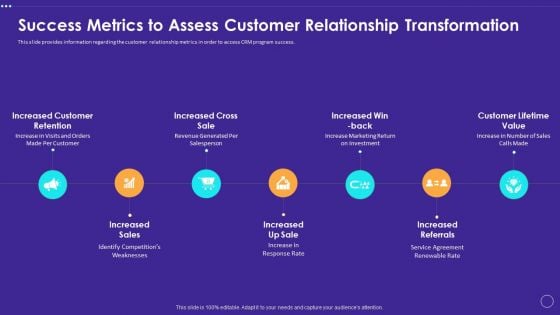
Success Metrics To Assess Customer Relationship Transformation Formats PDF
This slide provides information regarding the customer relationship metrics in order to access CRM program success. Get a simple yet stunning designed Success Metrics To Assess Customer Relationship Transformation Formats PDF. It is the best one to establish the tone in your meetings. It is an excellent way to make your presentations highly effective. So, download this PPT today from Slidegeeks and see the positive impacts. Our easy to edit Success Metrics To Assess Customer Relationship Transformation Formats PDF can be your go to option for all upcoming conferences and meetings. So, what are you waiting for Grab this template today.
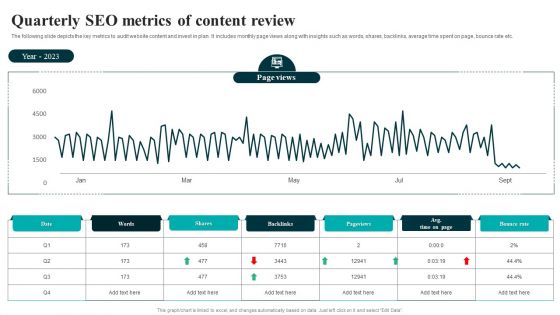
Quarterly SEO Metrics Of Content Review Structure PDF
The following slide depicts the key metrics to audit website content and invest in plan. It includes monthly page views along with insights such as words, shares, backlinks, average time spent on page, bounce rate etc. Pitch your topic with ease and precision using this Quarterly SEO Metrics Of Content Review Structure PDF. This layout presents information on Quarterly SEO, Metrics Of Content Review. It is also available for immediate download and adjustment. So, changes can be made in the color, design, graphics or any other component to create a unique layout.
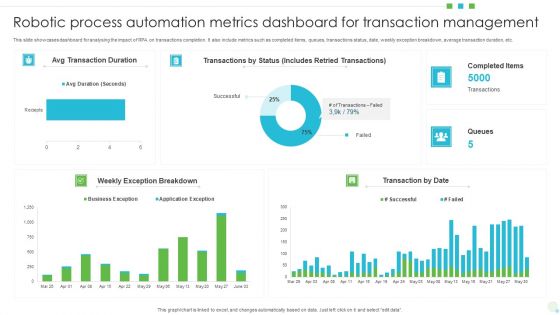
Robotic Process Automation Metrics Dashboard For Transaction Management Ideas PDF
This slide showcases dashboard for analysing the impact of RPA on transactions completion. It also include metrics such as completed items, queues, transactions status, date, weekly exception breakdown, average transaction duration, etc. Showcasing this set of slides titled Robotic Process Automation Metrics Dashboard For Transaction Management Ideas PDF. The topics addressed in these templates are Dashboard For Transaction Management, Robotic Process Automation Metrics. All the content presented in this PPT design is completely editable. Download it and make adjustments in color, background, font etc. as per your unique business setting.

Brand Positioning Through Successful Analyzing Key Marketing Metrics Portrait PDF
Presenting this PowerPoint presentation, titled Brand Positioning Through Successful Analyzing Key Marketing Metrics Portrait PDF, with topics curated by our researchers after extensive research. This editable presentation is available for immediate download and provides attractive features when used. Download now and captivate your audience. Presenting this Brand Positioning Through Successful Analyzing Key Marketing Metrics Portrait PDF. Our researchers have carefully researched and created these slides with all aspects taken into consideration. This is a completely customizable Brand Positioning Through Successful Analyzing Key Marketing Metrics Portrait PDF that is available for immediate downloading. Download now and make an impact on your audience. Highlight the attractive features available with our PPTs.
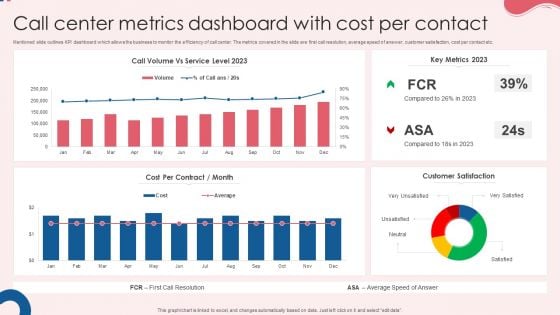
Call Center Metrics Dashboard With Cost Per Contact Rules PDF
Mentioned slide outlines KPI dashboard which allows the business to monitor the efficiency of call center. The metrics covered in the slide are first call resolution, average speed of answer, customer satisfaction, cost per contact etc. Pitch your topic with ease and precision using this Call Center Metrics Dashboard With Cost Per Contact Rules PDF. This layout presents information on Cost Per Contract, Key Metrics, Customer Satisfaction. It is also available for immediate download and adjustment. So, changes can be made in the color, design, graphics or any other component to create a unique layout.
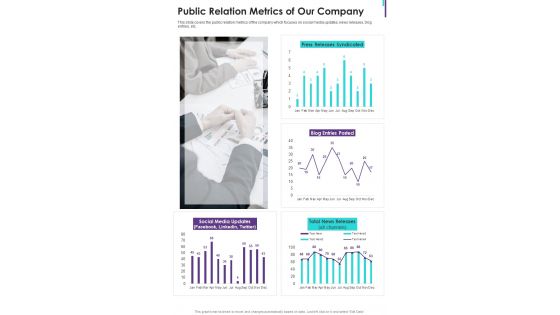
Public Relation Metrics Of Our Company One Pager Documents
This slide covers the public relation metrics of the company which focuses on social media updates, news releases, blog entries, etc. Presenting you a fantastic Public Relation Metrics Of Our Company One Pager Documents. This piece is crafted on hours of research and professional design efforts to ensure you have the best resource. It is completely editable and its design allow you to rehash its elements to suit your needs. Get this Public Relation Metrics Of Our Company One Pager Documents A4 One-pager now.
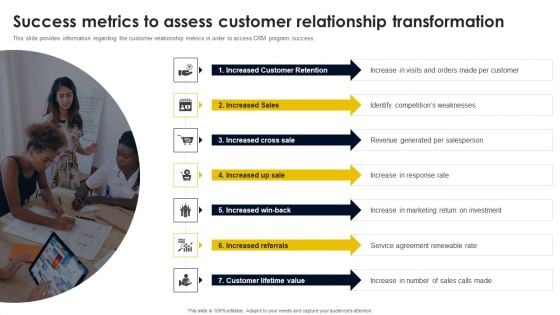
Success Metrics To Assess Customer Relationship Transformation Microsoft PDF
This slide provides information regarding the customer relationship metrics in order to access CRM program success. Crafting an eye-catching presentation has never been more straightforward. Let your presentation shine with this tasteful yet straightforward Success Metrics To Assess Customer Relationship Transformation Microsoft PDF template. It offers a minimalistic and classy look that is great for making a statement. The colors have been employed intelligently to add a bit of playfulness while still remaining professional. Construct the ideal Success Metrics To Assess Customer Relationship Transformation Microsoft PDF that effortlessly grabs the attention of your audience Begin now and be certain to wow your customers
HR Recruitment Dashboard Kpis With Recruitment Cost Ppt Inspiration Icons PDF
This slide showcases the recruitment dashboard of company of Hr department. It include time to hire days, cost, source, department, funnel no. of applications, male female ratio. Showcasing this set of slides titled HR Recruitment Dashboard Kpis With Recruitment Cost Ppt Inspiration Icons PDF. The topics addressed in these templates are Recruitment Funnel, Operational Dashboard, Application Date. All the content presented in this PPT design is completely editable. Download it and make adjustments in color, background, font etc. as per your unique business setting.
Effective Company Event Communication Plan Kpis For Tracking Event Communication Success Elements PDF
This slide covers checklist for planning event communication. It includes activities such as creating Facebook events, entering into community event calendar, planning event stories and timeline, creating poster, updating information on Facebook, etc. Presenting Effective Company Event Communication Plan Kpis For Tracking Event Communication Success Elements PDF to provide visual cues and insights. Share and navigate important information on five stages that need your due attention. This template can be used to pitch topics like Attendances, Social Media, Website Visits. In addtion, this PPT design contains high resolution images, graphics, etc, that are easily editable and available for immediate download.
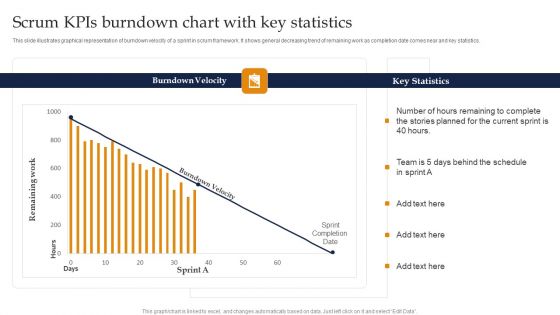
Scrum Kpis Burndown Chart With Key Statistics Ppt Pictures Visual Aids PDF
This slide illustrates graphical representation of burndown velocity of a sprint in scrum framework. It shows general decreasing trend of remaining work as completion date comes near and key statistics. Pitch your topic with ease and precision using this Scrum Kpis Burndown Chart With Key Statistics Ppt Pictures Visual Aids PDF. This layout presents information on Burndown Velocity, Key Statistics, Current Sprint. It is also available for immediate download and adjustment. So, changes can be made in the color, design, graphics or any other component to create a unique layout.

Kpis For Evaluating Business Sustainability Ppt PowerPoint Presentation Complete Deck With Slides
This complete deck covers various topics and highlights important concepts. It has PPT slides which cater to your business needs. This complete deck presentation emphasizes Kpis For Evaluating Business Sustainability Ppt PowerPoint Presentation Complete Deck With Slides and has templates with professional background images and relevant content. This deck consists of total of fourty five slides. Our designers have created customizable templates, keeping your convenience in mind. You can edit the colour, text and font size with ease. Not just this, you can also add or delete the content if needed. Get access to this fully editable complete presentation by clicking the download button below.
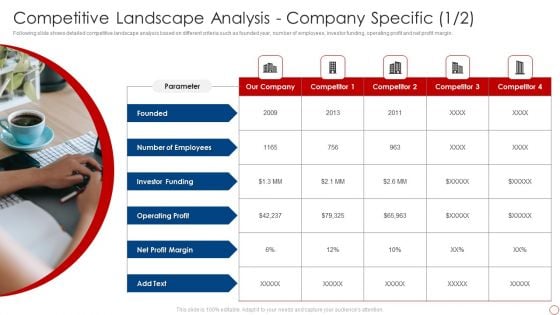
Kpis For Evaluating Business Sustainability Competitive Landscape Analysis Company Infographics PDF
Following slide shows detailed competitive landscape analysis based on different criteria such as founded year, number of employees, investor funding, operating profit and net profit margin. Presenting Kpis For Evaluating Business Sustainability Competitive Landscape Analysis Company Infographics PDF to provide visual cues and insights. Share and navigate important information on four stages that need your due attention. This template can be used to pitch topics like Number Employees, Investor Funding, Operating Profit, Net Profit Margin. In addtion, this PPT design contains high resolution images, graphics, etc, that are easily editable and available for immediate download.

Kpis For Evaluating Business Sustainability Global Presence Of The Company Designs PDF
Following slide shows the company presence at the global level. It also covers regional headquarters of the company located in various continents. This is a Kpis For Evaluating Business Sustainability Global Presence Of The Company Designs PDF template with various stages. Focus and dispense information on one stages using this creative set, that comes with editable features. It contains large content boxes to add your information on topics like Global, Presence Company. You can also showcase facts, figures, and other relevant content using this PPT layout. Grab it now.
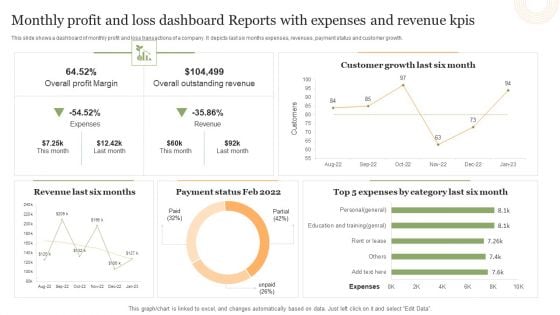
Monthly Profit And Loss Dashboard Reports With Expenses And Revenue Kpis Portrait PDF
This slide shows a dashboard of monthly profit and loss transactions of a company. It depicts last six months expenses, revenues, payment status and customer growth.Showcasing this set of slides titled Monthly Profit And Loss Dashboard Reports With Expenses And Revenue Kpis Portrait PDF. The topics addressed in these templates are Overall Profit Margin, Overall Outstanding Revenue, Customer Growth. All the content presented in this PPT design is completely editable. Download it and make adjustments in color, background, font etc. as per your unique business setting.
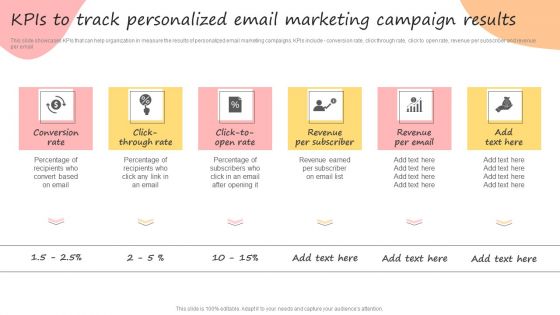
Developing Promotional Strategic Plan For Online Marketing Kpis To Track Personalized Email Marketing Infographics PDF
The Developing Promotional Strategic Plan For Online Marketing Kpis To Track Personalized Email Marketing Infographics PDF is a compilation of the most recent design trends as a series of slides. It is suitable for any subject or industry presentation, containing attractive visuals and photo spots for businesses to clearly express their messages. This template contains a variety of slides for the user to input data, such as structures to contrast two elements, bullet points, and slides for written information. Slidegeeks is prepared to create an impression.
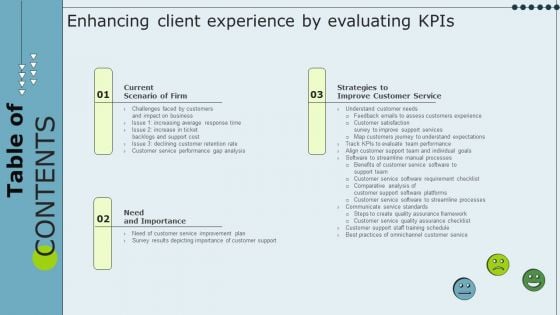
Table Of Contents Enhancing Client Experience By Evaluating Kpis Introduction PDF
Coming up with a presentation necessitates that the majority of the effort goes into the content and the message you intend to convey. The visuals of a PowerPoint presentation can only be effective if it supplements and supports the story that is being told. Keeping this in mind our experts created Table Of Contents Enhancing Client Experience By Evaluating Kpis Introduction PDF to reduce the time that goes into designing the presentation. This way, you can concentrate on the message while our designers take care of providing you with the right template for the situation.

Table Of Contnes Enhancing Client Experience By Evaluating Kpis Rules PDF
This modern and well-arranged Table Of Contnes Enhancing Client Experience By Evaluating Kpis Rules PDF provides lots of creative possibilities. It is very simple to customize and edit with the Powerpoint Software. Just drag and drop your pictures into the shapes. All facets of this template can be edited with Powerpoint, no extra software is necessary. Add your own material, put your images in the places assigned for them, adjust the colors, and then you can show your slides to the world, with an animated slide included.
Tracker For Time Based Quality Kpis In Project Management Ideas PDF
This slide displays project wise comparative analysis on the basis of planned and actual time it takes for completion. It includes details such as number of tasks and work completed, average number of hours, start and end dates, etc. Pitch your topic with ease and precision using this Tracker For Time Based Quality Kpis In Project Management Ideas PDF. This layout presents information on Time, Work Completed, Avg Number, Hours Per Task. It is also available for immediate download and adjustment. So, changes can be made in the color, design, graphics or any other component to create a unique layout.
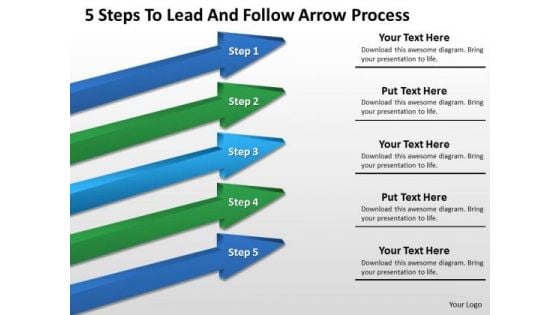
Example Of Parallel Processing Follow Arrow PowerPoint Templates Ppt Backgrounds For Slides
We present our example of parallel processing follow arrow PowerPoint templates PPT backgrounds for slides.Download and present our Arrows PowerPoint Templates because Our PowerPoint Templates and Slides will provide weight to your words. They will bring out the depth of your thought process. Download our Business PowerPoint Templates because You should Bet on your luck with our PowerPoint Templates and Slides. Be assured that you will hit the jackpot. Use our Leadership PowerPoint Templates because Our PowerPoint Templates and Slides will effectively help you save your valuable time. They are readymade to fit into any presentation structure. Download our Sales PowerPoint Templates because Our PowerPoint Templates and Slides will let your team Walk through your plans. See their energy levels rise as you show them the way. Use our Shapes PowerPoint Templates because You have the co-ordinates for your destination of success. Let our PowerPoint Templates and Slides map out your journey.Use these PowerPoint slides for presentations relating to business, chart, collaborate, colorful, colors, commerce, concept, data, development, direction, economic, forward, graph, graphics, growing, growth, illustration, improvement, interaction, lead, leadership, line, manage, management, networking, object, organization, organize, performance, race, relation, relationship, resources, results, sales, same, staff, team, together. The prominent colors used in the PowerPoint template are Blue navy, Green, Blue. People tell us our example of parallel processing follow arrow PowerPoint templates PPT backgrounds for slides are second to none. People tell us our concept PowerPoint templates and PPT Slides will make the presenter look like a pro even if they are not computer savvy. Presenters tell us our example of parallel processing follow arrow PowerPoint templates PPT backgrounds for slides will impress their bosses and teams. We assure you our development PowerPoint templates and PPT Slides are effectively colour coded to prioritise your plans They automatically highlight the sequence of events you desire. Presenters tell us our example of parallel processing follow arrow PowerPoint templates PPT backgrounds for slides provide you with a vast range of viable options. Select the appropriate ones and just fill in your text. Professionals tell us our commerce PowerPoint templates and PPT Slides will generate and maintain the level of interest you desire. They will create the impression you want to imprint on your audience. Test boundaries of presenting with our Example Of Parallel Processing Follow Arrow PowerPoint Templates Ppt Backgrounds For Slides. Download without worries with our money back guaranteee.
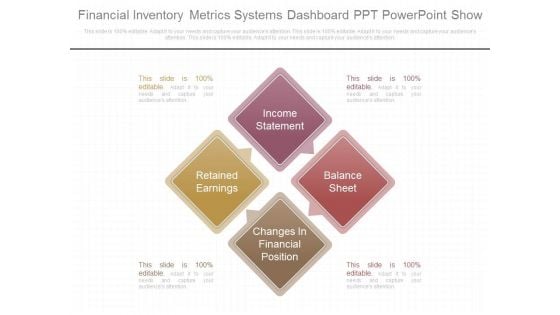
Financial Inventory Metrics Systems Dashboard Ppt Powerpoint Show
This is a financial inventory metrics systems dashboard ppt powerpoint show. This is a four stage process. The stages in this process are income statement, retained earnings, balance sheet, changes in financial position.
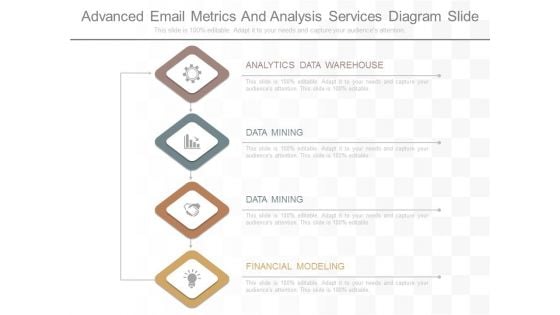
Advanced Email Metrics And Analysis Services Diagram Slide
This is a advanced email metrics and analysis services diagram slide. This is a four stage process. The stages in this process are analytics data warehouse, data mining, financial modeling.
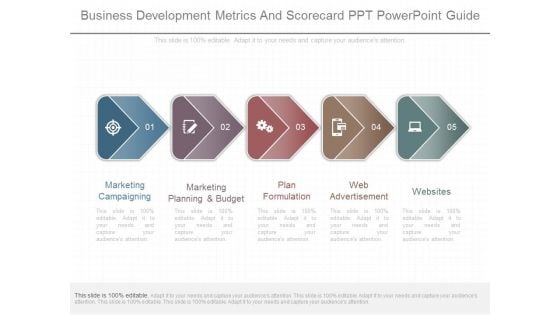
Business Development Metrics And Scorecard Ppt Powerpoint Guide
This is a business development metrics and scorecard ppt powerpoint guide. This is a five stage process. The stages in this process are marketing campaigning, marketing planning and budget, plan formulation, web advertisement, websites.
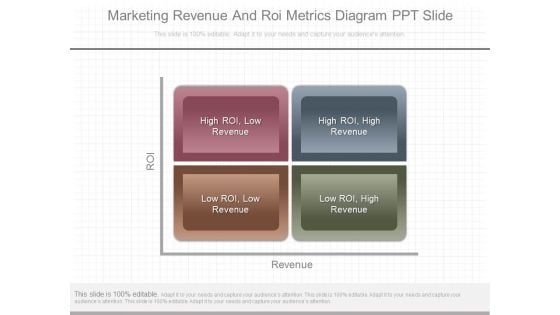
Marketing Revenue And Roi Metrics Diagram Ppt Slide
This is a marketing revenue and roi metrics diagram ppt slide. This is a four stage process. The stages in this process are high roi, low revenue, high roi, high revenue, low roi, low revenue, low roi, high revenue.
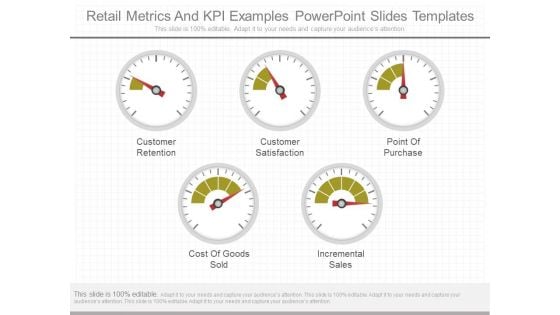
Retail Metrics And Kpi Examples Powerpoint Slides Templates
This is a retail metrics and kpi examples powerpoint slides templates. This is a five stage process. The stages in this process are customer retention, customer satisfaction, point of purchase, cost of goods sold, incremental sales.
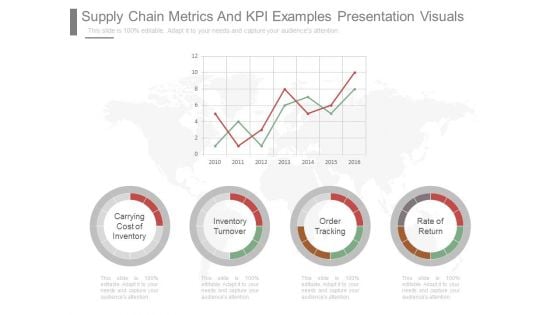
Supply Chain Metrics And Kpi Examples Presentation Visuals
This is a supply chain metrics and kpi examples presentation visuals. This is a four stage process. The stages in this process are carrying cost of inventory, inventory turnover, order tracking, rate of return.
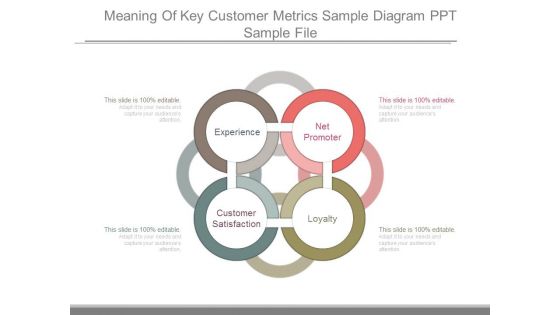
Meaning Of Key Customer Metrics Sample Diagram Ppt Sample File
This is a meaning of key customer metrics sample diagram ppt sample file. This is a four stage process. The stages in this process are net promoter, loyalty, customer satisfaction, experience.
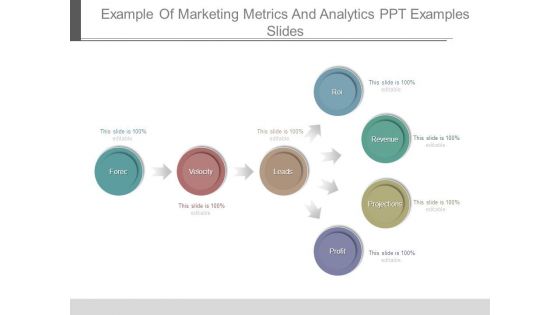
Example Of Marketing Metrics And Analytics Ppt Examples Slides
This is a example of marketing metrics and analytics ppt examples slides. This is a seven stage process. The stages in this process are forec, velocity, leads, roi, revenue, projections, profit.
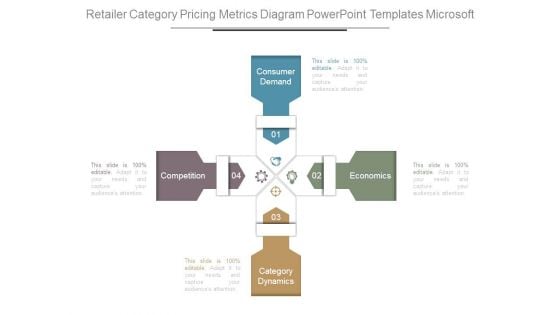
Retailer Category Pricing Metrics Diagram Powerpoint Templates Microsoft
This is a retailer category pricing metrics diagram powerpoint templates microsoft. This is a four stage process. The stages in this process are competition, consumer demand, economics, category dynamics.
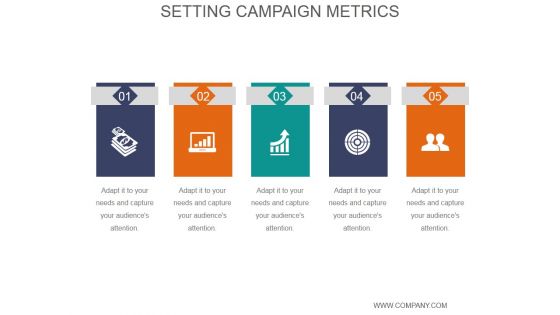
Setting Campaign Metrics Ppt PowerPoint Presentation Slide Download
This is a setting campaign metrics ppt powerpoint presentation slide download. This is a five stage process. The stages in this process are icons, process, strategy, business, marketing, management.
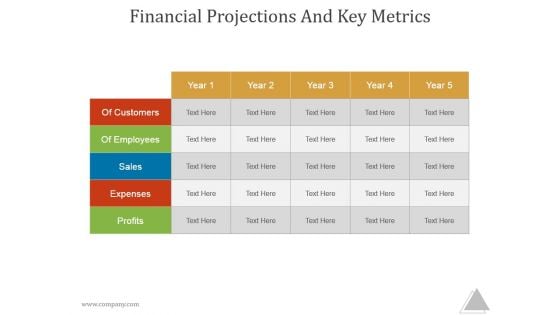
Financial Projections And Key Metrics Ppt PowerPoint Presentation Samples
This is a financial projections and key metrics ppt powerpoint presentation samples. This is a five stage process. The stages in this process are of customers, year, of employees, sales, expenses.
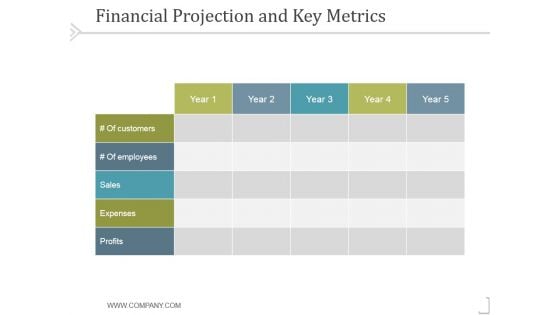
Financial Projection And Key Metrics Ppt PowerPoint Presentation Images
This is a financial projection and key metrics ppt powerpoint presentation images. This is a five stage process. The stages in this process are business, strategy, marketing, success, analysis, table.
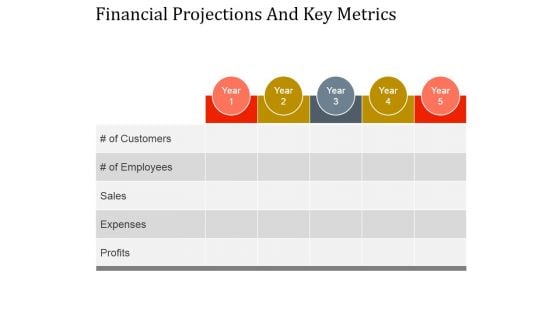
Financial Projections And Key Metrics Ppt PowerPoint Presentation Designs
This is a financial projections and key metrics ppt powerpoint presentation designs. This is a five stage process. The stages in this process are profits, expenses, sales, of employees, of customers.
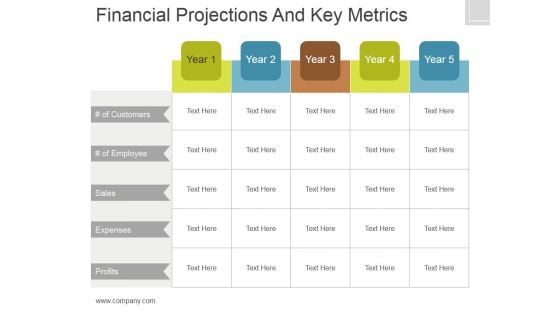
Financial Projections And Key Metrics Ppt PowerPoint Presentation Show
This is a financial projections and key metrics ppt powerpoint presentation show. This is a five stage process. The stages in this process are of customers, sales, expenses, profits.
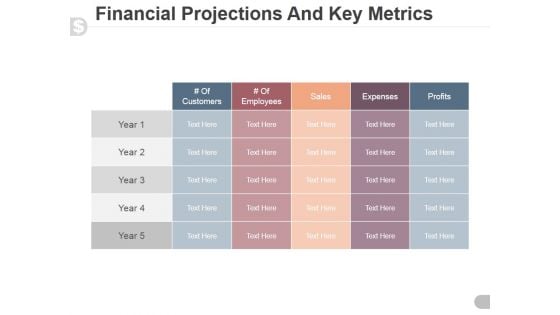
Financial Projections And Key Metrics Ppt PowerPoint Presentation Professional
This is a financial projections and key metrics ppt powerpoint presentation professional. This is a five stage process. The stages in this process are customers, employees, sales, expenses, profits.
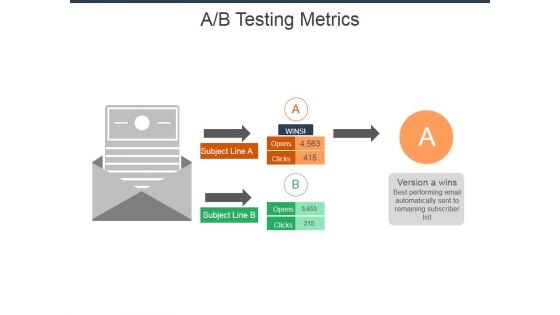
A B Testing Metrics Ppt Powerpoint Presentation Professional Format
This is a a b testing metrics ppt powerpoint presentation professional format. This is a four stage process. The stages in this process are subject line, opens, clicks, version a wins.

Financial Projections And Key Metrics Ppt PowerPoint Presentation Styles Skills
This is a financial projections and key metrics ppt powerpoint presentation styles skills. This is a five stage process. The stages in this process are expenses, profits, sales, employees, years.

Social Media Metrics Ppt PowerPoint Presentation Professional Graphic Images
This is a social media metrics ppt powerpoint presentation professional graphic images. This is a eight stage process. The stages in this process are fans count, google, followers, you tube subscribe, engagement rate.
Setting Campaign Metrics Ppt PowerPoint Presentation Slides File Formats
This is a setting campaign metrics ppt powerpoint presentation slides file formats. This is a five stage process. The stages in this process are business, marketing, management, icons, strategy.
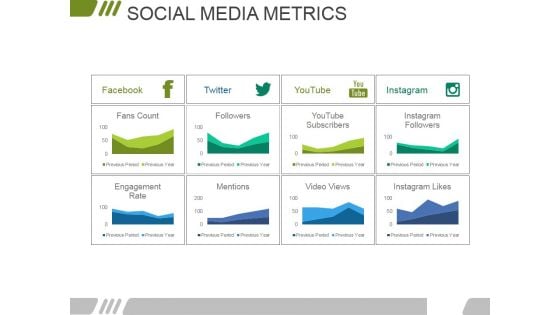
Social Media Metrics Ppt PowerPoint Presentation Infographics Gallery
This is a social media metrics ppt powerpoint presentation infographics gallery. This is a four stage process. The stages in this process are facebook, twitter, youtube, instagram, fans count.
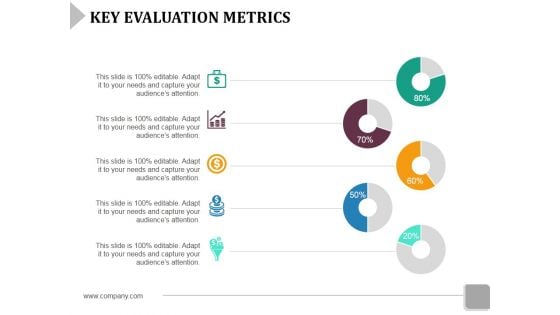
Key Evaluation Metrics Ppt PowerPoint Presentation File Design Ideas
This is a key evaluation metrics ppt powerpoint presentation file design ideas. This is a five stage process. The stages in this process are business, icons, strategy, marketing, finance.
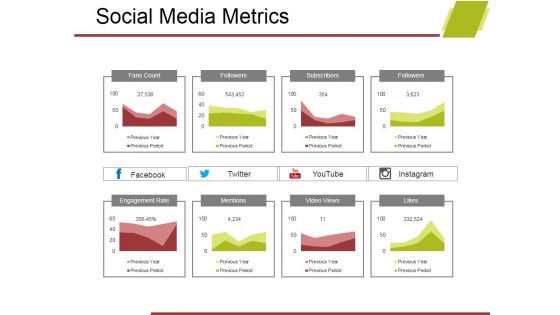
Social Media Metrics Ppt PowerPoint Presentation Styles Topics
This is a social media metrics ppt powerpoint presentation styles topics. This is a eight stage process. The stages in this process are fans count, followers, subscribers, engagement rate, mentions, video views, likes.
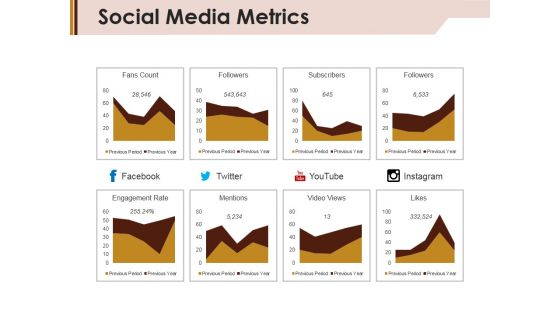
Social Media Metrics Ppt PowerPoint Presentation Ideas Graphics Example
This is a social media metrics ppt powerpoint presentation ideas graphics example. This is a eight stage process. The stages in this process are fans count, followers, subscribers, engagement rate.
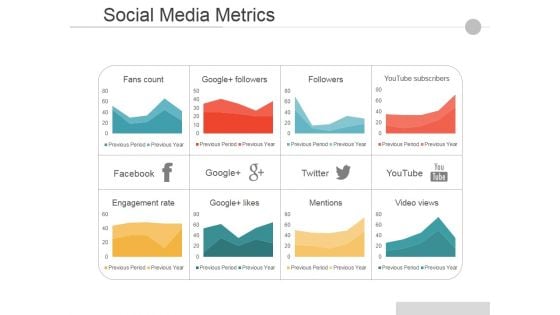
Social Media Metrics Ppt PowerPoint Presentation Gallery Background Images
This is a Social Media Metrics Ppt PowerPoint Presentation Gallery Background Images. This is a eight stage process. The stages in this process are Facebook, Google, Twitter, Youtube, Engagement Rate.
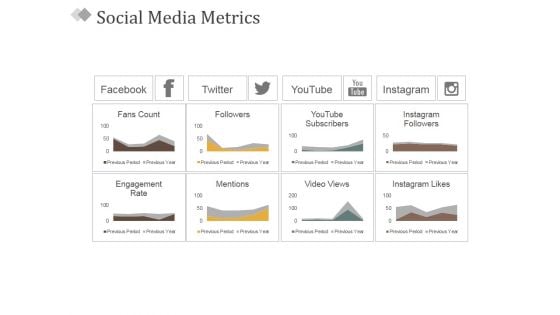
Social Media Metrics Ppt PowerPoint Presentation Infographic Template Graphics Example
This is a social media metrics ppt powerpoint presentation infographic template graphics example. This is a eight stage process. The stages in this process are facebook, twitter, youtube, fans count, instagram.
Key Evaluation Metrics Ppt PowerPoint Presentation Layouts Icons
This is a key evaluation metrics ppt powerpoint presentation layouts icons. This is a five stage process. The stages in this process are business, icons, marketing, strategy, finance, analysis.
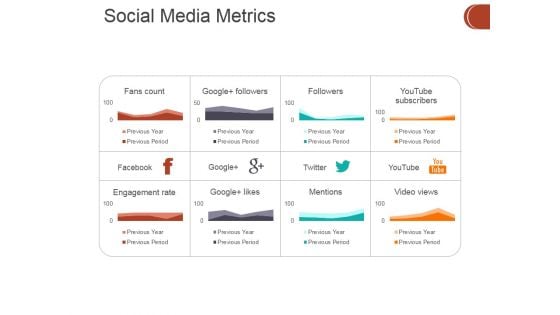
Social Media Metrics Ppt PowerPoint Presentation Portfolio Tips
This is a social media metrics ppt powerpoint presentation portfolio tips. This is a eight stage process. The stages in this process are business, finance, growth, strategy, analysis, investment.
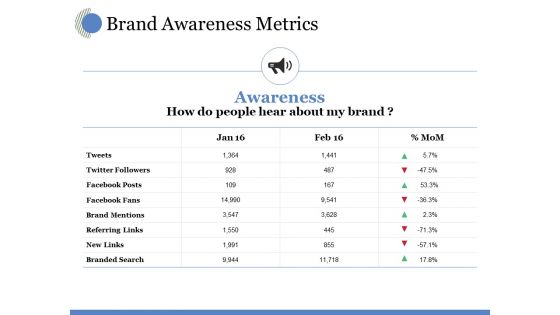
Brand Awareness Metrics Ppt PowerPoint Presentation File Formats
This is a brand awareness metrics ppt powerpoint presentation file formats. This is a four stage process. The stages in this process are twitter followers, facebook posts, facebook fans, brand mentions, new links.
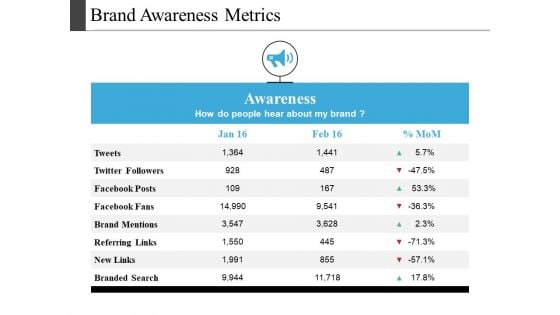
Brand Awareness Metrics Ppt PowerPoint Presentation Layouts Portfolio
This is a brand awareness metrics ppt powerpoint presentation layouts portfolio. This is a four stage process. The stages in this process are twitter followers, facebook posts, facebook fans, brand mentions, referring links.


 Continue with Email

 Home
Home


