Product Strategy Template
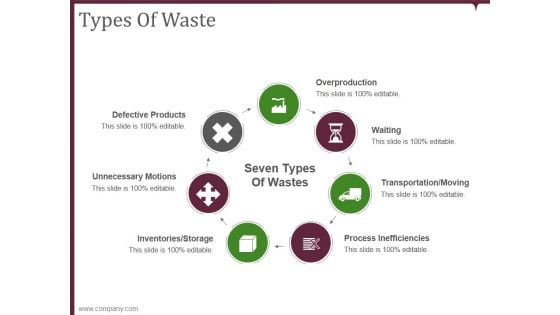
Types Of Waste Ppt PowerPoint Presentation Example
This is a types of waste ppt powerpoint presentation example. This is a seven stage process. The stages in this process are overproduction, waiting, transportation moving, process inefficiencies, defective products, unnecessary motions, inventories storage.
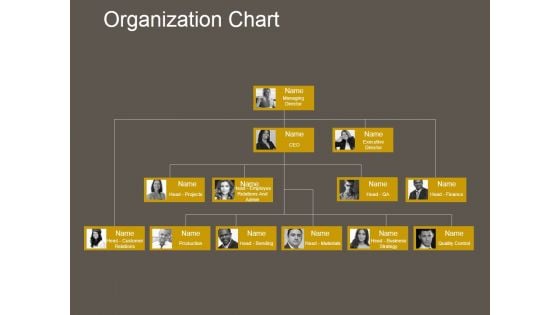
Organization Chart Ppt PowerPoint Presentation Layout
This is a organization chart ppt powerpoint presentation layout. This is a three stage process. The stages in this process are managing director, executive director, head projects, production, head customer relations, quality control.
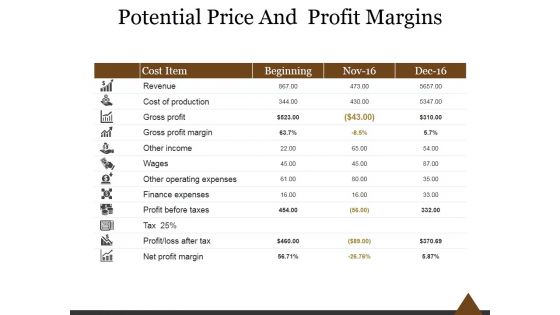
Potential Price And Profit Margins Ppt PowerPoint Presentation Infographics
This is a potential price and profit margins ppt powerpoint presentation infographics. This is a four stage process. The stages in this process are cost item, revenue, cost of production, gross profit, gross profit margin.
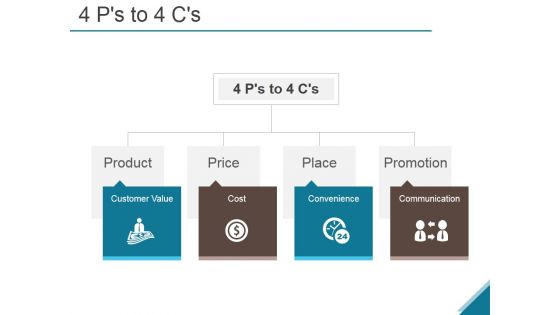
4 Ps To 4 Cs Ppt PowerPoint Presentation Rules
This is a 4 ps to 4 cs ppt powerpoint presentation rules. This is a four stage process. The stages in this process are customer value, cost, convenience, communication, product, price, place, promotion.
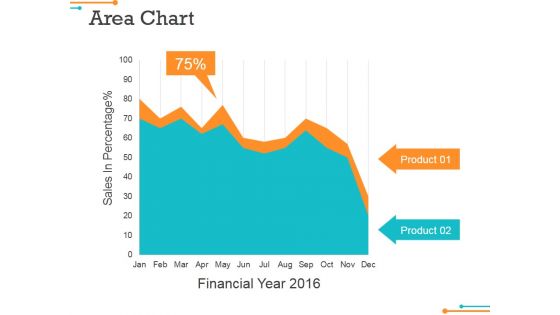
Area Chart Ppt Powerpoint Presentation File Show
This is a area chart ppt powerpoint presentation file show. This is a two stage process. The stages in this process are sales in percentage, financial year, product, financial, business.
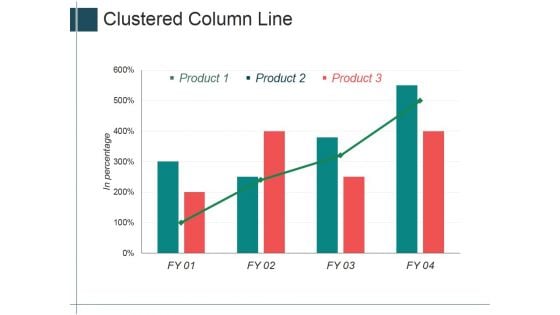
Clustered Column Line Ppt Powerpoint Presentation Ideas Inspiration
This is a clustered column line ppt powerpoint presentation ideas inspiration. This is a four stage process. The stages in this process are product, in percentage, graph, management, business.
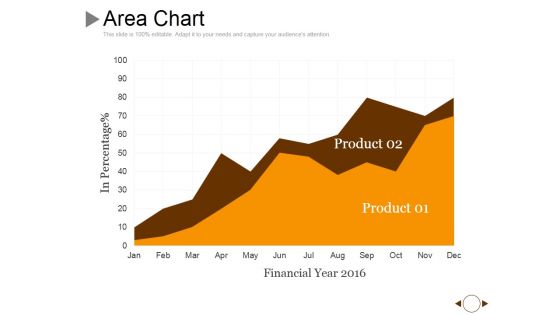
Area Chart Ppt PowerPoint Presentation Show Layout Ideas
This is a area chart ppt powerpoint presentation show layout ideas. This is a two stage process. The stages in this process are product, in percentage, financial year, growth.
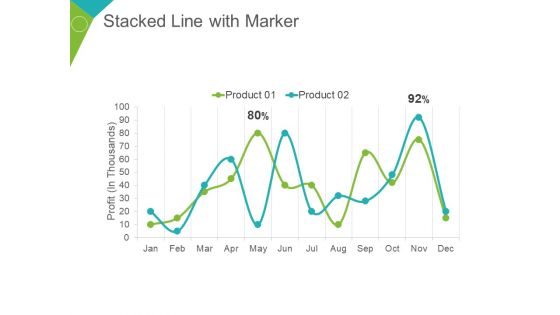
Stacked Line With Marker Ppt PowerPoint Presentation Summary Demonstration
This is a stacked line with marker ppt powerpoint presentation summary demonstration. This is a two stage process. The stages in this process are profit in thousands, product, percentage, finance, business.
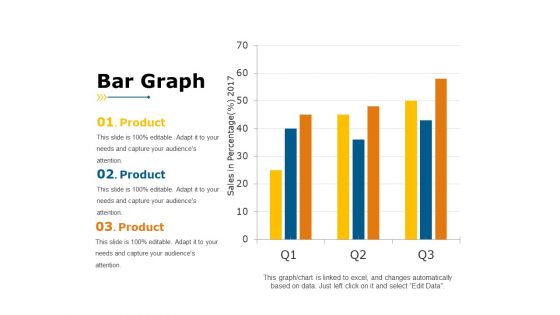
Bar Graph Ppt PowerPoint Presentation Portfolio Example
This is a bar graph ppt powerpoint presentation portfolio example. This is a three stage process. The stages in this process are sales in percentage, year, business, product, business, graph.
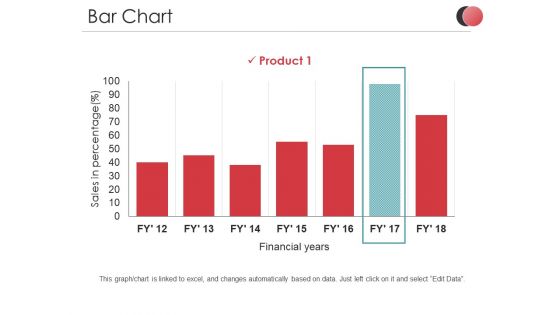
Bar Chart Ppt PowerPoint Presentation Outline Introduction
This is a bar chart ppt powerpoint presentation outline introduction. This is a one stage process. The stages in this process are sales in percentage, product, business, financial years, graph.
Area Chart Ppt PowerPoint Presentation Gallery Icons
This is a area chart ppt powerpoint presentation gallery icons. This is a two stage process. The stages in this process are financial year, sales in percentage, product, finance, graph.
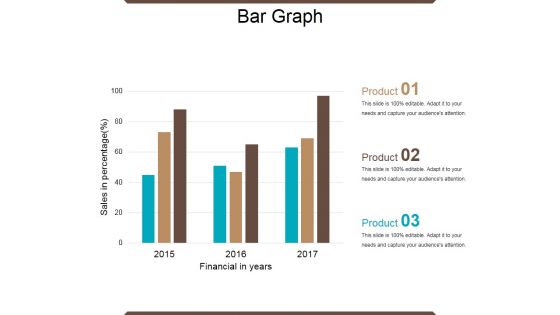
Bar Graph Ppt PowerPoint Presentation Ideas Graphic Tips
This is a bar graph ppt powerpoint presentation ideas graphic tips. This is a three stage process. The stages in this process are financial year, sales in percentage, product, bar graph, growth.
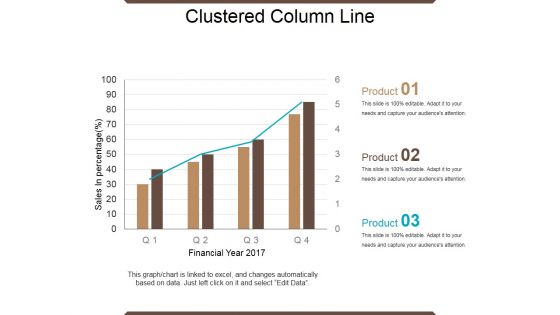
Clustered Column Line Ppt PowerPoint Presentation Show Influencers
This is a clustered column line ppt powerpoint presentation show influencers. This is a four stage process. The stages in this process are financial year, sales in percentage, product, growth, success.
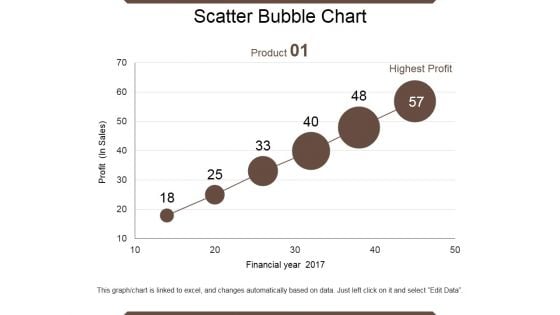
Scatter Bubble Chart Ppt PowerPoint Presentation Summary Files
This is a scatter bubble chart ppt powerpoint presentation summary files. This is a six stage process. The stages in this process are product, financial year, profit, highest profit.
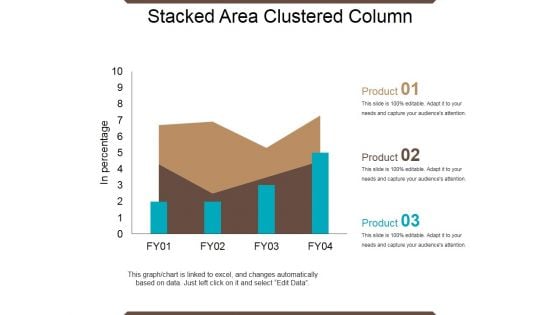
Stacked Area Clustered Column Ppt PowerPoint Presentation Show Guidelines
This is a stacked area clustered column ppt powerpoint presentation show guidelines. This is a four stage process. The stages in this process are in percentage, product, bar graph, growth, success.
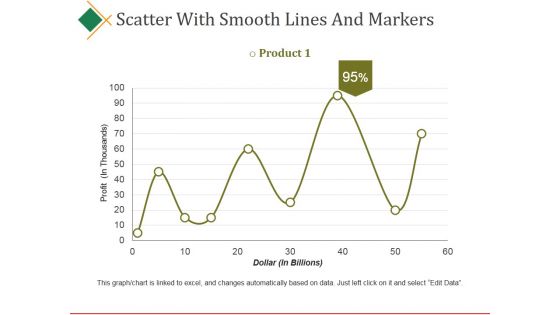
Scatter With Smooth Lines And Markers Ppt PowerPoint Presentation Visual Aids Ideas
This is a scatter with smooth lines and markers ppt powerpoint presentation visual aids ideas. This is a nine stage process. The stages in this process are product, profit, dollar, business, finance.
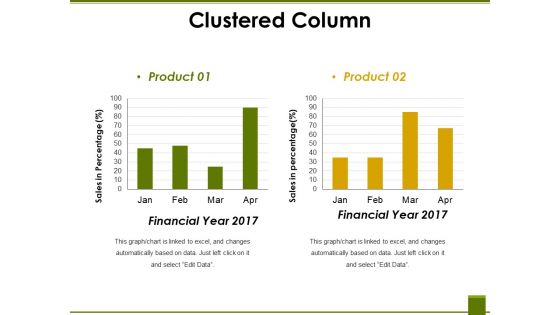
Clustered Column Ppt PowerPoint Presentation Ideas Graphic Tips
This is a clustered column ppt powerpoint presentation ideas graphic tips. This is a two stage process. The stages in this process are financial year, sales in percentage, product, graph, business.
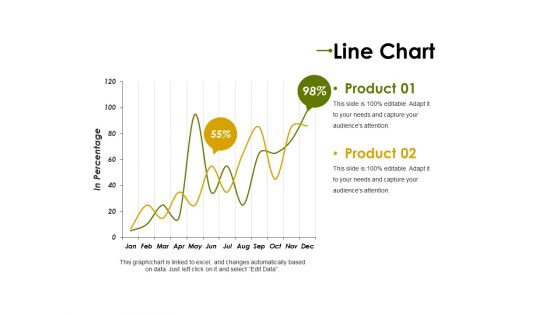
Line Chart Ppt PowerPoint Presentation Professional Clipart Images
This is a line chart ppt powerpoint presentation professional clipart images. This is a two stage process. The stages in this process are product, in percentage, graph, percentage, finance, business.
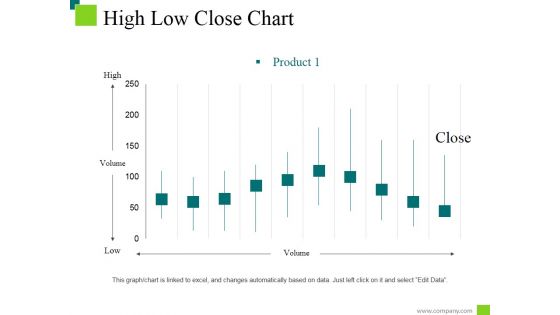
High Low Close Chart Ppt PowerPoint Presentation Styles Information
This is a high low close chart ppt powerpoint presentation styles information. This is a ten stage process. The stages in this process are low, high, product, volume, close.
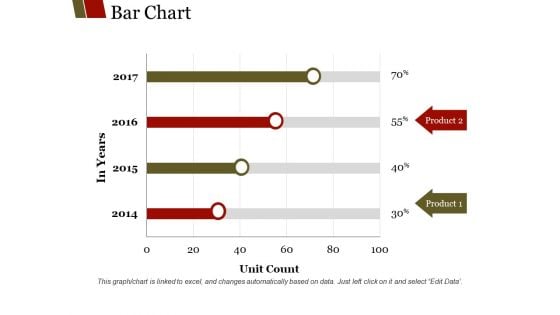
Bar Chart Ppt PowerPoint Presentation Outline Guidelines
This is a bar chart ppt powerpoint presentation outline guidelines. This is a four stage process. The stages in this process are product, unit count, in years, graph, finance, business.
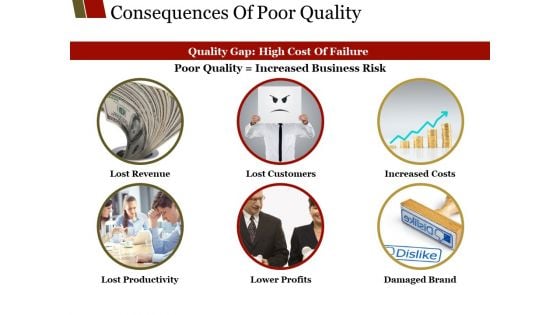
Consequences Of Poor Quality Ppt PowerPoint Presentation Portfolio Graphics Tutorials
This is a consequences of poor quality ppt powerpoint presentation portfolio graphics tutorials. This is a six stage process. The stages in this process are lost revenue, lost customers, increased costs, lower profits, lost productivity.
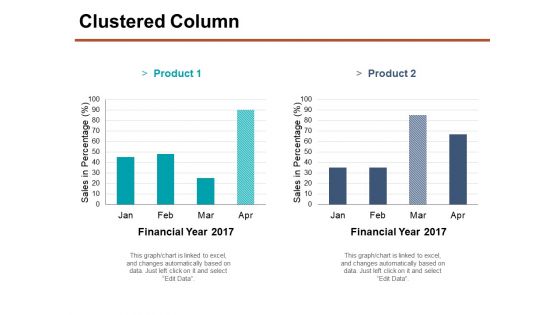
Clustered Column Ppt PowerPoint Presentation Portfolio Smartart
This is a clustered column ppt powerpoint presentation portfolio smartart. This is a two stage process. The stages in this process are financial year, product, sales in percentage, finance, business, graph.
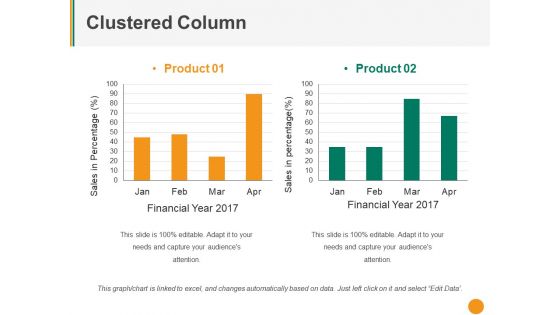
Clustered Column Ppt PowerPoint Presentation Pictures Mockup
This is a clustered column ppt powerpoint presentation pictures mockup. This is a two stage process. The stages in this process are product, sales in percentage, financial year, graph, business.
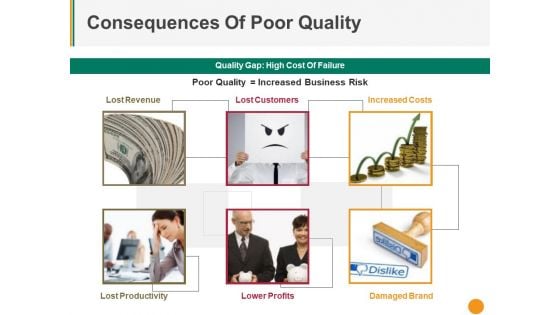
Consequences Of Poor Quality Ppt PowerPoint Presentation Gallery Layout Ideas
This is a consequences of poor quality ppt powerpoint presentation gallery layout ideas. This is a six stage process. The stages in this process are lost revenue, lost productivity, lower profits, lost customers, increased costs.
Open High Low Close Ppt PowerPoint Presentation Icon Model
This is a open high low close ppt powerpoint presentation icon model. This is a five stage process. The stages in this process are high, low, product, business, finance.
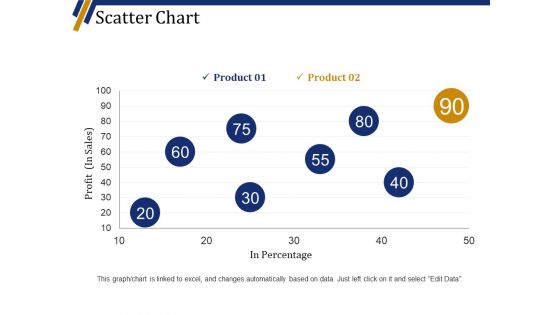
Scatter Chart Ppt PowerPoint Presentation Summary Visuals
This is a scatter chart ppt powerpoint presentation summary visuals. This is a eight stage process. The stages in this process are product, profit in sales, in percentage, finance, business.
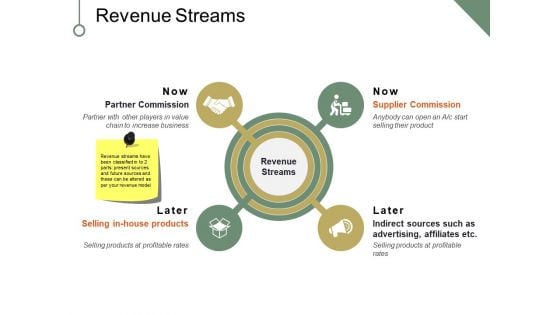
Revenue Streams Ppt PowerPoint Presentation Portfolio Maker
This is a revenue streams ppt powerpoint presentation portfolio maker. This is a four stage process. The stages in this process are partner commission, selling in house products, supplier commission, indirect sources such as advertising affiliates etc, business, icons.
Donut Pie Chart Ppt PowerPoint Presentation Icon Background Designs
This is a donut pie chart ppt powerpoint presentation icon background designs. This is a four stage process. The stages in this process are product, percentage, finance, donut, business.
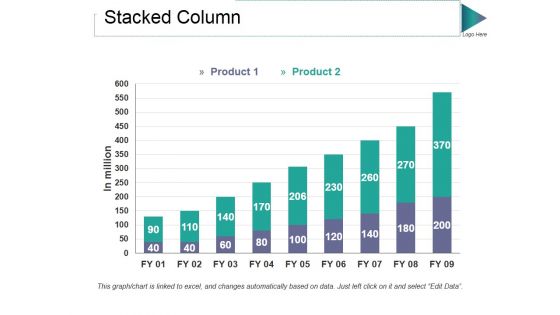
Stacked Column Ppt PowerPoint Presentation Styles Graphic Tips
This is a stacked column ppt powerpoint presentation styles graphic tips. This is a two stage process. The stages in this process are product, in million, bar graph, growth, success.
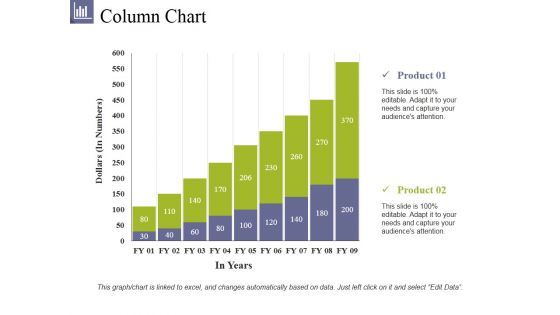
Column Chart Ppt PowerPoint Presentation File Summary
This is a column chart ppt powerpoint presentation file summary. This is a two stage process. The stages in this process are product, dollars, in years, bar graph, growth.
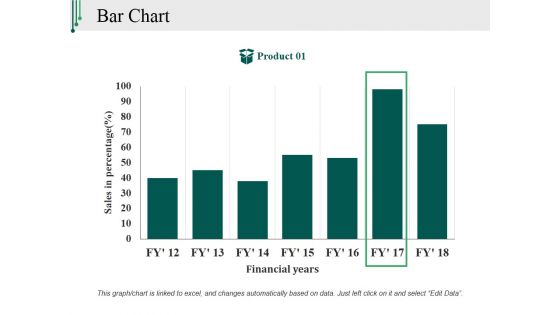
Bar Chart Ppt PowerPoint Presentation Outline Backgrounds
This is a bar chart ppt powerpoint presentation outline backgrounds. This is a one stage process. The stages in this process are sales in percentage, financial years, product, bar graph, finance.
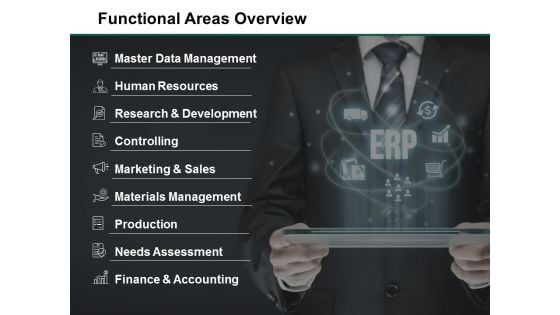
Functional Areas Overview Ppt PowerPoint Presentation Portfolio
This is a functional areas overview ppt powerpoint presentation portfolio. This is a nine stage process. The stages in this process are master data management, human resources, controlling, materials management, production.
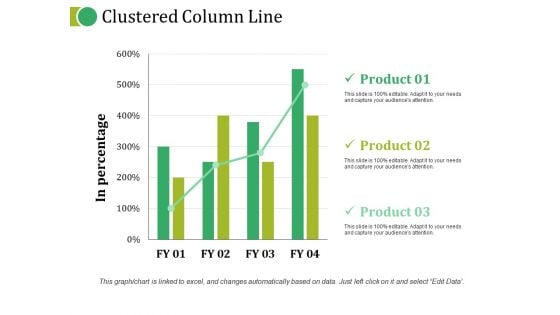
Clustered Column Line Ppt PowerPoint Presentation Topics
This is a clustered column line ppt powerpoint presentation topics. This is a three stage process. The stages in this process are product, in percentage, growth, bar graph, business.
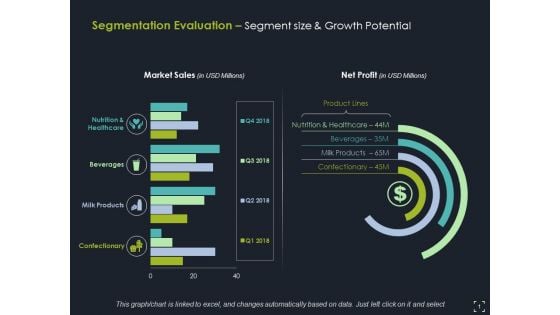
Segmentation Evaluation Segment Size And Growth Potential Ppt PowerPoint Presentation Pictures Microsoft
This is a segmentation evaluation segment size and growth potential ppt powerpoint presentation pictures microsoft. This is a four stage process. The stages in this process are nutrition and healthcare, beverages, milk products, confectionary.
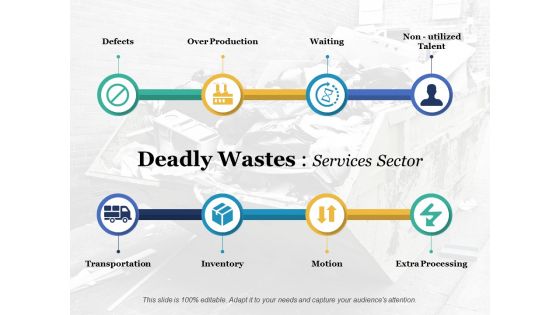
Deadly Wastes Services Sector Ppt PowerPoint Presentation Gallery Ideas
This is a deadly wastes services sector ppt powerpoint presentation gallery ideas. This is a eight stage process. The stages in this process are defects, over production, waiting, non utilized talent, transportation, inventory, motion, extra processing.
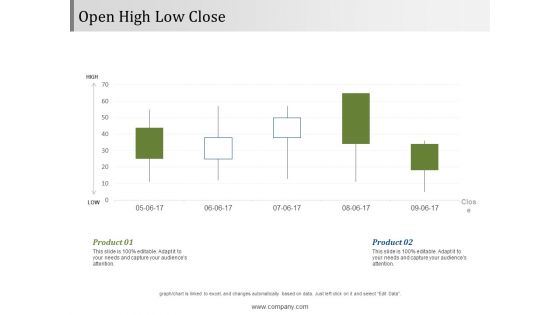
Open High Low Close Ppt PowerPoint Presentation Layouts Summary
This is a open high low close ppt powerpoint presentation layouts summary. This is a two stage process. The stages in this process are high, low, close, product, open.
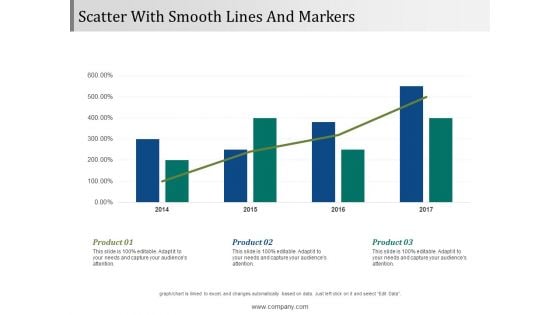
Scatter With Smooth Lines And Markers Ppt PowerPoint Presentation Pictures Deck
This is a scatter with smooth lines and markers ppt powerpoint presentation pictures deck. This is a three stage process. The stages in this process are product, finance, management, business, growth.
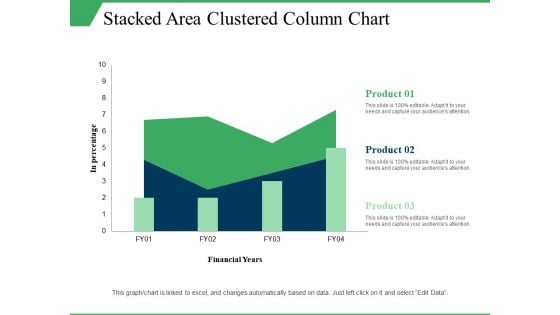
Stacked Area Clustered Column Chart Ppt PowerPoint Presentation Visual Aids Model
This is a stacked area clustered column chart ppt powerpoint presentation visual aids model. This is a three stage process. The stages in this process are in percentage, product, financial years, growth, column chart.
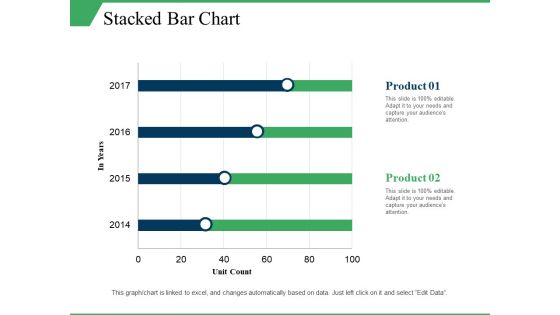
Stacked Bar Chart Ppt PowerPoint Presentation Infographics Elements
This is a stacked bar chart ppt powerpoint presentation infographics elements. This is a two stage process. The stages in this process are stacked bar chart, product, unit count, in year.
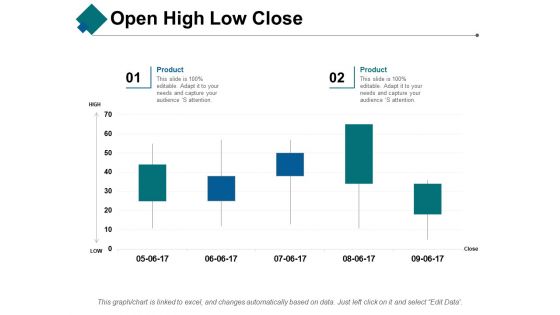
Open High Low Close Ppt PowerPoint Presentation Show Aids
This is a open high low close ppt powerpoint presentation show aids. This is a two stage process. The stages in this process are open, high, low, close, product.
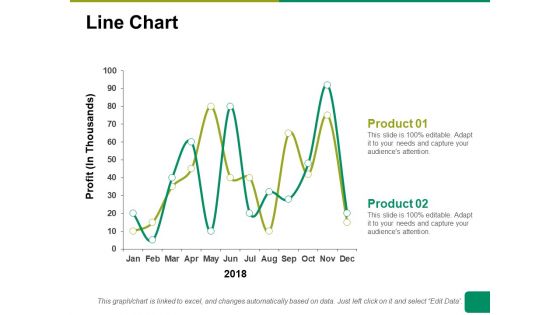
Line Chart Ppt PowerPoint Presentation Summary Ideas
This is a line chart ppt powerpoint presentation summary ideas. This is a two stage process. The stages in this process are line chart, profit, product, financial years, business.
Area Chart Ppt PowerPoint Presentation Inspiration Icons Ppt PowerPoint Presentation Professional File Formats
This is a area chart ppt powerpoint presentation inspiration icons ppt powerpoint presentation professional file formats. This is a two stage process. The stages in this process are area chart, product, percentage, business, growth.
Column Chart Ppt PowerPoint Presentation Icon Show
This is a column chart ppt powerpoint presentation icon show. This is a two stage process. The stages in this process are column chart, product, years, bar graph, growth.
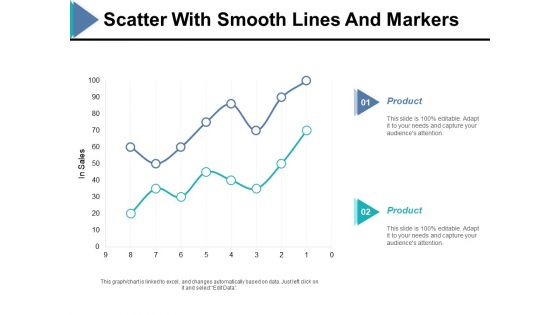
Scatter With Smooth Lines And Markers Ppt PowerPoint Presentation Ideas Example
This is a scatter with smooth lines and markers ppt powerpoint presentation ideas example. This is a two stage process. The stages in this process are in sales, finance, bar graph, product, business.
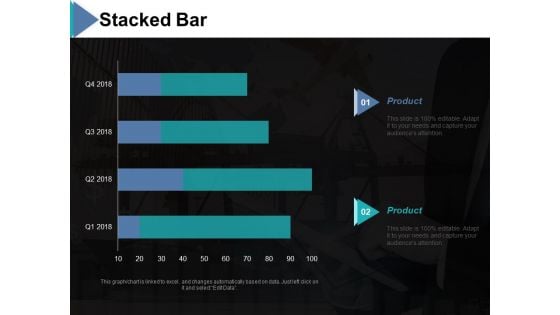
Stacked Bar Ppt PowerPoint Presentation Model Graphics
This is a stacked bar ppt powerpoint presentation model graphics. This is a two stage process. The stages in this process are stacked bar, product, chart and graph, finance, business.
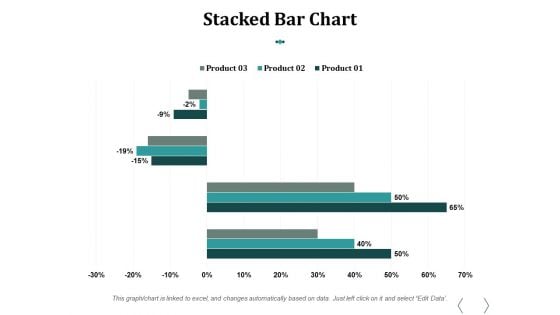
Stacked Bar Chart Ppt PowerPoint Presentation Influencers
This is a stacked bar chart ppt powerpoint presentation influencers. This is a three stage process. The stages in this process are stacked bar chart, product, percentage, finance, business.
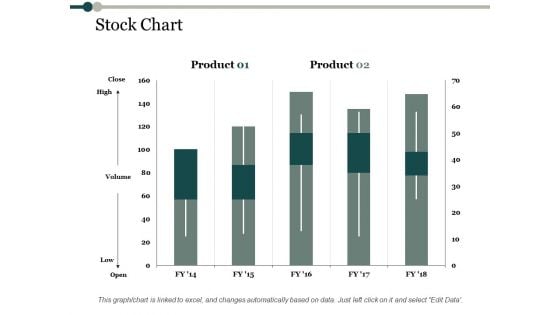
Stock Chart Process Analysis Ppt PowerPoint Presentation Professional Information
This is a stock chart process analysis ppt powerpoint presentation professional information. This is a two stage process. The stages in this process are stock chart, product, high, volume, low.
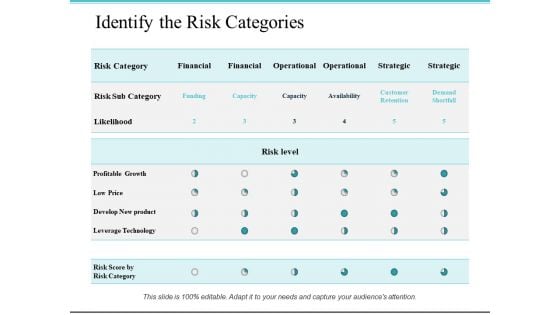
Identify The Risk Categories Ppt PowerPoint Presentation Styles Objects
This is a identify the risk categories ppt powerpoint presentation styles objects. This is a seven stage process. The stages in this process are leverage technology, develop new product, profitable growth.

Ask To Prepare Self Assessment Ppt PowerPoint Presentation File Good
This is a ask to prepare self assessment ppt powerpoint presentation file good. This is a five stage process. The stages in this process are productivity, attendance, initiative, outstanding, quality of work.
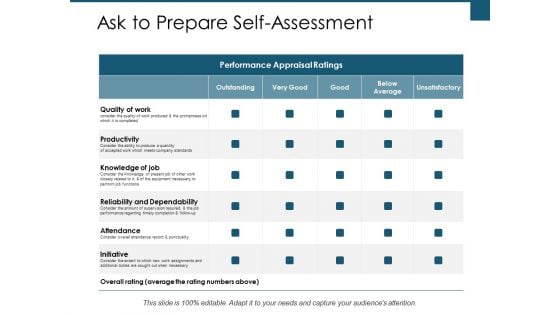
Ask To Prepare Self Assessment Ppt PowerPoint Presentation Portfolio Graphics Download
This is a ask to prepare self assessment ppt powerpoint presentation portfolio graphics download. This is a five stage process. The stages in this process are productivity, attendance, initiative, outstanding, quality of work.
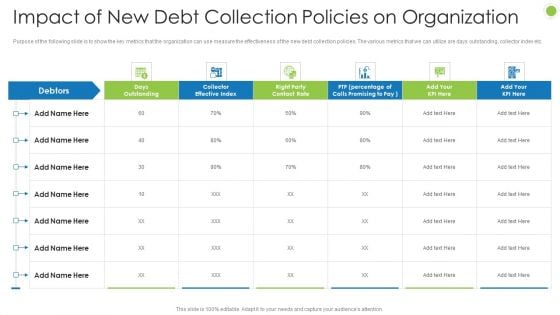
Debt Retrieval Techniques Impact Of New Debt Collection Policies On Organization Ppt File Slideshow PDF
Purpose of the following slide is to show the key metrics that the organization can use measure the effectiveness of the new debt collection policies. The various metrics that we can utilize are days outstanding, collector index etc. Deliver an awe inspiring pitch with this creative debt retrieval techniques impact of new debt collection policies on organization ppt file slideshow pdf bundle. Topics like impact of new debt collection policies on organization can be discussed with this completely editable template. It is available for immediate download depending on the needs and requirements of the user.

Current Competitive Landscape Of Consultancy Firm Ppt Outline Infographics PDF
This slide shows current competitive landscape of consultancy company with various factors includes global presence, sustainability with respect to the competitors. Deliver an awe-inspiring pitch with this creative current competitive landscape of consultancy firm ppt outline infographics pdf bundle. Topics like current competitive landscape of consultancy firm can be discussed with this completely editable template. It is available for immediate download depending on the needs and requirements of the user.
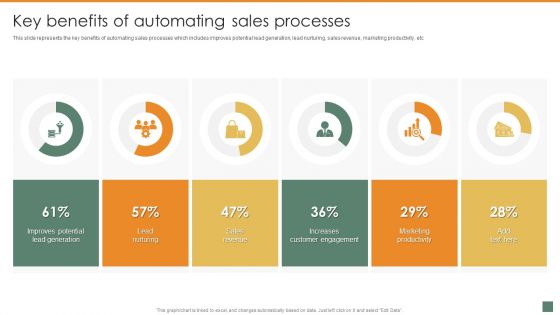
Key Benefits Of Automating Sales Processes Summary And Significance Of Sales Automation Diagrams PDF
This slide represents the key benefits of automating sales processes which includes improves potential lead generation, lead nurturing, sales revenue, marketing productivity, etc. Formulating a presentation can take up a lot of effort and time, so the content and message should always be the primary focus. The visuals of the PowerPoint can enhance the presenters message, so our Key Benefits Of Automating Sales Processes Summary And Significance Of Sales Automation Diagrams PDF was created to help save time. Instead of worrying about the design, the presenter can concentrate on the message while our designers work on creating the ideal templates for whatever situation is needed. Slidegeeks has experts for everything from amazing designs to valuable content, we have put everything into Key Benefits Of Automating Sales Processes Summary And Significance Of Sales Automation Diagrams PDF
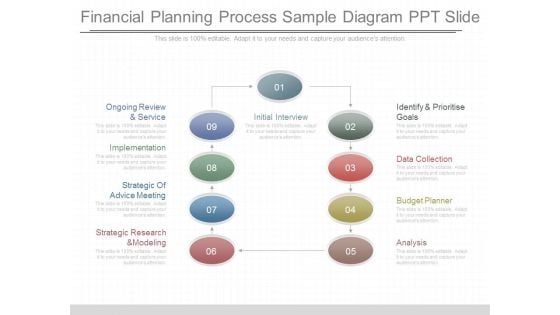
Financial Planning Process Sample Diagram Ppt Slide
This is a financial planning process sample diagram ppt slide. This is a nine stage process. The stages in this process are initial interview, identify and prioritise goals, data collection, budget planner, analysis, strategic research and modeling, strategic of advice meeting, implementation, ongoing review and service.
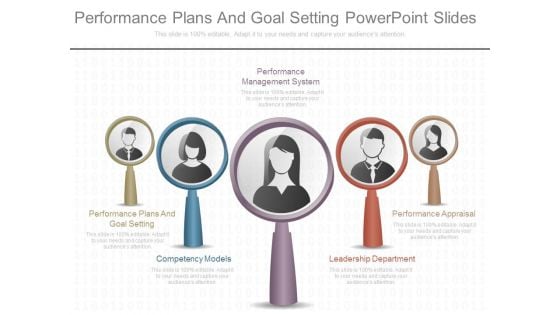
Performance Plans And Goal Setting Powerpoint Slides
This is a performance plans and goal setting powerpoint slides. This is a five stage process. The stages in this process are performance management system, performance plans and goal setting, competency models, performance appraisal, leadership department.
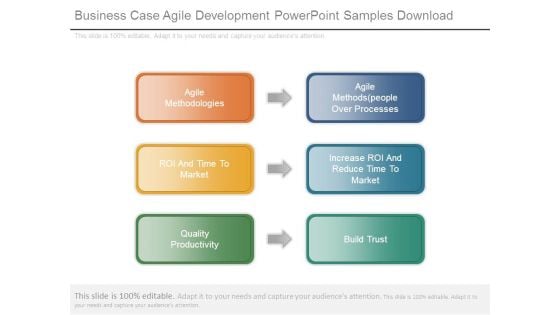
Business Case Agile Development Powerpoint Samples Download
This is a business case agile development powerpoint samples download. This is a six stage process. The stages in this process are agile methodologies, agile methods people over processes, increase roi and reduce time to market, build trust, quality productivity, roi and time to market.
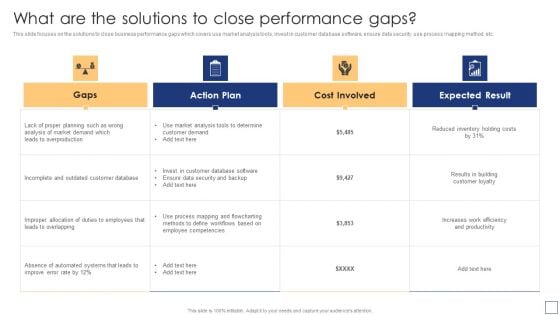
Business Process Redesigning What Are The Solutions To Close Performance Gaps Sample PDF
This slide focuses on the solutions to close business performance gaps which covers use market analysis tools, invest in customer database software, ensure data security, use process mapping method, etc. The best PPT templates are a great way to save time, energy, and resources. Slidegeeks have 100 percent editable powerpoint slides making them incredibly versatile. With these quality presentation templates, you can create a captivating and memorable presentation by combining visually appealing slides and effectively communicating your message. Download Business Process Redesigning What Are The Solutions To Close Performance Gaps Sample PDF from Slidegeeks and deliver a wonderful presentation.
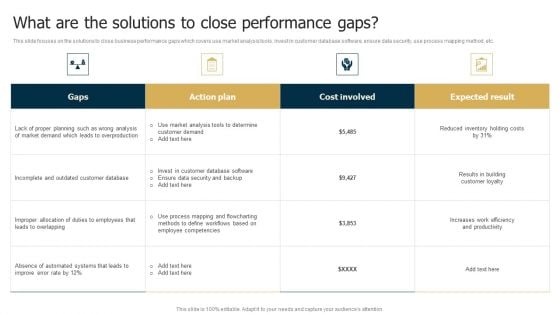
Business Restructuring Process What Are The Solutions To Close Performance Gaps Mockup PDF
This slide focuses on the solutions to close business performance gaps which covers use market analysis tools, invest in customer database software, ensure data security, use process mapping method, etc. The best PPT templates are a great way to save time, energy, and resources. Slidegeeks have 100 percent editable powerpoint slides making them incredibly versatile. With these quality presentation templates, you can create a captivating and memorable presentation by combining visually appealing slides and effectively communicating your message. Download Business Restructuring Process What Are The Solutions To Close Performance Gaps Mockup PDF from Slidegeeks and deliver a wonderful presentation.
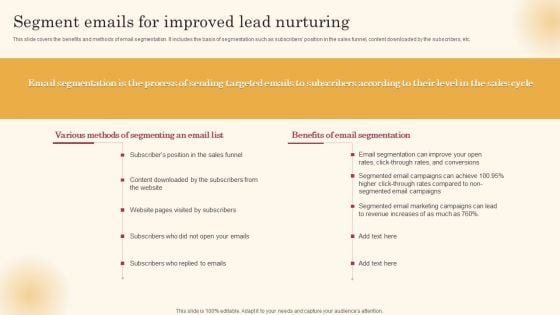
Segment Emails For Improved Lead Nurturing Improving Lead Generation Process Introduction PDF
This slide covers the benefits and methods of email segmentation. It includes the basis of segmentation such as subscribers position in the sales funnel, content downloaded by the subscribers, etc. The best PPT templates are a great way to save time, energy, and resources. Slidegeeks have 100 percent editable powerpoint slides making them incredibly versatile. With these quality presentation templates, you can create a captivating and memorable presentation by combining visually appealing slides and effectively communicating your message. Download Segment Emails For Improved Lead Nurturing Improving Lead Generation Process Introduction PDF from Slidegeeks and deliver a wonderful presentation.
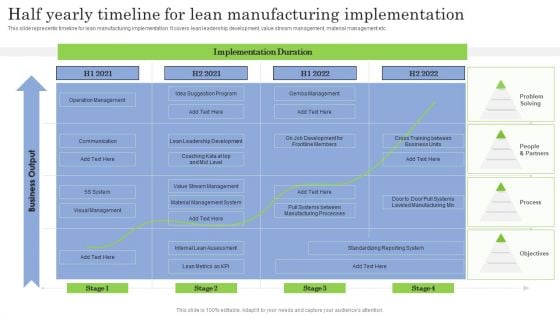
Half Yearly Timeline For Lean Manufacturing Implementation Ppt PowerPoint Presentation Diagram PDF
This slide represents timeline for lean manufacturing implementation. It covers lean leadership development, value stream management, material management etc. Slidegeeks is here to make your presentations a breeze with Half Yearly Timeline For Lean Manufacturing Implementation Ppt PowerPoint Presentation Diagram PDF With our easy to use and customizable templates, you can focus on delivering your ideas rather than worrying about formatting. With a variety of designs to choose from, you are sure to find one that suits your needs. And with animations and unique photos, illustrations, and fonts, you can make your presentation pop. So whether you are giving a sales pitch or presenting to the board, make sure to check out Slidegeeks first.


 Continue with Email

 Home
Home


