Production Icons
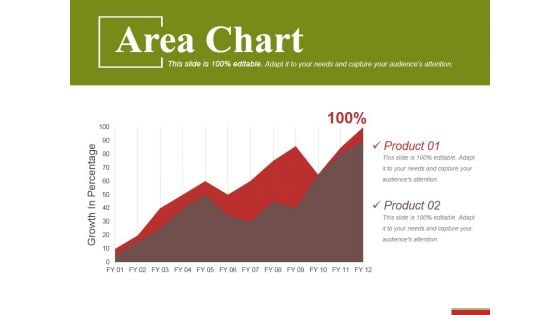
Area Chart Ppt PowerPoint Presentation Gallery Brochure
This is a area chart ppt powerpoint presentation gallery brochure. This is a two stage process. The stages in this process are product, growth in percentage, success, business.
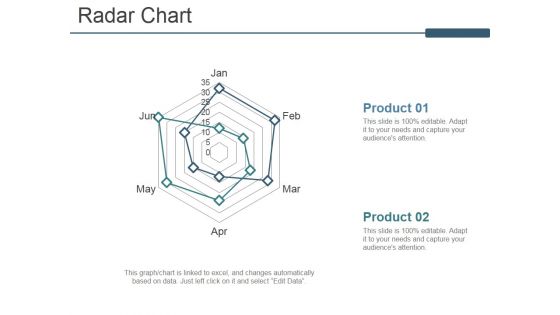
Radar Chart Ppt PowerPoint Presentation Model Graphics
This is a radar chart ppt powerpoint presentation model graphics. This is a two stage process. The stages in this process are product, business, marketing, process, success.
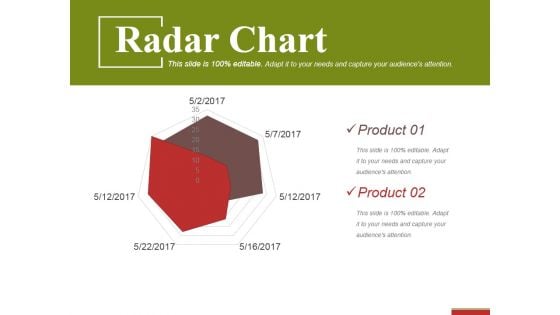
Radar Chart Ppt PowerPoint Presentation Summary Skills
This is a radar chart ppt powerpoint presentation summary skills. This is a two stage process. The stages in this process are product, shape, business, marketing.
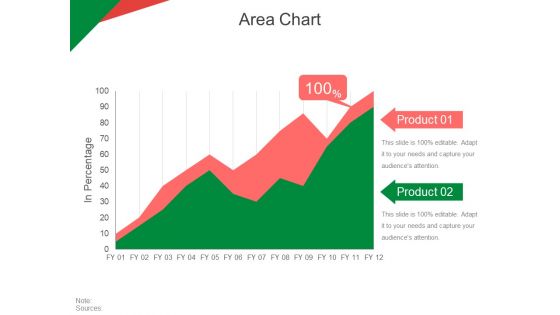
Area Chart Ppt PowerPoint Presentation Inspiration Aids
This is a area chart ppt powerpoint presentation inspiration aids. This is a two stage process. The stages in this process are in percentage, product, business, marketing, strategy.
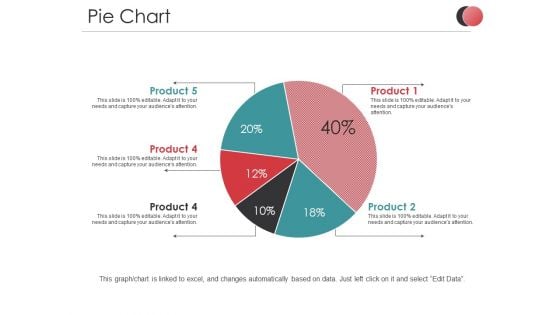
Pie Chart Ppt PowerPoint Presentation Slides Files
This is a pie chart ppt powerpoint presentation slides files. This is a five stage process. The stages in this process are product, percentage, business, marketing, process.
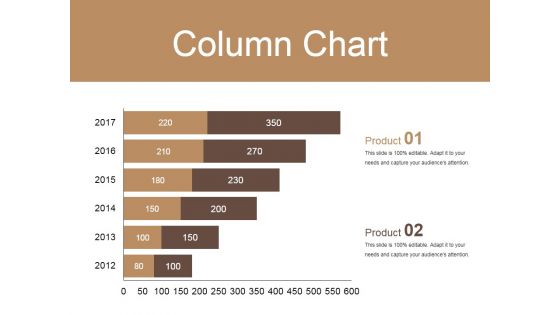
Column Chart Ppt PowerPoint Presentation Show Visuals
This is a column chart ppt powerpoint presentation show visuals. This is a two stage process. The stages in this process are product, year, success, step, business.
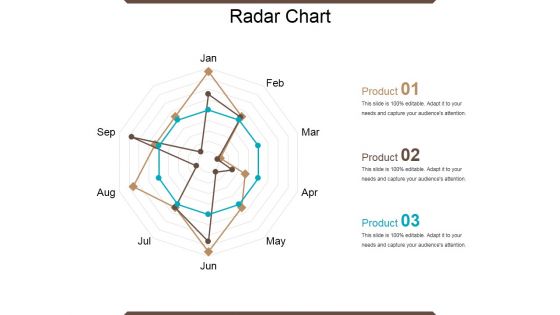
Radar Chart Ppt PowerPoint Presentation Layouts Elements
This is a radar chart ppt powerpoint presentation layouts elements. This is a three stage process. The stages in this process are product, shapes, business, marketing.
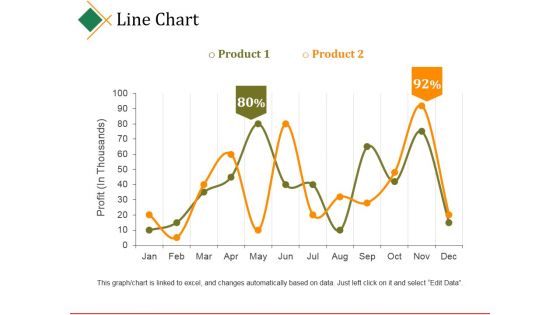
Line Chart Ppt PowerPoint Presentation Portfolio Shapes
This is a line chart ppt powerpoint presentation portfolio shapes. This is a two stage process. The stages in this process are profit, product, business, marketing, graph.
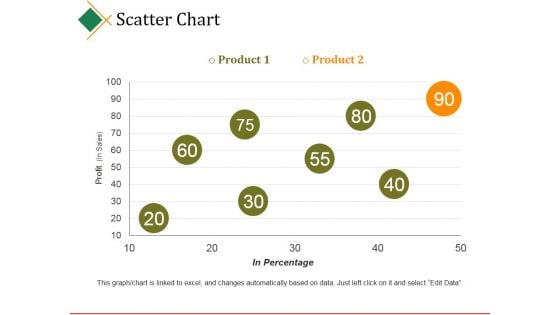
Scatter Chart Ppt PowerPoint Presentation Model
This is a scatter chart ppt powerpoint presentation model. This is a two stage process. The stages in this process are business, product, profit, in percentage, business.
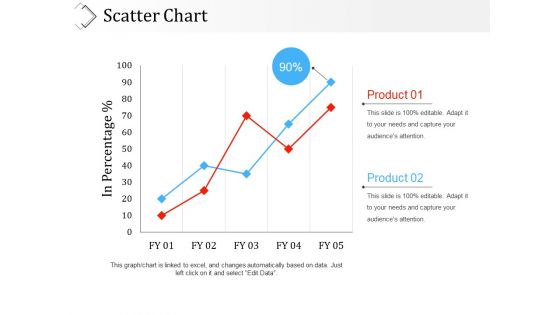
Scatter Chart Ppt PowerPoint Presentation Outline Picture
This is a scatter chart ppt powerpoint presentation outline picture. This is a two stage process. The stages in this process are in percentage, business, marketing, product, graph.

Column Chart Ppt PowerPoint Presentation Ideas Inspiration
This is a column chart ppt powerpoint presentation ideas inspiration. This is a five stage process. The stages in this process are graph, year, business, marketing, product.
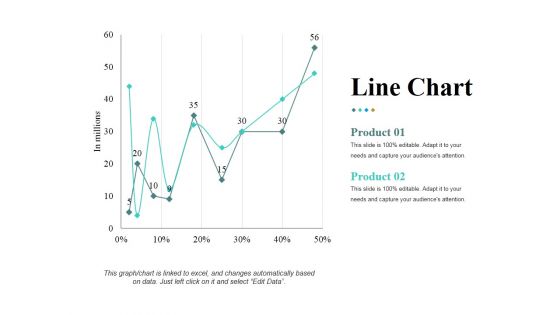
Line Chart Ppt PowerPoint Presentation Pictures Ideas
This is a line chart ppt powerpoint presentation pictures ideas. This is a two stage process. The stages in this process are in millions, percentage, finance, product, growth.

Column Chart Ppt PowerPoint Presentation Infographics Portrait
This is a column chart ppt powerpoint presentation infographics portrait. This is a two stage process. The stages in this process are product, year, time planning, business, step.
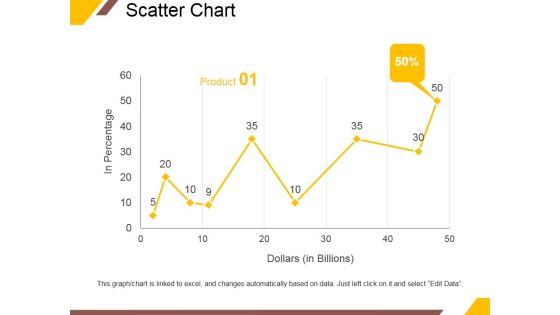
Scatter Chart Ppt PowerPoint Presentation Gallery Vector
This is a scatter chart ppt powerpoint presentation gallery vector. This is a nine stage process. The stages in this process are in percentage, dollars, product, percentage, finance.

Rader Chart Ppt PowerPoint Presentation Professional Pictures
This is a rader chart ppt powerpoint presentation professional pictures. This is a two stage process. The stages in this process are product, finance, business, marketing.
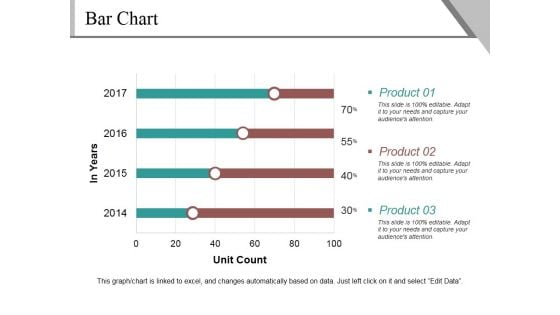
Bar Chart Ppt PowerPoint Presentation Summary Pictures
This is a bar chart ppt powerpoint presentation summary pictures. This is a four stage process. The stages in this process are product, unit count, finance, percentage, business.
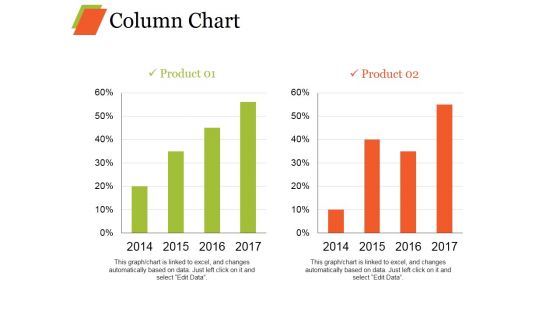
Column Chart Ppt PowerPoint Presentation Infographics Model
This is a column chart ppt powerpoint presentation infographics model. This is a two stage process. The stages in this process are bar graph, growth, product, percentage, year.
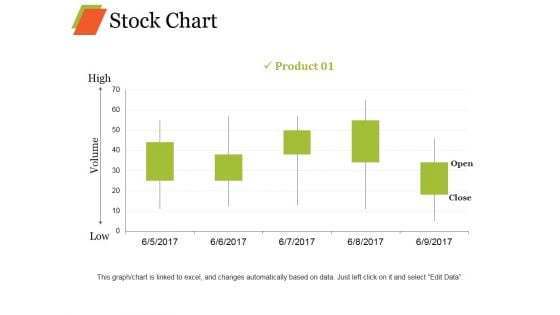
Stock Chart Ppt PowerPoint Presentation Professional Objects
This is a stock chart ppt powerpoint presentation professional objects. This is a five stage process. The stages in this process are product, high, volume, low, open, close.
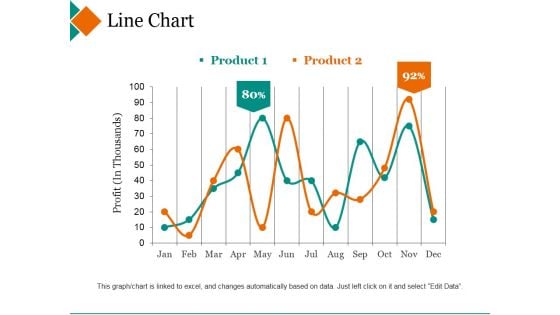
Line Chart Ppt PowerPoint Presentation Inspiration Deck
This is a line chart ppt powerpoint presentation inspiration deck. This is a two stage process. The stages in this process are product, profit, percentage, finance, line graph.
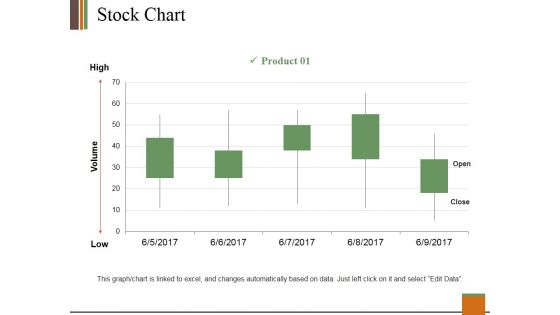
Stock Chart Ppt PowerPoint Presentation Slides Clipart
This is a stock chart ppt powerpoint presentation slides clipart. This is a one stage process. The stages in this process are product, high, volume, low, open, close.
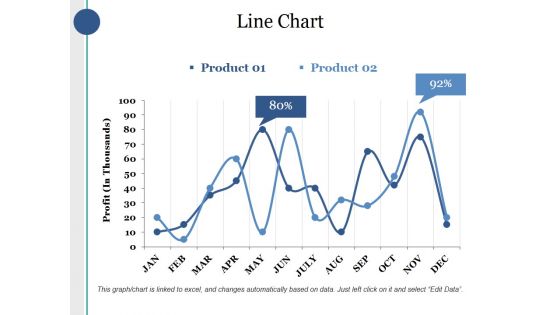
Line Chart Ppt PowerPoint Presentation Layouts Sample
This is a line chart ppt powerpoint presentation layouts sample. This is a two stage process. The stages in this process are product, profit, percentage, finance, business.
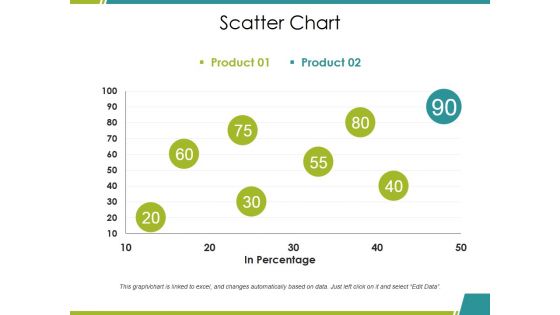
Scatter Chart Ppt PowerPoint Presentation Summary Inspiration
This is a scatter chart ppt powerpoint presentation summary inspiration. This is a two stage process. The stages in this process are product, in percentage, growth, success, business.
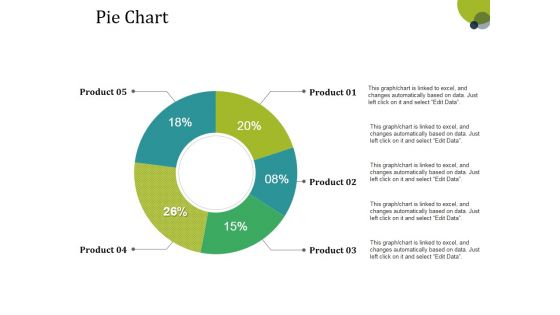
Pie Chart Ppt PowerPoint Presentation Inspiration Summary
This is a pie chart ppt powerpoint presentation inspiration summary. This is a five stage process. The stages in this process are product, donut, business, percentage, marketing.
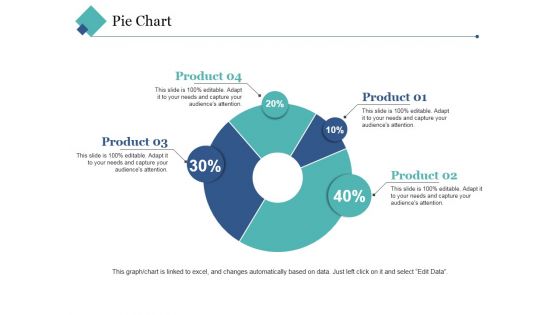
Pie Chart Ppt PowerPoint Presentation Layouts Elements
This is a pie chart ppt powerpoint presentation layouts elements. This is a four stage process. The stages in this process are product, business, marketing, percentage, growth.
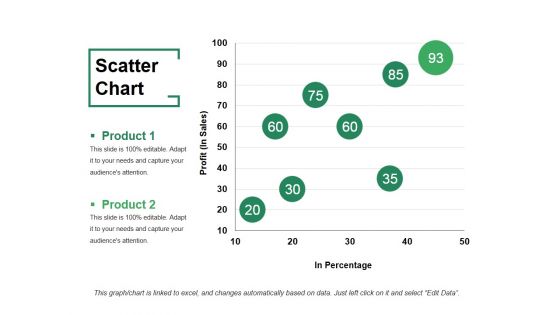
Scatter Chart Ppt PowerPoint Presentation File Visuals
This is a scatter chart ppt powerpoint presentation file visuals. This is a two stage process. The stages in this process are product, profit, in percentage, growth, success.
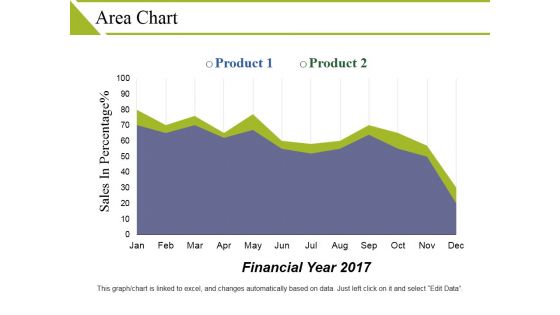
Area Chart Ppt PowerPoint Presentation Outline Objects
This is a area chart ppt powerpoint presentation outline objects. This is a two stage process. The stages in this process are product, sales in percentage, financial year.
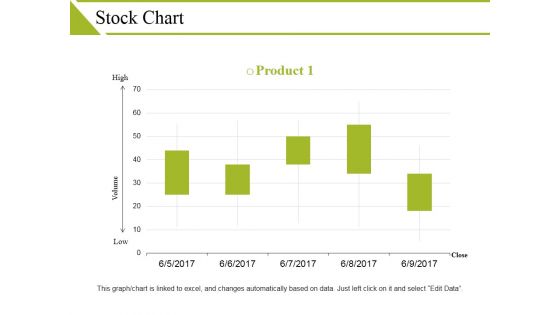
Stock Chart Ppt PowerPoint Presentation Show Guidelines
This is a stock chart ppt powerpoint presentation show guidelines. This is a one stage process. The stages in this process are high, volume, low, product, close.
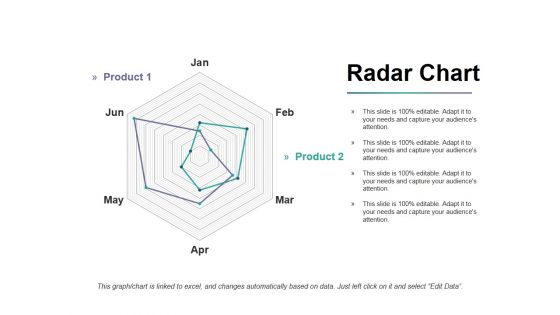
Radar Chart Ppt PowerPoint Presentation Infographics Portfolio
This is a radar chart ppt powerpoint presentation infographics portfolio. This is a two stage process. The stages in this process are product, finance, shapes, business, marketing.
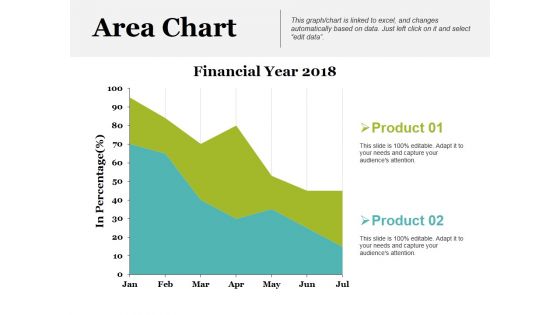
Area Chart Ppt PowerPoint Presentation Show Backgrounds
This is a area chart ppt powerpoint presentation show backgrounds. This is a two stage process. The stages in this process are financial year, product, in percentage.
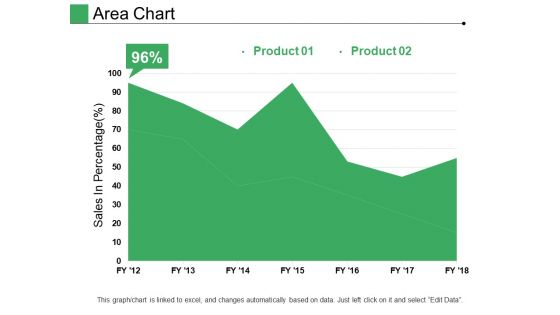
Area Chart Ppt PowerPoint Presentation Pictures Designs
This is a area chart ppt powerpoint presentation pictures designs. This is a two stage process. The stages in this process are product, sales in percentage, growth, success.
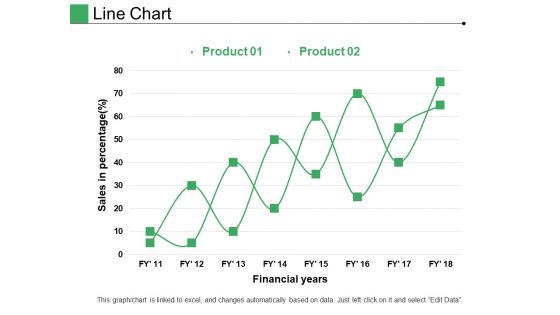
Line Chart Ppt PowerPoint Presentation Pictures Layout
This is a line chart ppt powerpoint presentation pictures layout. This is a two stage process. The stages in this process are product, financial years, sales in percentage.
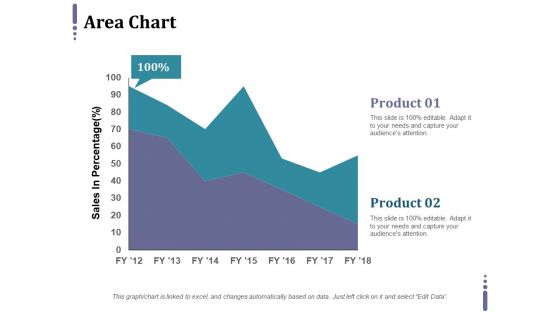
Area Chart Ppt PowerPoint Presentation Professional Grid
This is a area chart ppt powerpoint presentation professional grid. This is a two stage process. The stages in this process are product, sales in percentage, business.
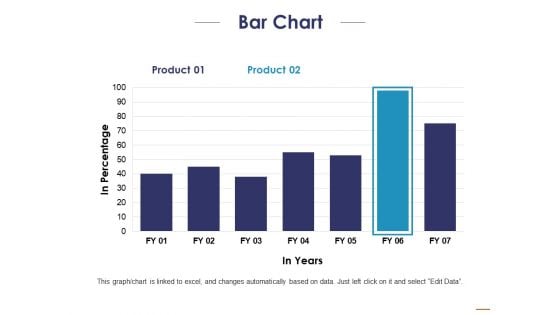
Bar Chart Ppt PowerPoint Presentation Portfolio Inspiration
This is a bar chart ppt powerpoint presentation portfolio inspiration. This is a two stage process. The stages in this process are product, in percentage, in years.
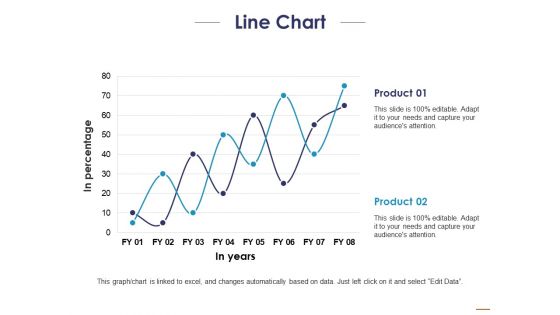
Line Chart Ppt PowerPoint Presentation Layouts Templates
This is a line chart ppt powerpoint presentation layouts templates. This is a two stage process. The stages in this process are product, in percentage, in years.
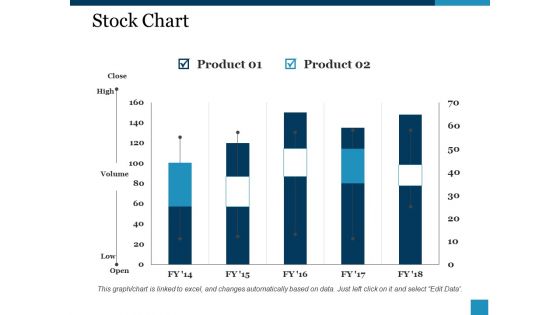
Stock Chart Ppt PowerPoint Presentation Guide
This is a stock chart ppt powerpoint presentation guide. This is a two stage process. The stages in this process are product, close, high, volume, low.
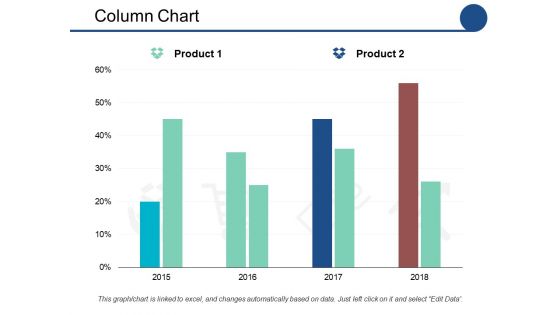
Column Chart Ppt PowerPoint Presentation Show Outfit
This is a column chart ppt powerpoint presentation show outfit. This is a two stage process. The stages in this process are product, percentage, marketing.
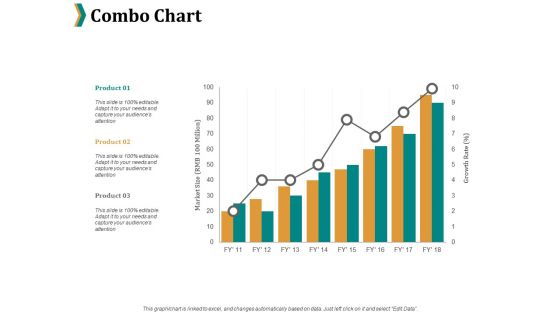
Combo Chart Ppt PowerPoint Presentation File Example
This is a combo chart ppt powerpoint presentation file example. This is a three stage process. The stages in this process are product, percentage, marketing, business, management.
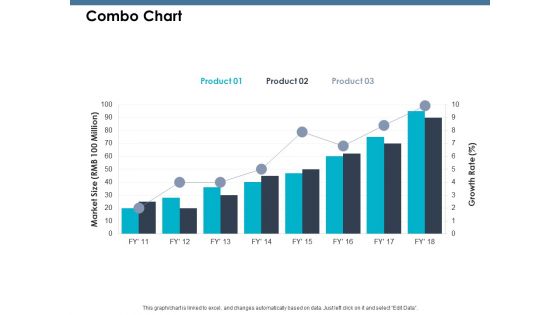
Combo Chart Ppt PowerPoint Presentation Model Grid
This is a combo chart ppt powerpoint presentation model grid. This is a three stage process. The stages in this process are growth, product, percentage, marketing.
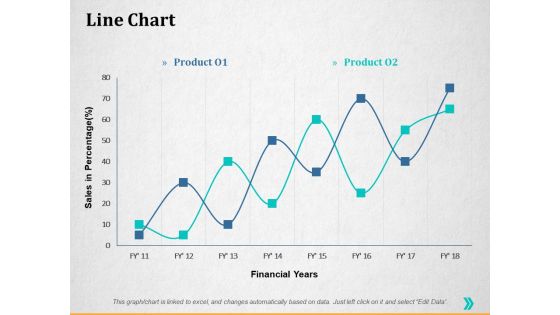
Line Chart Ppt PowerPoint Presentation Summary Guidelines
This is a line chart ppt powerpoint presentation summary guidelines. This is a two stage process. The stages in this process are percentage, product, business, management, marketing.
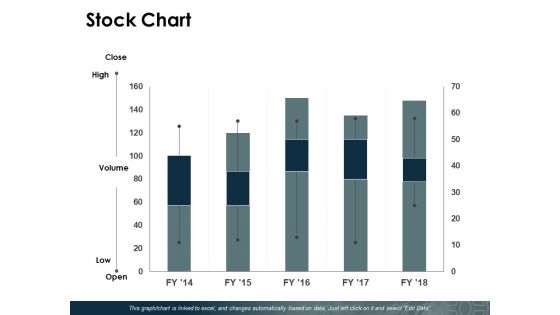
Stock Chart Ppt PowerPoint Presentation Show Pictures
This is a stock chart ppt powerpoint presentation show pictures. This is a five stage process. The stages in this process are product, percentage, management, marketing.

Pie Chart Ppt PowerPoint Presentation Model Smartart
This is a pie chart ppt powerpoint presentation model smartart. This is a five stage process. The stages in this process are management, marketing, business, percentage, product.
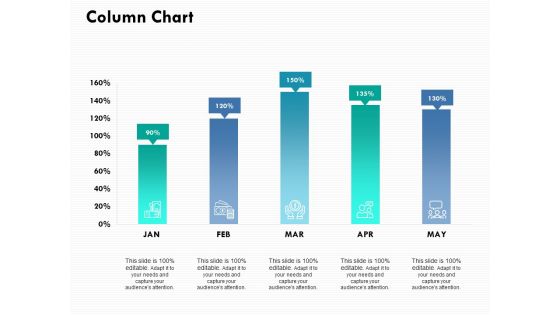
Column Chart Ppt PowerPoint Presentation Ideas Example
This is a column chart ppt powerpoint presentation ideas example. This is a five stage process. The stages in this process are percentage, product, management, marketing.
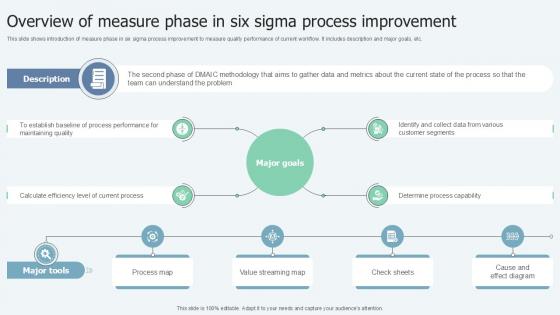
Overview Of Measure Phase In Lean Six Sigma In Manufacturing Ppt Example
This slide shows introduction of measure phase in six sigma process improvement to measure quality performance of current workflow. It includes description and major goals, etc. There are so many reasons you need a Overview Of Measure Phase In Lean Six Sigma In Manufacturing Ppt Example. The first reason is you can not spend time making everything from scratch, Thus, Slidegeeks has made presentation templates for you too. You can easily download these templates from our website easily. This slide shows introduction of measure phase in six sigma process improvement to measure quality performance of current workflow. It includes description and major goals, etc.
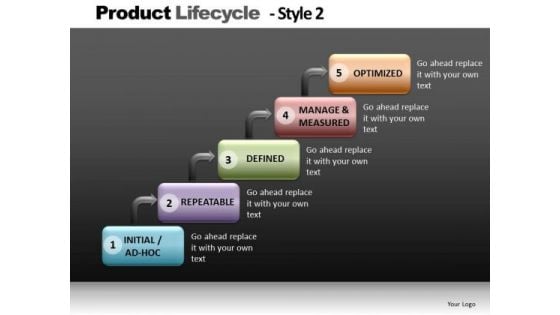
Stairscase Diagram Chart PowerPoint Slides Editable Ppt Templates
StairsCase Diagram Chart PowerPoint Slides Editable PPT templates-These high quality powerpoint pre-designed slides and powerpoint templates have been carefully created by our professional team to help you impress your audience. All slides have been created and are 100% editable in powerpoint. Each and every property of any graphic - color, size, orientation, shading, outline etc. can be modified to help you build an effective powerpoint presentation. Any text can be entered at any point in the powerpoint template or slide. Simply DOWNLOAD, TYPE and PRESENT!These PowerPoint designs and slide layouts can be used to in presentations relating to --Activities, business, clipart, commerce, concept, conceptual, customer, design, diagram, direction, distribution, guidelines, icon, illustration, integration, lifecycle, manage, management, manufacturing, marketing, mba, model, optimize, organization, performance, process, product, resentation, resource, sales, selling, steps, system, theoretical, theory, tool-StairsCase Diagram Chart PowerPoint Slides Editable PPT templates Get ahead despite fierce competition. Accelerate away from the pack with our Stairscase Diagram Chart PowerPoint Slides Editable Ppt Templates.
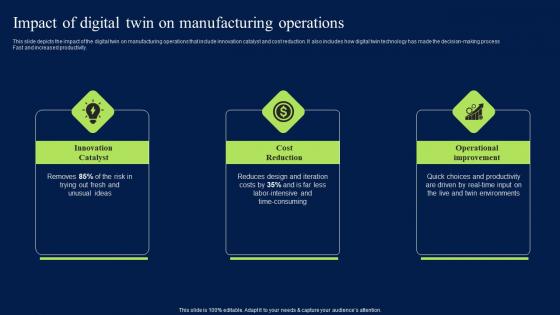
Impact Of Digital Twin On Manufacturing Operations Themes PDF
This slide depicts the impact of the digital twin on manufacturing operations that include innovation catalyst and cost reduction. It also includes how digital twin technology has made the decision-making process fast and increased productivity. Whether you have daily or monthly meetings, a brilliant presentation is necessary. Impact Of Digital Twin On Manufacturing Operations Themes PDF can be your best option for delivering a presentation. Represent everything in detail using Impact Of Digital Twin On Manufacturing Operations Themes PDF and make yourself stand out in meetings. The template is versatile and follows a structure that will cater to your requirements. All the templates prepared by Slidegeeks are easy to download and edit. Our research experts have taken care of the corporate themes as well. So, give it a try and see the results. This slide depicts the impact of the digital twin on manufacturing operations that include innovation catalyst and cost reduction. It also includes how digital twin technology has made the decision-making process Fast and increased productivity.

Our Performance Indicators Powerpoint Themes
This is a our performance indicators powerpoint themes. This is a five stage process. The stages in this process are cash flow, turnover, productivity, customer satisfaction, net income.
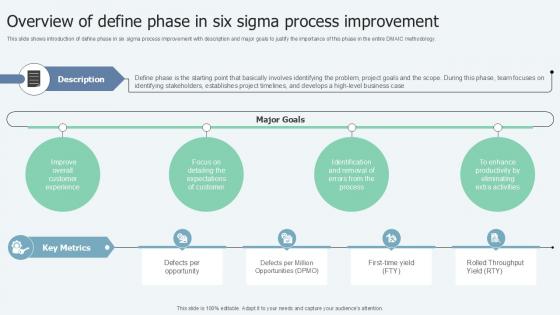
Overview Of Define Phase In Lean Six Sigma In Manufacturing Ppt Sample
This slide shows introduction of define phase in six sigma process improvement with description and major goals to justify the importance of this phase in the entire DMAIC methodology. Create an editable Overview Of Define Phase In Lean Six Sigma In Manufacturing Ppt Sample that communicates your idea and engages your audience. Whether you are presenting a business or an educational presentation, pre-designed presentation templates help save time. Overview Of Define Phase In Lean Six Sigma In Manufacturing Ppt Sample is highly customizable and very easy to edit, covering many different styles from creative to business presentations. Slidegeeks has creative team members who have crafted amazing templates. So, go and get them without any delay. This slide shows introduction of define phase in six sigma process improvement with description and major goals to justify the importance of this phase in the entire DMAIC methodology.
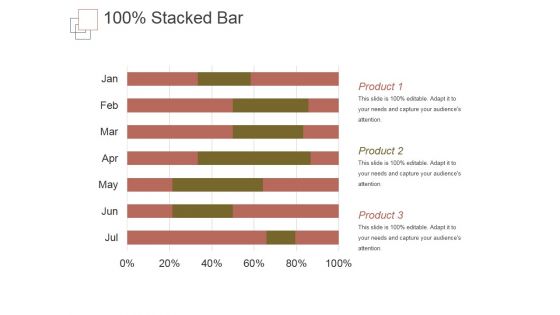
Stacked Bar Template 1 Ppt PowerPoint Presentation Themes
This is a stacked bar template 1 ppt powerpoint presentation themes. This is a six stage process. The stages in this process are product, business, marketing, success, management.
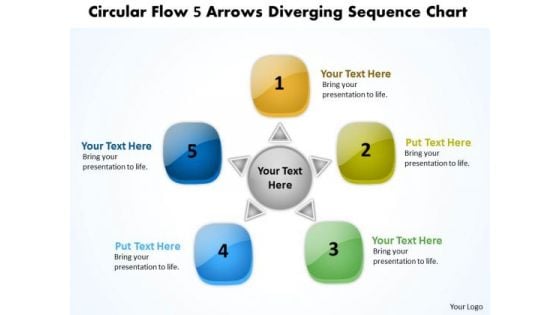
Circular Flow 5 Arrows Diverging Sequence Chart Cycle PowerPoint Slides
We present our circular flow 5 arrows diverging sequence chart Cycle PowerPoint Slides.Download our Boxes PowerPoint Templates because strengthen your relationship with your present customers and likely future ones as the occasion has an intrinsic business potential. Present our Business PowerPoint Templates because a lot of dissimilar elements needing to gel to strike the deal. Present our Arrows PowerPoint Templates because you can Step by step develop the entire picture and project it onto their minds. Present our Circle Charts PowerPoint Templates because you can Amplify your views, ideas and thoughts from very basic aspects to the highly technical and complicated issus using this template as a tool. Download and present our Flow Charts PowerPoint Templates because you can Amplify your views, ideas and thoughts from very basic aspects to the highly technical and complicated issus using this template as a tool.Use these PowerPoint slides for presentations relating to abstract, advertising, arrow, artwork, backdrop, background, banner, brochure, business, button, card, circle, color, concept, corporate, creative, design, form, graphic, histogram, icons, illustration, industrial, infographic, information, label, layout, leaflet, menu, number, options, paper, pattern, pictogram, presentation, product, promotion, symbol, tab, tag, team, teamwork, technology, template, text, vector, version, web, web design, website. The prominent colors used in the PowerPoint template are Green, Blue, Yellow. Presenters tell us our circular flow 5 arrows diverging sequence chart Cycle PowerPoint Slides are Charming. You can be sure our business PowerPoint templates and PPT Slides are Elevated. Professionals tell us our circular flow 5 arrows diverging sequence chart Cycle PowerPoint Slides are Attractive. People tell us our banner PowerPoint templates and PPT Slides are Adorable. People tell us our circular flow 5 arrows diverging sequence chart Cycle PowerPoint Slides are Nice. Professionals tell us our backdrop PowerPoint templates and PPT Slides are Adorable. Lighten your workload with our Circular Flow 5 Arrows Diverging Sequence Chart Cycle PowerPoint Slides. Make sure your presentation gets the attention it deserves.
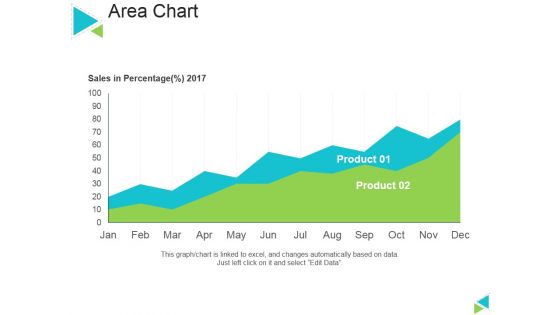
Area Chart Ppt PowerPoint Presentation Inspiration Themes
This is a area chart ppt powerpoint presentation inspiration themes. This is a two stage process. The stages in this process are sales in percentage, product, area chart, business, marketing.
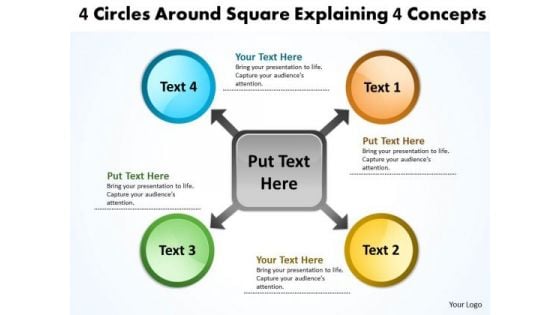
4 Circles Around Square Explaining Concepts Circular Flow Chart PowerPoint Slides
We present our 4 circles around square explaining concepts Circular Flow Chart PowerPoint Slides.Use our Circle Charts PowerPoint Templates because by using this slide you can Heighten the anticipation of your audience listing . Use our Boxes PowerPoint Templates because with the help of our Slides you can Illustrate your plans to your listeners with the same accuracy. Download our Arrows PowerPoint Templates because you can enlighten your skills with the help of our topical templates. Download our Business PowerPoint Templates because your thoughts are pointed and sharp as arrows. Present our Flow Charts PowerPoint Templates because you have the plans ready for them to absorb and understand.Use these PowerPoint slides for presentations relating to abstract, advertising, arrow, artwork, backdrop, background, banner, brochure, business, button, card, circle, color, concept, corporate, creative, design, form, graphic, histogram, icons, illustration, industrial, infographic, information, label, layout, leaflet, menu, number, options, paper, pattern, pictogram, presentation, product, promotion, symbol, tab, tag, team, teamwork, technology, template, text, vector, version, web, web design, website. The prominent colors used in the PowerPoint template are Yellow, Green, Blue. Presenters tell us our 4 circles around square explaining concepts Circular Flow Chart PowerPoint Slides are Ultra. You can be sure our artwork PowerPoint templates and PPT Slides are Fabulous. Professionals tell us our 4 circles around square explaining concepts Circular Flow Chart PowerPoint Slides are Glamorous. People tell us our arrow PowerPoint templates and PPT Slides are Versatile. People tell us our 4 circles around square explaining concepts Circular Flow Chart PowerPoint Slides are Wistful. Professionals tell us our artwork PowerPoint templates and PPT Slides are Magnificent. Display leadership with our 4 Circles Around Square Explaining Concepts Circular Flow Chart PowerPoint Slides. Download without worries with our money back guaranteee.
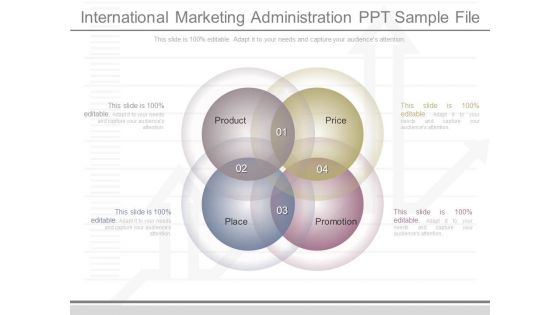
International Marketing Administration Ppt Sample File
This is a international marketing administration ppt sample file. This is a four stage process. The stages in this process are product, price, place, promotion.
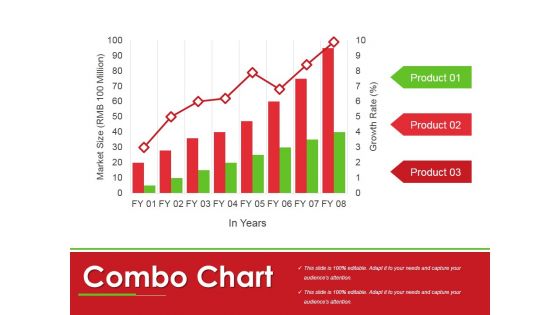
Combo Chart Ppt PowerPoint Presentation Portfolio Themes
This is a combo chart ppt powerpoint presentation portfolio themes. This is a three stage process. The stages in this process are market size, product, management, finance, chart, marketing.
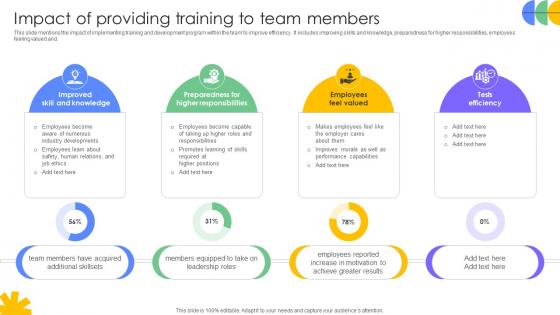
Driving Results Designing A Team Impact Of Providing Training To Team Members
This slide mentions the impact of implementing training and development program within the team to improve efficiency. It includes improving skills and knowledge, preparedness for higher responsibilities, employees feeling valued and. Are you in need of a template that can accommodate all of your creative concepts This one is crafted professionally and can be altered to fit any style. Use it with Google Slides or PowerPoint. Include striking photographs, symbols, depictions, and other visuals. Fill, move around, or remove text boxes as desired. Test out color palettes and font mixtures. Edit and save your work, or work with colleagues. Download Driving Results Designing A Team Impact Of Providing Training To Team Members and observe how to make your presentation outstanding. Give an impeccable presentation to your group and make your presentation unforgettable. This slide mentions the impact of implementing training and development program within the team to improve efficiency. It includes improving skills and knowledge, preparedness for higher responsibilities, employees feeling valued and.
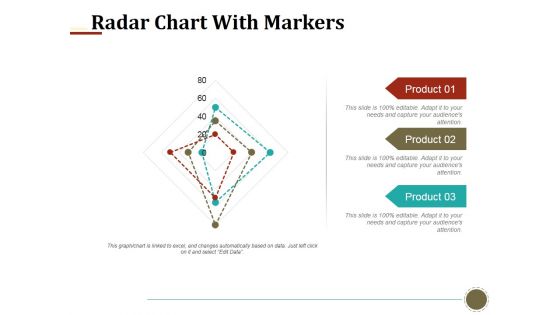
Radar Chart With Markers Ppt PowerPoint Presentation Portfolio Slides
This is a radar chart with markers ppt powerpoint presentation portfolio slides. This is a three stage process. The stages in this process are radar chart, markers, product.

Line Chart Ppt PowerPoint Presentation Gallery Example Introduction
This is a line chart ppt powerpoint presentation portfolio shapes. This is a two stage process. The stages in this process are product, financial years, line chart.
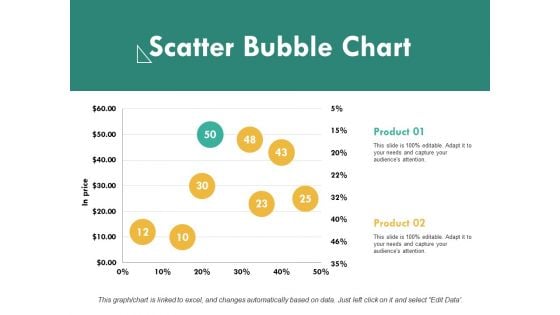
Scatter Bubble Chart Ppt PowerPoint Presentation File Samples
This is a scatter bubble chart ppt powerpoint presentation file samples. This is a two stage process. The stages in this process are product, in price, scatter chart.
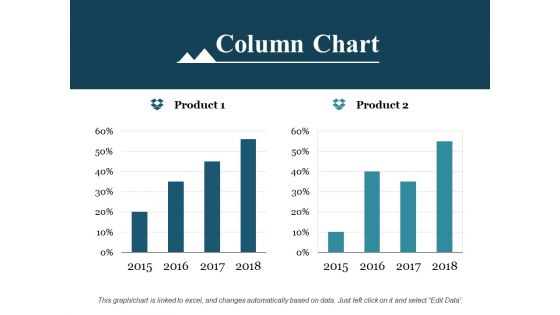
Column Chart Ppt PowerPoint Presentation Outline Background Image
This is a column chart ppt powerpoint presentation outline background image. This is a two stage process. The stages in this process are product, column chart, growth.
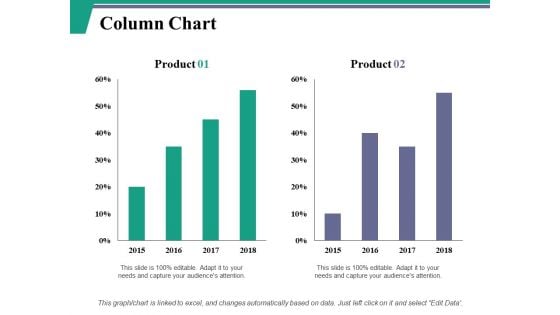
Column Chart Ppt PowerPoint Presentation Model Layout Ideas
This is a column chart ppt powerpoint presentation model layout ideas. This is a two stage process. The stages in this process are product, column chart, bar graph.

Line Chart Ppt PowerPoint Presentation Portfolio File Formats
This is a line chart ppt powerpoint presentation portfolio file formats. This is a two stage process. The stages in this process are product, profit, line chart.

 Home
Home