Production Icons
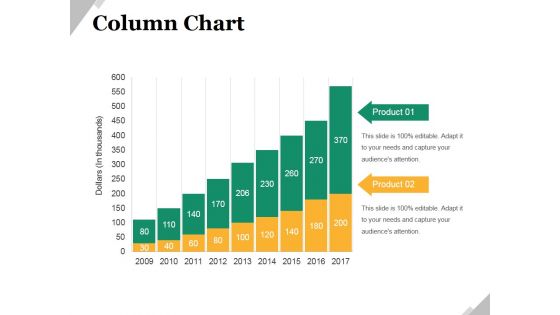
Column Chart Ppt PowerPoint Presentation Infographic Template Graphic Images
This is a column chart ppt powerpoint presentation infographic template graphic images. This is a nine stage process. The stages in this process are business, marketing, growth, product, management.
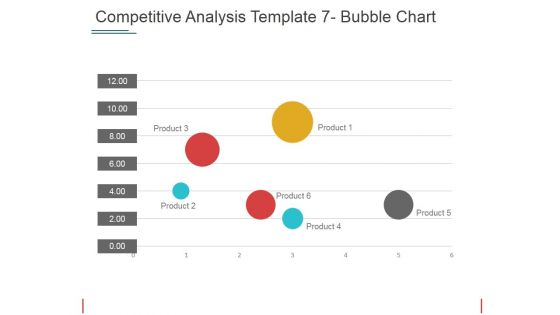
Competitive Analysis Bubble Chart Ppt PowerPoint Presentation Pictures Mockup
This is a competitive analysis bubble chart ppt powerpoint presentation pictures mockup. This is a six stage process. The stages in this process are product, table, business, marketing, management.
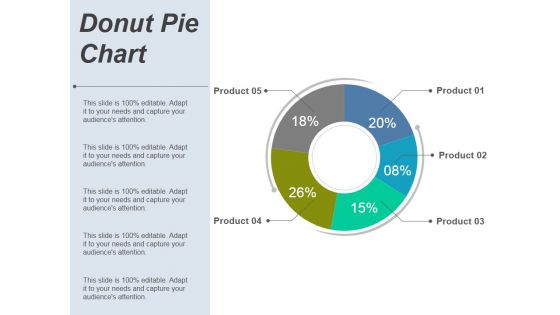
Donut Pie Chart Ppt PowerPoint Presentation Infographic Template Layout Ideas
This is a donut pie chart ppt powerpoint presentation infographic template layout ideas. This is a five stage process. The stages in this process are product, business, finance, marketing.
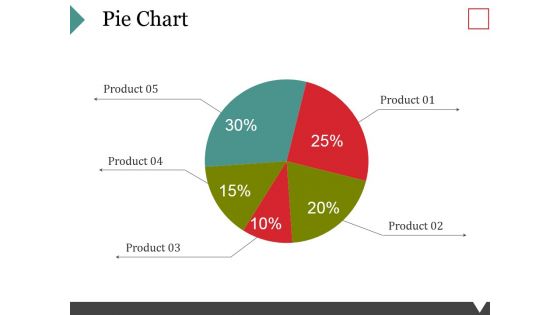
Pie Chart Ppt PowerPoint Presentation Summary Background Image
This is a pie chart ppt powerpoint presentation summary background image. This is a five stage process. The stages in this process are business, marketing, product, finance, strategy, planning.
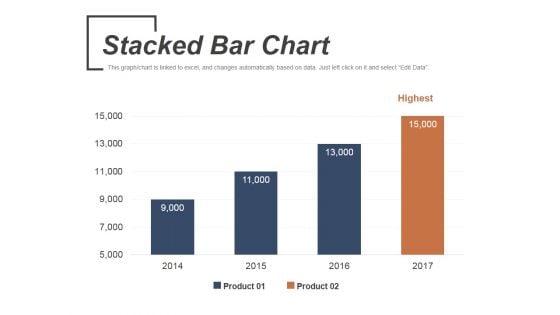
Stacked Bar Chart Ppt PowerPoint Presentation Inspiration Ideas
This is a stacked bar chart ppt powerpoint presentation inspiration ideas. This is a four stage process. The stages in this process are product, highest, business, marketing, bar graph.
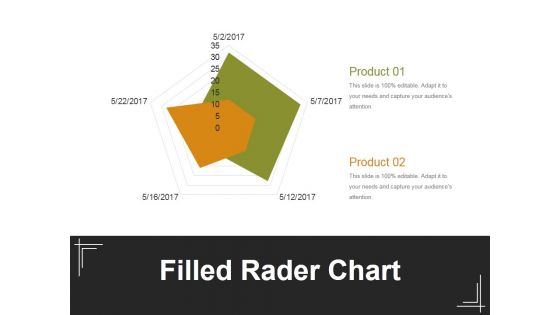
Filled Rader Chart Ppt PowerPoint Presentation Professional Background Image
This is a filled rader chart ppt powerpoint presentation professional background image. This is a five stage process. The stages in this process are product, business, marketing, process, management.
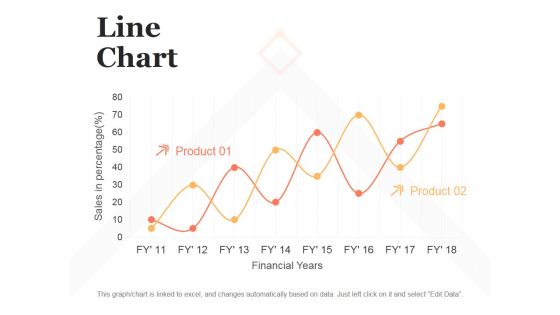
Line Chart Ppt PowerPoint Presentation Model Design Templates
This is a line chart ppt powerpoint presentation model design templates. This is a two stage process. The stages in this process are sales in percentage, financial years, product.
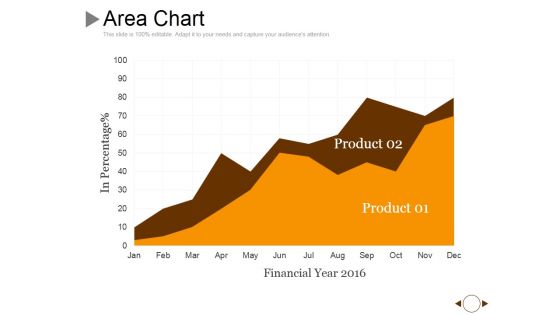
Area Chart Ppt PowerPoint Presentation Show Layout Ideas
This is a area chart ppt powerpoint presentation show layout ideas. This is a two stage process. The stages in this process are product, in percentage, financial year, growth.
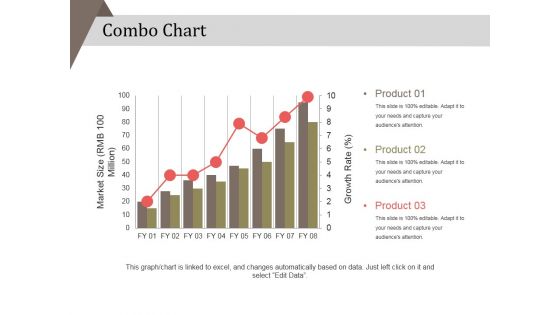
Combo Chart Ppt PowerPoint Presentation Infographic Template Brochure
This is a combo chart ppt powerpoint presentation infographic template brochure. This is a eight stage process. The stages in this process are product, market size, strategy, business, marketing.
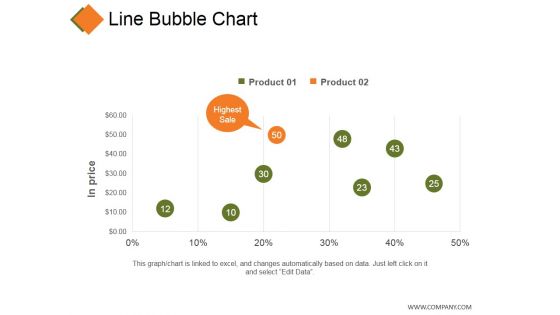
Line Bubble Chart Ppt PowerPoint Presentation Professional Infographic Template
This is a line bubble chart ppt powerpoint presentation professional infographic template. This is a five stage process. The stages in this process are product, in price, highest sale, business, finance.
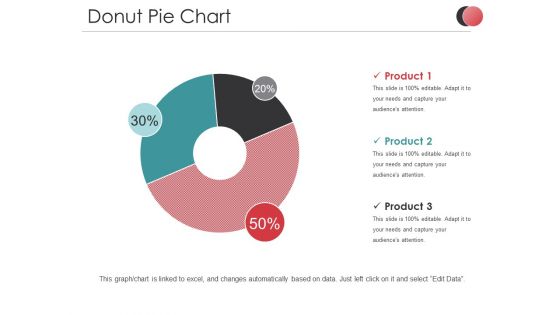
Donut Pie Chart Ppt PowerPoint Presentation Inspiration Background Image
This is a donut pie chart ppt powerpoint presentation inspiration background image. This is a three stage process. The stages in this process are product, percentage, business, marketing, process.

Scatter Bubble Chart Ppt PowerPoint Presentation Professional Graphics Pictures
This is a scatter bubble chart ppt powerpoint presentation professional graphics pictures. This is a one stage process. The stages in this process are profit in sales, financial year, highest profit, product.
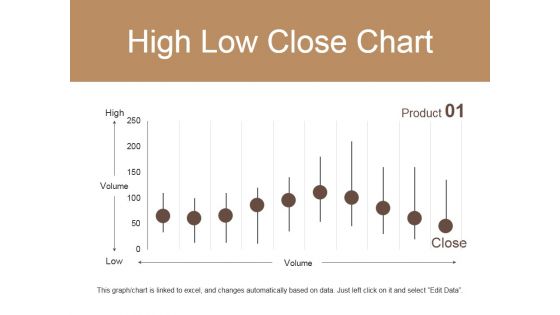
High Low Close Chart Ppt PowerPoint Presentation Infographic Template Vector
This is a high low close chart ppt powerpoint presentation infographic template vector. This is a ten stage process. The stages in this process are high, volume, low, product, close.
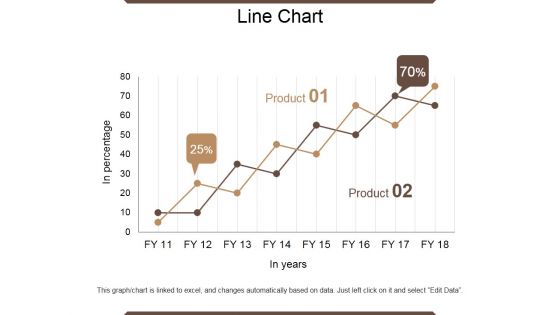
Line Chart Ppt PowerPoint Presentation Outline Infographic Template
This is a line chart ppt powerpoint presentation outline infographic template. This is a two stage process. The stages in this process are in percentage, product, in year, growth, success.
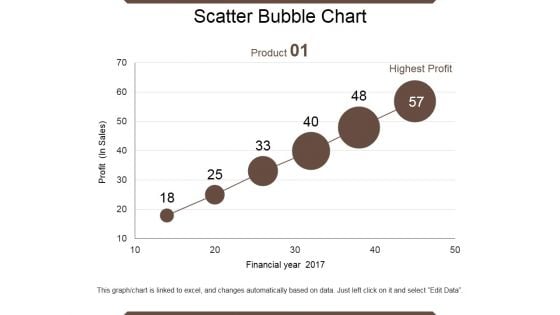
Scatter Bubble Chart Ppt PowerPoint Presentation Summary Files
This is a scatter bubble chart ppt powerpoint presentation summary files. This is a six stage process. The stages in this process are product, financial year, profit, highest profit.
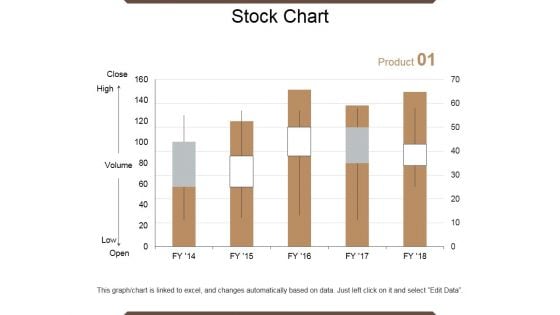
Stock Chart Ppt PowerPoint Presentation Outline Graphics Example
This is a stock chart ppt powerpoint presentation outline graphics example. This is a five stage process. The stages in this process are close, volume, low, high, open, product.
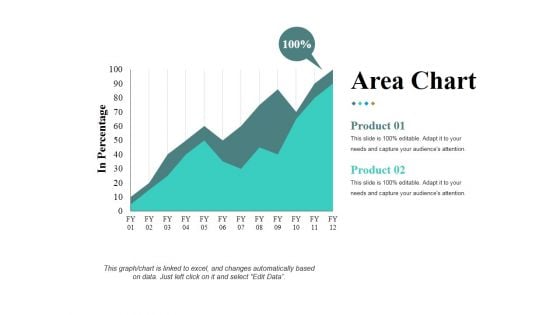
Area Chart Ppt PowerPoint Presentation Infographic Template Samples
This is a area chart ppt powerpoint presentation infographic template samples. This is a two stage process. The stages in this process are in percentage product, business, marketing, growth.
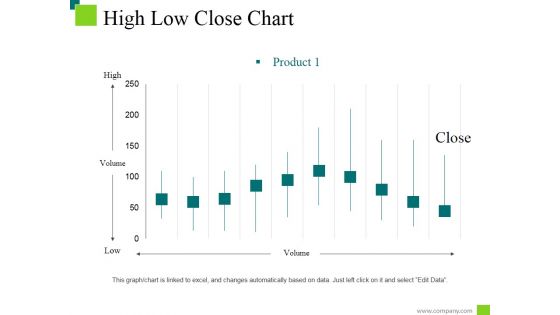
High Low Close Chart Ppt PowerPoint Presentation Styles Information
This is a high low close chart ppt powerpoint presentation styles information. This is a ten stage process. The stages in this process are low, high, product, volume, close.
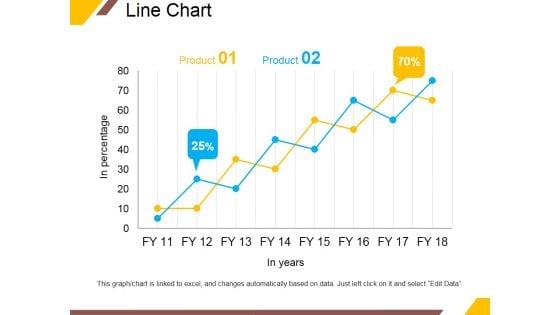
Line Chart Ppt PowerPoint Presentation Portfolio Infographic Template
This is a line chart ppt powerpoint presentation portfolio infographic template. This is a two stage process. The stages in this process are product, in years, business, percentage, growth.
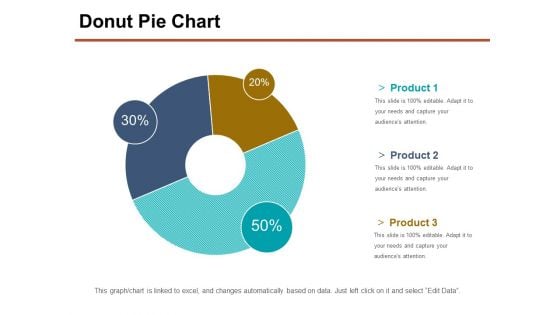
Donut Pie Chart Ppt PowerPoint Presentation Professional Slide Portrait
This is a donut pie chart ppt powerpoint presentation professional slide portrait. This is a three stage process. The stages in this process are product, percentage, business, management, process.
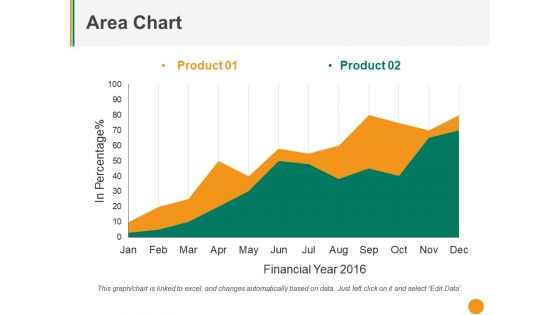
Area Chart Ppt PowerPoint Presentation File Graphic Tips
This is a area chart ppt powerpoint presentation file graphic tips. This is a two stage process. The stages in this process are product, in percentage, financial year, business, growth.
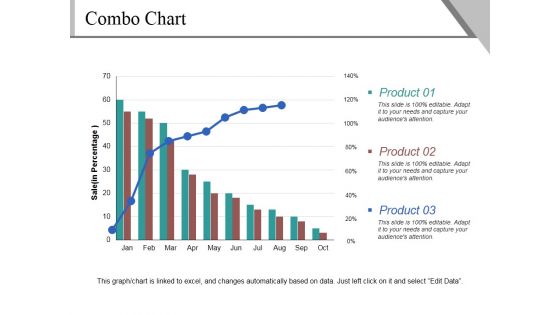
Combo Chart Ppt PowerPoint Presentation Ideas Visual Aids
This is a combo chart ppt powerpoint presentation ideas visual aids. This is a three stage process. The stages in this process are product, sales, bar graph, business, marketing.
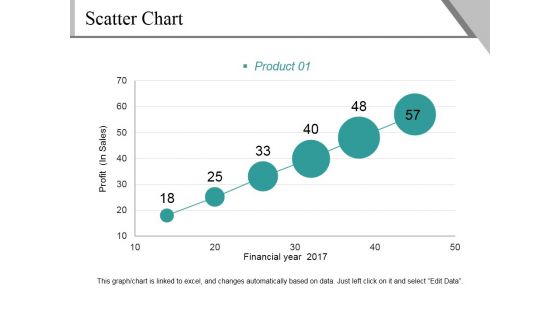
Scatter Chart Ppt PowerPoint Presentation File Background Image
This is a scatter chart ppt powerpoint presentation file background image. This is a six stage process. The stages in this process are profit, financial year, product, growth, success.
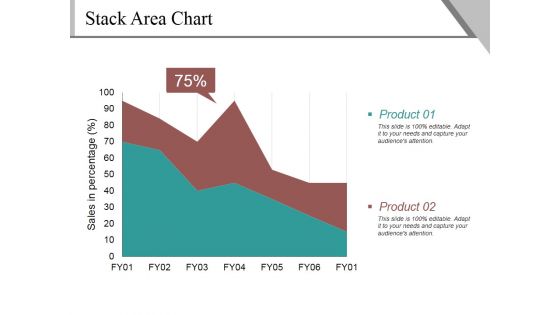
Stack Area Chart Ppt PowerPoint Presentation Gallery Guidelines
This is a stack area chart ppt powerpoint presentation gallery guidelines. This is a two stage process. The stages in this process are sales in percentage, product, percentage, business.
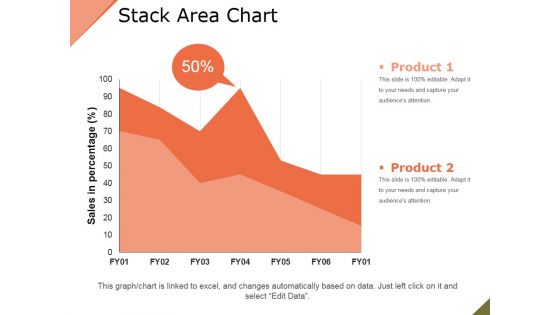
Stack Area Chart Ppt PowerPoint Presentation Example File
This is a stack area chart ppt powerpoint presentation example file. This is a two stage process. The stages in this process are product, sales in percentage, percentage, finance.
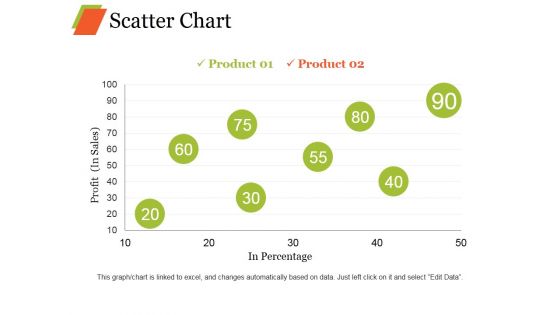
Scatter Chart Ppt PowerPoint Presentation Professional Graphic Images
This is a scatter chart ppt powerpoint presentation professional graphic images. This is a eight stage process. The stages in this process are product, profit, in percentage growth, business.
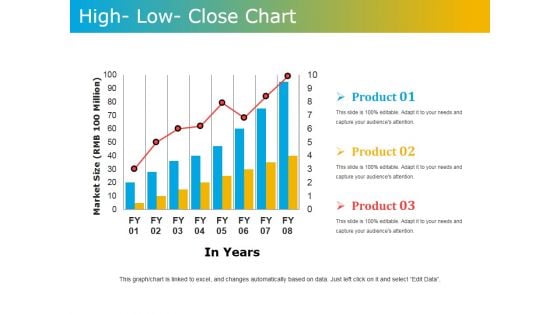
High Low Close Chart Ppt PowerPoint Presentation Model Graphics Tutorials
This is a high low close chart ppt powerpoint presentation model graphics tutorials. This is a three stage process. The stages in this process are market size, in years, product.
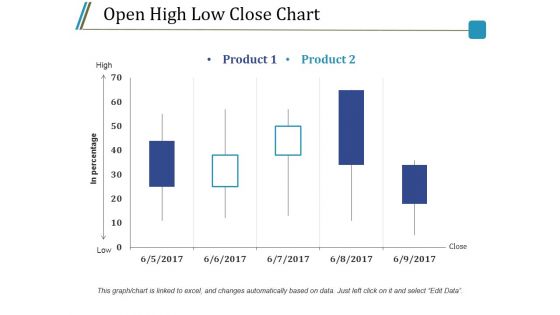
Open High Low Close Chart Ppt PowerPoint Presentation Styles Model
This is a open high low close chart ppt powerpoint presentation styles model. This is a five stage process. The stages in this process are product, high, low, in percentage, close.
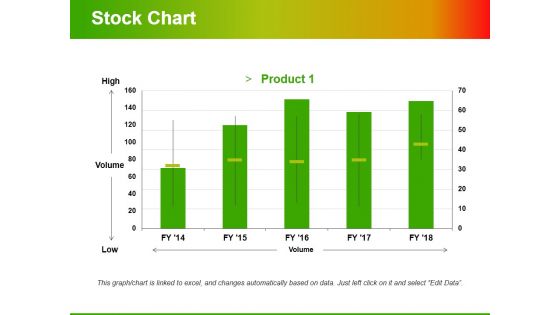
Stock Chart Template 2 Ppt PowerPoint Presentation Infographic Template Styles
This is a stock chart template 2 ppt powerpoint presentation infographic template styles. This is a one stage process. The stages in this process are high, volume, low, product, volume.
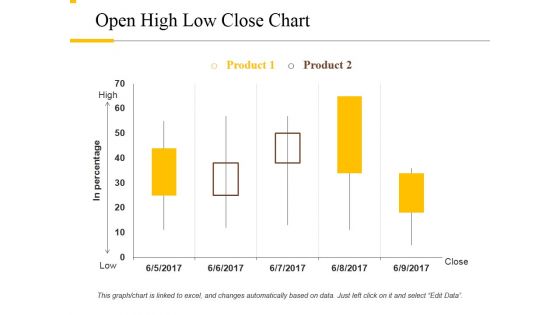
Open High Low Close Chart Ppt PowerPoint Presentation Outline Rules
This is a open high low close chart ppt powerpoint presentation outline rules. This is a two stage process. The stages in this process are product, high, low, close, in percentage.
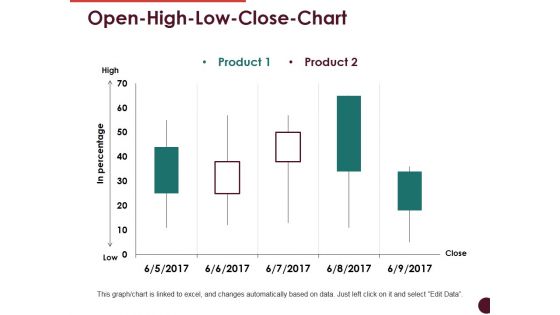
Open High Low Close Chart Ppt PowerPoint Presentation Professional Visuals
This is a open high low close chart ppt powerpoint presentation professional visuals. This is a two stage process. The stages in this process are high, low, in percentage, product, close.
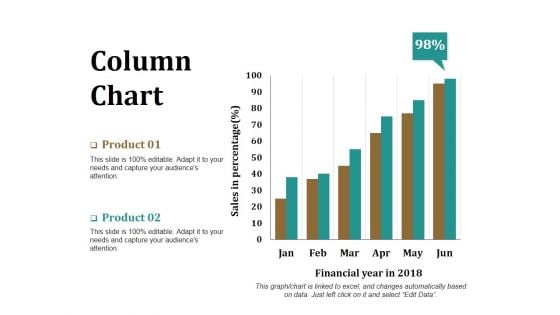
Column Chart Ppt PowerPoint Presentation Model Graphics Download
This is a column chart ppt powerpoint presentation model graphics download. This is a two stage process. The stages in this process are product, financial year, sales in percentage, bar graph, success.
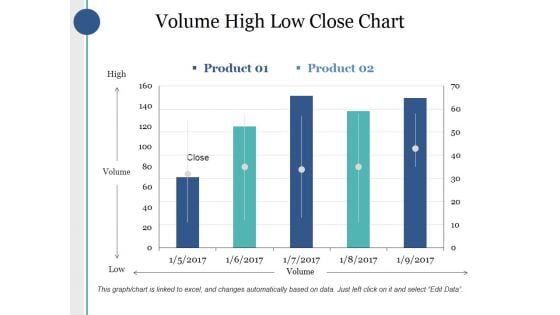
Volume High Low Close Chart Ppt PowerPoint Presentation Infographics Good
This is a volume high low close chart ppt powerpoint presentation infographics good. This is a two stage process. The stages in this process are high, volume, low, product, close.
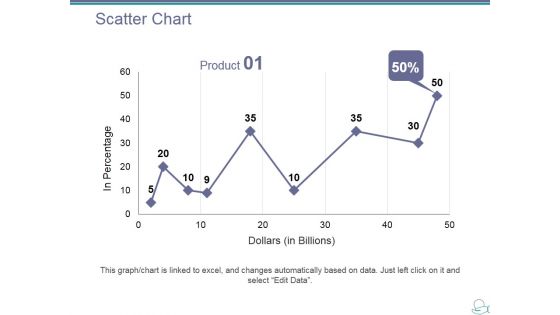
Scatter Chart Ppt PowerPoint Presentation Ideas Designs Download
This is a scatter chart ppt powerpoint presentation ideas designs download. This is a one stage process. The stages in this process are product, dollar, in percentage, growth, success.
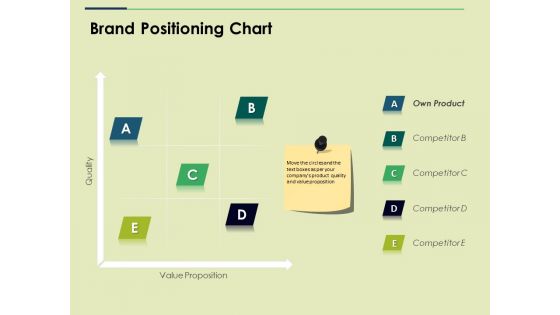
Brand Positioning Chart Ppt PowerPoint Presentation Show Example File
This is a brand positioning chart ppt powerpoint presentation show example file. This is a five stage process. The stages in this process are own product, business, marketing, strategy, analysis.
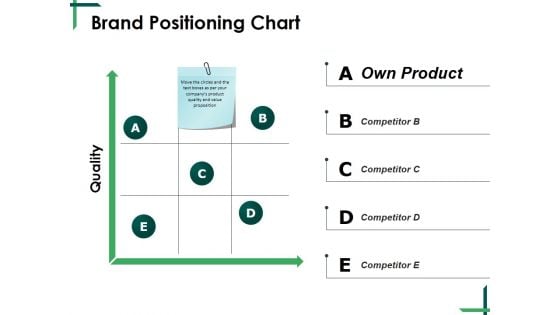
Brand Positioning Chart Ppt PowerPoint Presentation Outline Slide Download
This is a brand positioning chart ppt powerpoint presentation outline slide download. This is a five stage process. The stages in this process are quality, own product, business, management, matrix.
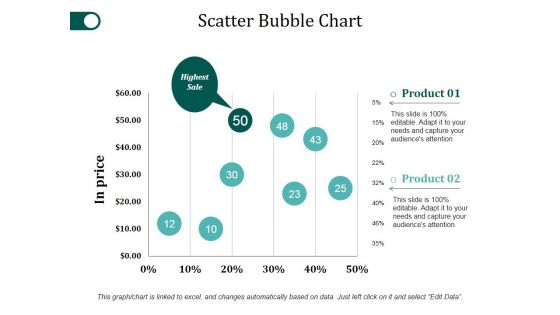
Scatter Bubble Chart Ppt PowerPoint Presentation Styles Objects
This is a scatter bubble chart ppt powerpoint presentation styles objects. This is a two stage process. The stages in this process are product, in price, highest sale, percentage, finance.
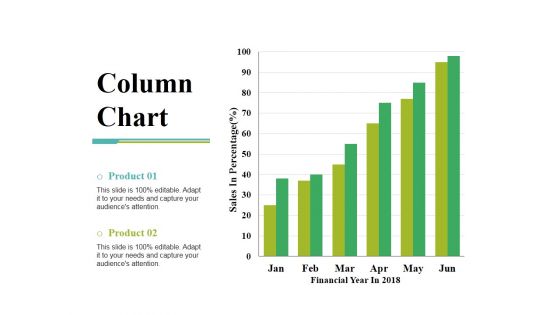
Column Chart Ppt PowerPoint Presentation Gallery Slide Portrait
This is a column chart ppt powerpoint presentation gallery slide portrait. This is a two stage process. The stages in this process are sales in percentage, financial year, product, bar graph, growth.
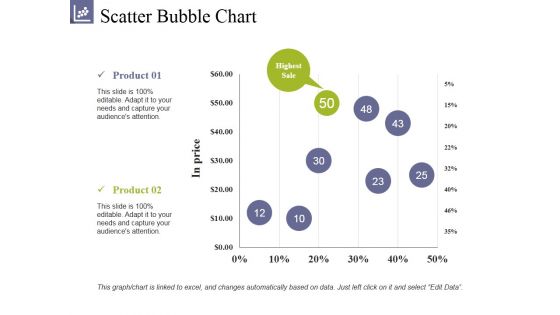
Scatter Bubble Chart Ppt PowerPoint Presentation Summary Clipart
This is a scatter bubble chart ppt powerpoint presentation summary clipart. This is a two stage process. The stages in this process are product, highest sale, in prices, growth, success.
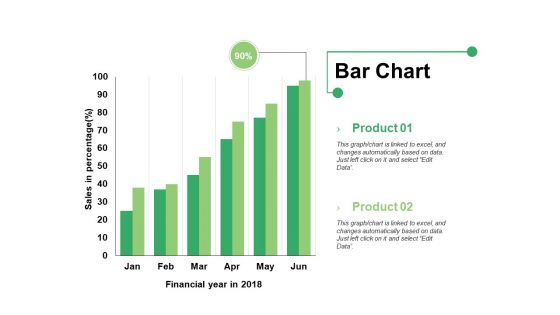
Bar Chart Ppt PowerPoint Presentation Infographics Format Ideas
This is a bar chart ppt powerpoint presentation infographics format ideas. This is a two stage process. The stages in this process are bar graph, product, financial year, sales in percentage.
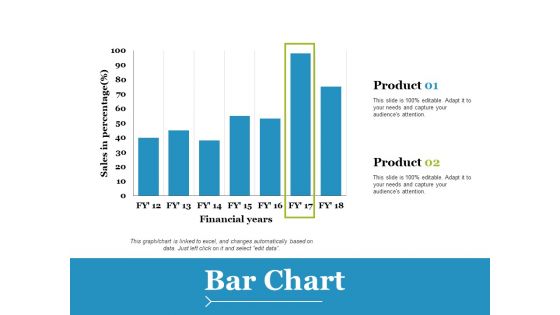
Bar Chart Ppt PowerPoint Presentation Slides Example File
This is a bar chart ppt powerpoint presentation slides example file. This is a two stage process. The stages in this process are product, financial years, sales in percentage.
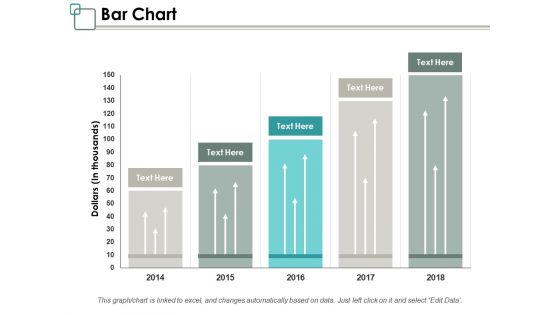
Bar Chart Ppt PowerPoint Presentation Infographic Template Graphics Design
This is a bar chart ppt powerpoint presentation infographic template graphics design. This is a five stage process. The stages in this process are management, marketing, business, percentage, product.
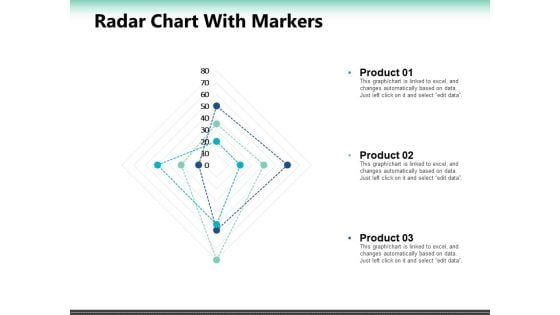
Radar Chart With Markers Ppt PowerPoint Presentation Summary Slide Portrait
This is a radar chart with markers ppt powerpoint presentation summary slide portrait. This is a seven stage process. The stages in this process are percentage, product, business, marketing.
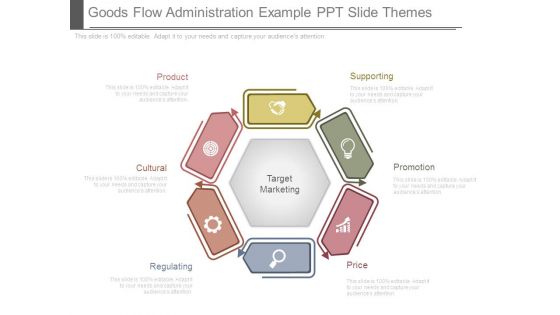
Goods Flow Administration Example Ppt Slide Themes
This is a goods flow administration example ppt slide themes. This is a six stage process. The stages in this process are supporting, promotion, price, regulating, cultural, product, target marketing.

Market Trends Selling Template Powerpoint Themes
This is a market trends selling template powerpoint themes. This is a five stage process. The stages in this process are customer acquisition, customer win back, customer development, fix it improve it make changes, sell the improved product.
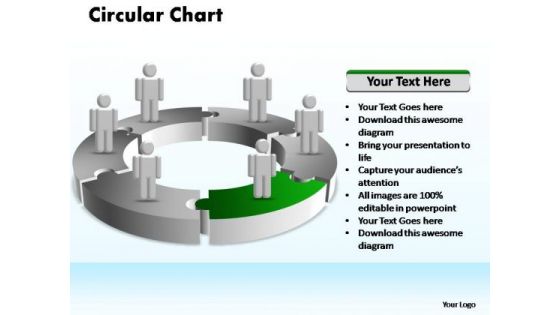
PowerPoint Designs Business Circular Ppt Themes
PowerPoint Designs Business Circular PPT Themes-Highlight the key components of your entire manufacturing/ business process. Illustrate how each element flows seamlessly onto the next stage. Emphasise on any critical or key factors within them. Demonstrate how they all combine to form the final product.-PowerPoint Designs Business Circular PPT Themes Get the nod for your plans with our PowerPoint Designs Business Circular Ppt Themes. You will be at the top of your game.
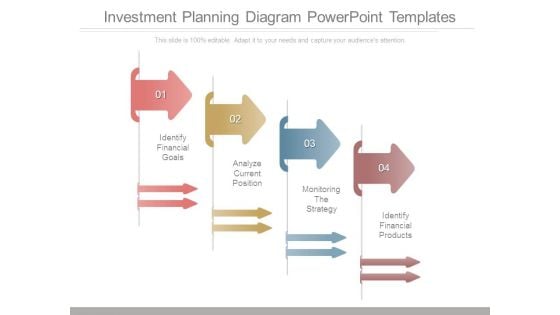
Investment Planning Diagram Powerpoint Templates
This is a investment planning diagram powerpoint templates. This is a four stage process. The stages in this process are identify financial goals, analyze current position, monitoring the strategy, identify financial products.

Brand Extension Diagram Powerpoint Templates
This is a brand extension diagram powerpoint templates. This is a four stage process. The stages in this process are line extension, brand extension, multi brand, new brand, new, existing, brand, product.
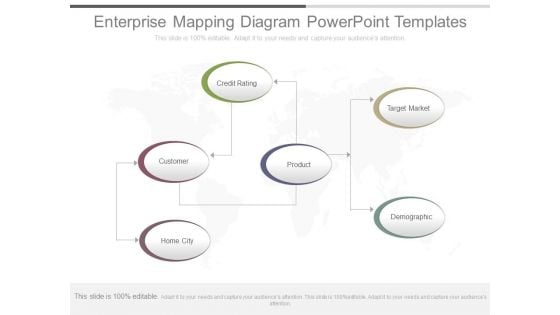
Enterprise Mapping Diagram Powerpoint Templates
This is a enterprise mapping diagram powerpoint templates. This is a six stage process. The stages in this process are home city, customer, credit rating, product, target market, demographic.
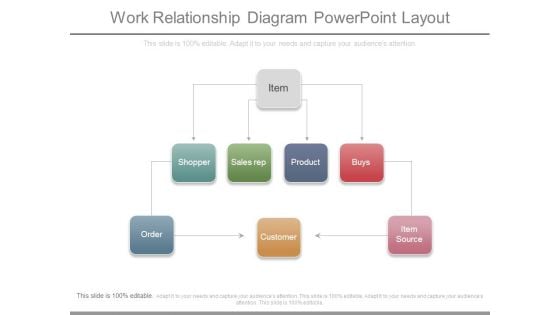
Work Relationship Diagram Powerpoint Layout
This is a work relationship diagram powerpoint layout. This is a seven stage process. The stages in this process are item, shopper, sales rep, product, buys, order, customer, item source.
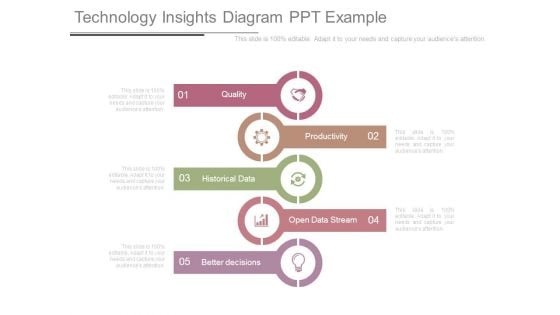
Technology Insights Diagram Ppt Example
This is a technology insights diagram ppt example. This is a five stage process. The stages in this process are quality, productivity, historical data, open data stream, better decisions.
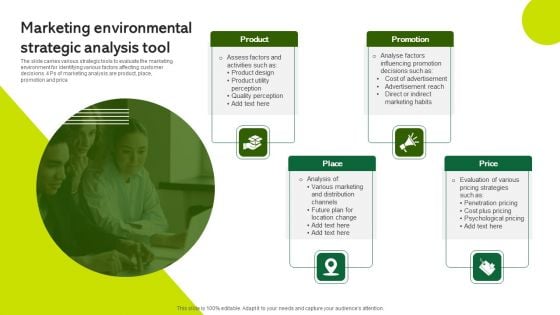
Marketing Environmental Strategic Analysis Tool Themes PDF
The slide carries various strategic tools to evaluate the marketing environment for identifying various factors affecting customer decisions. 4 Ps of marketing analysis are product, place, promotion and price Presenting Marketing Environmental Strategic Analysis Tool Themes PDF to dispense important information. This template comprises four stages. It also presents valuable insights into the topics including Product, Promotion, Place. This is a completely customizable PowerPoint theme that can be put to use immediately. So, download it and address the topic impactfully.
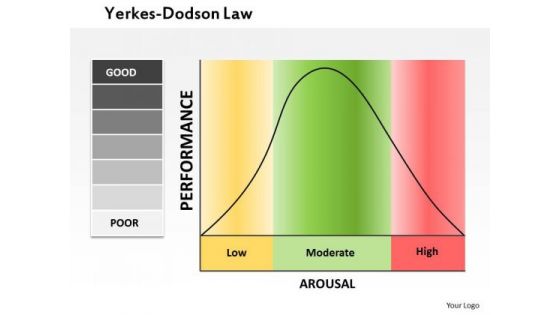
Business Framework The Yerkes Dodson Law PowerPoint Presentation
This business power point diagram has been designed with graphic of curve. This curve is called the Yerkes Dodson law. Use this PPT diagram for your business presentation and deliver a quality product.
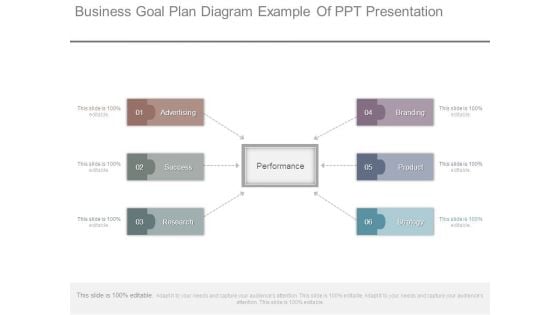
Business Goal Plan Diagram Example Of Ppt Presentation
This is a business goal plan diagram example of ppt presentation. This is a six stage process. The stages in this process are advertising, success, research, branding, product, strategy, performance.
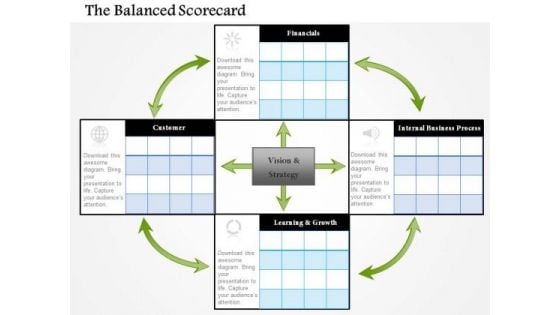
Business Framework The Balanced Scorecard PowerPoint Presentation
This business diagram displays framework for comparison chart. It contains matrix chart for comparison of four products. This diagram enables the users to create their own display of the required processes in an easy way.
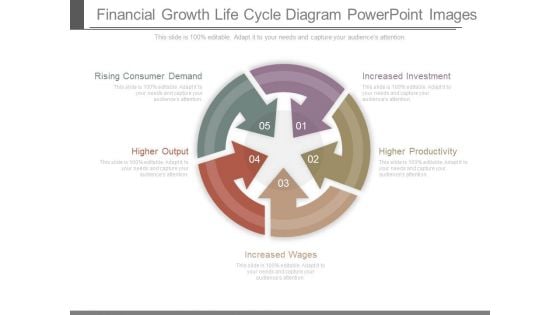
Financial Growth Life Cycle Diagram Powerpoint Images
This is a financial growth life cycle diagram powerpoint images. This is a five stage process. The stages in this process are rising consumer demand, higher output, increased wages, higher productivity, increased investment.
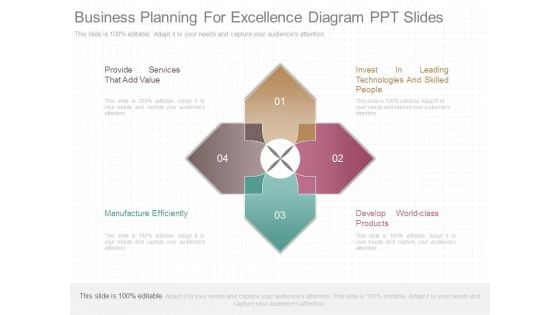
Business Planning For Excellence Diagram Ppt Slides
This is a business planning for excellence diagram ppt slides. This is a four stage process. The stages in this process are provide services that add value, manufacture efficiently, invest in leading technologies and skilled people, develop world class products.
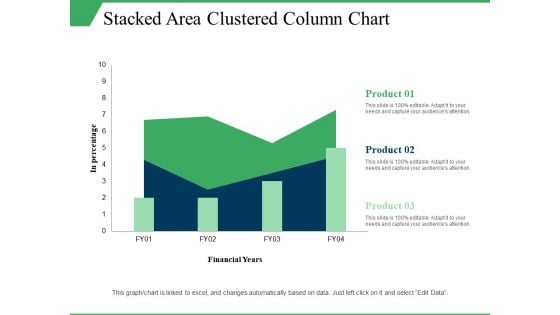
Stacked Area Clustered Column Chart Ppt PowerPoint Presentation Visual Aids Model
This is a stacked area clustered column chart ppt powerpoint presentation visual aids model. This is a three stage process. The stages in this process are in percentage, product, financial years, growth, column chart.
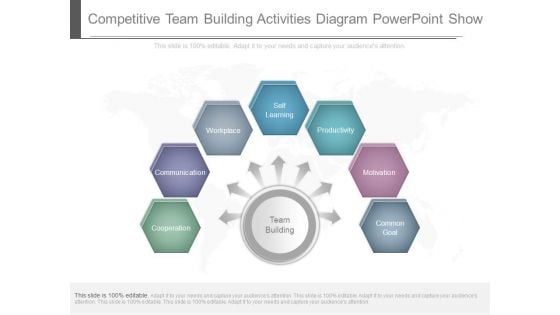
Competitive Team Building Activities Diagram Powerpoint Show
This is a competitive team building activities diagram powerpoint show. This is a seven stage process. The stages in this process are cooperation, communication, workplace, self learning, productivity, motivation, common goal, team building.
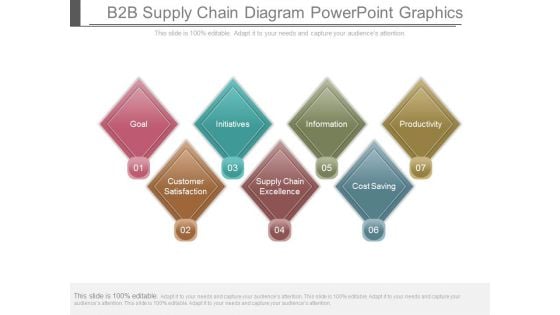
B2b Supply Chain Diagram Powerpoint Graphics
This is a b2b supply chain diagram powerpoint graphics. This is a seven stage process. The stages in this process are goal, initiatives, information, productivity, customer satisfaction, supply chain excellence, cost saving.

 Home
Home