Profit Growth
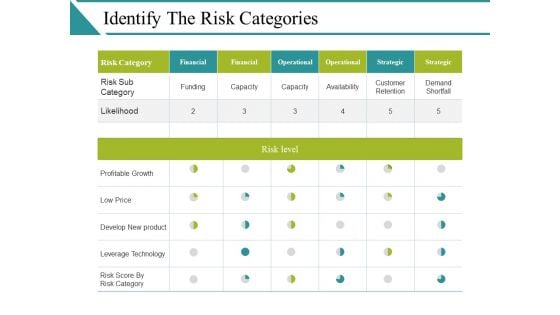
Identify The Risk Categories Ppt PowerPoint Presentation Model Vector
This is a identify the risk categories ppt powerpoint presentation model vector. This is a seven stage process. The stages in this process are risk sub category, likelihood, profitable growth, low price, develop new product.
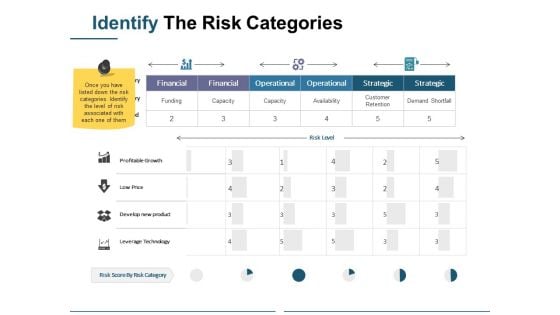
Identify The Risk Categories Ppt PowerPoint Presentation Professional Infographics
This is a identify the risk categories ppt powerpoint presentation professional infographics. This is a three stage process. The stages in this process are business, marketing, financial, operational, strategic, profitable growth.
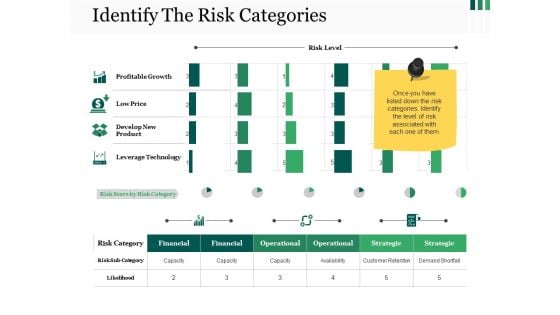
Identify The Risk Categories Ppt PowerPoint Presentation Styles Backgrounds
This is a identify the risk categories ppt powerpoint presentation styles backgrounds. This is a four stage process. The stages in this process are profitable growth, low price, develop new product, leverage technology.

Identify The Risk Categories Ppt PowerPoint Presentation Gallery Background Images
This is a identify the risk categories ppt powerpoint presentation gallery background images. This is a seven stage process. The stages in this process are financial, operational, profitable growth.
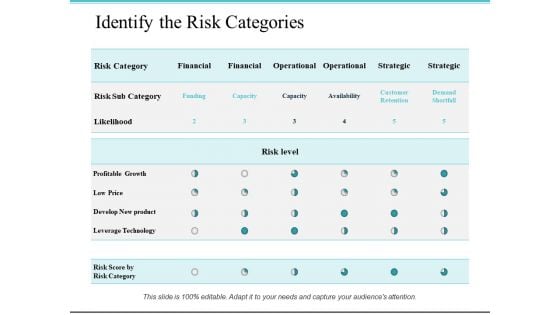
Identify The Risk Categories Ppt PowerPoint Presentation Styles Objects
This is a identify the risk categories ppt powerpoint presentation styles objects. This is a seven stage process. The stages in this process are leverage technology, develop new product, profitable growth.
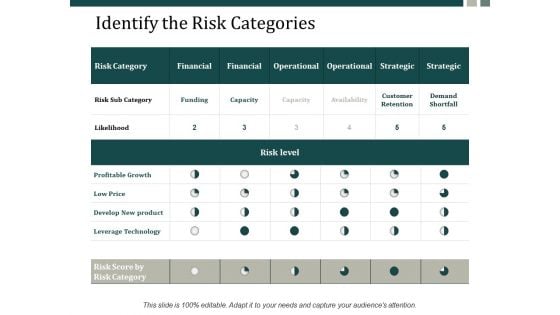
Identify The Risk Categories Ppt Powerpoint Presentation Infographics Structure Ppt Powerpoint Presentation Gallery Summary
This is a identify the risk categories ppt powerpoint presentation infographics structure ppt powerpoint presentation gallery summary. This is a six stage process. The stages in this process are financial, operational, strategic, capacity, profitable growth.
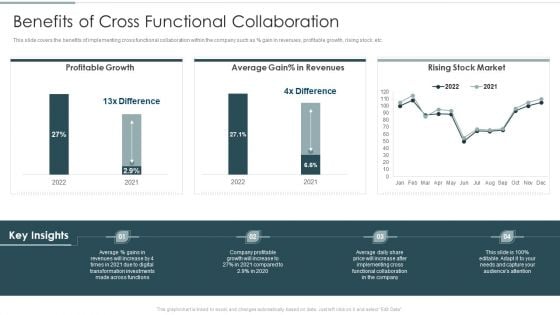
Continuous Team Development Culture Benefits Of Cross Functional Collaboration Rules PDF
This slide covers the benefits of implementing cross functional collaboration within the company such as precent gain in revenues, profitable growth, rising stock, etc.Deliver and pitch your topic in the best possible manner with this Continuous Team Development Culture Benefits Of Cross Functional Collaboration Rules PDF. Use them to share invaluable insights on Profitable Growth, Stock Market, Average Gain and impress your audience. This template can be altered and modified as per your expectations. So, grab it now.
Stacked Column Ppt PowerPoint Presentation Icon Slides
This is a stacked column ppt powerpoint presentation icon slides. This is a two stage process. The stages in this process are profit, business, marketing, graph, growth.

Pie Chart With Increasing Percentage Values Powerpoint Slides
This PowerPoint template has been designed with diagram of pie chart with increasing percentage values. This PPT slide can be used to prepare presentations for profit growth report and also for financial data analysis. You can download finance PowerPoint template to prepare awesome presentations.

Scatter Bubble Chart Ppt PowerPoint Presentation Professional Model
This is a scatter bubble chart ppt powerpoint presentation professional model. This is a six stage process. The stages in this process are sales in profit, financial year, growth, business, marketing, strategy.
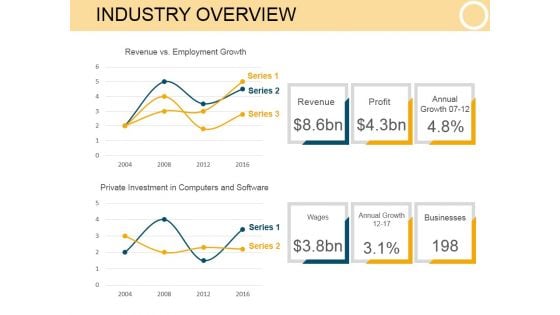
Industry Overview Template 1 Ppt PowerPoint Presentation Show
This is a industry overview template 1 ppt powerpoint presentation show. This is a six stage process. The stages in this process are revenue, profit, annual growth, wages, businesses.
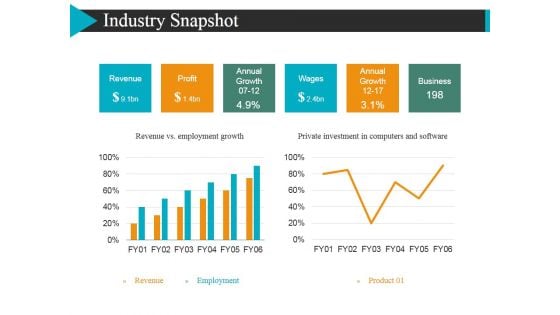
Industry Snapshot Template 2 Ppt Powerpoint Presentation Layouts Sample
This is a industry snapshot template 2 ppt powerpoint presentation layouts sample. This is a two stage process. The stages in this process are revenue, profit, annual growth, wages.
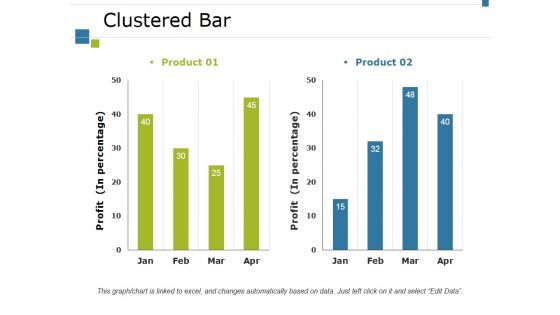
Clustered Bar Ppt PowerPoint Presentation Styles Portfolio
This is a clustered bar ppt powerpoint presentation styles portfolio. This is a two stage process. The stages in this process are product, profit, bar graph, growth, success.
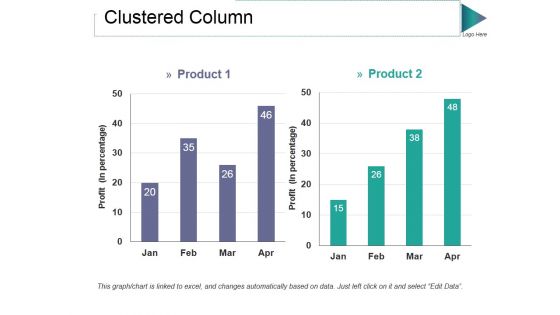
Clustered Column Ppt PowerPoint Presentation Professional Styles
This is a clustered column ppt powerpoint presentation professional styles. This is a two stage process. The stages in this process are product, profit, bar graph, growth, success.
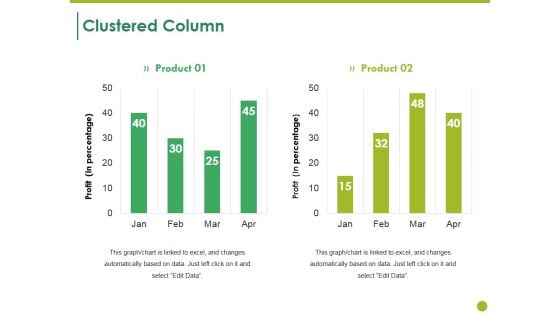
Clustered Column Ppt PowerPoint Presentation Layouts Ideas
This is a clustered column ppt powerpoint presentation layouts ideas. This is a two stage process. The stages in this process are product, profit, bar graph, growth, finance.
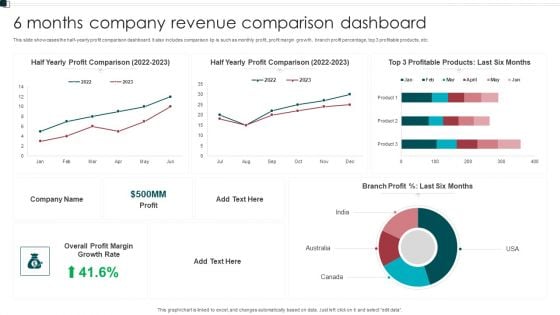
6 Months Company Revenue Comparison Dashboard Graphics PDF
This slide showcases the half yearly profit comparison dashboard. It also includes comparison kp is such as monthly profit, profit margin growth, branch profit percentage, top 3 profitable products, etc. Showcasing this set of slides titled 6 Months Company Revenue Comparison Dashboard Graphics PDF. The topics addressed in these templates are Growth Rate, Overall Profit Margin, Branch Profit. All the content presented in this PPT design is completely editable. Download it and make adjustments in color, background, font etc. as per your unique business setting.
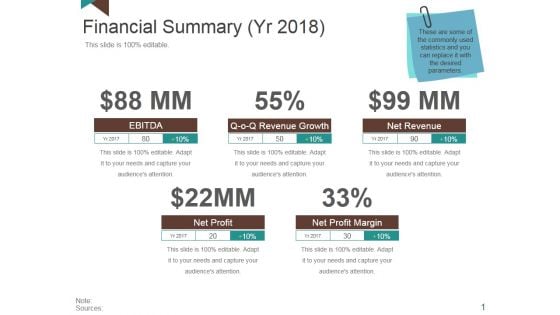
Financial Summary Ppt PowerPoint Presentation Layouts Portrait
This is a financial summary ppt powerpoint presentation layouts portrait. This is a four stage process. The stages in this process are ebitda, revenue growth, net revenue, net profit margin, net profit.
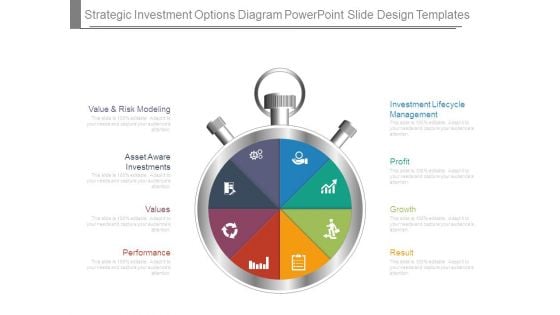
Strategic Investment Options Diagram Powerpoint Slide Design Templates
This is a strategic investment options diagram powerpoint slide design templates. This is a eight stage process. The stages in this process are value and risk modeling, asset aware investments, values, performance, investment lifecycle management, profit, growth, result.
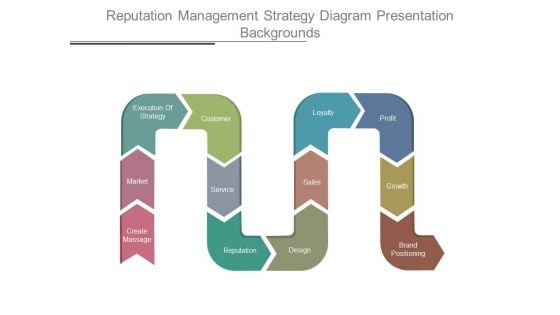
Reputation Management Strategy Diagram Presentation Backgrounds
This is a reputation management strategy diagram presentation backgrounds. This is a twelve stage process. The stages in this process are create massage, market, execution of strategy, customer, service, reputation, design, sales, loyalty, profit, growth, brand positioning.
Civil Contractors Construction Competitive Analysis Competitive Ppt Icon Format Ideas PDF
This slide covers the competitor analysis of our company and the construction industry wherein focus is on its foundation, headquarters, services offered, net sales growth, net profit growth, etc. Deliver an awe-inspiring pitch with this creative civil contractors construction competitive analysis competitive ppt icon format ideas pdf bundle. Topics like our company, competitor, services offered, headquarters, net sales growth rate can be discussed with this completely editable template. It is available for immediate download depending on the needs and requirements of the user.
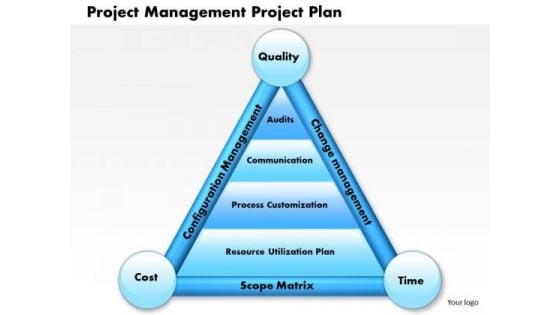
Business Framework Project Management Project Plan PowerPoint Presentation
This innovative diagram displays graphic for profitability manufacturing growth. Use this diagram in your business and marketing presentations to depict global growth and success factors. This diagram will enhance the quality of your presentations.
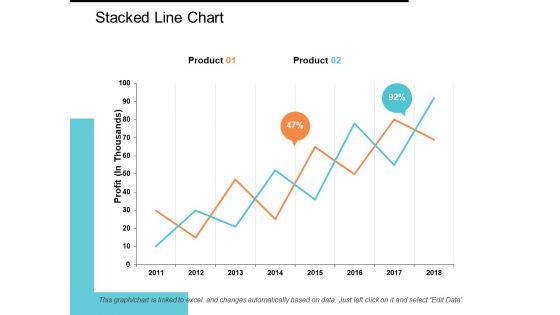
Stacked Line Chart Ppt PowerPoint Presentation Model Show
This is a stacked line chart ppt powerpoint presentation model show. This is a two stage process. The stages in this process are stacked line chart, product, profit, percentage, growth.
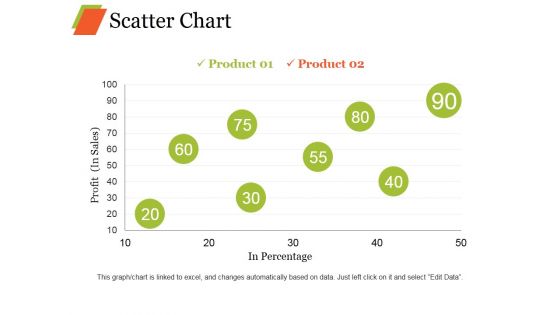
Scatter Chart Ppt PowerPoint Presentation Professional Graphic Images
This is a scatter chart ppt powerpoint presentation professional graphic images. This is a eight stage process. The stages in this process are product, profit, in percentage growth, business.
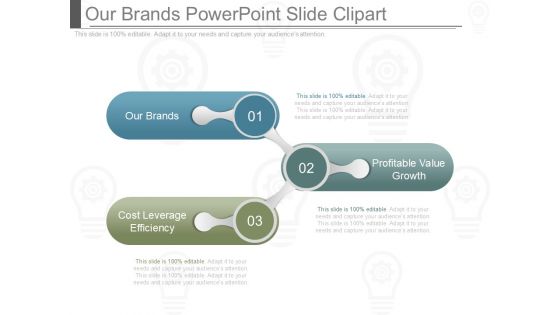
Our Brands Powerpoint Slide Clipart

Corporate Mission Diagram Ppt Presentation Examples
This is a corporate mission diagram ppt presentation examples. This is a five stage process. The stages in this process are resources, profitability efficiency, growth, organization, control.
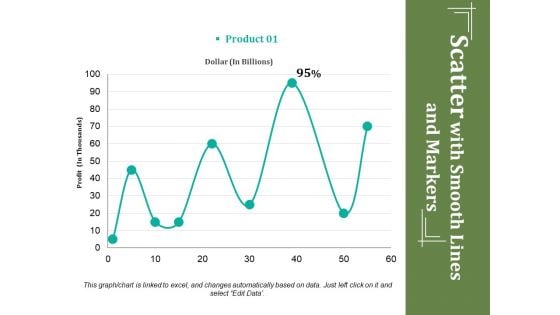
Scatter With Smooth Lines And Markers Ppt PowerPoint Presentation Ideas Deck
This is a scatter with smooth lines and markers ppt powerpoint presentation ideas deck. This is a one stage process. The stages in this process are profit, dollar, percentage, business, growth.
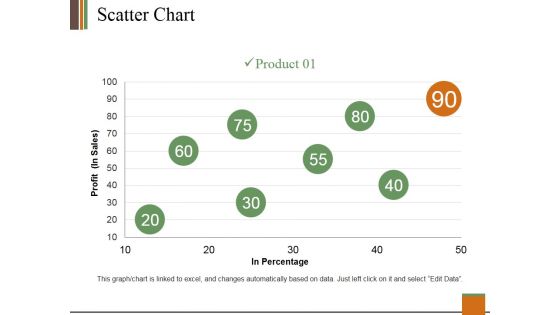
Scatter Chart Ppt PowerPoint Presentation Gallery Guide
This is a scatter chart ppt powerpoint presentation gallery guide. This is a one stage process. The stages in this process are profit, product, in percentage, growth, success.
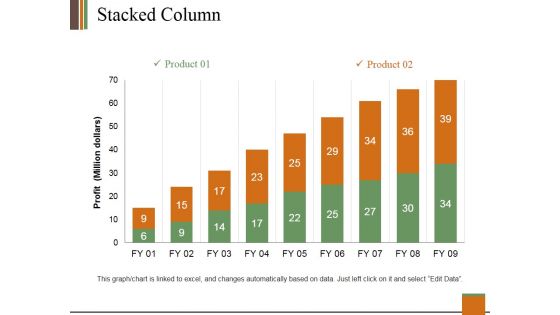
Stacked Column Ppt PowerPoint Presentation Outline Information
This is a stacked column ppt powerpoint presentation outline information. This is a two stage process. The stages in this process are profit, product, bar graph, growth, success.
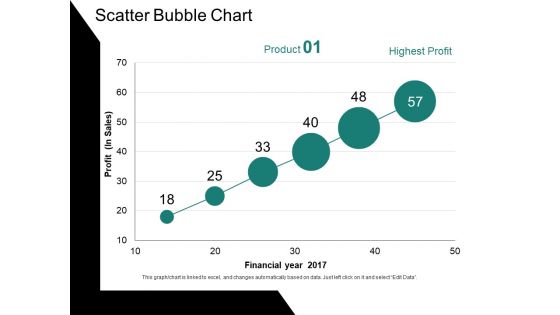
Scatter Bubble Chart Ppt PowerPoint Presentation Ideas Gallery
This is a scatter bubble chart ppt powerpoint presentation ideas gallery. This is a six stage process. The stages in this process are profit, financial year, chart, business, growth.
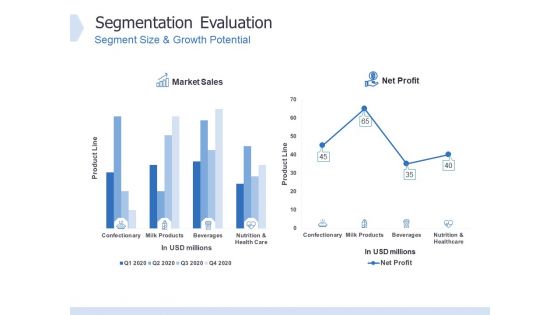
Global Market Segmentation Segmentation Evaluation Ppt PowerPoint Presentation Infographics Sample PDF
Presenting this set of slides with name global market segmentation segmentation evaluation ppt powerpoint presentation infographics sample pdf. The topics discussed in these slides are market sales, net profit, growth potential, confectionary, nutrition and healthcare, milk products, beverages. This is a completely editable PowerPoint presentation and is available for immediate download. Download now and impress your audience.
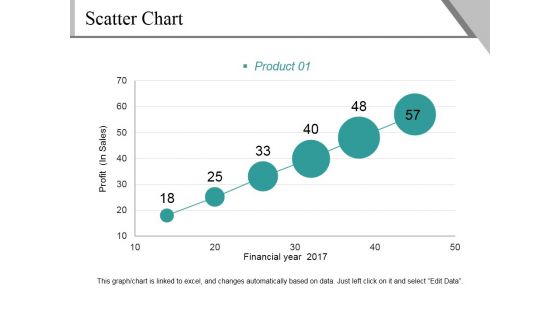
Scatter Chart Ppt PowerPoint Presentation File Background Image
This is a scatter chart ppt powerpoint presentation file background image. This is a six stage process. The stages in this process are profit, financial year, product, growth, success.
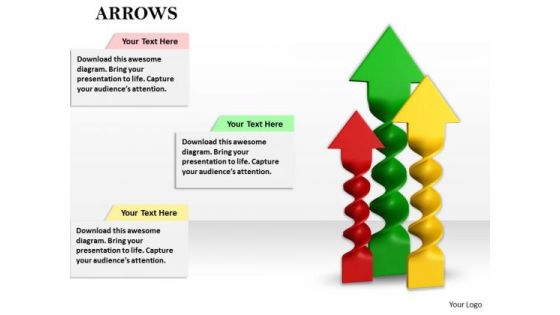
Stock Photo Colorful Arrows In Upward Position PowerPoint Slide
This graphic image slide has been crafted with graphic of colorful twisted arrows. These arrows are in upward direction which shows the concept of profit and growth. Use this image slide in your business and finance related presentations.
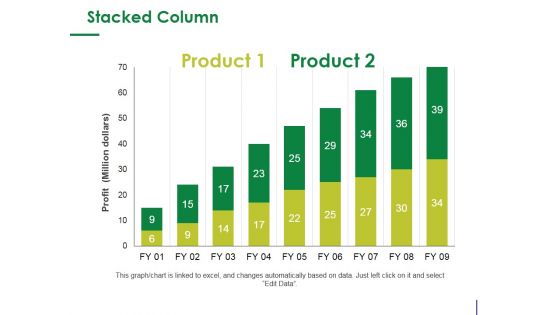
Stacked Column Ppt PowerPoint Presentation Infographic Template Design Ideas
This is a stacked column ppt powerpoint presentation infographic template design ideas. This is a two stage process. The stages in this process are product, profit, bar graph, growth, success.
Scatter Chart Ppt PowerPoint Presentation Icon Example Introduction
This is a scatter chart ppt powerpoint presentation icon example introduction. This is a two stage process. The stages in this process are product, profit, in percentage, growth, scattered chart.

Area Chart Ppt PowerPoint Presentation Infographic Template Layout
This is a area chart ppt powerpoint presentation infographic template layout. This is a two stage process. The stages in this process are product, profit, area chart, growth, success.
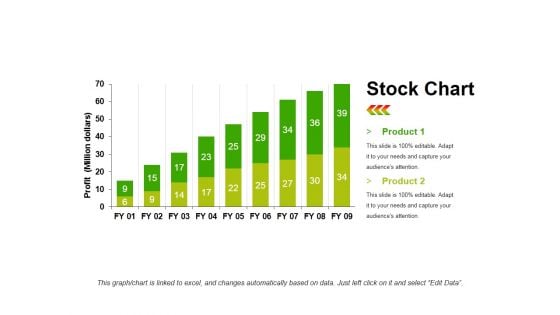
Stock Chart Template 1 Ppt PowerPoint Presentation Infographic Template Objects
This is a stock chart template 1 ppt powerpoint presentation infographic template objects. This is a two stage process. The stages in this process are product, profit, bar graph, growth, success.

Stock Photo Dollar Symbol Bar Graph With Cubes PowerPoint Slide
This image slide contains bar graph of cubes with dollar symbol. This image is designed with dollar growth graph. Use this slide to display growth of profit in business presentations. Make an impressive presentation by using this image.
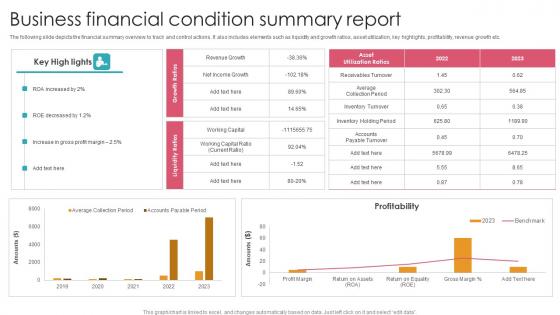
Business Financial Condition Summary Report Graphics Pdf
The following slide depicts the financial summary overview to track and control actions. It also includes elements such as liquidity and growth ratios, asset utilization, key highlights, profitability, revenue growth etc. Pitch your topic with ease and precision using this Business Financial Condition Summary Report Graphics Pdf. This layout presents information on Profitability, Increase Gross Profit Margin, Roe Decreased. It is also available for immediate download and adjustment. So, changes can be made in the color, design, graphics or any other component to create a unique layout. The following slide depicts the financial summary overview to track and control actions. It also includes elements such as liquidity and growth ratios, asset utilization, key highlights, profitability, revenue growth etc.
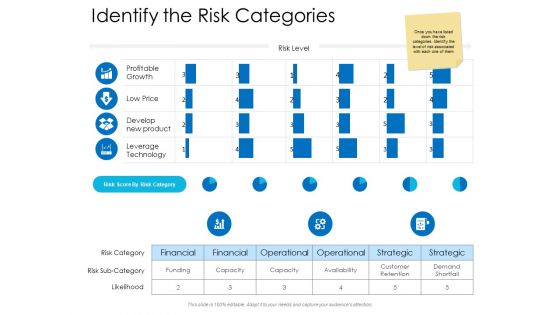
Identify The Risk Categories Ppt Powerpoint Presentation Ideas Graphic Tips
Presenting this set of slides with name identify the risk categories ppt powerpoint presentation ideas graphic tips. The topics discussed in these slides are risk categories, profitable growth, leverage technology, strategic, financial. This is a completely editable PowerPoint presentation and is available for immediate download. Download now and impress your audience.
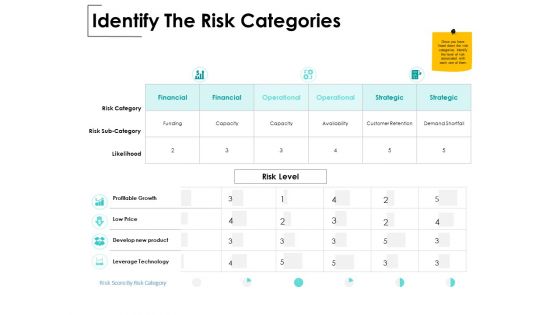
Identify The Risk Categories Ppt PowerPoint Presentation Inspiration Guide
Presenting this set of slides with name identify the risk categories ppt powerpoint presentation inspiration guide. The topics discussed in these slides are risk category, financial, operational, strategic, capacity, profitable growth, low price, develop new product, leverage technology. This is a completely editable PowerPoint presentation and is available for immediate download. Download now and impress your audience.
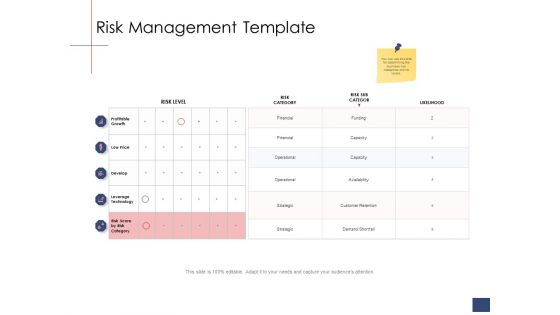
Business Assessment Outline Risk Management Template Ppt Professional Graphic Images PDF
Deliver and pitch your topic in the best possible manner with this business assessment outline risk management template ppt professional graphic images pdf. Use them to share invaluable insights on profitable growth, low price, develop, leverage technology, risk score, risk category, risk level and impress your audience. This template can be altered and modified as per your expectations. So, grab it now.
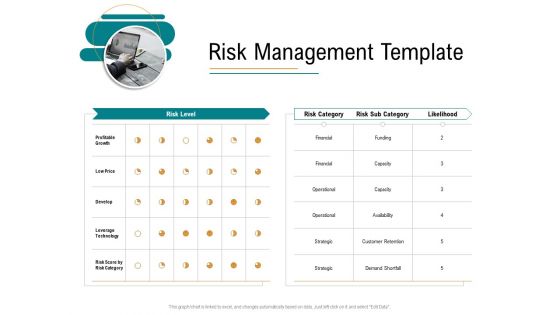
Business Operations Assessment Risk Management Template Ppt Ideas Example PDF
Deliver and pitch your topic in the best possible manner with this business operations assessment risk management template ppt ideas example pdf. Use them to share invaluable insights on profitable growth, low price, develop, leverage technology, risk score, risk category, risk level and impress your audience. This template can be altered and modified as per your expectations. So, grab it now.
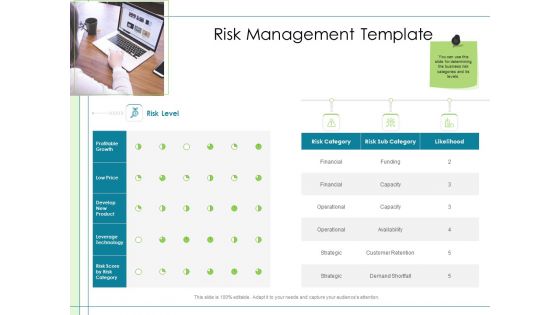
In Depth Business Assessment Risk Management Template Ppt Gallery Objects PDF
Deliver and pitch your topic in the best possible manner with this in depth business assessment risk management template ppt gallery objects pdf. Use them to share invaluable insights on profitable growth, low price, develop, leverage technology, risk score, risk category, risk level and impress your audience. This template can be altered and modified as per your expectations. So, grab it now.
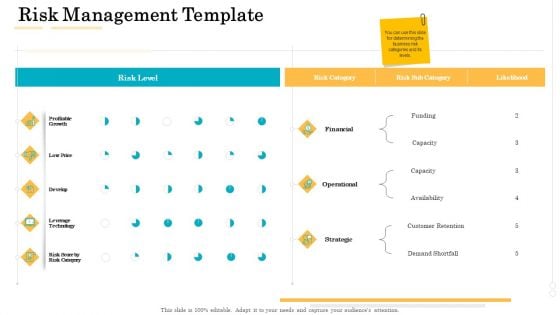
Administrative Regulation Risk Management Template Ppt PowerPoint Presentation File Rules PDF
Deliver and pitch your topic in the best possible manner with this administrative regulation risk management template ppt powerpoint presentation file rules pdf. Use them to share invaluable insights on profitable growth, low price, develop, leverage technology, risk score, risk category, risk level and impress your audience. This template can be altered and modified as per your expectations. So, grab it now.
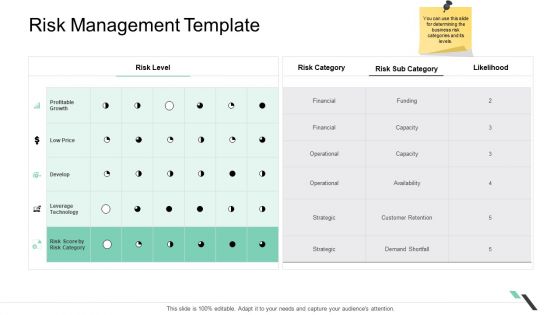
Business Functions Administration Risk Management Template Inspiration PDF
Deliver an awe-inspiring pitch with this creative business functions administration risk management template inspiration pdf. bundle. Topics like profitable growth, financial, leverage technology can be discussed with this completely editable template. It is available for immediate download depending on the needs and requirements of the user.
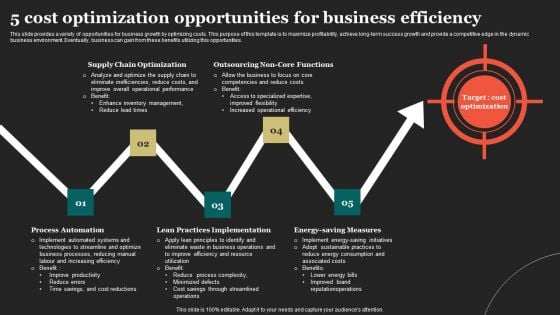
5 Cost Optimization Opportunities For Business Efficiency Topics PDF
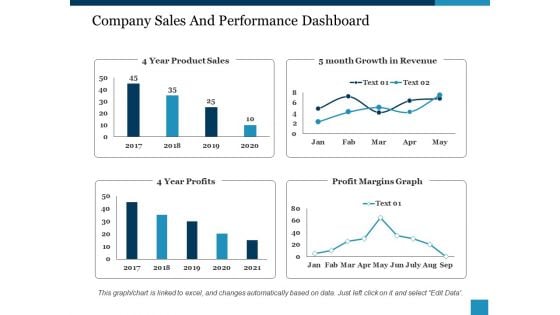
Company Sales And Performance Dashboard Ppt PowerPoint Presentation Show Structure
This is a company sales and performance dashboard ppt powerpoint presentation show structure. This is a four stage process. The stages in this process are year product sales, month growth in revenue, profit margins graph, year profits.

Scatter Bubble Chart Ppt PowerPoint Presentation Professional Graphics Pictures
This is a scatter bubble chart ppt powerpoint presentation professional graphics pictures. This is a one stage process. The stages in this process are profit in sales, financial year, highest profit, product.
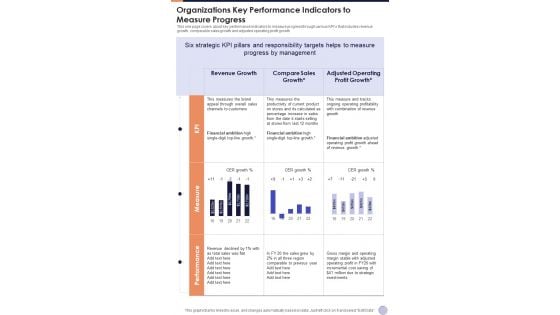
Organizations Key Performance Indicators To Measure Progress One Pager Documents
This one page covers about key performance indicators to measure progress through various KPIs that includes revenue growth, comparable sales growth and adjusted operating profit growth. Presenting you a fantastic Organizations Key Performance Indicators To Measure Progress One Pager Documents. This piece is crafted on hours of research and professional design efforts to ensure you have the best resource. It is completely editable and its design allow you to rehash its elements to suit your needs. Get this Organizations Key Performance Indicators To Measure Progress One Pager Documents A4 One-pager now.
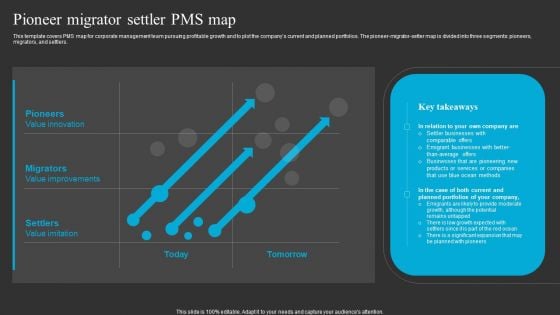
Pioneer Migrator Settler Pms Map Ppt Slides Layout Ideas PDF
This template covers PMS map for corporate management team pursuing profitable growth and to plot the companys current and planned portfolios. The pioneer-migrator-setter map is divided into three segments pioneers, migrators, and settlers. There are so many reasons you need a Pioneer Migrator Settler Pms Map Ppt Slides Layout Ideas PDF. The first reason is you can not spend time making everything from scratch, Thus, Slidegeeks has made presentation templates for you too. You can easily download these templates from our website easily.
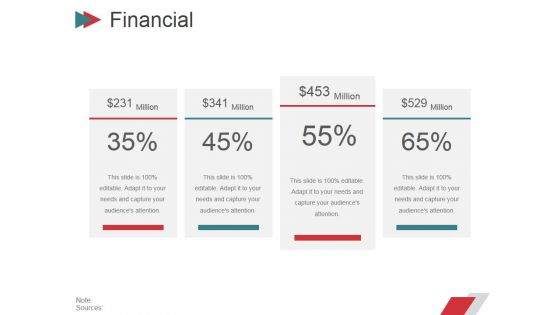
Financial Ppt PowerPoint Presentation Gallery Design Ideas
This is a financial ppt powerpoint presentation gallery design ideas. This is a five stage process. The stages in this process are ebitda, net profit, revenue, growth, net revenue, net profit, margin.
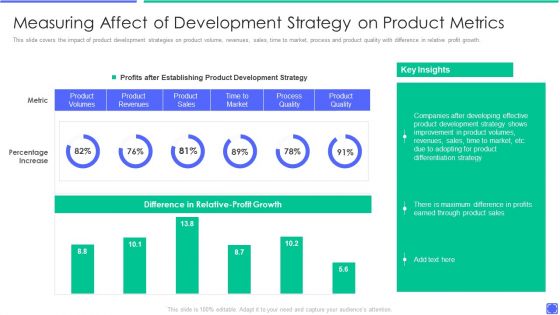
Best Techniques To Enhance New Product Management Efficiency Measuring Affect Of Development Inspiration PDF
This slide covers the impact of product development strategies on product volume, revenues, sales, time to market, process and product quality with difference in relative profit growth. Deliver an awe inspiring pitch with this creative best techniques to enhance new product management efficiency kpis to measure customer pictures pdf bundle. Topics like measuring affect of development strategy on product metrics can be discussed with this completely editable template. It is available for immediate download depending on the needs and requirements of the user.
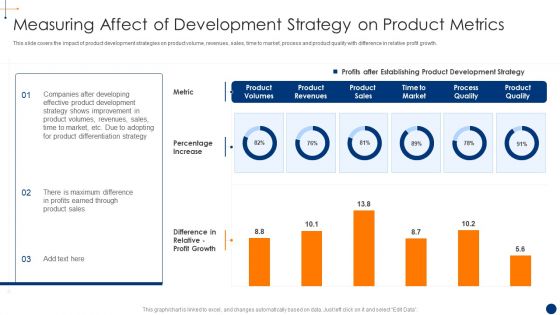
New Product Development Process Optimization Measuring Affect Of Development Professional PDF
This slide covers the impact of product development strategies on product volume, revenues, sales, time to market, process and product quality with difference in relative profit growth. Deliver and pitch your topic in the best possible manner with this new product development process optimization measuring affect of development professional pdf . Use them to share invaluable insights on dashboard depicting product usage metrics and impress your audience. This template can be altered and modified as per your expectations. So, grab it now.
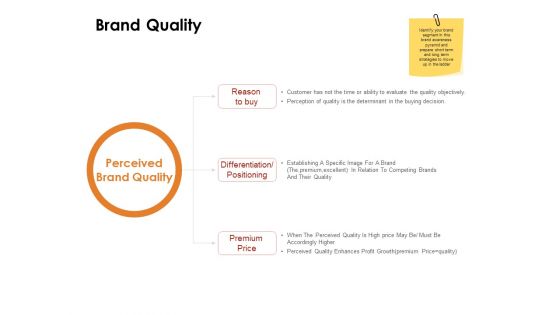
Label Identity Design Brand Quality Ppt PowerPoint Presentation Professional Guidelines PDF
This is a label identity design brand quality ppt powerpoint presentation professional guidelines pdf template with various stages. Focus and dispense information on three stages using this creative set, that comes with editable features. It contains large content boxes to add your information on topics like reason buy, differentiation positioning, premium price, perceived brand quality, enhances profit growth, perceived quality, premium, excellent, competing brands. You can also showcase facts, figures, and other relevant content using this PPT layout. Grab it now.
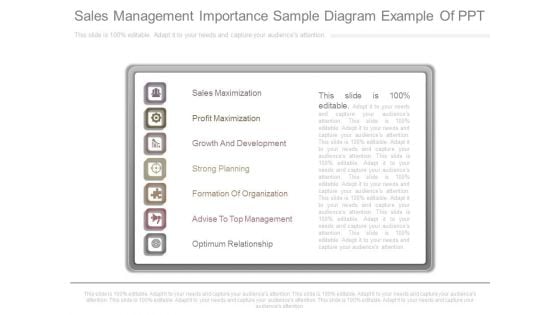
Sales Management Importance Sample Diagram Example Of Ppt
This is a sales management importance sample diagram example of ppt. This is a seven stage process. The stages in this process are sales maximization, profit maximization, growth and development, strong planning, formation of organization, advise to top management, optimum relationship.
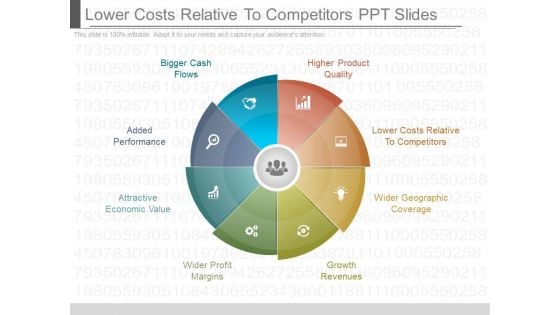
Lower Costs Relative To Competitors Ppt Slides
This is a lower costs relative to competitors ppt slides. This is a eight stage process. The stages in this process are bigger cash flows, added performance, attractive economic value, wider profit margins, growth revenues, wider geographic coverage, lower costs relative to competitors, higher product quality.
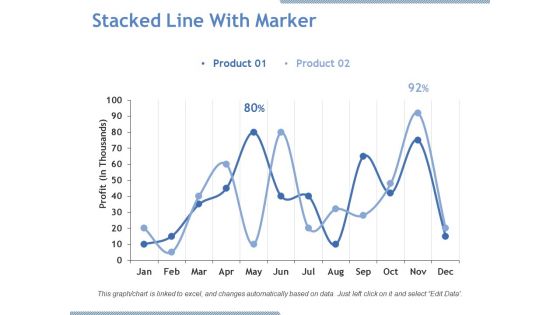
Stacked Line With Marker Ppt PowerPoint Presentation Pictures Graphics Download
This is a stacked line with marker ppt powerpoint presentation pictures graphics download. This is a two stage process. The stages in this process are product, profit, line chart, business, growth.
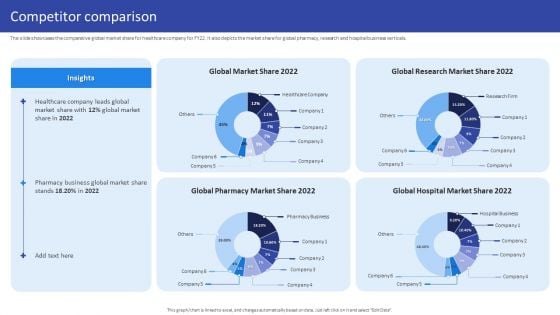
Hospital Medical Research Company Profile Competitor Comparison Inspiration PDF
The slide showcases the healthcare company historical yearly growth for profit and revenue. It also showcases comparative revenue and profit year on year growth for pharmacy, hospital and research business verticals. Deliver an awe inspiring pitch with this creative Hospital Medical Research Company Profile Competitor Comparison Inspiration PDF bundle. Topics like Global Market, Share 2022, Global Research, Market Share 2022 can be discussed with this completely editable template. It is available for immediate download depending on the needs and requirements of the user.
Business Progress Upward Arrow Graph Vector Icon Ppt Powerpoint Presentation Model Images
This is a business progress upward arrow graph vector icon ppt powerpoint presentation model images. This is a four stage process. The stages in this process are market growth, market opportunity, market profitability.
Dollar Raise Money Investment Vector Icon Ppt Powerpoint Presentation Inspiration Outline
This is a dollar raise money investment vector icon ppt powerpoint presentation inspiration outline. This is a four stage process. The stages in this process are market growth, market opportunity, market profitability.


 Continue with Email

 Home
Home


