Profit Growth
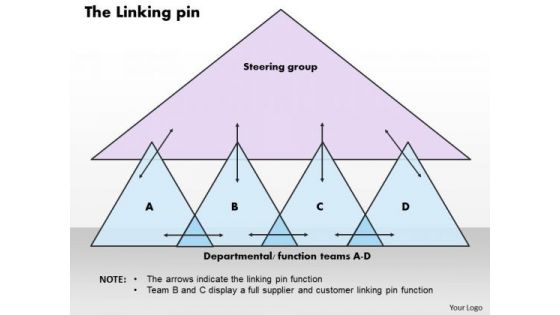
The Linking Pin Business PowerPoint Presentation
Double Your Chances With Our The Linking Pin Business Powerpoint Presentation Powerpoint Templates. The Value Of Your Thoughts Will Increase Two-Fold. Charm The Audience With Your Thoughts. Add Our shapes Powerpoint Templates And They Will Be Dotty For You.
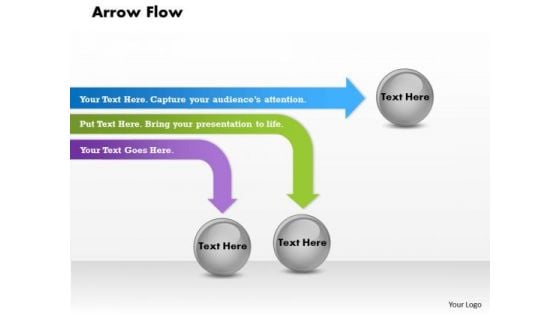
Arrow Flow PowerPoint Presentation Template
Get The Domestics Right With Our Arrow flow PowerPoint Presentation Template Powerpoint Templates. Create The Base For Thoughts To Grow. Do Away With Dogmatic Approaches. Establish The Value Of Reason With Our Business Charts Powerpoint Templates.
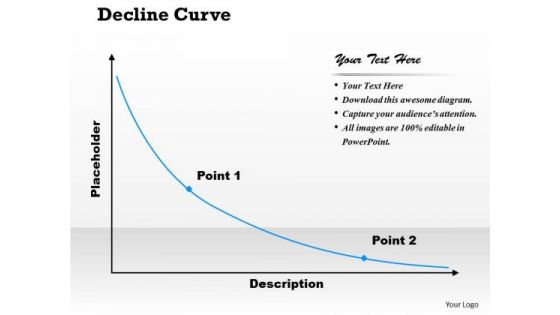
Decline Curve PowerPoint Presentation Template
Double Your Chances With Our Decline Curve PowerPoint Presentation Template Powerpoint Templates. The Value Of Your Thoughts Will Increase Two-Fold. Charm The Audience With Your Thoughts. Add Our Business Process Powerpoint Templates And They Will Be Dotty For You.
5 Vs Large Data Sets Applications Circular Icons Ppt PowerPoint Presentation Picture
This is a 5 vs large data sets applications circular icons ppt powerpoint presentation picture. This is a five stage process. The stages in this process are big data, volume, velocity, variety, veracity, value.
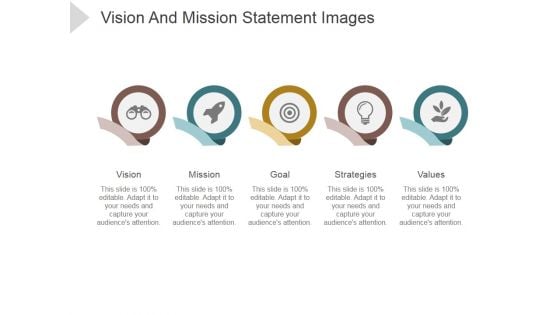
Vision And Mission Statement Images Ppt PowerPoint Presentation Ideas
This is a vision and mission statement images ppt powerpoint presentation ideas. This is a five stage process. The stages in this process are vision, mission, goal, strategies, values.
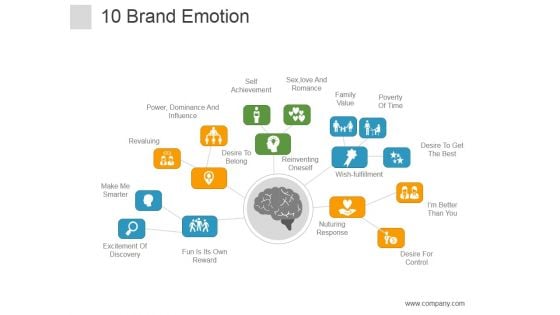
Brand Emotion Ppt PowerPoint Presentation Deck
This is a brand emotion ppt powerpoint presentation deck. This is a one stage process. The stages in this process are self achievement, sex love and romance, desire to belong, reinventing oneself, family value, poverty of time.
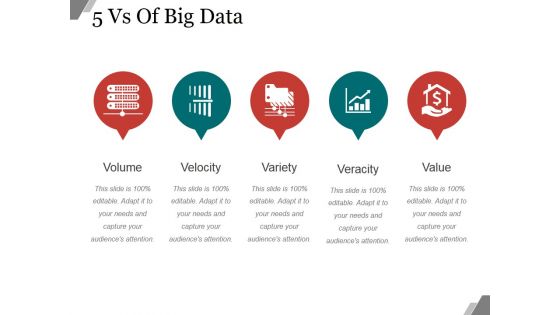
5 Vs Of Big Data Ppt PowerPoint Presentation Microsoft
This is a 5 vs of big data ppt powerpoint presentation microsoft. This is a five stage process. The stages in this process are volume, velocity, variety, veracity, value.

Budgeting Planned Actual Comparison Ppt PowerPoint Presentation Shapes
This is a budgeting planned actual comparison ppt powerpoint presentation shapes. This is a three stage process. The stages in this process are planned cost, actual cost, value difference, finance, timeline.
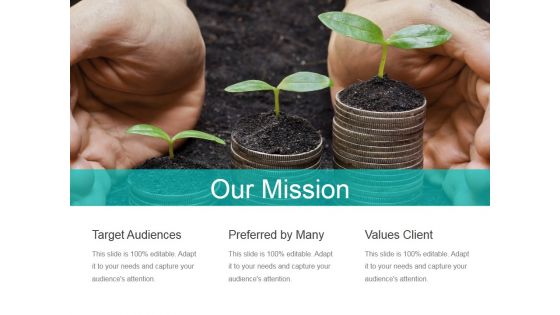
Our Mission Ppt PowerPoint Presentation Model Design Templates
This is a our mission ppt powerpoint presentation model design templates. This is a three stage process. The stages in this process are target audiences, preferred by many, values client.
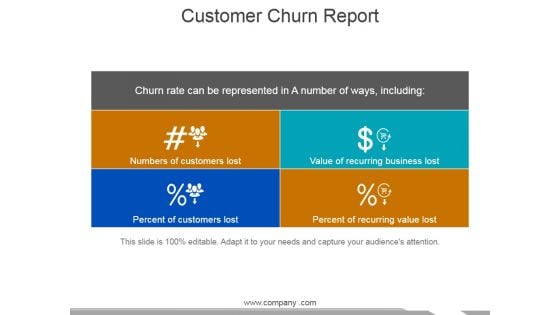
Customer Churn Report Ppt PowerPoint Presentation Layouts Mockup
This is a customer churn report ppt powerpoint presentation layouts mockup. This is a four stage process. The stages in this process are percent of customers lost, numbers of customers lost, value of recurring business lost.
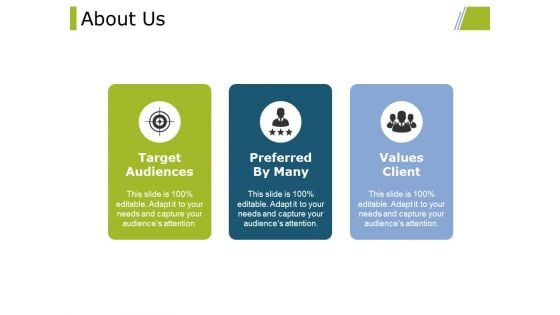
About Us Ppt PowerPoint Presentation Model Summary
This is a about us ppt powerpoint presentation model summary. This is a three stage process. The stages in this process are target audiences, preferred by many, values client, about us.
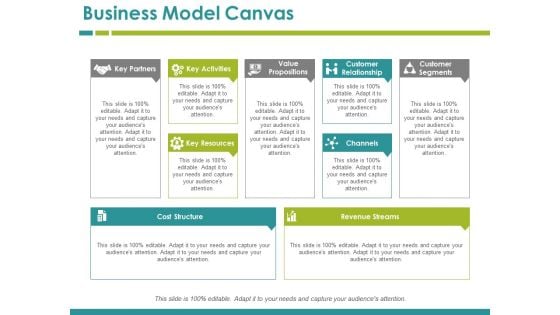
Business Model Canvas Ppt PowerPoint Presentation Model Good
This is a business model canvas ppt powerpoint presentation model good. This is a seven stage process. The stages in this process are key partners, key activities, value propositions, customer relationship, customer segments.
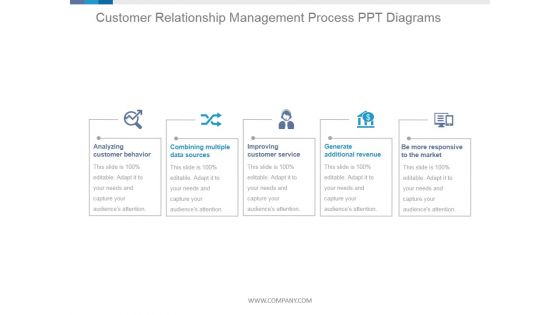
Customer Relationship Management Process Ppt PowerPoint Presentation Template
This is a customer relationship management process ppt powerpoint presentation template. This is a five stage process. The stages in this process are analyzing customer behavior, combining multiple data sources, improving customer service, generate additional revenue, be more responsive to the market.
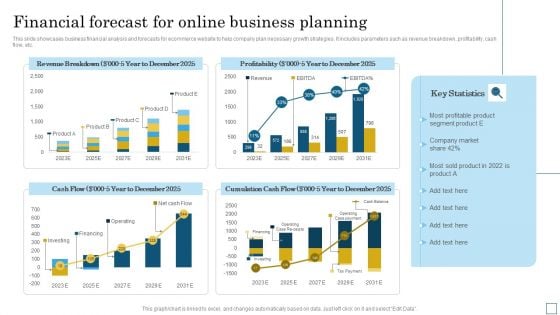
Financial Forecast For Online Business Planning Pictures PDF
This slide showcases business financial analysis and forecasts for ecommerce website to help company plan necessary growth strategies. It includes parameters such as revenue breakdown, profitability, cash flow, etc. Pitch your topic with ease and precision using this Financial Forecast For Online Business Planning Pictures PDF. This layout presents information on Cumulation Cash Flow, Profitability, Revenue Breakdown. It is also available for immediate download and adjustment. So, changes can be made in the color, design, graphics or any other component to create a unique layout.
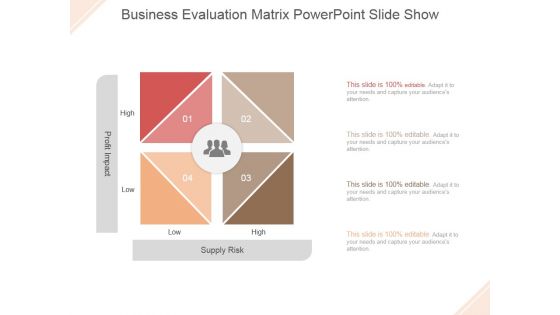
Business Evaluation Matrix Ppt PowerPoint Presentation Professional
This is a business evaluation matrix ppt powerpoint presentation professional. This is a four stage process. The stages in this process are profit impact, supply risk, low, high.
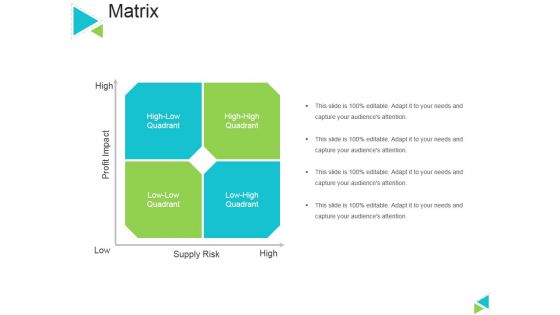
Matrix Ppt PowerPoint Presentation File Formats
This is a matrix ppt powerpoint presentation file formats. This is a four stage process. The stages in this process are high, profit impact, low, supply risk.
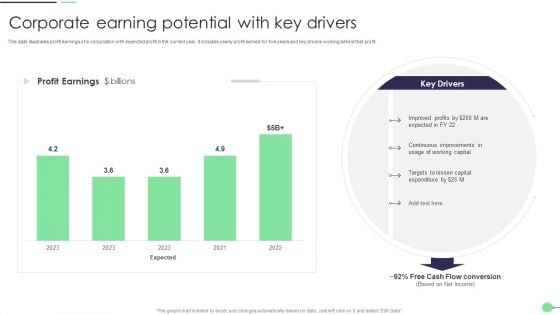
Corporate Earning Potential With Key Drivers Summary PDF
This slide illustrates profit earnings of a corporation with expected profit in the current year. It includes yearly profit earned for five years and key drivers working behind that profit. Pitch your topic with ease and precision using this Corporate Earning Potential With Key Drivers Summary PDF. This layout presents information on Working Capital, Improved Profits, Capital. It is also available for immediate download and adjustment. So, changes can be made in the color, design, graphics or any other component to create a unique layout.

Growing Dollar Money PowerPoint Templates And PowerPoint Themes 1012
Growing Dollar Money PowerPoint Templates And PowerPoint Themes 1012-This PowerPoint Template Shows Dollar symbol placed in 3D manner. It signifies the Business Growth. It portrays the concept of Finance, Profit Loss etc. Adjust the above image in your PPT presentations to visually support your content in your Financial and Business PPT slideshows. Lay down the fundamentals to build upon. Take it up to a higher level with your thoughts.-Growing Dollar Money PowerPoint Templates And PowerPoint Themes 1012-This PowerPoint template can be used for presentations relating to-Make Money, Business, Finance, Money, Success, Symbol Let the audience experience the beauty of our Growing Dollar Money PowerPoint Templates And PowerPoint Themes 1012. They will be beholden to you.
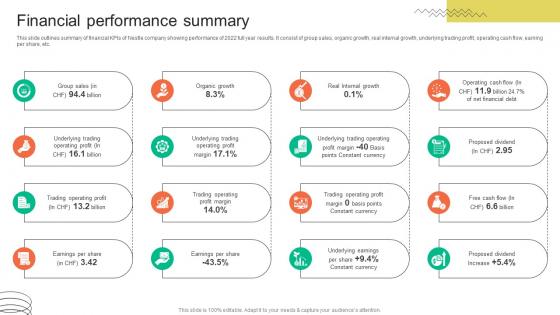
Financial Performance Summary FMCG Provider Company Profile CP SS V
This slide outlines summary of financial KPIs of Nestle company showing performance of 2022 full year results. It consist of group sales, organic growth, real internal growth, underlying trading profit, operating cash flow, earning per share, etc. Find highly impressive Financial Performance Summary FMCG Provider Company Profile CP SS V on Slidegeeks to deliver a meaningful presentation. You can save an ample amount of time using these presentation templates. No need to worry to prepare everything from scratch because Slidegeeks experts have already done a huge research and work for you. You need to download Financial Performance Summary FMCG Provider Company Profile CP SS V for your upcoming presentation. All the presentation templates are 100 percent editable and you can change the color and personalize the content accordingly. Download now This slide outlines summary of financial KPIs of Nestle company showing performance of 2022 full year results. It consist of group sales, organic growth, real internal growth, underlying trading profit, operating cash flow, earning per share, etc.
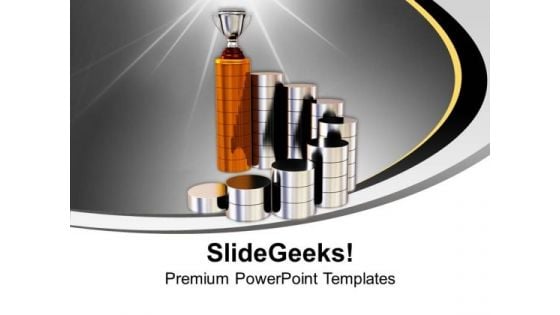
Spiral Stairs And Trophy On The Top Business PowerPoint Templates And PowerPoint Themes 1112
Spiral Stairs And Trophy On The Top Business PowerPoint Templates And PowerPoint Themes 1112-The above template displays a diagram of spiral stairs and trophy on the top depicting the concept of competition. It imitates award celebration ceremony champion growth increase performance positive prize profit. Adjust the above image in your PPT presentations to visually support your content in your Business PPT slideshows. The vision of being the market leader is clear to you. Transmit your thoughts via our slides and prod your team to action.-Spiral Stairs And Trophy On The Top Business PowerPoint Templates And PowerPoint Themes 1112-This PowerPoint template can be used for presentations relating to-Spiral stairs,Stairs, Game, Business, Success, Competition Transform your organization with our Spiral Stairs And Trophy On The Top Business PowerPoint Templates And PowerPoint Themes 1112. Download without worries with our money back guaranteee.
Company Introduction And Details Icons PDF
This slide identifies the company details Company Name, Founded Year, Headquartered, CEO, Total Revenue, Total Profit, etc.along with the Companys Long-term Aim. Presenting company introduction and details icons pdf. to provide visual cues and insights. Share and navigate important information on one stages that need your due attention. This template can be used to pitch topics like quality growth, total revenue, total profit, products, mission. In addtion, this PPT design contains high resolution images, graphics, etc, that are easily editable and available for immediate download.
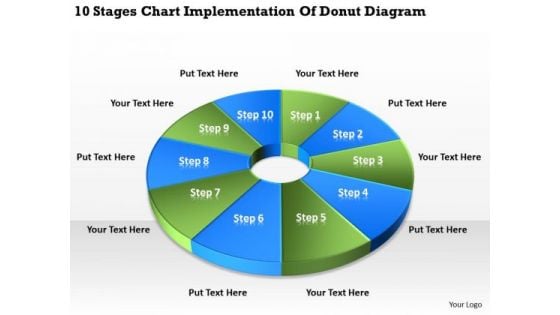
10 Stages Chart Implementation Of Donut Diagram Ppt Need Business Plan PowerPoint Templates
We present our 10 stages chart implementation of donut diagram ppt need business plan PowerPoint templates.Download and present our Communication PowerPoint Templates because Our PowerPoint Templates and Slides will let your team Walk through your plans. See their energy levels rise as you show them the way. Use our Advertising PowerPoint Templates because You can safely bank on our PowerPoint Templates and Slides. They will provide a growth factor to your valuable thoughts. Present our Circle Charts PowerPoint Templates because It can Conjure up grand ideas with our magical PowerPoint Templates and Slides. Leave everyone awestruck by the end of your presentation. Download our Business PowerPoint Templates because It is Aesthetically crafted by artistic young minds. Our PowerPoint Templates and Slides are designed to display your dexterity. Download our Shapes PowerPoint Templates because Watching this your Audience will Grab their eyeballs, they wont even blink.Use these PowerPoint slides for presentations relating to Chart, business, donut, market, sales, document, economy, display, corporate, income, concept, success, presentation, symbol, diagram, percentage, graphic, finance, analysis, report, marketing, accounting, management, graph, forecast, design, growth, competition, progress, profit, information, trade, investment, statistic, financial, infographics, 3d. The prominent colors used in the PowerPoint template are Green, White, Blue. Your ideas deserve the best accessories. Our 10 Stages Chart Implementation Of Donut Diagram Ppt Need Business Plan PowerPoint Templates are a shining example.
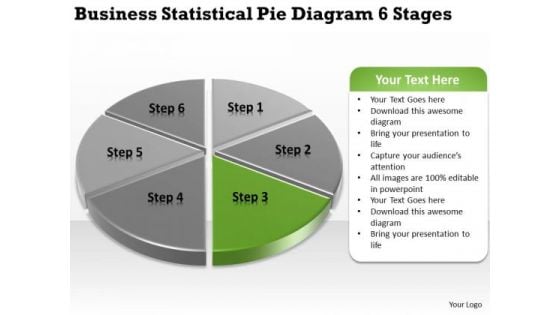
Templates Statistical Pie Diagram 6 Stages Show Me Business Plan PowerPoint
We present our templates statistical pie diagram 6 stages show me business plan PowerPoint.Use our Circle Charts PowerPoint Templates because You can Bask in the warmth of our PowerPoint Templates and Slides. Enjoy the heartfelt glowing response of your listeners. Download our Marketing PowerPoint Templates because Our PowerPoint Templates and Slides will Activate the energies of your audience. Get their creative juices flowing with your words. Download our Business PowerPoint Templates because Our PowerPoint Templates and Slides ensures Effective communication. They help you put across your views with precision and clarity. Use our Flow Charts PowerPoint Templates because Our PowerPoint Templates and Slides are truly out of this world. Even the MIB duo has been keeping tabs on our team. Use our Process and Flows PowerPoint Templates because It can be used to Set your controls for the heart of the sun. Our PowerPoint Templates and Slides will be the propellant to get you there.Use these PowerPoint slides for presentations relating to Chart, pie, diagram, slice, icon, market, statistics, sales, economy, green, achievement, corporate,business, sign, render, success, presentation, symbol,circle, graphic, finance,marketing, shape, graph, illustration, piece, division, money, growth, company, progress, profit, information, part, investment, improvement, financial . The prominent colors used in the PowerPoint template are Green, Gray, Black. Maintain growth with our Templates Statistical Pie Diagram 6 Stages Show Me Business Plan PowerPoint. Download without worries with our money back guaranteee.
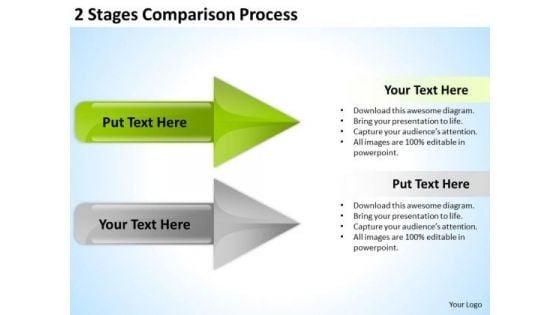
PowerPoint Arrow Shapes Comparison Process Ppt Templates Backgrounds For Slides
3d, accounting, arrow, art, bar, blue, business, calculation, chart, collection, company, design elements, diagram, directive, expense, finance, firm, forecast, future, gain, graph, grow, growth, icon, illustration, income, line, market, measure, objects, office, profit, progress, rate, set, statistic, stock, success, two, up, vector, yellow Get on the list of audience favourites. Experience adulation with our PowerPoint Arrow Shapes Comparison Process Ppt Templates Backgrounds For Slides.
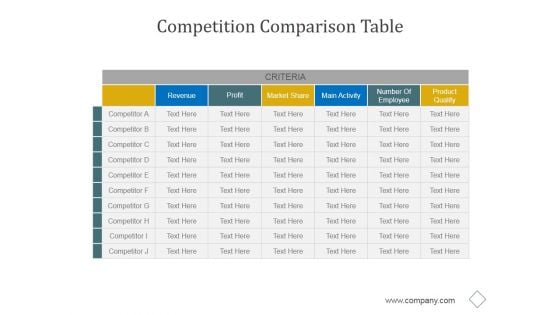
Competition Comparison Table Ppt PowerPoint Presentation Visual Aids
This is a competition comparison table ppt powerpoint presentation visual aids. This is a six stage process. The stages in this process are revenue, profit, market share, main activity, number of employee, product quality.
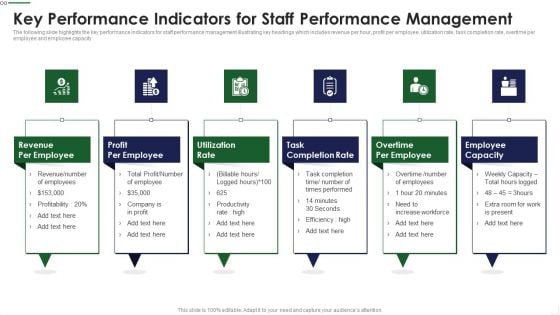
Key Performance Indicators For Staff Performance Management Clipart PDF
The following slide highlights the key performance Indicators for staff performance management illustrating key headings which includes revenue per hour, profit per employee, utilization rate, task completion rate, overtime per employee and employee capacity Persuade your audience using this Key Performance Indicators For Staff Growth Topics PDF This PPT design covers six stages, thus making it a great tool to use. It also caters to a variety of topics including Revenue Employee, Profit Employee, Task Completion Download this PPT design now to present a convincing pitch that not only emphasizes the topic but also showcases your presentation skills.
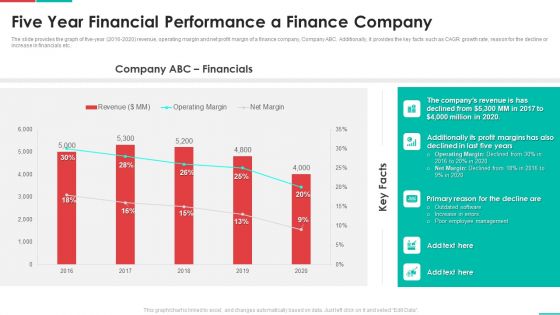
Roadmap For Financial Accounting Transformation Five Year Financial Performance A Finance Company Download PDF
The slide provides the graph of five-year 2016-2020 revenue, operating margin and net profit margin of a finance company, Company ABC. Additionally, it provides the key facts such as CAGR growth rate, reason for the decline or increase in financials etc. Deliver and pitch your topic in the best possible manner with this roadmap for financial accounting transformation five year financial performance a finance company download pdf. Use them to share invaluable insights on revenue, profit margins, management and impress your audience. This template can be altered and modified as per your expectations. So, grab it now.
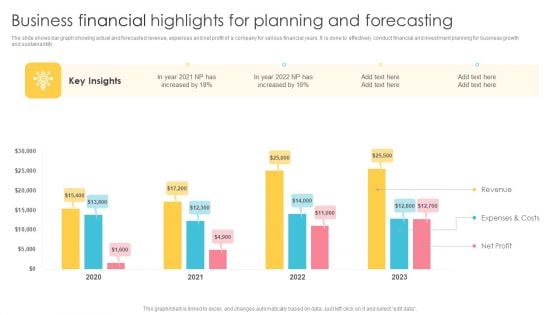
Business Financial Highlights For Planning And Forecasting Background PDF
The slide shows bar graph showing actual and forecasted revenue, expenses and net profit of a company for various financial years. It is done to effectively conduct financial and investment planning for business growth and sustainability. Pitch your topic with ease and precision using this Business Financial Highlights For Planning And Forecasting Background PDF. This layout presents information on Revenue, Expenses And Costs, Net Profit. It is also available for immediate download and adjustment. So, changes can be made in the color, design, graphics or any other component to create a unique layout.
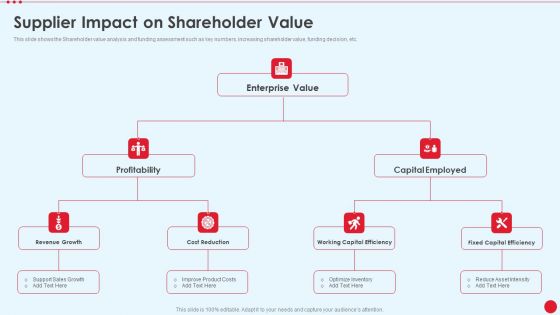
Supplier Impact On Shareholder Value Stakeholder Capitalism For Long Term Value Addition Themes PDF
This slide shows the Shareholder value analysis and funding assessment such as key numbers, increasing shareholder value, funding decision, etc. Presenting supplier impact on shareholder value stakeholder capitalism for long term value addition themes pdf to provide visual cues and insights. Share and navigate important information on two stages that need your due attention. This template can be used to pitch topics like profitability, capital employed, enterprise value, revenue growth, cost reduction. In addtion, this PPT design contains high resolution images, graphics, etc, that are easily editable and available for immediate download.
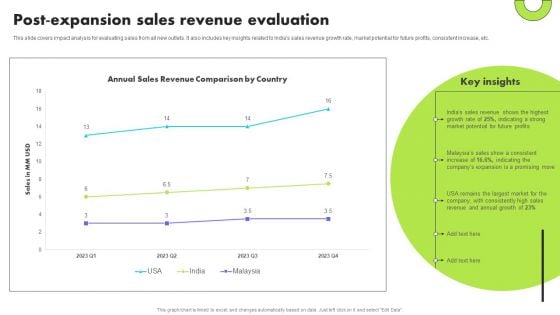
Planning Transnational Technique To Improve International Scope Post Expansion Sales Revenue Evaluation Introduction PDF
This slide covers impact analysis for evaluating sales from all new outlets. It also includes key insights related to Indias sales revenue growth rate, market potential for future profits, consistent increase, etc. Presenting this PowerPoint presentation, titled Planning Transnational Technique To Improve International Scope Post Expansion Sales Revenue Evaluation Introduction PDF, with topics curated by our researchers after extensive research. This editable presentation is available for immediate download and provides attractive features when used. Download now and captivate your audience. Presenting this Planning Transnational Technique To Improve International Scope Post Expansion Sales Revenue Evaluation Introduction PDF. Our researchers have carefully researched and created these slides with all aspects taken into consideration. This is a completely customizable Planning Transnational Technique To Improve International Scope Post Expansion Sales Revenue Evaluation Introduction PDF that is available for immediate downloading. Download now and make an impact on your audience. Highlight the attractive features available with our PPTs.
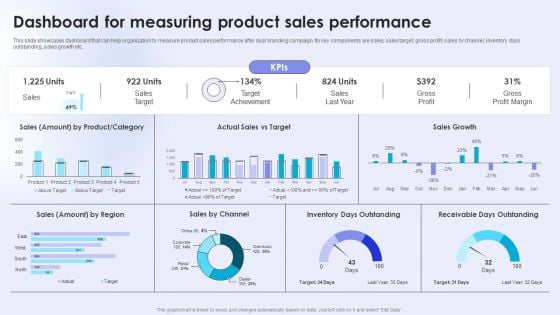
Dual Branding Campaign To Boost Sales Of Product Or Services Dashboard For Measuring Product Sales Elements PDF
This slide showcases dashboard that can help organization to measure product sales performance after dual branding campaign. Its key components are sales, sales target, gross profit, sales by channel, inventory days outstanding, sales growth etc. The Dual Branding Campaign To Boost Sales Of Product Or Services Dashboard For Measuring Product Sales Elements PDF is a compilation of the most recent design trends as a series of slides. It is suitable for any subject or industry presentation, containing attractive visuals and photo spots for businesses to clearly express their messages. This template contains a variety of slides for the user to input data, such as structures to contrast two elements, bullet points, and slides for written information. Slidegeeks is prepared to create an impression.
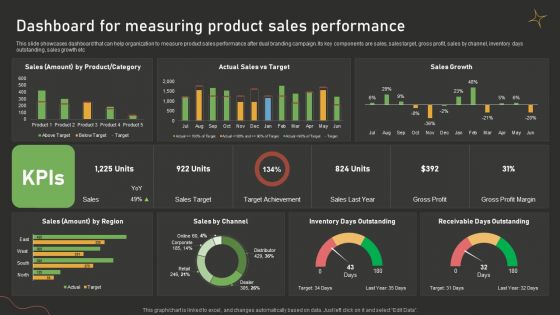
Dashboard For Measuring Product Sales Performance Dual Branding Campaign For Product Promotion Microsoft PDF
This slide showcases dashboard that can help organization to measure product sales performance after dual branding campaign. Its key components are sales, sales target, gross profit, sales by channel, inventory days outstanding, sales growth etc. Do you have an important presentation coming up Are you looking for something that will make your presentation stand out from the rest Look no further than Dashboard For Measuring Product Sales Performance Dual Branding Campaign For Product Promotion Microsoft PDF. With our professional designs, you can trust that your presentation will pop and make delivering it a smooth process. And with Slidegeeks, you can trust that your presentation will be unique and memorable. So why wait Grab Dashboard For Measuring Product Sales Performance Dual Branding Campaign For Product Promotion Microsoft PDF today and make your presentation stand out from the rest.
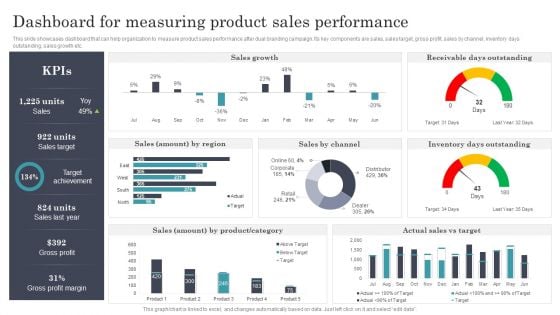
Developing Dual Branding Campaign For Brand Marketing Dashboard For Measuring Product Sales Performance Clipart PDF
This slide showcases dashboard that can help organization to measure product sales performance after dual branding campaign. Its key components are sales, sales target, gross profit, sales by channel, inventory days outstanding, sales growth etc. Create an editable Developing Dual Branding Campaign For Brand Marketing Dashboard For Measuring Product Sales Performance Clipart PDF that communicates your idea and engages your audience. Whether you are presenting a business or an educational presentation, pre designed presentation templates help save time. Developing Dual Branding Campaign For Brand Marketing Dashboard For Measuring Product Sales Performance Clipart PDF is highly customizable and very easy to edit, covering many different styles from creative to business presentations. Slidegeeks has creative team members who have crafted amazing templates. So, go and get them without any delay.
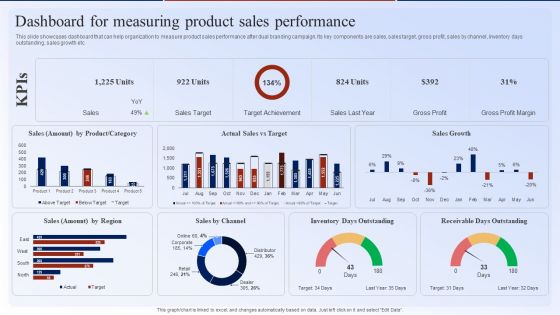
Dashboard For Measuring Product Sales Performance Dual Branding Marketing Campaign Information PDF
This slide showcases dashboard that can help organization to measure product sales performance after dual branding campaign. Its key components are sales, sales target, gross profit, sales by channel, inventory days outstanding, sales growth etc. This Dashboard For Measuring Product Sales Performance Dual Branding Marketing Campaign Information PDF from Slidegeeks makes it easy to present information on your topic with precision. It provides customization options, so you can make changes to the colors, design, graphics, or any other component to create a unique layout. It is also available for immediate download, so you can begin using it right away. Slidegeeks has done good research to ensure that you have everything you need to make your presentation stand out. Make a name out there for a brilliant performance.
Marketing And Operation KPI Dashboard To Increase Efficiency Icons PDF
This slide covers sales and operations KPI dashboard to increase efficiency. It involves performance, increase in profit, target, monthly profit and quarterly revenue trend. Pitch your topic with ease and precision using this Marketing And Operation KPI Dashboard To Increase Efficiency Icons PDF. This layout presents information on Profit By Monthly, Target, Performance. It is also available for immediate download and adjustment. So, changes can be made in the color, design, graphics or any other component to create a unique layout.
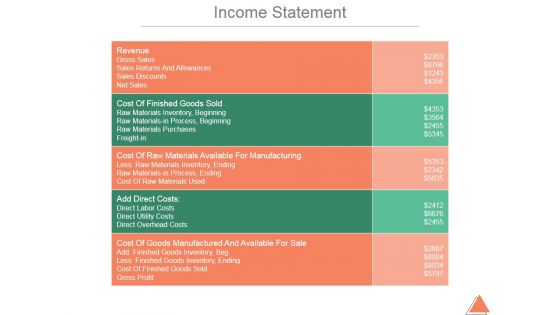
Income Statement Ppt PowerPoint Presentation Background Images
This is a income statement ppt powerpoint presentation background images. This is a five stage process. The stages in this process are revenue, gross sales, sales returns and allowances, sales discounts, net sales.
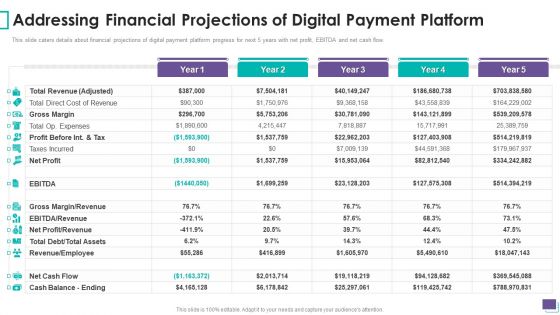
Payment Gateway Firm Addressing Financial Projections Of Digital Payment Platform Infographics PDF
This slide caters details about financial projections of digital payment platform progress for next 5 years with net profit, EBITDA and net cash flow. Deliver an awe inspiring pitch with this creative Payment Gateway Firm Addressing Financial Projections Of Digital Payment Platform Infographics PDF bundle. Topics like Gross Margin, Profit Before, Net Profit, Employee can be discussed with this completely editable template. It is available for immediate download depending on the needs and requirements of the user.
8 Financial Goals Of Enterprise Puzzle Design With Icons Ppt PowerPoint Presentation Gallery Graphics Pictures PDF
Presenting this set of slides with name 8 financial goals of enterprise puzzle design with icons ppt powerpoint presentation gallery graphics pictures pdf. This is a eight stage process. The stages in this process are non profit, co operative, increase market share, profit maximization, profit satisficing. This is a completely editable PowerPoint presentation and is available for immediate download. Download now and impress your audience.
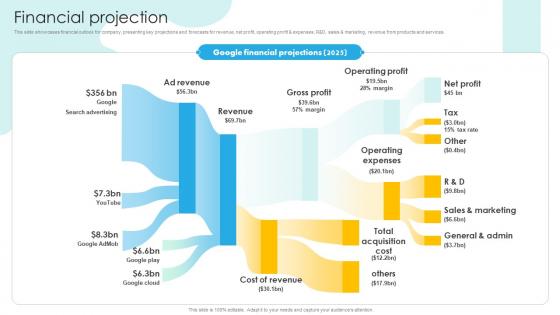
Financial Projection Search Engine Platform Business Model BMC SS V
This slide showcases financial outlook for company, presenting key projections and forecasts for revenue, net profit, operating profit and expenses, RandD, sales and marketing, revenue from products and services. There are so many reasons you need a Financial Projection Search Engine Platform Business Model BMC SS V. The first reason is you can not spend time making everything from scratch, Thus, Slidegeeks has made presentation templates for you too. You can easily download these templates from our website easily. This slide showcases financial outlook for company, presenting key projections and forecasts for revenue, net profit, operating profit and expenses, RandD, sales and marketing, revenue from products and services.
Roadmap For Financial Accounting Transformation Key Performance Indicators To Track The Success Of Accounting Icons PDF
The slide shows key Performance Indicator KPI which will help the company to track the success of Accounting and Finance Transformation. Major KPIs include revenue, operating profit margin, net profit margin, invoice errors, net discount etc. Deliver an awe inspiring pitch with this creative roadmap for financial accounting transformation key performance indicators to track the success of accounting icons pdf bundle. Topics like revenue, operating profit margin, net profit margin, invoice errors, net discount can be discussed with this completely editable template. It is available for immediate download depending on the needs and requirements of the user.
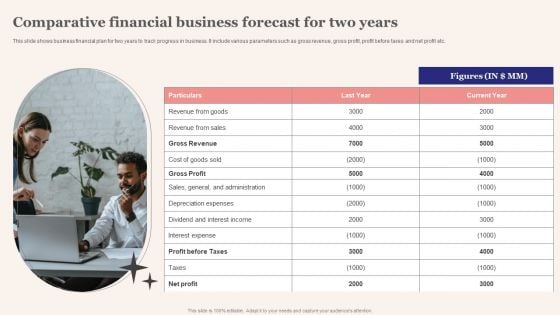
Comparative Financial Business Forecast For Two Years Topics PDF
This slide shows business financial plan for two years to track progress in business. It include various parameters such as gross revenue, gross profit, profit before taxes and net profit etc. Persuade your audience using this Comparative Financial Business Forecast For Two Years Topics PDF. This PPT design covers one stage, thus making it a great tool to use. It also caters to a variety of topics including Sales General And Administration, Profit Before Taxes. Download this PPT design now to present a convincing pitch that not only emphasizes the topic but also showcases your presentation skills.
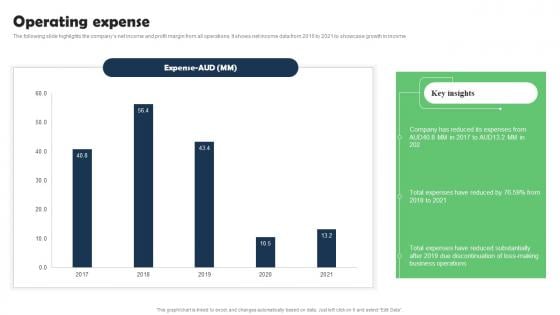
Operating Expense Marketing Research Services Management Business Formats Pdf
The following slide highlights the companys net income and profit margin from all operations. It shows net income data from 2016 to 2021 to showcase growth in income. The best PPT templates are a great way to save time, energy, and resources. Slidegeeks have 100 percent editable powerpoint slides making them incredibly versatile. With these quality presentation templates, you can create a captivating and memorable presentation by combining visually appealing slides and effectively communicating your message. Download Operating Expense Marketing Research Services Management Business Formats Pdf from Slidegeeks and deliver a wonderful presentation. The following slide highlights the companys net income and profit margin from all operations. It shows net income data from 2016 to 2021 to showcase growth in income.
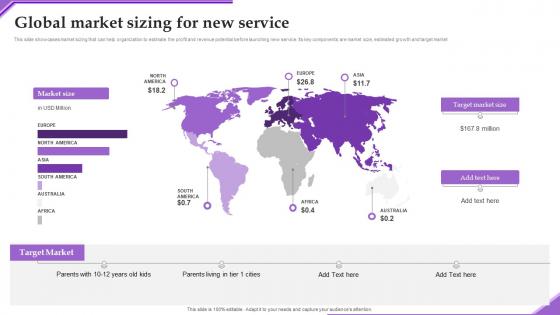
Global Market Sizing New Adverting New Sarvice Via Social Network Platform Topics Pdf
This slide showcases market sizing that can help organization to estimate the profit and revenue potential before launching new service. Its key components are market size, estimated growth and target market Do you have an important presentation coming up Are you looking for something that will make your presentation stand out from the rest Look no further than Global Market Sizing New Adverting New Sarvice Via Social Network Platform Topics Pdf. With our professional designs, you can trust that your presentation will pop and make delivering it a smooth process. And with Slidegeeks, you can trust that your presentation will be unique and memorable. So why wait Grab Global Market Sizing New Adverting New Sarvice Via Social Network Platform Topics Pdf today and make your presentation stand out from the rest This slide showcases market sizing that can help organization to estimate the profit and revenue potential before launching new service. Its key components are market size, estimated growth and target market

Financial Performance Travel Bag Funding Pitch Deck
This slide covers financial performance of the company over a span of 3 years. It evaluates revenue generated and profit obtained after making necessary deductions expenses which indicates positive performance and future growth potential. From laying roadmaps to briefing everything in detail, our templates are perfect for you. You can set the stage with your presentation slides. All you have to do is download these easy-to-edit and customizable templates. Financial Performance Travel Bag Funding Pitch Deck will help you deliver an outstanding performance that everyone would remember and praise you for. Do download this presentation today. This slide covers financial performance of the company over a span of 3 years. It evaluates revenue generated and profit obtained after making necessary deductions expenses which indicates positive performance and future growth potential.
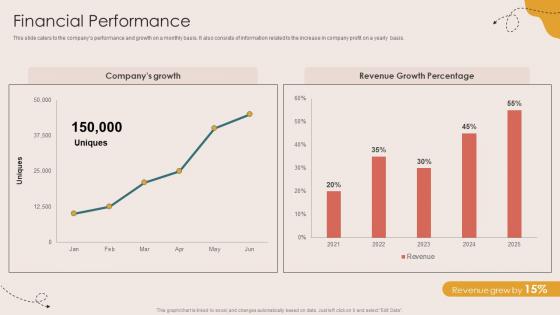
Financial Performance Children Events Listing Investor Funding Elevator Pitch Deck
This slide caters to the companys performance and growth on a monthly basis. It also consists of information related to the increase in company profit on a yearly basis. Present like a pro with Financial Performance Children Events Listing Investor Funding Elevator Pitch Deck. Create beautiful presentations together with your team, using our easy-to-use presentation slides. Share your ideas in real-time and make changes on the fly by downloading our templates. So whether you are in the office, on the go, or in a remote location, you can stay in sync with your team and present your ideas with confidence. With Slidegeeks presentation got a whole lot easier. Grab these presentations today. This slide caters to the companys performance and growth on a monthly basis. It also consists of information related to the increase in company profit on a yearly basis.
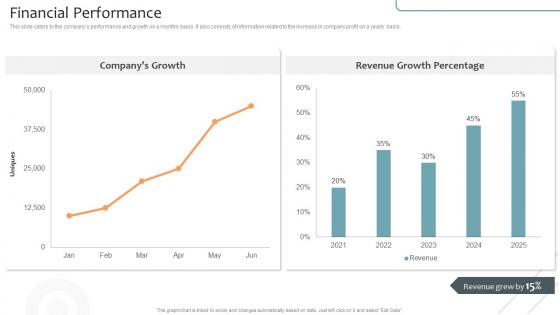
Financial Performance Virtual Learning Environments VLE Investor Funding Elevator Pitch Deck
This slide caters to the companys performance and growth on a monthly basis. It also consists of information related to the increase in company profit on a yearly basis. Present like a pro with Financial Performance Virtual Learning Environments VLE Investor Funding Elevator Pitch Deck. Create beautiful presentations together with your team, using our easy-to-use presentation slides. Share your ideas in real-time and make changes on the fly by downloading our templates. So whether you are in the office, on the go, or in a remote location, you can stay in sync with your team and present your ideas with confidence. With Slidegeeks presentation got a whole lot easier. Grab these presentations today. This slide caters to the companys performance and growth on a monthly basis. It also consists of information related to the increase in company profit on a yearly basis.
Abstract Business Graph PowerPoint Icon C
Microsoft PowerPoint Template and Background with business graph with profits rising off the chart. Graph on a white reflective backgroun Expedite growth with our Abstract Business Graph PowerPoint Icon C. Download without worries with our money back guaranteee.
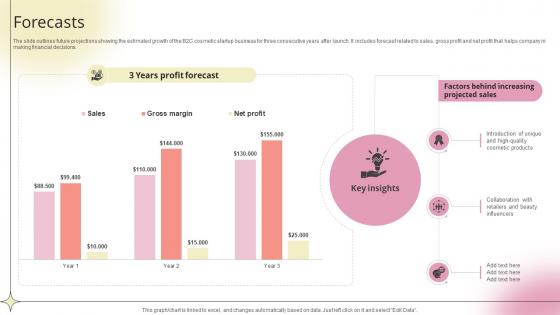
Forecasts Beauty Product Company Go To Market Strategy GTM SS V
The slide outlines future projections showing the estimated growth of the B2C cosmetic startup business for three consecutive years after launch. It includes forecast related to sales, gross profit and net profit that helps company in making financial decisions.Slidegeeks is here to make your presentations a breeze with Forecasts Beauty Product Company Go To Market Strategy GTM SS V With our easy-to-use and customizable templates, you can focus on delivering your ideas rather than worrying about formatting. With a variety of designs to choose from, you are sure to find one that suits your needs. And with animations and unique photos, illustrations, and fonts, you can make your presentation pop. So whether you are giving a sales pitch or presenting to the board, make sure to check out Slidegeeks first The slide outlines future projections showing the estimated growth of the B2C cosmetic startup business for three consecutive years after launch. It includes forecast related to sales, gross profit and net profit that helps company in making financial decisions.
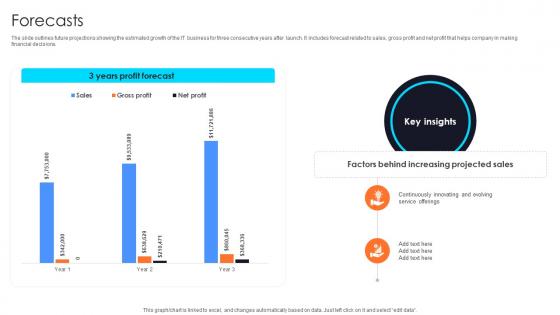
Forecasts Information Technology Startup Go To Market Strategy GTM SS V
The slide outlines future projections showing the estimated growth of the IT business for three consecutive years after launch. It includes forecast related to sales, gross profit and net profit that helps company in making financial decisions.Slidegeeks is here to make your presentations a breeze with Forecasts Information Technology Startup Go To Market Strategy GTM SS V With our easy-to-use and customizable templates, you can focus on delivering your ideas rather than worrying about formatting. With a variety of designs to choose from, you are sure to find one that suits your needs. And with animations and unique photos, illustrations, and fonts, you can make your presentation pop. So whether you are giving a sales pitch or presenting to the board, make sure to check out Slidegeeks first The slide outlines future projections showing the estimated growth of the IT business for three consecutive years after launch. It includes forecast related to sales, gross profit and net profit that helps company in making financial decisions.
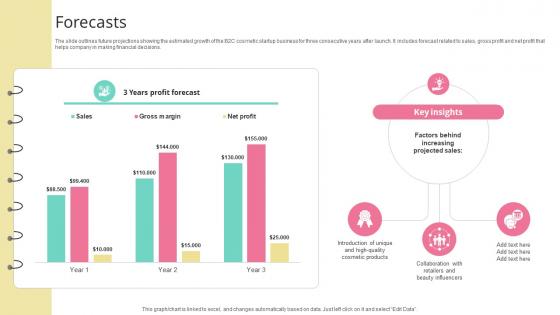
Forecasts Skincare Startup GTM Strategy GTM SS V
The slide outlines future projections showing the estimated growth of the B2C cosmetic startup business for three consecutive years after launch. It includes forecast related to sales, gross profit and net profit that helps company in making financial decisions.Slidegeeks is here to make your presentations a breeze with Forecasts Skincare Startup GTM Strategy GTM SS V With our easy-to-use and customizable templates, you can focus on delivering your ideas rather than worrying about formatting. With a variety of designs to choose from, you are sure to find one that suits your needs. And with animations and unique photos, illustrations, and fonts, you can make your presentation pop. So whether you are giving a sales pitch or presenting to the board, make sure to check out Slidegeeks first The slide outlines future projections showing the estimated growth of the B2C cosmetic startup business for three consecutive years after launch. It includes forecast related to sales, gross profit and net profit that helps company in making financial decisions.
IT Application Services Company Outline Company Revenue Icons PDF
The slide shows annual revenue growth of the company with the CAGR for last five financial years from 2018 to 2022. It also highlights year on year growth along with key insights. Deliver and pitch your topic in the best possible manner with this IT Application Services Company Outline Company Revenue Icons PDF. Use them to share invaluable insights on Gross Profit Margin, Revenue, Business and impress your audience. This template can be altered and modified as per your expectations. So, grab it now.
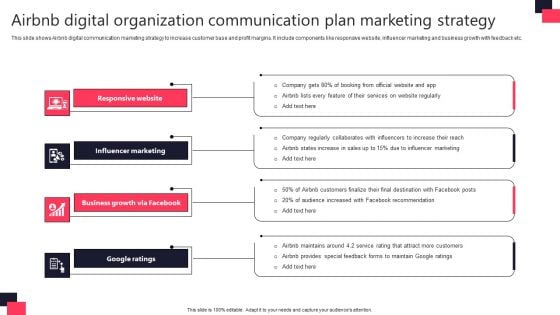
Airbnb Digital Organization Communication Plan Marketing Strategy Designs PDF
This slide shows Airbnb digital communication marketing strategy to increase customer base and profit margins. It include components like responsive website, influencer marketing and business growth with feedback etc. Presenting Airbnb Digital Organization Communication Plan Marketing Strategy Designs PDF to dispense important information. This template comprises four stages. It also presents valuable insights into the topics including Responsive Website, Influencer Marketing, Business Growth Via Facebook. This is a completely customizable PowerPoint theme that can be put to use immediately. So, download it and address the topic impactfully.
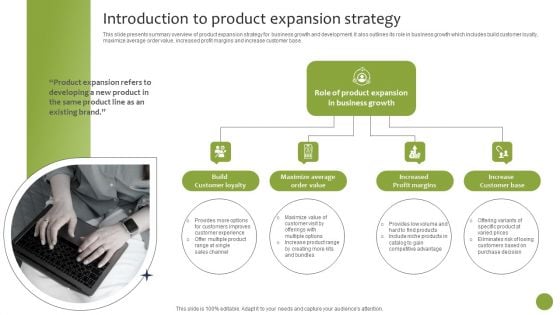
Introduction To Product Expansion Strategy Download PDF
This slide presents summary overview of product expansion strategy for business growth and development. It also outlines its role in business growth which includes build customer loyalty, maximize average order value, increased profit margins and increase customer base. The best PPT templates are a great way to save time, energy, and resources. Slidegeeks have 100 percent editable powerpoint slides making them incredibly versatile. With these quality presentation templates, you can create a captivating and memorable presentation by combining visually appealing slides and effectively communicating your message. Download Introduction To Product Expansion Strategy Download PDF from Slidegeeks and deliver a wonderful presentation.
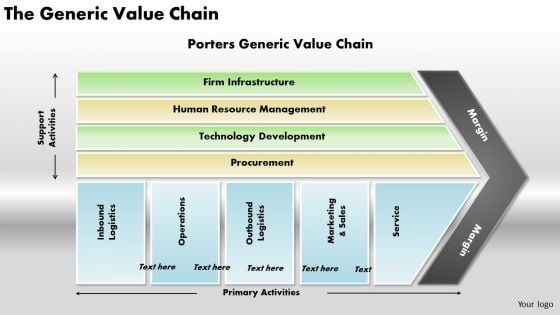
The Generic Value Chain Business PowerPoint Presentation
Connect The Dots With Our The Generic Value Chain Business Powerpoint Presentation Powerpoint Templates. Watch The Whole Picture Clearly Emerge. Dot Your Thoughts With Our arrows Powerpoint Templates. Give Your Demeanor That Propel Look.
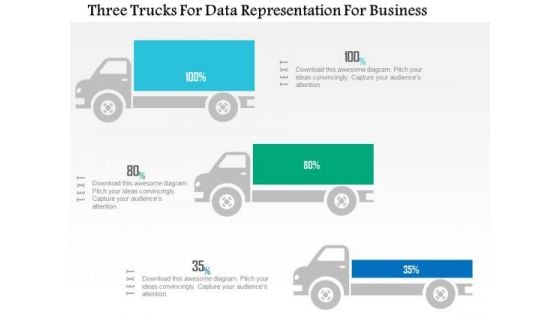
Business Diagram Three Trucks For Data Representation For Business PowerPoint Slide
This business diagram displays three trucks graphic. This diagram contains trucks for percentage value growth. Use this diagram to display business growth over a period of time.
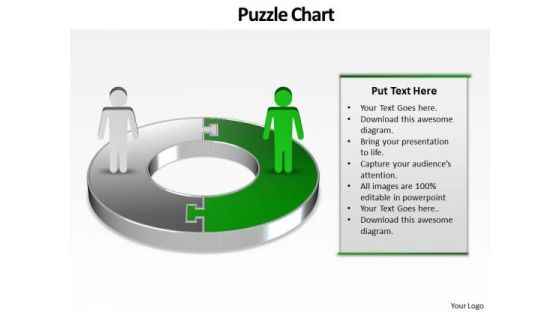
Ppt Green PowerPoint Slide Man On Circular Gantt Chart Template Templates
PPT green powerpoint slide man on circular gantt chart template Templates-This PowerPoint Diagram shows you the Circular way to represent Business components or losses in Business related Activities. This PowerPoint Diagram can be use in Investor presentations for Initial Public Offerings, Annual general meetings and financial seminars.-PPT green powerpoint slide man on circular gantt chart template Templates-abstract, accounting, background, business, businessman, chart, company, connection, corporate, diagram, earnings, finance, forecast, graph, growth, investment, management, network, people, profit, progress, puzzle, shapes, team, technology, vector, wealth Fight down jealousies with our Ppt Green PowerPoint Slide Man On Circular Gantt Chart Template Templates. Make everyone feel equal with your words.
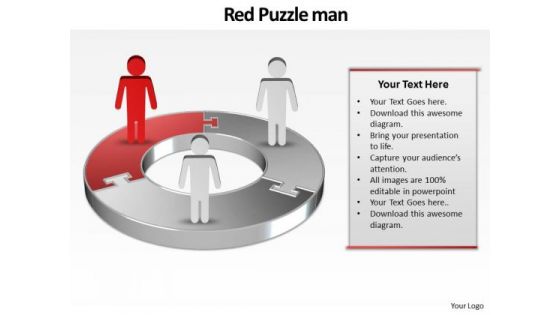
Ppt Red World Business Layouts People Stand On Circular Chart PowerPoint Templates
PPT red world business layouts people stand on circular chart PowerPoint Templates-This 3D PowerPoint Diagram shows the Three interconnected stages represented by first Red Quadrant. It signifies the concept of aspect, attribute, bearing, complexion, component, differentia, disposition, distinction, earmark, essence, essential etc.-PPT red world business layouts people stand on circular chart PowerPoint Templates-abstract, accounting, background, business, businessman, chart, company, connection, corporate, diagram, earnings, finance, forecast, graph, growth, investment, management, network, people, profit, progress, puzzle, shapes, team, technology, vector, wealth Make a powerful statement with our Ppt Red World Business Layouts People Stand On Circular Chart PowerPoint Templates. You'll always stay ahead of the game.
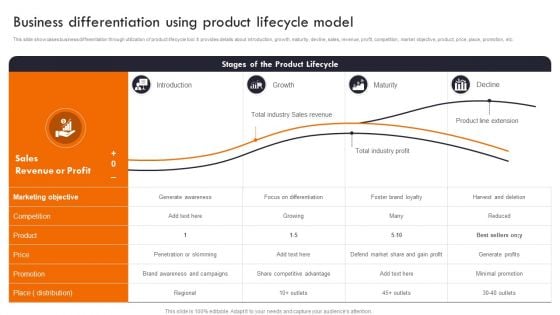
Gaining Competitive Edge Business Differentiation Using Product Lifecycle Model Clipart PDF
This slide showcases business differentiation through utilization of product lifecycle tool. It provides details about introduction, growth, maturity, devline, sales, revenue, profit, competition, market objective, product, price, place, promotion, etc. Present like a pro with Gaining Competitive Edge Business Differentiation Using Product Lifecycle Model Clipart PDF Create beautiful presentations together with your team, using our easy-to-use presentation slides. Share your ideas in real-time and make changes on the fly by downloading our templates. So whether youre in the office, on the go, or in a remote location, you can stay in sync with your team and present your ideas with confidence. With Slidegeeks presentation got a whole lot easier. Grab these presentations today.
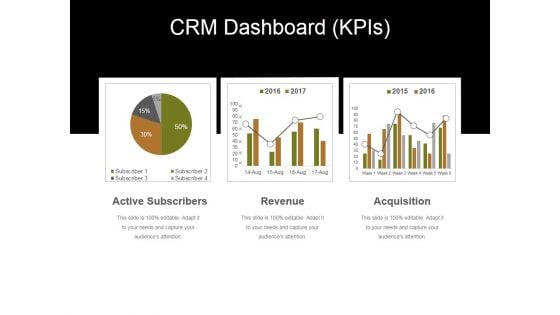
Crm Dashboard Kpis Ppt PowerPoint Presentation Infographic Template Designs
This is a crm dashboard kpis ppt powerpoint presentation infographic template designs. This is a three stage process. The stages in this process are active subscribers, acquisition, revenue.
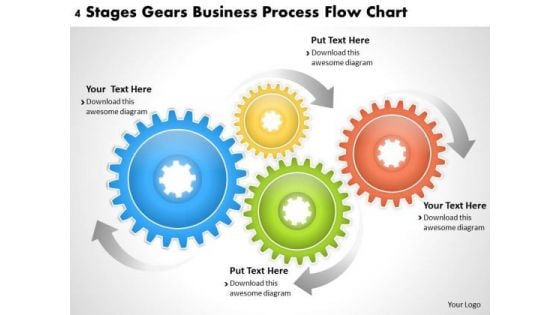
Business Level Strategy Definition 4 Stages Gears Process Flow Chart Strategic Sales Plan Ppt Slide
Create your domain with our Timeline Ppt Template 4 Stages Gears Business Process Flow Chart. Rule minds with your thoughts. Get the domestics right with our Industrial PowerPoint Templates. Create the base for thoughts to grow. Do away with dogmatic approaches. Establish the value of reason with our Gear Wheels PowerPoint Templates.


 Continue with Email

 Home
Home


