Profit Growth
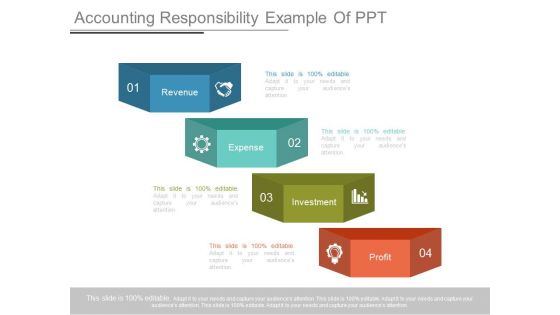
Accounting Responsibility Example Of Ppt
This is a accounting responsibility example of ppt. This is a four stage process. The stages in this process are revenue, expense, investment, profit.

Internal Analysis Employee Morale Ppt PowerPoint Presentation Infographic Template Show
This is a internal analysis employee morale ppt powerpoint presentation infographic template show. This is a three stage process. The stages in this process are turnover, profitability, productivity.
Monthly Sales Performance Tracking And Implementing Strategies To Improve Template Pdf
This slide showcases a dashboard presenting various metrics to measure and analyze sales performance for revenue growth. It includes key components such as number of sales, revenue, profit, cost, sales revenue, sales increment, cost analysis and cross sell.This Monthly Sales Performance Tracking And Implementing Strategies To Improve Template Pdf is perfect for any presentation, be it in front of clients or colleagues. It is a versatile and stylish solution for organizing your meetings. The product name features a modern design for your presentation meetings. The adjustable and customizable slides provide unlimited possibilities for acing up your presentation. Slidegeeks has done all the homework before launching the product for you. So, do not wait, grab the presentation templates today This slide showcases a dashboard presenting various metrics to measure and analyze sales performance for revenue growth. It includes key components such as number of sales, revenue, profit, cost, sales revenue, sales increment, cost analysis and cross sell.
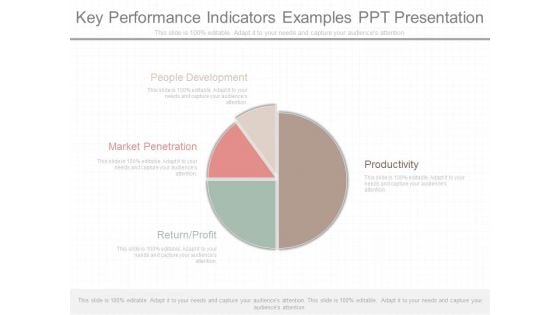
Key Performance Indicators Examples Ppt Presentation
This is a key performance indicators examples ppt presentation. This is a four stage process. The stages in this process are people development, productivity, market penetration, return profit.
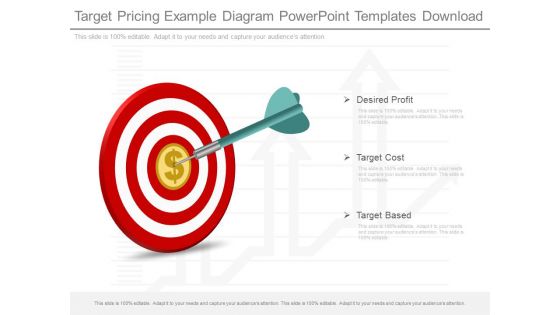
Target Pricing Example Diagram Powerpoint Templates Download
This is a target pricing example diagram powerpoint templates download. This is a three stage process. The stages in this process are desired profit, target cost, target based.
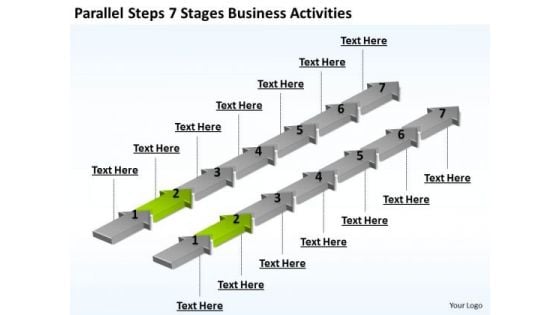
Power Point Arrow Presentation Activities PowerPoint Templates Backgrounds For Slides
3d, achievement, aim, arrows, business, career, chart, development, direction, diversity, education, financial, forecast, forward, glossy, graph, group, growth, higher, icon, increase, internet, investment, leader, leadership, moving, onwards, outlook, path, plan, prediction, price, profit, progress, property, race, sales, series, success, target, team, teamwork, turn, upwards, vector, win, winner Carry it off elegantly with our Power Point Arrow Presentation Activities PowerPoint Templates Backgrounds For Slides. Get your thoughts into fashion.
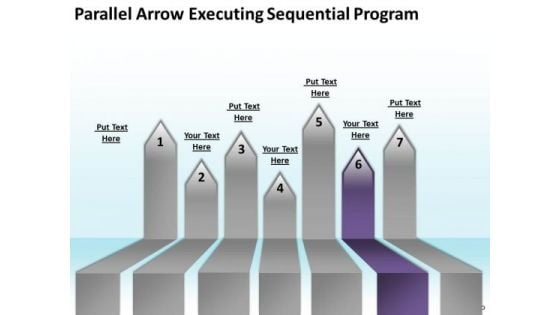
PowerPoint Arrows Parallel Executing Sequential Program Slides
abstract, achievement, aim, arrow, blue, business, button, career, chart, color, communication, competition, concept, development, direction, education, financial, forecast, forward, glossy, gradient, graph, group, growth, higher, icon, illustration, increase, investment, leader, leadership, moving, onwards, outlook, path, plan, prediction, price, profit, progress, property, sales, series, success, target, team, teamwork, upwards, vector, yellow Never fail to impress with our PowerPoint Arrows Parallel Executing Sequential Program Slides. You will be at the top of your game.
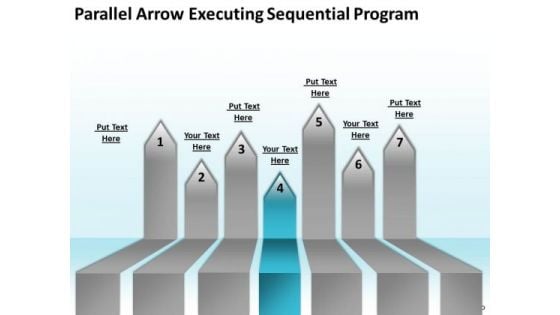
PowerPoint Arrows Parallel Executing Sequential Program Templates
abstract, achievement, aim, arrow, blue, business, button, career, chart, color, communication, competition, concept, development, direction, education, financial, forecast, forward, glossy, gradient, graph, group, growth, higher, icon, illustration, increase, investment, leader, leadership, moving, onwards, outlook, path, plan, prediction, price, profit, progress, property, sales, series, success, target, team, teamwork, upwards, vector, yellow Our PowerPoint Arrows Parallel Executing Sequential Program Templates are like a deep breath. They ensure your ideas endure.
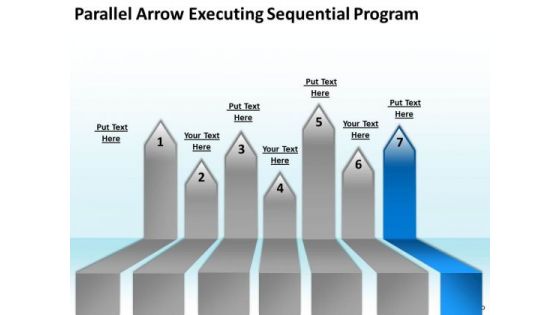
PowerPoint Circular Arrows Parallel Executing Sequential Program Slides
abstract, achievement, aim, arrow, blue, business, button, career, chart, color, communication, competition, concept, development, direction, education, financial, forecast, forward, glossy, gradient, graph, group, growth, higher, icon, illustration, increase, investment, leader, leadership, moving, onwards, outlook, path, plan, prediction, price, profit, progress, property, sales, series, success, target, team, teamwork, upwards, vector, yellow Win easily with our PowerPoint Circular Arrows Parallel Executing Sequential Program Slides. Download without worries with our money back guaranteee.
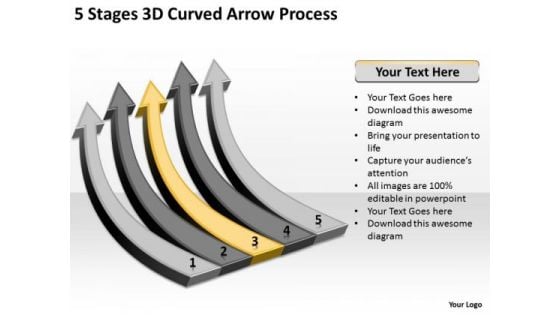
Power Point Arrows 5 Stages 3d Curved Process Ppt PowerPoint Slides
3d, achievement, aim, arrow, background, blue, career, chart, communication, competition, concept, curve, design, development, direction, education, financial, forecast, forward, glossy, graph, graphic, group, growth, icon, illustration, increase, investment, moving, outlook, path, plan, price, profit, progress, race, sales, start, success, target, team, three, turn, up, upwards, win, winner Our Power Point Arrows 5 Stages 3d Curved Process Ppt PowerPoint Slides ensure approval. Your ideas will fit the bill.
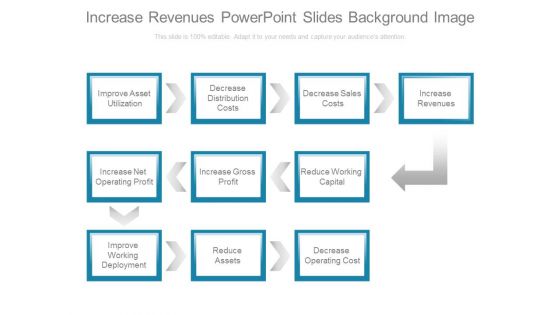
Increase Revenues Powerpoint Slides Background Image
This is an increase revenues powerpoint slides background image. This is a one stage process. The stages in this process are improve asset utilization, decrease distribution costs, decrease sales costs, increase revenues, increase net operating profit, increase gross profit, reduce working capital, improve working deployment, reduce assets, decrease operating cost.
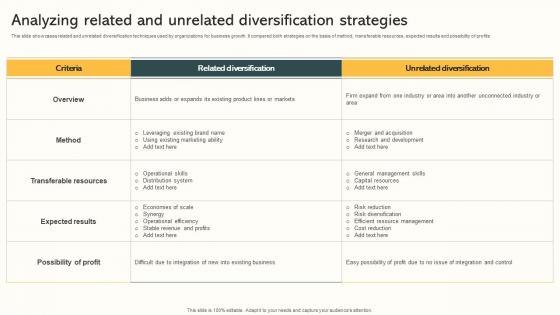
Analyzing Related And Unrelated Diversification Strategies Market Expansion Through Professional Pdf
This slide showcases related and unrelated diversification techniques used by organizations for business growth. It compared both strategies on the basis of method, transferable resources, expected results and possibility of profits. This Analyzing Related And Unrelated Diversification Strategies Market Expansion Through Professional Pdf is perfect for any presentation, be it in front of clients or colleagues. It is a versatile and stylish solution for organizing your meetings. The Analyzing Related And Unrelated Diversification Strategies Market Expansion Through Professional Pdf features a modern design for your presentation meetings. The adjustable and customizable slides provide unlimited possibilities for acing up your presentation. Slidegeeks has done all the homework before launching the product for you. So, do not wait, grab the presentation templates today This slide showcases related and unrelated diversification techniques used by organizations for business growth. It compared both strategies on the basis of method, transferable resources, expected results and possibility of profits.

Analyzing Related And Unrelated Diversification Strategic Diversification Plan Structure PDF
This slide showcases related and unrelated diversification techniques used by organizations for business growth. It compared both strategies on the basis of method, transferable resources, expected results and possibility of profits. Want to ace your presentation in front of a live audience Our Analyzing Related And Unrelated Diversification Strategic Diversification Plan Structure PDF can help you do that by engaging all the users towards you. Slidegeeks experts have put their efforts and expertise into creating these impeccable powerpoint presentations so that you can communicate your ideas clearly. Moreover, all the templates are customizable, and easy-to-edit and downloadable. Use these for both personal and commercial use. This slide showcases related and unrelated diversification techniques used by organizations for business growth. It compared both strategies on the basis of method, transferable resources, expected results and possibility of profits.

Related And Unrelated Business Analyzing Related And Unrelated Diversification Strategies Strategy SS V
This slide showcases related and unrelated diversification techniques used by organizations for business growth. It compared both strategies on the basis of method, transferable resources, expected results and possibility of profits. Present like a pro with Related And Unrelated Business Analyzing Related And Unrelated Diversification Strategies Strategy SS V. Create beautiful presentations together with your team, using our easy-to-use presentation slides. Share your ideas in real-time and make changes on the fly by downloading our templates. So whether you are in the office, on the go, or in a remote location, you can stay in sync with your team and present your ideas with confidence. With Slidegeeks presentation got a whole lot easier. Grab these presentations today. This slide showcases related and unrelated diversification techniques used by organizations for business growth. It compared both strategies on the basis of method, transferable resources, expected results and possibility of profits.
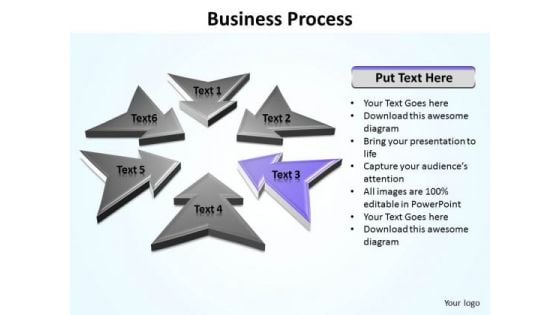
Ppt Direction Arrows Of Layout Editable PowerPoint World Map Templates
PPT direction arrows of layout editable powerpoint world map Templates-The above template contains a graphic of arrows pointing towards the center. Clarity of thought has been the key to your growth. Use our templates to illustrate your ability.-PPT direction arrows of layout editable powerpoint world map Templates-Abstract, Achievement, Aim, Arrow, Background, Business, Chart, Communication, Competition, Concept, Design, Direction, Development, Diagram, Direction, Finance, Financial, Forecast, Forward, Goal, Graph, Graphic, Growth, Icon, Illustration, Increase, Investment, Leader, Leadership, Design, Marketing, Price, Process, Profit, Progress, Progress, Shape, Sign, Success, Symbol, Target, Team, Teamwork Augment your assets with our Ppt Direction Arrows Of Layout Editable PowerPoint World Map Templates. They have many desirable attributes.

Decrease Sales Costs Powerpoint Slides Designs
This is a decrease sales costs powerpoint slides designs. This is a nine stage process. The stages in this process are decrease sales costs, decrease distribution costs, improve asset utilization, reduce working capital, increase gross profit, increase net operating profit, decrease operating cost, reduce assets, improve working deployment.
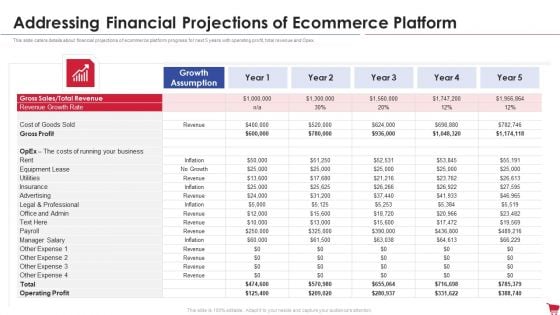
Ecommerce Platform Investor Capital Raising Elevator Addressing Financial Projections Of Ecommerce Platform Microsoft PDF
This slide caters details about financial projections of ecommerce platform progress for next 5 years with operating profit, total revenue and Opex. Deliver an awe inspiring pitch with this creative ecommerce platform investor capital raising elevator addressing financial projections of ecommerce platform microsoft pdf bundle. Topics like cost, business, growth, revenue, insurance can be discussed with this completely editable template. It is available for immediate download depending on the needs and requirements of the user.
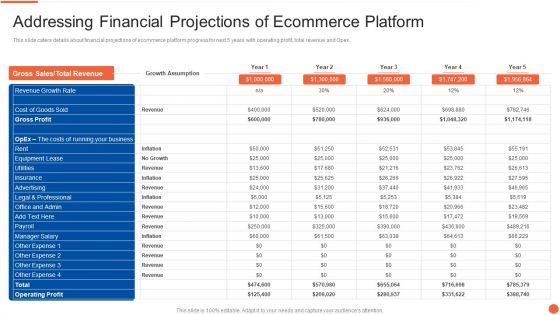
Addressing Financial Projections Of Ecommerce Platform Elements PDF
This slide caters details about financial projections of ecommerce platform progress for next 5 years with operating profit, total revenue and Opex.Deliver an awe inspiring pitch with this creative addressing financial projections of ecommerce platform elements pdf bundle. Topics like revenue growth, equipment lease, legal and professional can be discussed with this completely editable template. It is available for immediate download depending on the needs and requirements of the user.
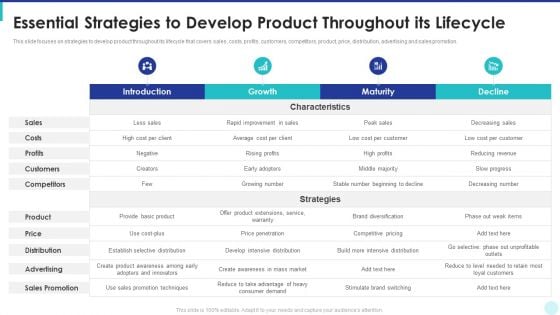
Optimization Of Product Development Life Cycle Essential Strategies To Develop Product Throughout Professional PDF
This slide focuses on strategies to develop product throughout its lifecycle that covers sales, costs, profits, customers, competitors, product, price, distribution, advertising and sales promotion. Deliver an awe inspiring pitch with this creative optimization of product development life cycle essential strategies to develop product throughout professional pdf bundle. Topics like introduction, growth, maturity, decline can be discussed with this completely editable template. It is available for immediate download depending on the needs and requirements of the user.
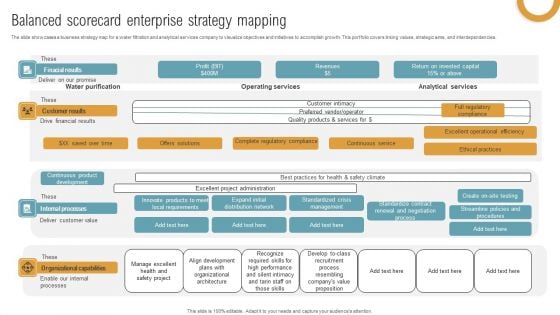
Balanced Scorecard Enterprise Strategy Mapping Designs PDF
The slide showcases a business strategy map for a water filtration and analytical services company to visualize objectives and initiatives to accomplish growth. This portfolio covers linking values, strategic aims, and interdependencies. Showcasing this set of slides titled Balanced Scorecard Enterprise Strategy Mapping Designs PDF. The topics addressed in these templates are Finacial Results, Profit, Revenues. All the content presented in this PPT design is completely editable. Download it and make adjustments in color, background, font etc. as per your unique business setting.
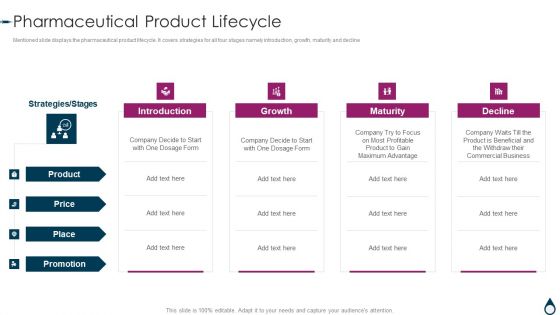
Quality Manufacturing Process For Generic Medicines Pharmaceutical Product Lifecycle Mockup PDF
Mentioned slide displays the pharmaceutical product lifecycle. It covers strategies for all four stages namely introduction, growth, maturity and decline. Deliver an awe inspiring pitch with this creative Quality Manufacturing Process For Generic Medicines Pharmaceutical Product Lifecycle Mockup PDF bundle. Topics like Price, Product, Profitable, Commercial Business can be discussed with this completely editable template. It is available for immediate download depending on the needs and requirements of the user.
Introduction Stage Of Product Cost Analysis Ppt Icon
This is a introduction stage of product cost analysis ppt icon. This is a five stage process. The stages in this process are high cost per customer acquired, innovators are targeted, little competition, negative profits, low sales, cost, targets, competition, profits, sales.

Increase In Dollar Graph Finance PowerPoint Templates And PowerPoint Themes 0912
Increase In Dollar Graph Finance PowerPoint Templates And PowerPoint Themes 0912-Microsoft Powerpoint Templates and Background with business graph with arrow showing profits-Business graph with arrow showing profits, signs, success, finance, business, arrows Encourage teams with our Increase In Dollar Graph Finance PowerPoint Templates And PowerPoint Themes 0912. Download without worries with our money back guaranteee.
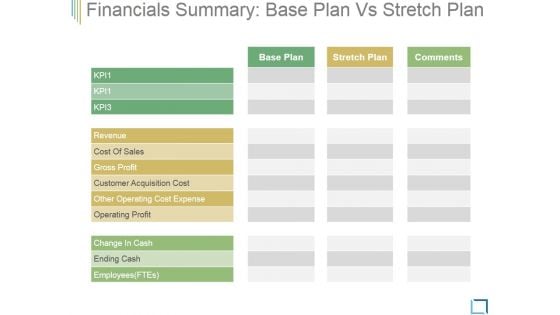
Financials Summary Base Plan Vs Stretch Plan Ppt PowerPoint Presentation Visuals
This is a financials summary base plan vs stretch plan ppt powerpoint presentation visuals. This is a three stage process. The stages in this process are revenue, cost of sales, gross profit, customer acquisition cost, other operating cost expense, operating profit, change in cash.
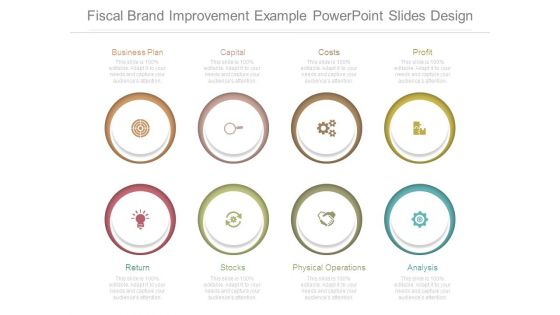
Fiscal Brand Improvement Example Powerpoint Slides Design
This is a fiscal brand improvement example powerpoint slides design. This is a eight stage process. The stages in this process are business plan, capital, costs, profit, return, stocks, physical operations, analysis.
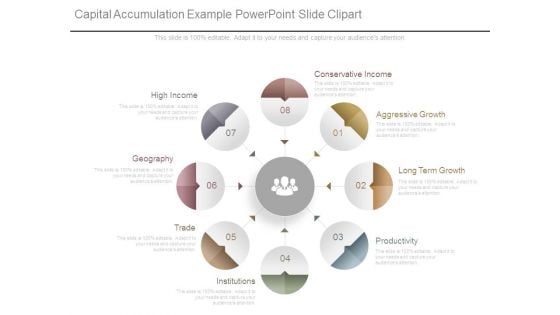
Capital Accumulation Example Powerpoint Slide Clipart
This is a Capital Accumulation Example Powerpoint Slide Clipart. This is a eight stage process. The stages in this process are high income, geography, trade, institutions, conservative income, aggressive growth, long term growth, productivity.
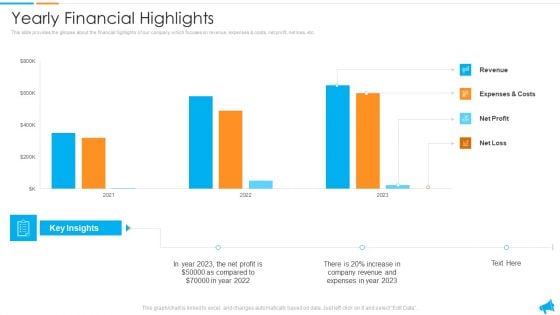
Strategy For Regional Economic Progress Outlining Yearly Financial Highlights Professional PDF
This slide provides the glimpse about the financial highlights of our company which focuses on revenue, expenses and costs, net profit, net loss, etc. Deliver an awe inspiring pitch with this creative strategy for regional economic progress outlining yearly financial highlights professional pdf bundle. Topics like revenue, expenses, net profit, costs can be discussed with this completely editable template. It is available for immediate download depending on the needs and requirements of the user.
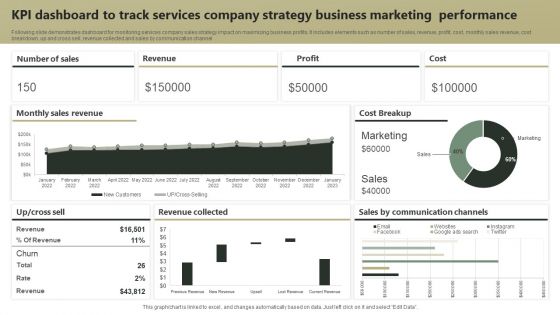
KPI Dashboard To Track Services Company Strategy Business Marketing Performance Guidelines PDF
Following slide demonstrates dashboard for monitoring services company sales strategy impact on maximizing business profits. It includes elements such as number of sales, revenue, profit, cost, monthly sales revenue, cost breakdown, up and cross sell, revenue collected and sales by communication channel. Showcasing this set of slides titled KPI Dashboard To Track Services Company Strategy Business Marketing Performance Guidelines PDF. The topics addressed in these templates are Revenue, Profit, Cost. All the content presented in this PPT design is completely editable. Download it and make adjustments in color, background, font etc. as per your unique business setting.
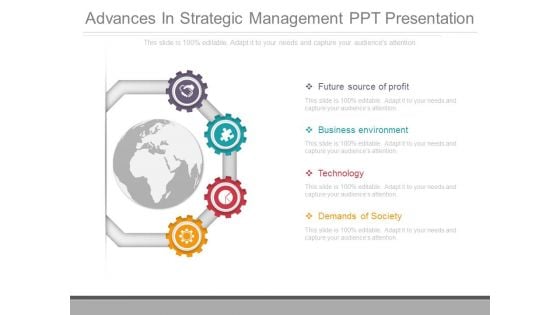
Advances In Strategic Management Ppt Presentation
This is an advances in strategic management ppt presentation. This is a four stage process. The stages in this process are future source of profit, business environment, technology, demands of society.
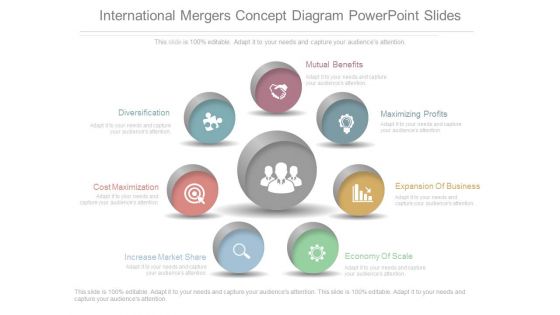
International Mergers Concept Diagram Powerpoint Slides
This is an international mergers concept diagram powerpoint slides. This is a seven stage process. The stages in this process are mutual benefits, maximizing profits, expansion of business, economy of scale, increase market share, cost maximization, diversification.
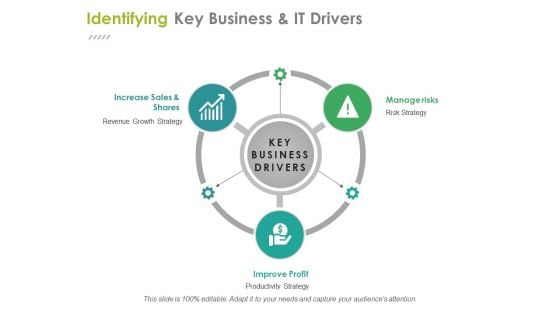
Identifying Key Business And It Drivers Ppt PowerPoint Presentation Ideas Files
This is a identifying key business and it drivers ppt powerpoint presentation ideas files. This is a three stage process. The stages in this process are increase sales and shares, improve profit, manage risks, business, management.

Advantages Of Price Advertising Marketing Technique Sample Pdf
This slide shows the advantages of adopting price promotion strategies in the organization. It includes revenue growth, inventory turnover, new customers, etc.Showcasing this set of slides titled Advantages Of Price Advertising Marketing Technique Sample Pdf The topics addressed in these templates are Inventory Turnover, Revenue Growth, New Customers All the content presented in this PPT design is completely editable. Download it and make adjustments in color, background, font etc. as per your unique business setting. This slide shows the advantages of adopting price promotion strategies in the organization. It includes revenue growth, inventory turnover, new customers, etc.
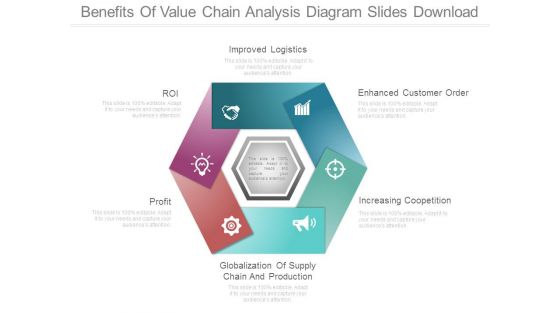
Benefits Of Value Chain Analysis Diagram Slides Download
This is a benefits of value chain analysis diagram slides download. This is a six stage process. The stages in this process are improved logistics, roi, profit, globalization of supply chain and production, enhanced customer order, increasing coopetition.
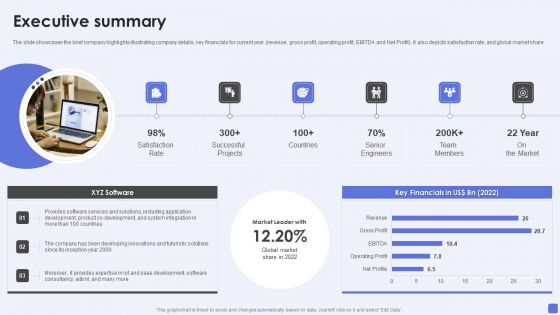
Software Services Business Profile Executive Summary Ppt PowerPoint Presentation File Elements PDF
The slide showcases the brief company highlights illustrating company details, key financials for current year revenue, gross profit, operating profit, EBITDA and Net Profit. It also depicts satisfaction rate, and global market share. Deliver an awe inspiring pitch with this creative Software Services Business Profile Executive Summary Ppt PowerPoint Presentation File Elements PDF bundle. Topics like Satisfaction Rate, Successful Projects, Senior Engineers can be discussed with this completely editable template. It is available for immediate download depending on the needs and requirements of the user.
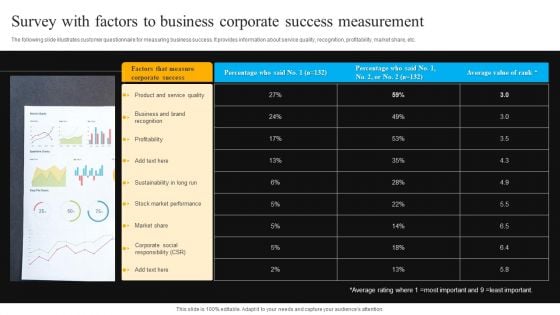
Survey With Factors To Business Corporate Success Measurement Themes PDF
The following slide illustrates customer questionnaire for measuring business success. It provides information about service quality, recognition, profitability, market share, etc. Pitch your topic with ease and precision using this Survey With Factors To Business Corporate Success Measurement Themes PDF. This layout presents information on Business And Brand, Profitability, Stock Market Performance. It is also available for immediate download and adjustment. So, changes can be made in the color, design, graphics or any other component to create a unique layout.

Business Diagram Roulette Wheel For Business Risk Presentation Template
Our above slide displays graphics of roulette wheel. Download our above diagram to express views on gambling, business risk and profit. Use this diagram to get good comments from viewers.

Statistics Highlighting Business Key Information Comprehensive Guide Mockup Pdf
The following slide highlights statistics presenting business vital information to gain basic understanding of business. It showcases information such as business worth, employees, countries, active customers, market share, revenue, operating profit, profit, industry and target audience. Make sure to capture your audiences attention in your business displays with our gratis customizable Statistics Highlighting Business Key Information Comprehensive Guide Mockup Pdf These are great for business strategies, office conferences, capital raising or task suggestions. If you desire to acquire more customers for your tech business and ensure they stay satisfied, create your own sales presentation with these plain slides. The following slide highlights statistics presenting business vital information to gain basic understanding of business. It showcases information such as business worth, employees, countries, active customers, market share, revenue, operating profit, profit, industry and target audience.
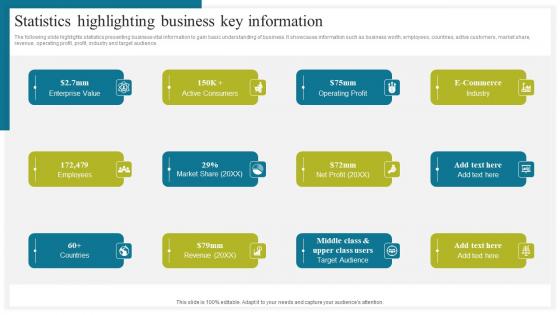
Statistics Highlighting Business Key How To Conduct Competitive Assessment Designs Pdf
The following slide highlights statistics presenting business vital information to gain basic understanding of business. It showcases information such as business worth, employees, countries, active customers, market share, revenue, operating profit, profit, industry and target audience. Make sure to capture your audiences attention in your business displays with our gratis customizable Statistics Highlighting Business Key How To Conduct Competitive Assessment Designs Pdf. These are great for business strategies, office conferences, capital raising or task suggestions. If you desire to acquire more customers for your tech business and ensure they stay satisfied, create your own sales presentation with these plain slides. The following slide highlights statistics presenting business vital information to gain basic understanding of business. It showcases information such as business worth, employees, countries, active customers, market share, revenue, operating profit, profit, industry and target audience.
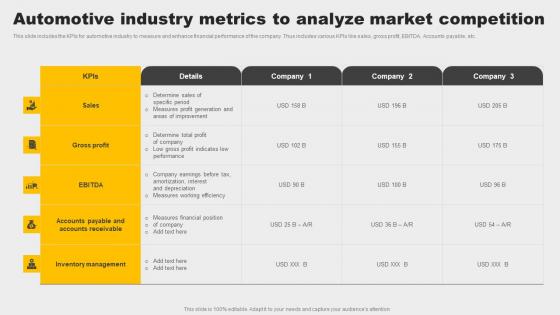
Automotive Industry Metrics To Analyze Market Competition Summary Pdf
This slide includes the KPIs for automotive industry to measure and enhance financial performance of the company. Thus includes various KPIs like sales, gross profit, EBITDA, Accounts payable, etc. Showcasing this set of slides titled Automotive Industry Metrics To Analyze Market Competition Summary Pdf. The topics addressed in these templates are Gross Profit, Inventory Management, Sales. All the content presented in this PPT design is completely editable. Download it and make adjustments in color, background, font etc. as per your unique business setting. This slide includes the KPIs for automotive industry to measure and enhance financial performance of the company. Thus includes various KPIs like sales, gross profit, EBITDA, Accounts payable, etc.
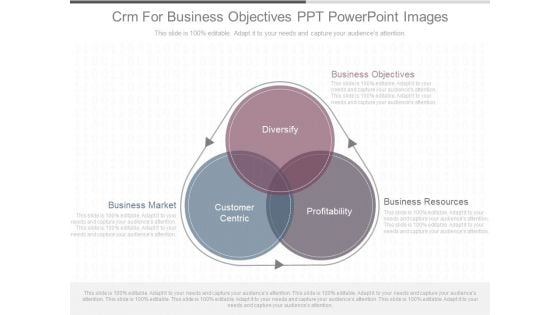
Crm For Business Objectives Ppt Powerpoint Images
This is a crm for business objectives ppt powerpoint images. This is a three stage process. The stages in this process are business market, business objectives, business resources, customer centric, diversify, profitability.
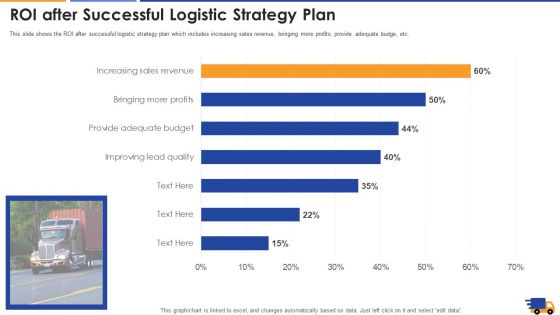
ROI After Successful Logistic Strategy Plan Brochure PDF
This slide shows the ROI after successful logistic strategy plan which includes increasing sales revenue, bringing more profits, provide adequate budge, etc. Deliver an awe inspiring pitch with this creative roi after successful logistic strategy plan brochure pdf bundle. Topics like quality, strategy plan, profit, budget can be discussed with this completely editable template. It is available for immediate download depending on the needs and requirements of the user.
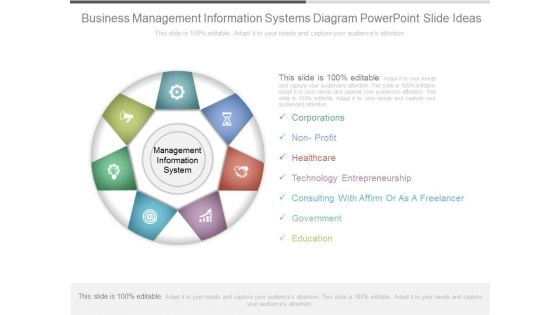
Business Management Information Systems Diagram Powerpoint Slide Ideas
This is a business management information systems diagram powerpoint slide ideas. This is a seven stage process. The stages in this process are corporations, non profit, healthcare, technology entrepreneurship, consulting with affirm or as a freelancer, government, education.
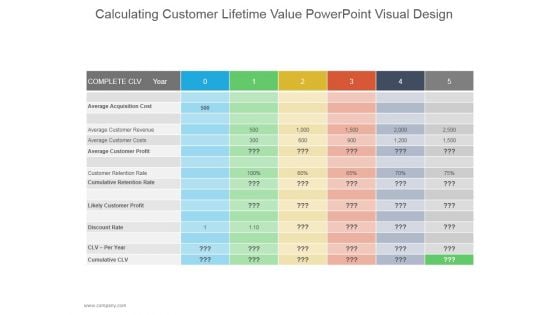
Calculating Customer Lifetime Value Ppt PowerPoint Presentation Introduction
This is a calculating customer lifetime value ppt powerpoint presentation introduction. This is a five stage process. The stages in this process are average acquisition cost, average customer revenue, likely customer profit.
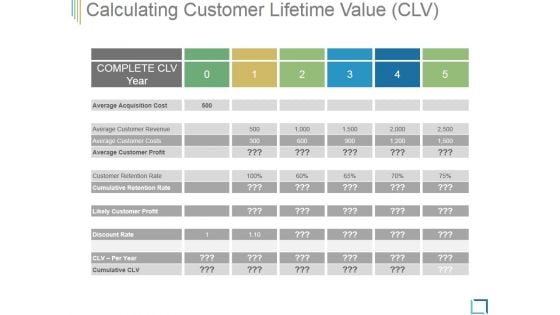
Calculating Customer Lifetime Value Ppt PowerPoint Presentation Templates
This is a calculating customer lifetime value ppt powerpoint presentation templates. This is a five stage process. The stages in this process are average acquisition cost, average customer revenue, average customer costs, average customer profit, customer retention rate.
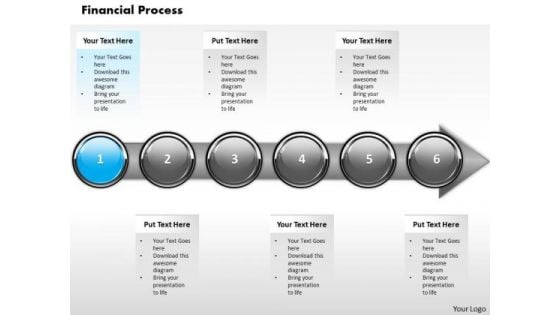
Ppt Sequential Demonstration Of Arrow Process Step 1 PowerPoint Templates
PPT sequential demonstration of arrow process step 1 PowerPoint Templates-With this pre-designed process arrows diagram you can visualize almost any type of concept, chronological process or steps of your strategies-PPT sequential demonstration of arrow process step 1 PowerPoint Templates-Abstract, Achievement, Aim, Arrow, Background, Business, Chart, Communication, Company, Competition, Concept, Design, Development, Diagram, Direction, Finance, Financial, Forecast, Forward, Goal, Graph, Graphic, Growth, Icon, Illustration, Increase, Investment, Leader, Leadership, Marketing, Motion, Moving, Orange, Path, Price, Process, Profit, Progress, Shape, Sign, Success, Symbol, Target, Team, Teamwork, Up, Upwards Accept accolades with our Ppt Sequential Demonstration Of Arrow Process Step 1 PowerPoint Templates. You will come out on top.
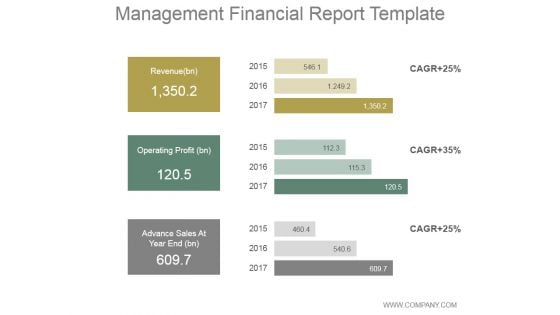
Management Financial Report Ppt PowerPoint Presentation Diagrams
This is a management financial report ppt powerpoint presentation diagrams. This is a three stage process. The stages in this process are revenue, operating profit, advance sales at year end.
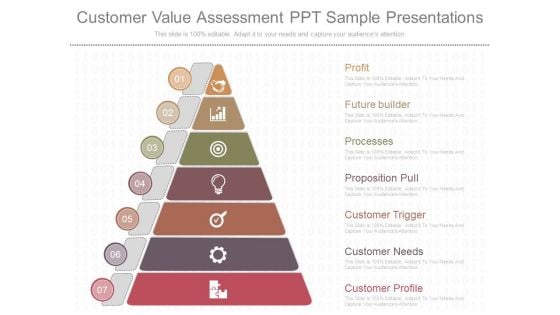
Customer Value Assessment Ppt Sample Presentations
This is a customer value assessment ppt sample presentations. This is a seven stage process. The stages in this process are customer profile, customer needs, customer trigger, proposition pull, processes, future builder, profit.
Market Segmentation Evaluation Ppt PowerPoint Presentation Icon Pictures
This is a market segmentation evaluation ppt powerpoint presentation icon pictures. This is a two stage process. The stages in this process are net profit, in usd millions, market sales, business, marketing.
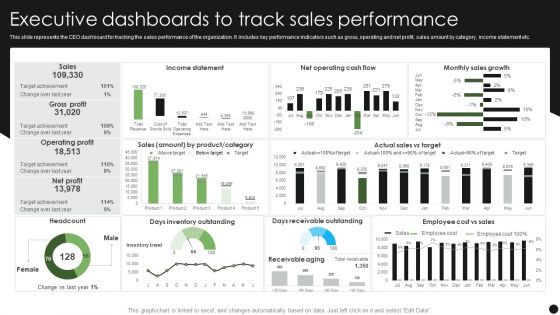
Executive Dashboards To Track Sales Performance Guidelines PDF
This slide represents the CEO dashboard for tracking the sales performance of the organization. It includes key performance indicators such as gross, operating and net profit, sales amount by category, income statement etc. Pitch your topic with ease and precision using this Executive Dashboards To Track Sales Performance Guidelines PDF. This layout presents information on Income Statement, Monthly Sales Growth, Days Receivable Outstanding. It is also available for immediate download and adjustment. So, changes can be made in the color, design, graphics or any other component to create a unique layout.
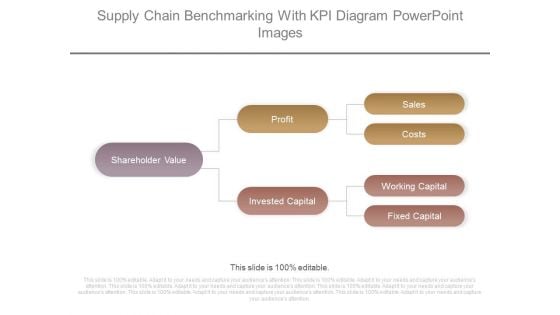
Supply Chain Benchmarking With Kpi Diagram Powerpoint Images
This is a supply chain benchmarking with kpi diagram powerpoint images. This is a three stage process. The stages in this process are shareholder value, profit, invested capital, sales, costs, working capital, fixed capital.
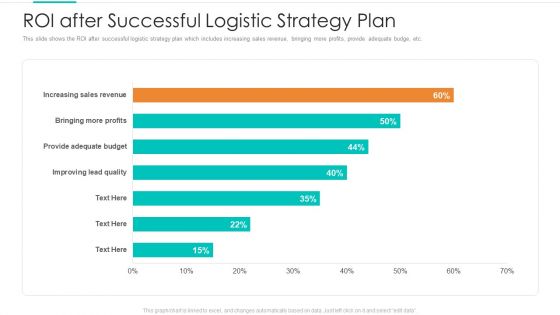
Planning Logistic Technique Superior Supply Chain Execution Roi After Successful Logistic Strategy Plan Themes PDF
This slide shows the ROI after successful logistic strategy plan which includes increasing sales revenue, bringing more profits, provide adequate budge, etc. Deliver an awe-inspiring pitch with this creative planning logistic technique superior supply chain execution roi after successful logistic strategy plan themes pdf bundle. Topics like sales revenue, profits, provide adequate budge can be discussed with this completely editable template. It is available for immediate download depending on the needs and requirements of the user.
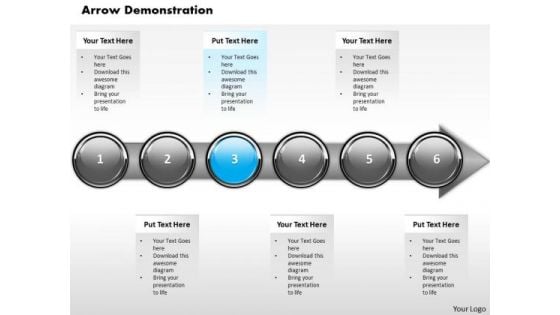
Ppt Homogeneous Demonstration Of Financial Process Using Stage 3 PowerPoint Templates
PPT homogeneous demonstration of financial process using stage 3 PowerPoint Templates-With this pre-designed process arrows diagram you can visualize almost any type of concept, chronological process or steps of your strategies.-PPT homogeneous demonstration of financial process using stage 3 PowerPoint Templates-Abstract, Achievement, Aim, Arrow, Background, Business, Chart, Communication, Company, Competition, Concept, Design, Development, Diagram, Direction, Finance, Financial, Forecast, Forward, Goal, Graph, Graphic, Growth, Icon, Illustration, Increase, Investment, Leader, Leadership, Marketing, Motion, Moving, Orange, Path, Price, Process, Profit, Progress, Shape, Sign, Success, Symbol, Target, Team, Teamwork, Up, Upwards Book you place at the top with our Ppt Homogeneous Demonstration Of Financial Process Using Stage 3 PowerPoint Templates. You will come out on top.
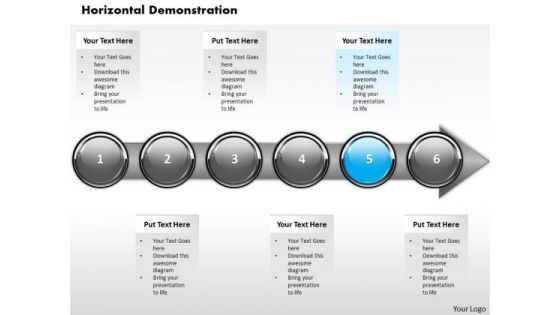
Ppt Consistent Demonstration Of Financial Process Using Stage 5 PowerPoint Templates
PPT consistent demonstration of financial process using stage 5 PowerPoint Templates-Highlight the key components of your entire financial process. Illustrate how each element flows seamlessly onto the next stage.-PPT consistent demonstration of financial process using stage 5 PowerPoint Templates-Abstract, Achievement, Aim, Arrow, Background, Business, Chart, Communication, Company, Competition, Concept, Design, Development, Diagram, Direction, Finance, Financial, Forecast, Forward, Goal, Graph, Graphic, Growth, Icon, Illustration, Increase, Investment, Leader, Leadership, Marketing, Motion, Moving, Orange, Path, Price, Process, Profit, Progress, Shape, Sign, Success, Symbol, Target, Team, Teamwork, Up, Upwards Crush your competition with our Ppt Consistent Demonstration Of Financial Process Using Stage 5 PowerPoint Templates. Just download, type and present.
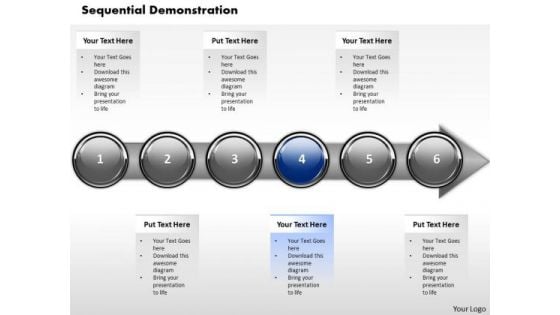
Ppt Horizontal Abstraction Of Financial Process Using Stage 4 PowerPoint Templates
PPT horizontal abstraction of financial process using stage 4 PowerPoint Templates-This diagram can be used in analyzing, designing, documenting or managing a process or program in various fields.-PPT horizontal abstraction of financial process using stage 4 PowerPoint Templates-Abstract, Achievement, Aim, Arrow, Background, Business, Chart, Communication, Company, Competition, Concept, Design, Development, Diagram, Direction, Finance, Financial, Forecast, Forward, Goal, Graph, Graphic, Growth, Icon, Illustration, Increase, Investment, Leader, Leadership, Marketing, Motion, Moving, Orange, Path, Price, Process, Profit, Progress, Shape, Sign, Success, Symbol, Target, Team, Teamwork, Up, Upwards Put in your every bit with our Ppt Horizontal Abstraction Of Financial Process Using Stage 4 PowerPoint Templates. They will give it their all.
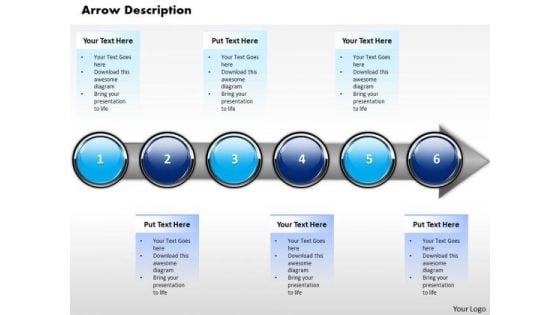
Ppt Horizontal Illustration Of Financial Process Using 6 State Diagram PowerPoint Templates
PPT horizontal illustration of financial process using 6 state diagram PowerPoint Templates-This diagram can be used in analyzing, designing, documenting or managing a process or program in various fields.-PPT horizontal illustration of financial process using 6 state diagram PowerPoint Templates-Abstract, Achievement, Aim, Arrow, Background, Business, Chart, Communication, Company, Competition, Concept, Design, Development, Diagram, Direction, Finance, Financial, Forecast, Forward, Goal, Graph, Graphic, Growth, Icon, Illustration, Increase, Investment, Leader, Leadership, Marketing, Motion, Moving, Orange, Path, Price, Process, Profit, Progress, Shape, Sign, Success, Symbol, Target, Team, Teamwork, Up, Upwards Spread awareness of digital tools. Whatever the divide our PT&s will bridge it.
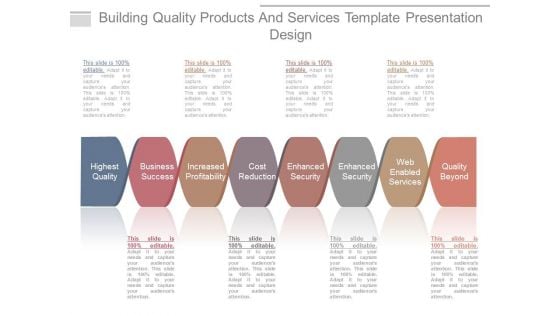
Building Quality Products And Services Template Presentation Design
This is a building quality products and services template presentation design. This is a eight stage process. The stages in this process are highest quality, business success, increased profitability, cost reduction, enhanced security, web enabled services, quality beyond.
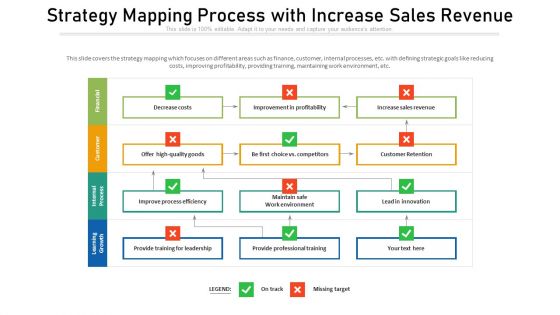
Strategy Mapping Process With Increase Sales Revenue Ppt Professional Styles PDF
This slide covers the strategy mapping which focuses on different areas such as finance, customer, internal processes, etc. with defining strategic goals like reducing costs, improving profitability, providing training, maintaining work environment, etc. Showcasing this set of slides titled strategy mapping process with increase sales revenue ppt professional styles pdf. The topics addressed in these templates are learning growth, internal process, customer, financial. All the content presented in this PPT design is completely editable. Download it and make adjustments in color, background, font etc. as per your unique business setting.
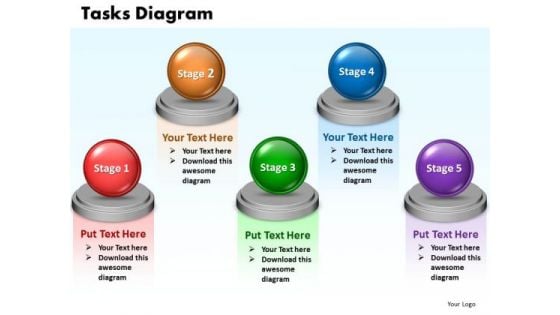
Ppt Multiple Tasks Network Diagram PowerPoint Template 5 Stages Templates
PPT multiple tasks network diagram powerpoint template 5 stages Templates-This PowerPoint slide shows a task management diagram. You can easily edit the size, position, text, color.-PPT multiple tasks network diagram powerpoint template 5 stages Templates-Achievement, Advance, Arrow, Aspirations, Background, Best, Business, Clipping, Concept, Design, Diagram, Efficiency, Footstep, Glory, Go, Good, Graph, Grow, Growth, Idea, Improvement, Level, Money, Moving, New, Next, Path, Planning, Profit, Progress, Red, Rich, Rise, Stage, Step, Success, Symbol, Task, Up, Upstairs, Victory Join the fight with our Ppt Multiple Tasks Network Diagram PowerPoint Template 5 Stages Templates. They will be advantageous for your cause.

Example Of Management Information System Ppt Powerpoint Guide
This is a example of management information system ppt powerpoint guide. This is a five stage process. The stages in this process are corporations, non profits, healthcare, accounting, sales.
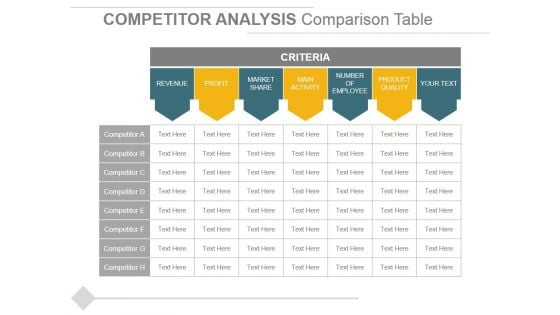
Competitor Analysis Comparison Table Ppt PowerPoint Presentation Outline Slides
This is a competitor analysis comparison table ppt powerpoint presentation outline slides. This is a two stage process. The stages in this process are revenue, profit, market share, main activity, number of employee, product quality.


 Continue with Email

 Home
Home


