Profit Icon

Pie Chart02 Business PowerPoint Templates And PowerPoint Backgrounds 0711
Microsoft PowerPoint Template and Background with pie chart Achieve strong & sustainable profit gains with our Pie Chart02 Business PowerPoint Templates And PowerPoint Backgrounds 0711. They will make you look good.
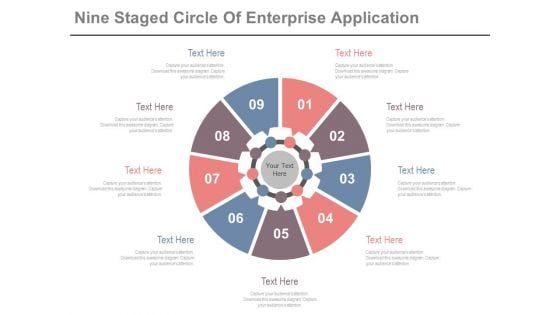
Circle Diagram For Business Marketing Mix Powerpoint Slides
This PowerPoint template has been designed with nine steps circle chart. This PPT slide can be used to prepare presentations for profit growth report and also for financial data analysis. You can download finance PowerPoint template to prepare awesome presentations.
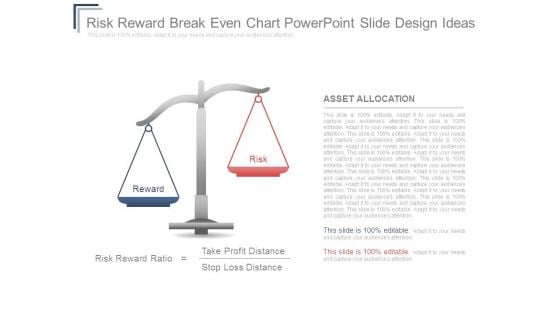
Risk Reward Breakeven Chart Powerpoint Slide Design Ideas
This is a risk reward breakeven chart powerpoint slide design ideas. This is a two stage process. The stages in this process are reward, risk, asset allocation, risk reward ratio, take profit distance, stop loss distance.
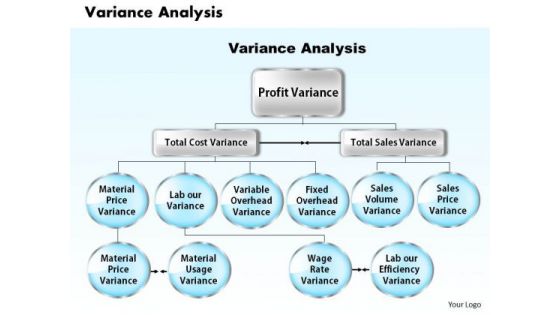
Business Framework Variance Analysis PowerPoint Presentation
This diagram shows framework of variance analysis. It contains flow diagram of profit variance, total cost variance and total sales variance. Download this diagram as a tool for business presentations.
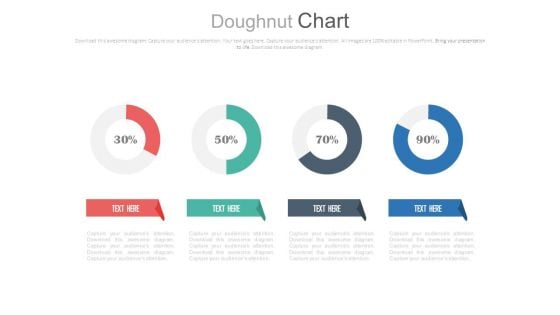
Four Circle Chart With Percentage Ratios Powerpoint Slides
This PowerPoint template has been designed with graphics of four circles and percentage ratios. You may use this dashboard slide design for topics like profit growth and financial planning. This PPT slide is powerful tool to describe your ideas.
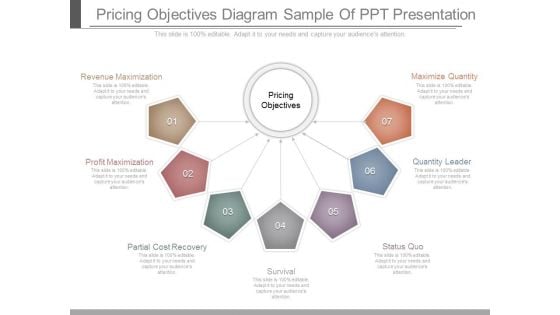
Pricing Objectives Diagram Sample Of Ppt Presentation
This is a pricing objectives diagram sample of ppt presentation. This is a seven stage process. The stages in this process are pricing objectives, revenue maximization, profit maximization, partial cost recovery, survival, status quo, quantity leader, maximize quantity.
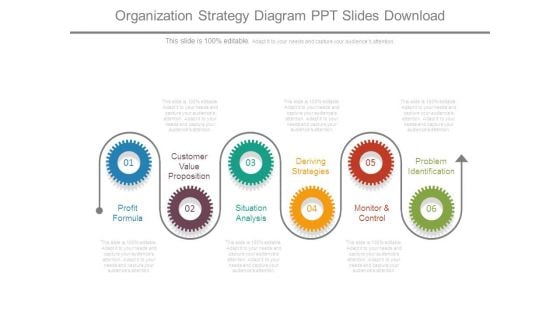
Organization Strategy Diagram Ppt Slides Download
This is a organization strategy diagram ppt slides download. This is a six stage process. The stages in this process are profit formula, customer value proposition, situation analysis, deriving strategies, monitor and control, problem identification.
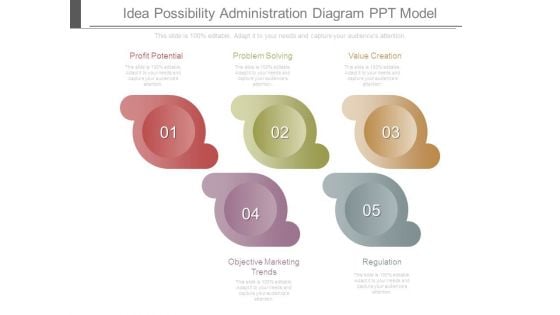
Idea Possibility Administration Diagram Ppt Model
This is a idea possibility administration diagram ppt model. This is a five stage process. The stages in this process are profit potential, problem solving, value creation, objective marketing trends, regulation.
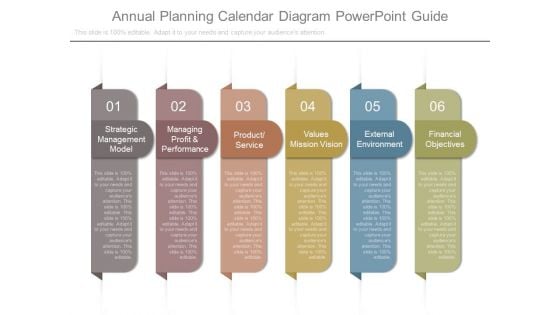
Annual Planning Calendar Diagram Powerpoint Guide
This is a annual planning calendar diagram powerpoint guide. This is a six stage process. The stages in this process are strategic management model, managing profit and performance, product service, values mission vision, external environment, financial objectives.

Serious Speaker Business PowerPoint Themes And PowerPoint Slides 0411
Microsoft PowerPoint Theme and Slide with serious speaker shows finance profit Be superman with our Serious Speaker Business PowerPoint Themes And PowerPoint Slides 0411. You will come out on top.

Businessman Watching Arrow Success PowerPoint Themes And PowerPoint Slides 0211
Microsoft PowerPoint Theme and Slide with businessman watching business profit graph The adaptability of our Businessman Watching Arrow Success PowerPoint Themes And PowerPoint Slides 0211 is a fact. They will align with your bidding.

Business01 People PowerPoint Themes And PowerPoint Slides 0511
Microsoft PowerPoint Slide and Theme with business people working around office buildings Achieve strong & sustainable profit gains with our Business01 People PowerPoint Themes And PowerPoint Slides 0511. They will make you look good.
Bar Graph Dollar Money PowerPoint Templates And PowerPoint Themes 0412
Microsoft Powerpoint Templates and Background with profit graph With our Bar Graph Dollar Money PowerPoint Templates And PowerPoint Themes 0412 you will feel up to it. Derive the confidence to go for it.
Bar Graph Finance PowerPoint Templates And PowerPoint Themes 0412
Microsoft Powerpoint Templates and Background with profit graph Bubble up to the top with our Bar Graph Finance PowerPoint Templates And PowerPoint Themes 0412. You will come out on top.

Global Business Finance PowerPoint Templates And PowerPoint Themes 0412
Microsoft Powerpoint Templates and Background with profit graph So far, so good is not enough. Go further and better with our Global Business Finance PowerPoint Templates And PowerPoint Themes 0412.
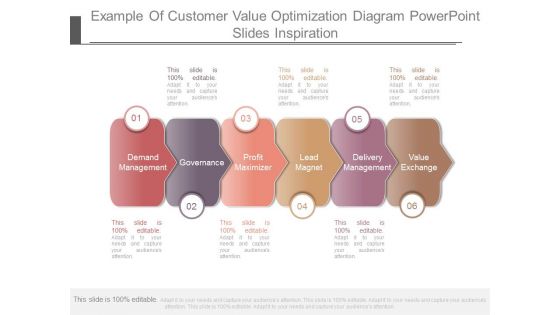
Example Of Customer Value Optimization Diagram Powerpoint Slides Inspiration
This is a example of customer value optimization diagram powerpoint slides inspiration. This is a six stage process. The stages in this process are demand management, governance, profit maximizer, lead magnet, delivery management, value exchange.

Example Of Customer Value Optimization Diagram Ppt Inspiration
This is a example of customer value optimization diagram ppt inspiration. This is a five stage process. The stages in this process are lead magnet, core offer, return path, tripwire, profit maximizer.
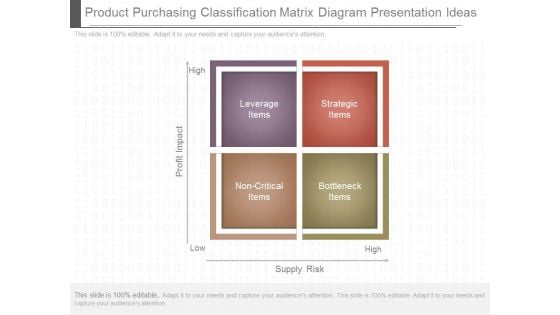
Product Purchasing Classification Matrix Diagram Presentation Ideas
This is a product purchasing classification matrix diagram presentation ideas. This is a four stage process. The stages in this process are leverage items, strategic items, bottleneck items, non critical items, high, low, profit impact, supply risk.
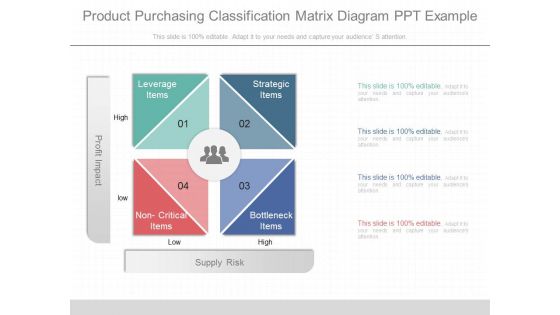
Product Purchasing Classification Matrix Diagram Ppt Example
This is a product purchasing classification matrix diagram ppt example. This is a four stage process. The stages in this process are profit impact, supply risk, leverage items, non critical items, bottleneck items, strategic items.
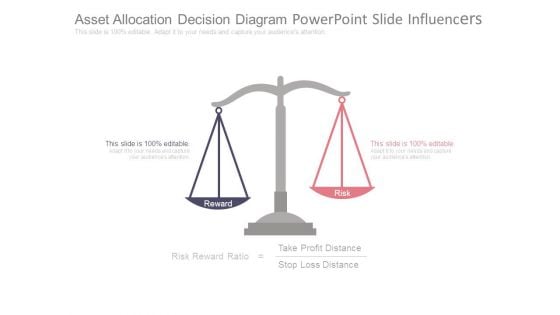
Asset Allocation Decision Diagram Powerpoint Slide Influencers
This is a asset allocation decision diagram powerpoint slide influencers. This is a two stage process. The stages in this process are risk reward ratio, take profit distance, stop loss distance, reward, risk.
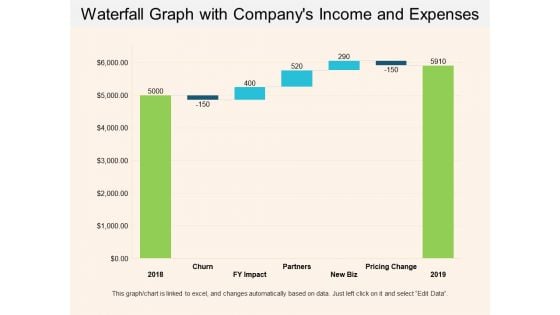
Waterfall Graph With Companys Income And Expenses Ppt PowerPoint Presentation Show Example Introduction
This is a waterfall graph with companys income and expenses ppt powerpoint presentation show example introduction. This is a three stage process. The stages in this process are profit and loss, balance sheet, income statement, benefit and loss.
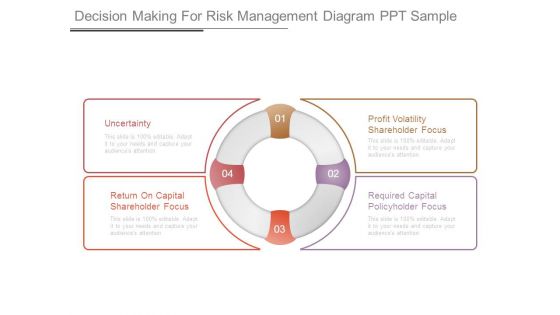
Decision Making For Risk Management Diagram Ppt Sample
This is a decision making for risk management diagram ppt sample. This is a four stage process. The stages in this process are uncertainty, return on capital shareholder focus, profit volatility shareholder focus, required capital policyholder focus.
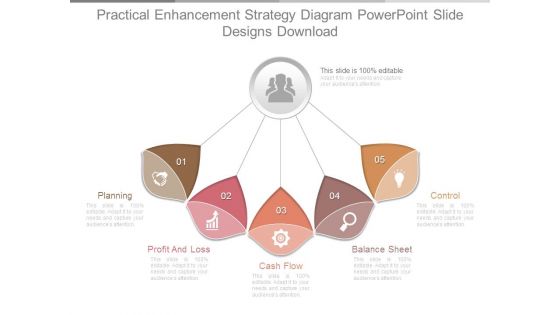
Practical Enhancement Strategy Diagram Powerpoint Slide Designs Download
This is a practical enhancement strategy diagram powerpoint slide designs download. This is a five stage process. The stages in this process are planning, profit and loss, cash flow, balance sheet, control.

Doctor With Smiley Mask Medical PowerPoint Themes And PowerPoint Slides 0411
Microsoft PowerPoint Theme and Slide with portrait of assistant in mask with big smile Achieve strong & sustainable profit gains with our Doctor With Smiley Mask Medical PowerPoint Themes And PowerPoint Slides 0411. They will make you look good.
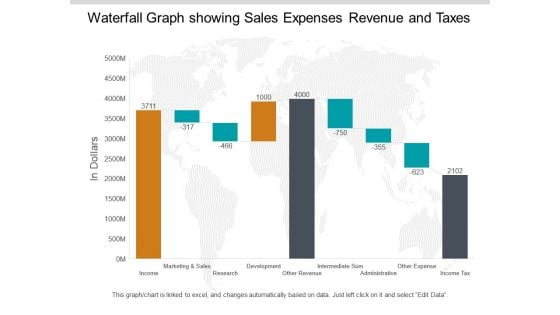
Waterfall Graph Showing Sales Expenses Revenue And Taxes Ppt PowerPoint Presentation Pictures Summary
This is a waterfall graph showing sales expenses revenue and taxes ppt powerpoint presentation pictures summary. This is a three stage process. The stages in this process are profit and loss, balance sheet, income statement, benefit and loss.
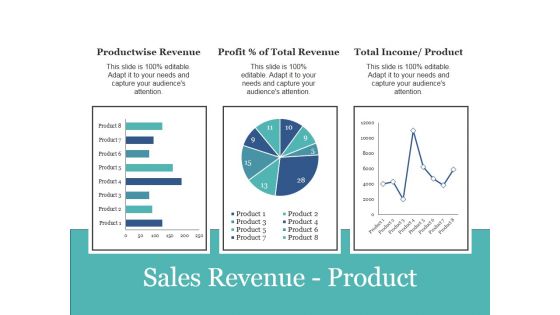
Sales Revenue Product Ppt PowerPoint Presentation Infographic Template Backgrounds
This is a sales revenue product ppt powerpoint presentation infographic template backgrounds. This is a three stage process. The stages in this process are product wise revenue, profit percent of total revenue, total income product.
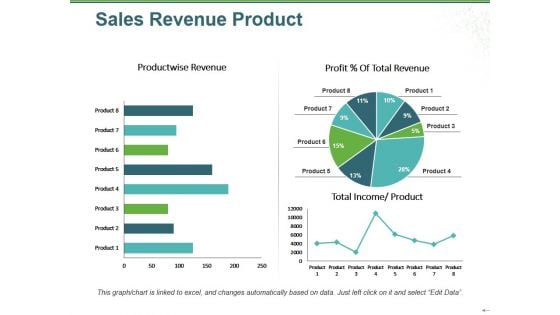
Sales Revenue Product Ppt PowerPoint Presentation Infographic Template Infographic Template
This is a sales revenue product ppt powerpoint presentation infographic template infographic template. This is a three stage process. The stages in this process are product wise revenue, total income, product, profit total revenue, pie.
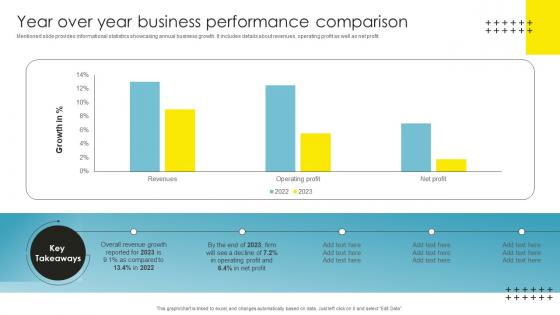
Strategic Brand Management Year Over Year Business Performance Brochure Pdf
Mentioned slide provides informational statistics showcasing annual business growth. It includes details about revenues, operating profit as well as net profit. Slidegeeks is here to make your presentations a breeze with Strategic Brand Management Year Over Year Business Performance Brochure Pdf With our easy to use and customizable templates, you can focus on delivering your ideas rather than worrying about formatting. With a variety of designs to choose from, you are sure to find one that suits your needs. And with animations and unique photos, illustrations, and fonts, you can make your presentation pop. So whether you are giving a sales pitch or presenting to the board, make sure to check out Slidegeeks first. Mentioned slide provides informational statistics showcasing annual business growth. It includes details about revenues, operating profit as well as net profit.
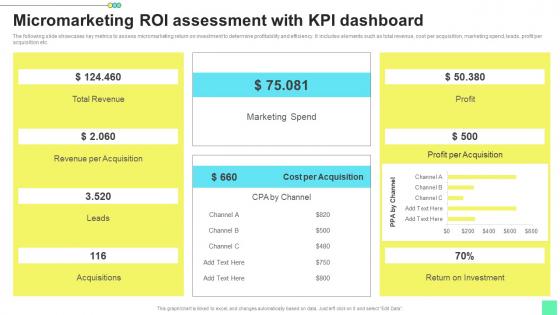
Micromarketing Roi Assessment Introduction To Niche Marketing Audience Segmentation Portrait Pdf
The following slide showcases key metrics to assess micromarketing return on investment to determine profitability and efficiency. It includes elements such as total revenue, cost per acquisition, marketing spend, leads, profit per acquisition etc. Take your projects to the next level with our ultimate collection of Micromarketing Roi Assessment Introduction To Niche Marketing Audience Segmentation Portrait Pdf. Slidegeeks has designed a range of layouts that are perfect for representing task or activity duration, keeping track of all your deadlines at a glance. Tailor these designs to your exact needs and give them a truly corporate look with your own brand colors they will make your projects stand out from the rest The following slide showcases key metrics to assess micromarketing return on investment to determine profitability and efficiency. It includes elements such as total revenue, cost per acquisition, marketing spend, leads, profit per acquisition etc.
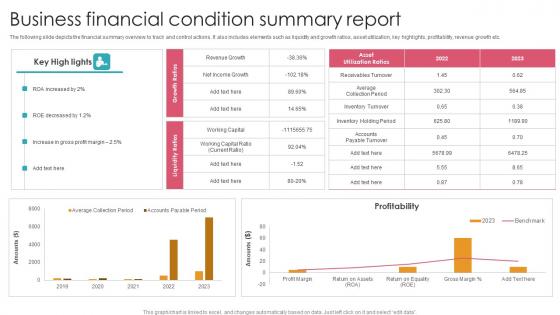
Business Financial Condition Summary Report Graphics Pdf
The following slide depicts the financial summary overview to track and control actions. It also includes elements such as liquidity and growth ratios, asset utilization, key highlights, profitability, revenue growth etc. Pitch your topic with ease and precision using this Business Financial Condition Summary Report Graphics Pdf. This layout presents information on Profitability, Increase Gross Profit Margin, Roe Decreased. It is also available for immediate download and adjustment. So, changes can be made in the color, design, graphics or any other component to create a unique layout. The following slide depicts the financial summary overview to track and control actions. It also includes elements such as liquidity and growth ratios, asset utilization, key highlights, profitability, revenue growth etc.
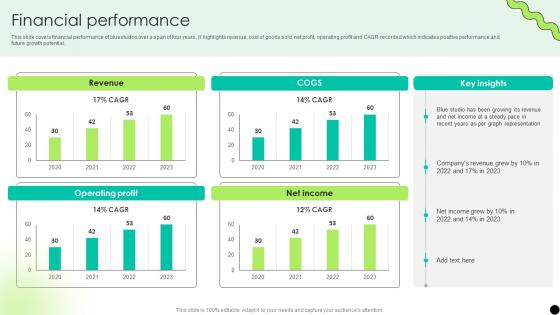
Financial Performance Digital Payment Platform Pitch Deck
This slide covers financial performance of bluestudios over a span of four years. It highlights revenue, cost of goods sold, net profit, operating profit and CAGR recorded which indicates positive performance and future growth potential. From laying roadmaps to briefing everything in detail, our templates are perfect for you. You can set the stage with your presentation slides. All you have to do is download these easy-to-edit and customizable templates. Financial Performance Digital Payment Platform Pitch Deck will help you deliver an outstanding performance that everyone would remember and praise you for. Do download this presentation today. This slide covers financial performance of bluestudios over a span of four years. It highlights revenue, cost of goods sold, net profit, operating profit and CAGR recorded which indicates positive performance and future growth potential.
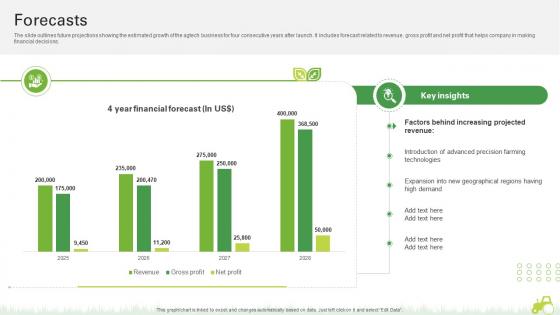
Forecasts Agro Innovation Startup Go To Market Strategy GTM SS V
The slide outlines future projections showing the estimated growth of the agtech business for four consecutive years after launch. It includes forecast related to revenue, gross profit and net profit that helps company in making financial decisions.From laying roadmaps to briefing everything in detail, our templates are perfect for you. You can set the stage with your presentation slides. All you have to do is download these easy-to-edit and customizable templates. Forecasts Agro Innovation Startup Go To Market Strategy GTM SS V will help you deliver an outstanding performance that everyone would remember and praise you for. Do download this presentation today. The slide outlines future projections showing the estimated growth of the agtech business for four consecutive years after launch. It includes forecast related to revenue, gross profit and net profit that helps company in making financial decisions.
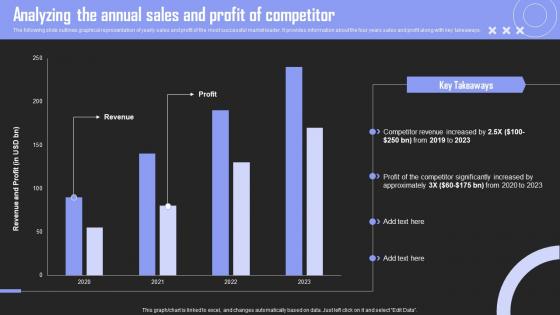
Analyzing The Annual Brand Building Techniques To Gain Competitive Edge Structure Pdf
The following slide outlines graphical representation of yearly sales and profit of the most successful market leader. It provides information about the four years sales and profit along with key takeaways. Want to ace your presentation in front of a live audience Our Analyzing The Annual Brand Building Techniques To Gain Competitive Edge Structure Pdf can help you do that by engaging all the users towards you. Slidegeeks experts have put their efforts and expertise into creating these impeccable powerpoint presentations so that you can communicate your ideas clearly. Moreover, all the templates are customizable, and easy to edit and downloadable. Use these for both personal and commercial use. The following slide outlines graphical representation of yearly sales and profit of the most successful market leader. It provides information about the four years sales and profit along with key takeaways.
Enhancing Global Presence Dashboard For Tracking Post Expansion Formats Pdf
This slide covers the dashboard for analyzing fast food business sales by region. It includes KPIs such as sales, sales target, target achievement, gross profit, gross profit margin, sales by channels, sales growth, etc.If your project calls for a presentation, then Slidegeeks is your go-to partner because we have professionally designed, easy-to-edit templates that are perfect for any presentation. After downloading, you can easily edit Enhancing Global Presence Dashboard For Tracking Post Expansion Formats Pdf and make the changes accordingly. You can rearrange slides or fill them with different images. Check out all the handy templates This slide covers the dashboard for analyzing fast food business sales by region. It includes KPIs such as sales, sales target, target achievement, gross profit, gross profit margin, sales by channels, sales growth, etc.
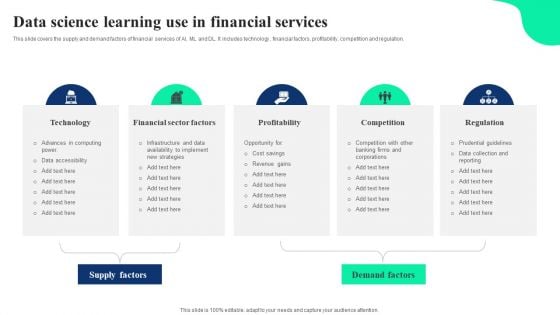
Data Science Learning Use In Financial Services Ppt Infographic Template Graphics PDF
This slide covers the supply and demand factors of financial services of AI, ML and DL. It includes technology , financial factors, profitability, competition and regulation. Presenting Data Science Learning Use In Financial Services Ppt Infographic Template Graphics PDF to dispense important information. This template comprises five stages. It also presents valuable insights into the topics including Technology, Financial Sector Factors, Profitability, Competition, Regulation. This is a completely customizable PowerPoint theme that can be put to use immediately. So, download it and address the topic impactfully.
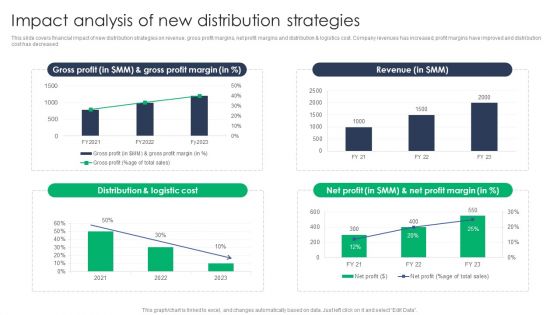
Criterion For Choosing Distribution Channel For Efficient Sales Administration Impact Analysis Elements PDF
This slide covers financial impact of new distribution strategies on revenue, gross profit margins, net profit margins and distribution and logistics cost. Company revenues has increased, profit margins have improved and distribution cost has decreased. This slide showcases the expected growth of company from new distribution channels. The growth is highlighted in terms of revenue numbers, net profit, customer base, products sold etc. Make sure to capture your audiences attention in your business displays with our gratis customizable Criterion For Choosing Distribution Channel For Efficient Sales Administration Impact Analysis Elements PDF. These are great for business strategies, office conferences, capital raising or task suggestions. If you desire to acquire more customers for your tech business and ensure they stay satisfied, create your own sales presentation with these plain slides.
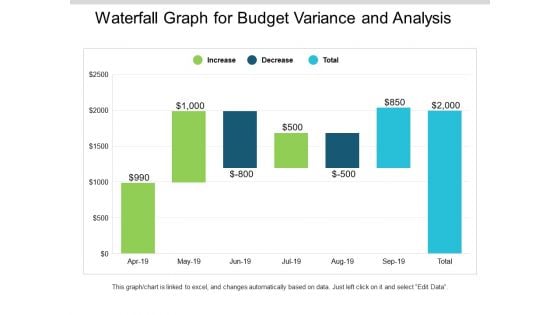
Waterfall Graph For Budget Variance And Analysis Ppt PowerPoint Presentation Slides Mockup
This is a waterfall graph for budget variance and analysis ppt powerpoint presentation slides mockup. This is a three stage process. The stages in this process are profit and loss, balance sheet, income statement, benefit and loss.
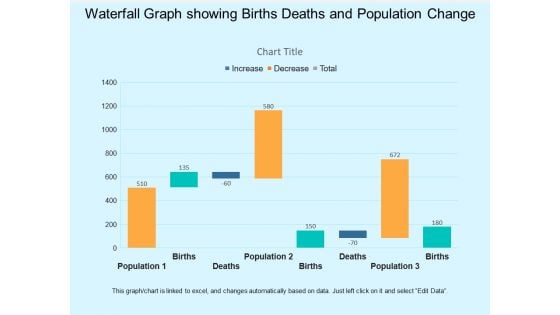
Waterfall Graph Showing Births Deaths And Population Change Ppt PowerPoint Presentation Infographic Template Visual Aids
This is a waterfall graph showing births deaths and population change ppt powerpoint presentation infographic template visual aids. This is a three stage process. The stages in this process are profit and loss, balance sheet, income statement, benefit and loss.
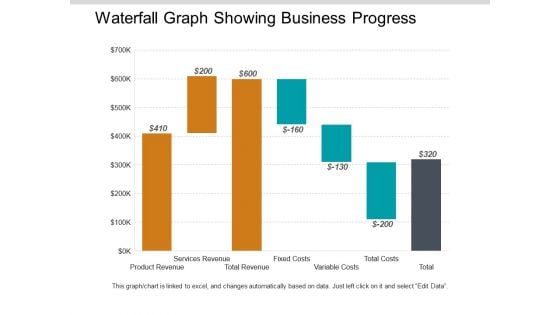
Waterfall Graph Showing Business Progress Ppt PowerPoint Presentation Styles Model
This is a waterfall graph showing business progress ppt powerpoint presentation styles model. This is a three stage process. The stages in this process are profit and loss, balance sheet, income statement, benefit and loss.
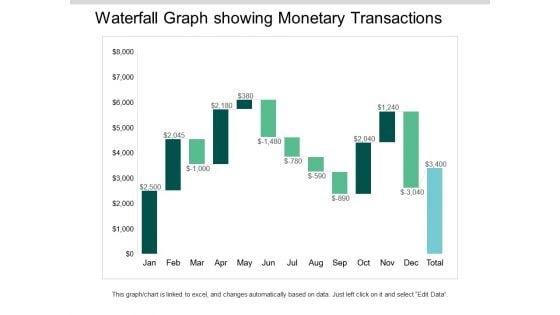
Waterfall Graph Showing Monetary Transactions Ppt PowerPoint Presentation Ideas Visuals
This is a waterfall graph showing monetary transactions ppt powerpoint presentation ideas visuals. This is a three stage process. The stages in this process are profit and loss, balance sheet, income statement, benefit and loss.
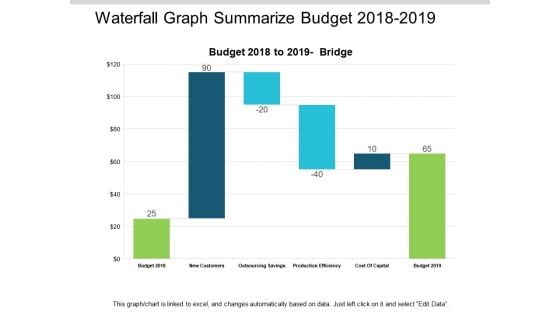
Waterfall Graph Summarize Budget 2018 To 2019 Ppt PowerPoint Presentation Summary Slides
This is a waterfall graph summarize budget 2018 to 2019 ppt powerpoint presentation summary slides. This is a three stage process. The stages in this process are profit and loss, balance sheet, income statement, benefit and loss.
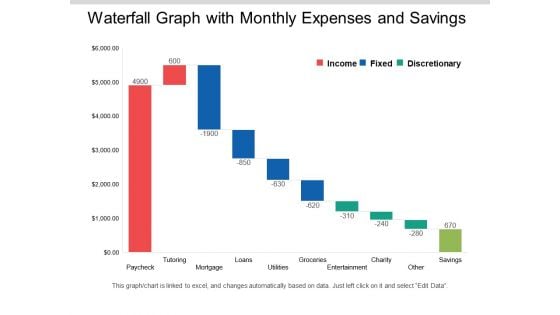
Waterfall Graph With Monthly Expenses And Savings Ppt PowerPoint Presentation Layouts Clipart Images
This is a waterfall graph with monthly expenses and savings ppt powerpoint presentation layouts clipart images. This is a three stage process. The stages in this process are profit and loss, balance sheet, income statement, benefit and loss.
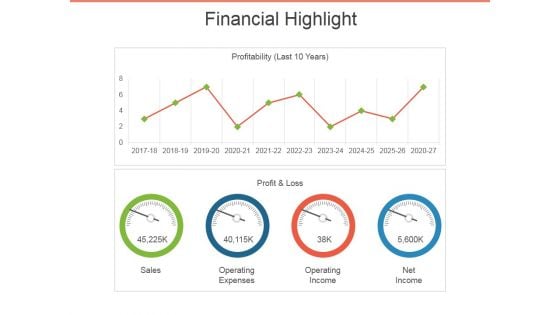
Financial Highlight Template 2 Ppt PowerPoint Presentation Outline Visuals
This is a financial highlight template 2 ppt powerpoint presentation outline visuals. This is a two stage process. The stages in this process are sales, profit and loss, operating expenses, operating income, net income.
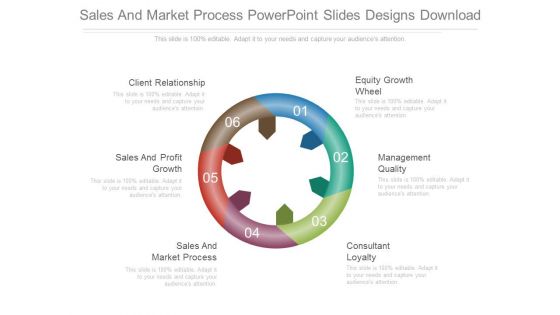
Sales And Market Process Powerpoint Slides Designs Download
This is a sales and market process powerpoint slides designs download. This is a six stage process. The stages in this process are client relationship, sales and profit growth, sales and market process, consultant loyalty, management quality, equity growth wheel.
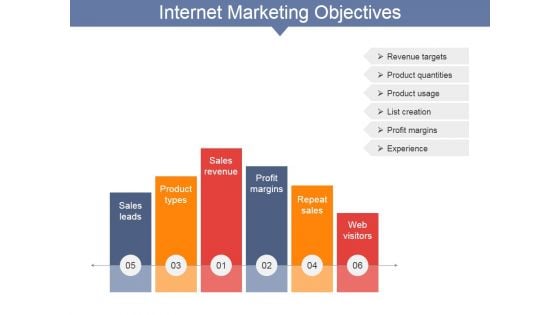
Internet Marketing Objectives Ppt PowerPoint Presentation Layouts Smartart
This is a internet marketing objectives ppt powerpoint presentation layouts smartart. This is a six stage process. The stages in this process are sales leads, product types, sales revenue, profit margins, repeat sales, web visitors.
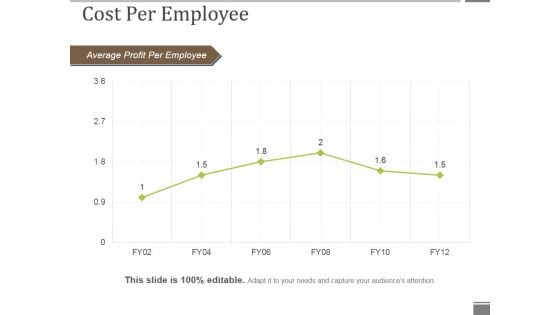
Cost Per Employee Ppt PowerPoint Presentation Model Graphics Download
This is a cost per employee ppt powerpoint presentation model graphics download. This is a six stage process. The stages in this process are average profit per employee, line chart, business, marketing, management.

Successful Business PowerPoint Templates And PowerPoint Backgrounds 0511
Microsoft PowerPoint Template and Background with handful of cash profit chart and a firm handshake Let the audience decide with our Successful Business PowerPoint Templates And PowerPoint Backgrounds 0511. Make sure your presentation gets the attention it deserves.

Business People With Growth Success PowerPoint Templates And PowerPoint Backgrounds 0511
Microsoft PowerPoint Template and Background with graph chart showing profit increase for business reports Our Business People With Growth Success PowerPoint Templates And PowerPoint Backgrounds 0511 are a great equaliser. They take everybody to the same level.
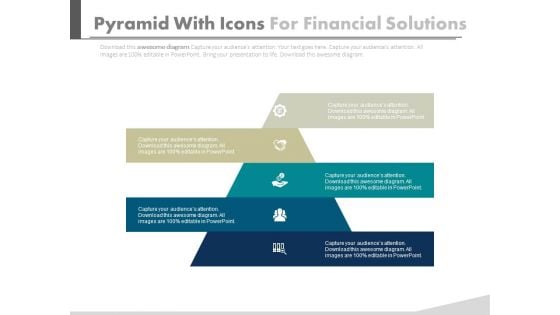
Pyramid For Financial Accounting Information Powerpoint Slides
This PowerPoint template has been designed with graphics of pyramid chart. This PPT slide can be used to prepare presentations for profit growth report and also for financial data analysis. You can download finance PowerPoint template to prepare awesome presentations.
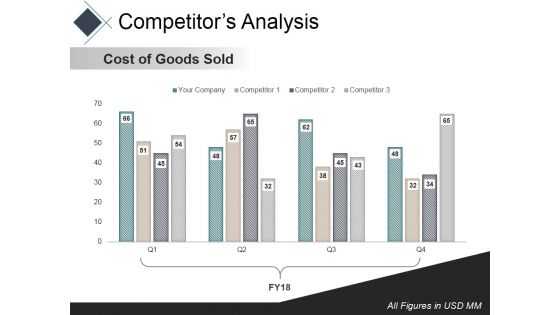
Competitors Analysis Template Ppt PowerPoint Presentation Infographic Template Rules
This is a competitors analysis template ppt powerpoint presentation infographic template rules. This is a four stage process. The stages in this process are net profit margin, finance, marketing, bar, success.
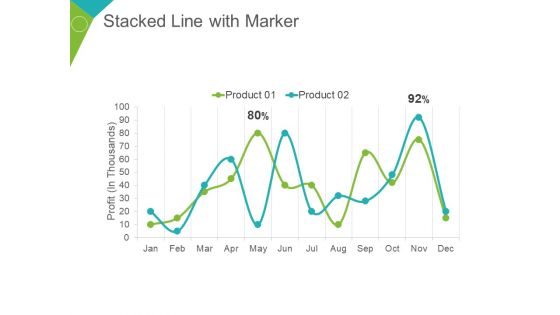
Stacked Line With Marker Ppt PowerPoint Presentation Summary Demonstration
This is a stacked line with marker ppt powerpoint presentation summary demonstration. This is a two stage process. The stages in this process are profit in thousands, product, percentage, finance, business.
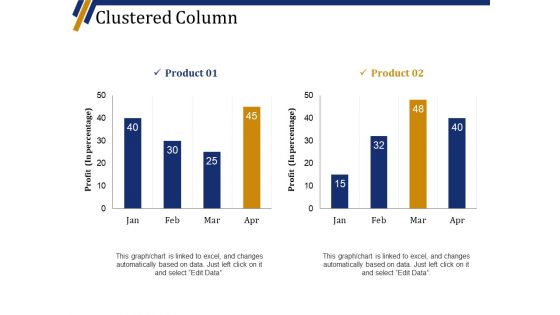
Clustered Column Ppt PowerPoint Presentation Professional Graphic Tips
This is a clustered column ppt powerpoint presentation professional graphic tips. This is a two stage process. The stages in this process are product, profit in percentage, graph, business, marketing.
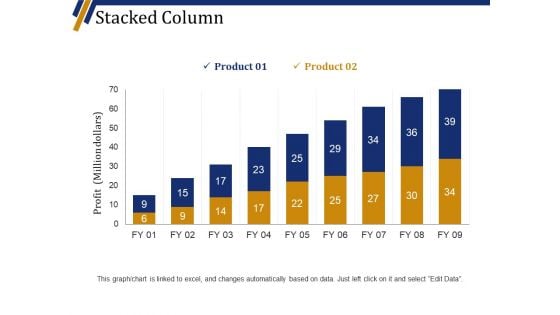
Stacked Column Ppt PowerPoint Presentation Professional Template
This is a stacked column ppt powerpoint presentation professional template. This is a nine stage process. The stages in this process are product, profit million dollars, business, marketing, graph.
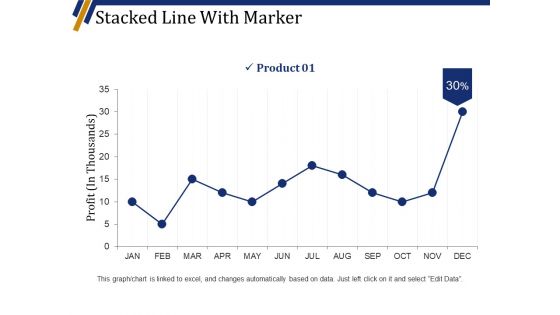
Stacked Line With Marker Ppt PowerPoint Presentation Professional Pictures
This is a stacked line with marker ppt powerpoint presentation professional pictures. This is a twelve stage process. The stages in this process are product, profit in thousands, business, graph, marketing.
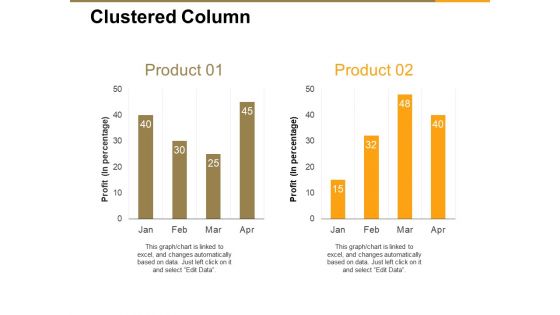
Clustered Column Ppt PowerPoint Presentation Inspiration Shapes
This is a clustered column ppt powerpoint presentation inspiration shapes. This is a two stage process. The stages in this process are profit in percentage, business, marketing, graph, finance.
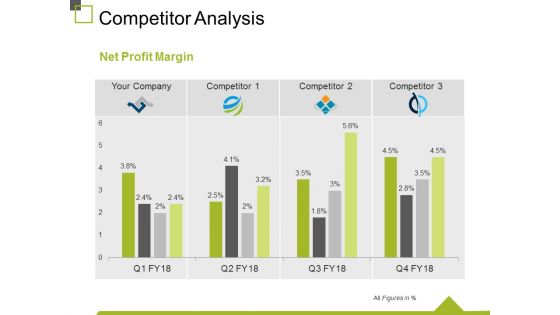
Competitor Analysis Template 4 Ppt PowerPoint Presentation Gallery Design Templates
This is a competitor analysis template 4 ppt powerpoint presentation gallery design templates. This is a four stage process. The stages in this process are business, marketing, analysis, graph, net profit margin.
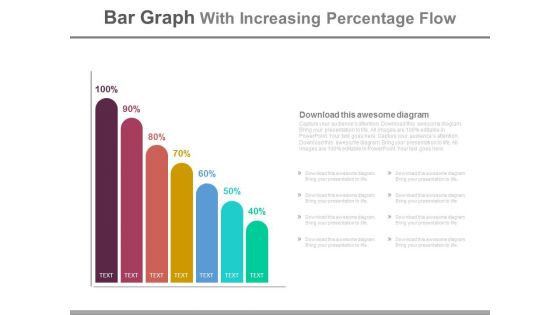
Bar Graph With Increasing Percentage Flow Powerpoint Slides
This PowerPoint slide has been designed with bar graph and increasing percentage values. This diagram slide may be used to display profit growth. Prove the viability of your ideas with this professional slide.
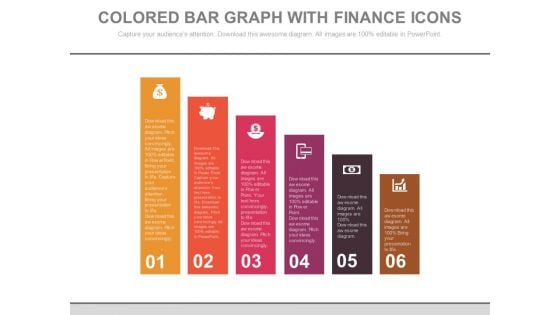
Bar Graph For Marketing Research Data Powerpoint Slides
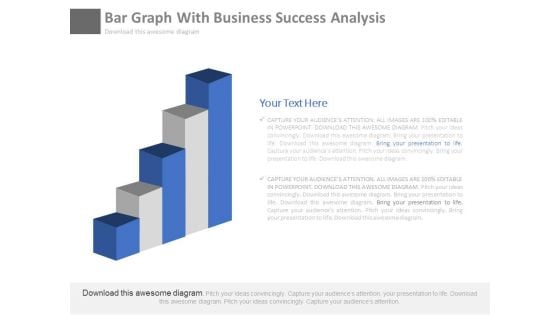
This PowerPoint template has been designed with diagram of bar graph. This PPT slide can be used to prepare presentations for profit growth report and also for financial data analysis. You can download finance PowerPoint template to prepare awesome presentations.
Bar Graph For Marketing Research Process Powerpoint Slides
This PowerPoint template has been designed with diagram of bar graph. This PPT slide can be used to prepare presentations for profit growth report and also for financial data analysis. You can download finance PowerPoint template to prepare awesome presentations.
Key Facts Voice Assistance Security Platform Investor Funding Presentation Demonstration Pdf
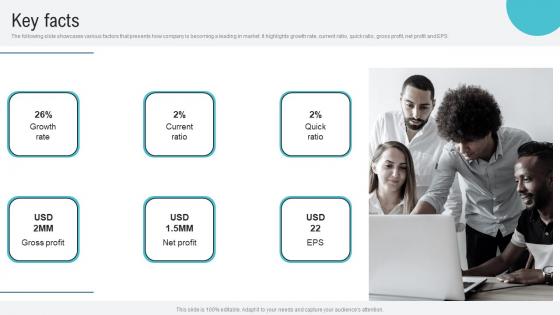
The following slide showcases various factors that presents how company is becoming a leading in market. It highlights growth rate, current ratio, quick ratio, gross profit, net profit and EPS. Retrieve professionally designed Key Facts Voice Assistance Security Platform Investor Funding Presentation Demonstration Pdf to effectively convey your message and captivate your listeners. Save time by selecting pre made slideshows that are appropriate for various topics, from business to educational purposes. These themes come in many different styles, from creative to corporate, and all of them are easily adjustable and can be edited quickly. Access them as PowerPoint templates or as Google Slides themes. You do not have to go on a hunt for the perfect presentation because Slidegeeks got you covered from everywhere. The following slide showcases various factors that presents how company is becoming a leading in market. It highlights growth rate, current ratio, quick ratio, gross profit, net profit and EPS.

 Home
Home