Profit Icon
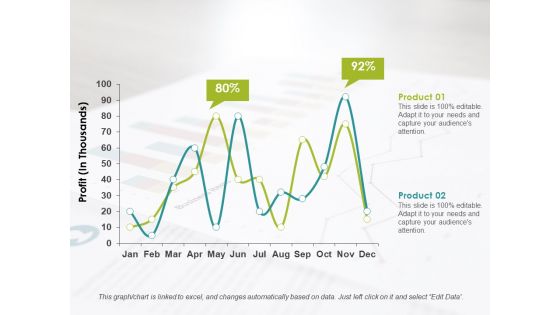
Line Chart Ppt PowerPoint Presentation Infographics Format Ideas
This is a line chart ppt powerpoint presentation infographics format ideas. This is a two stage process. The stages in this process are product, profit, business.
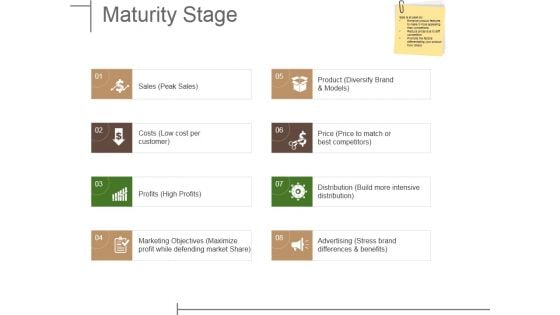
Maturity Stage Ppt PowerPoint Presentation Outline Themes
This is a maturity stage ppt powerpoint presentation outline themes. This is a eight stage process. The stages in this process are sales, costs, profits, marketing objectives, product.
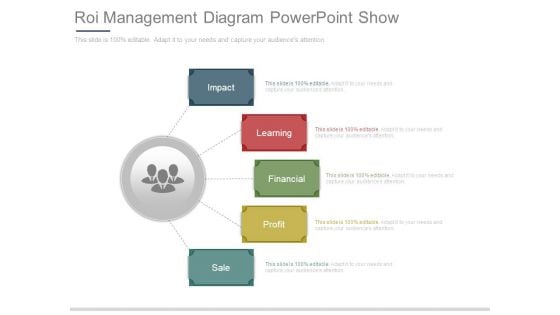
Roi Management Diagram Powerpoint Show
This is a roi management diagram powerpoint show. This is a five stage process. The stages in this process are impact, learning, financial, profit, sale.
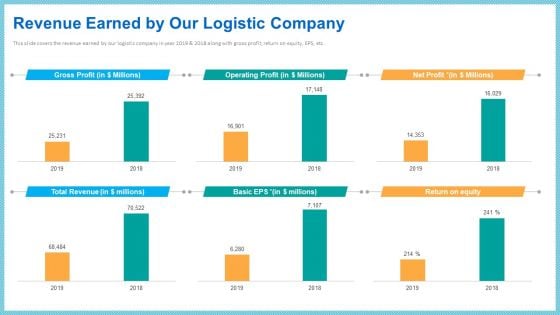
Improving Current Organizational Logistic Process Revenue Earned By Our Logistic Company Demonstration PDF
This slide covers the revenue earned by our logistic company in year 2019 and 2018 along with gross profit, return on equity, EPS, etc. Deliver and pitch your topic in the best possible manner with this improving current organizational logistic process revenue earned by our logistic company demonstration pdf. Use them to share invaluable insights on total revenue, gross profit, operating profit, net profit, return on equity and impress your audience. This template can be altered and modified as per your expectations. So, grab it now.
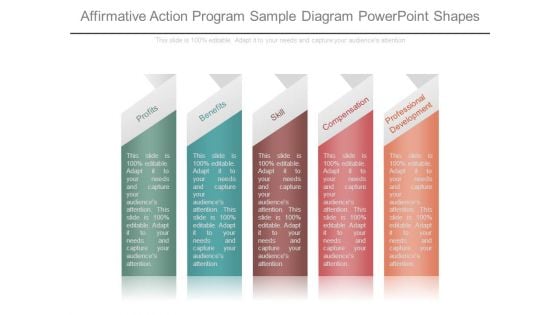
Affirmative Action Program Sample Diagram Powerpoint Shapes
This is a affirmative action program sample diagram powerpoint shapes. This is a five stage process. The stages in this process are profits, benefits, skill, compensation, professional development.
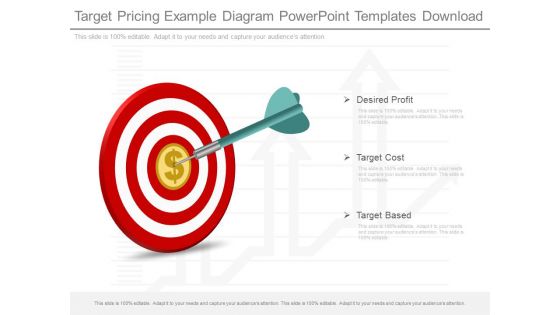
Target Pricing Example Diagram Powerpoint Templates Download
This is a target pricing example diagram powerpoint templates download. This is a three stage process. The stages in this process are desired profit, target cost, target based.
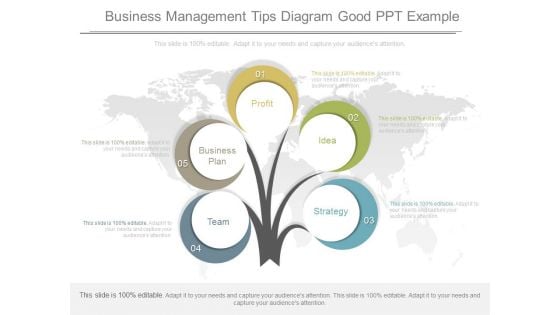
Business Management Tips Diagram Good Ppt Example
This is a business management tips diagram good ppt example. This is a five stage process. The stages in this process are team, business plan, profit, idea, strategy.
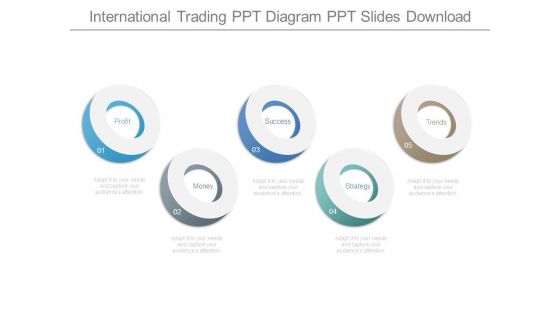
International Trading Ppt Diagram Ppt Slides Download
This is a international trading ppt diagram ppt slides download. This is a five stage process. The stages in this process are profit, money, success, strategy, trends.
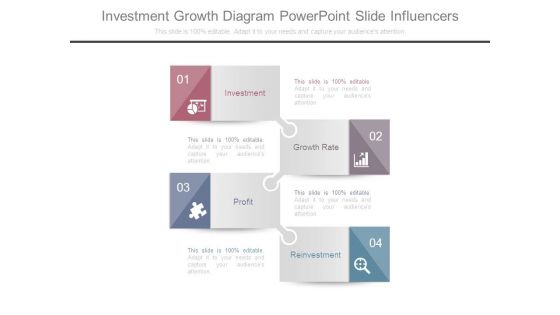
Investment Growth Diagram Powerpoint Slide Influencers
This is a investment growth diagram powerpoint slide influencers. This is a four stage process. The stages in this process are investment, growth rate, profit, reinvestment.
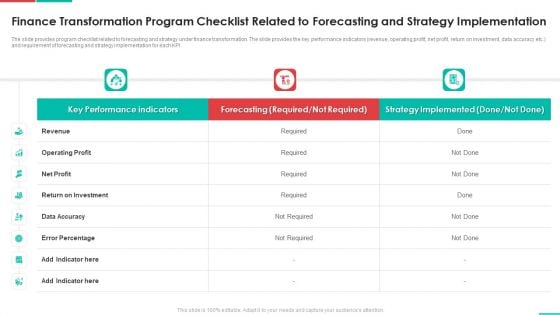
Roadmap For Financial Accounting Transformation Finance Transformation Program Checklist Related Themes PDF
The slide provides program checklist related to forecasting and strategy under finance transformation. The slide provides the key performance indicators revenue, operating profit, net profit, return on investment, data accuracy etc. and requirement of forecasting and strategy implementation for each KPI. Deliver and pitch your topic in the best possible manner with this roadmap for financial accounting transformation finance transformation program checklist related themes pdf. Use them to share invaluable insights on revenue, operating profit, net profit, return on investment, data accuracy and impress your audience. This template can be altered and modified as per your expectations. So, grab it now.
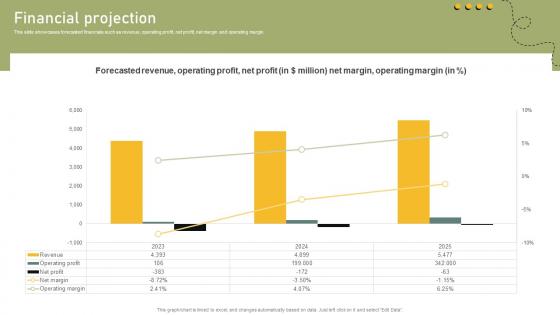
Financial Projection Shared Transportation Platform Business Model BMC SS V
This slide showcases forecasted financials such as revenue, operating profit, net profit, net margin and operating margin. There are so many reasons you need a Financial Projection Shared Transportation Platform Business Model BMC SS V. The first reason is you can not spend time making everything from scratch, Thus, Slidegeeks has made presentation templates for you too. You can easily download these templates from our website easily. This slide showcases forecasted financials such as revenue, operating profit, net profit, net margin and operating margin.
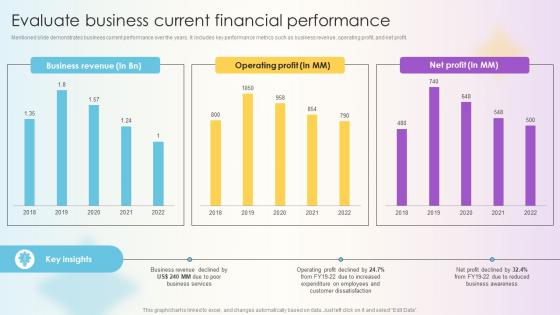
Managing Technical And Non Evaluate Business Current Financial Performance
Mentioned slide demonstrates business current performance over the years. It includes key performance metrics such as business revenue, operating profit, and net profit. The best PPT templates are a great way to save time, energy, and resources. Slidegeeks have 100 percent editable powerpoint slides making them incredibly versatile. With these quality presentation templates, you can create a captivating and memorable presentation by combining visually appealing slides and effectively communicating your message. Download Managing Technical And Non Evaluate Business Current Financial Performance from Slidegeeks and deliver a wonderful presentation. Mentioned slide demonstrates business current performance over the years. It includes key performance metrics such as business revenue, operating profit, and net profit.
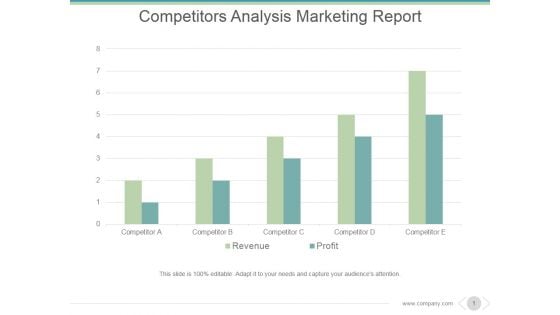
Competitors Analysis Marketing Report Ppt PowerPoint Presentation Tips
This is a competitors analysis marketing report ppt powerpoint presentation tips. This is a five stage process. The stages in this process are competitor, revenue, profit.
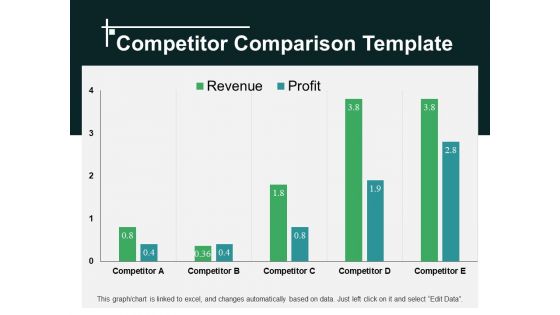
Competitor Comparison Template 2 Ppt PowerPoint Presentation Show Design Ideas
This is a competitor comparison template 2 ppt powerpoint presentation show design ideas. This is a four stage process. The stages in this process are competitor, profit, revenue.
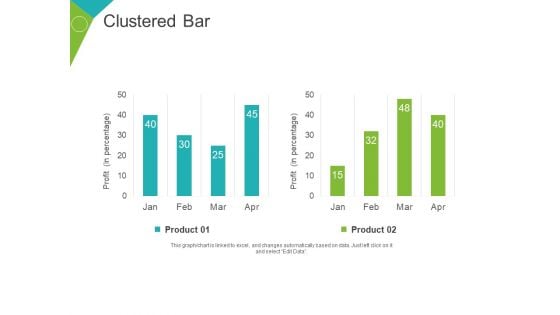
Clustered Bar Ppt PowerPoint Presentation Model Slides
This is a clustered bar ppt powerpoint presentation model slides. This is a two stage process. The stages in this process are product, profit, business, finance, percentage.
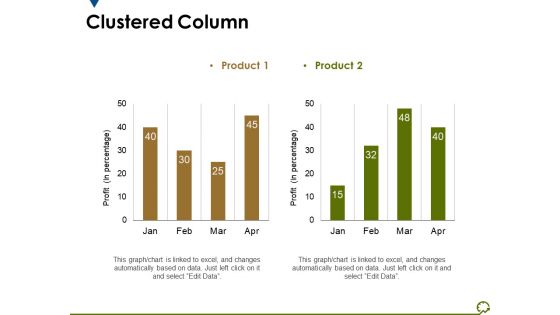
Clustered Column Ppt PowerPoint Presentation File Guidelines
This is a clustered column ppt powerpoint presentation file guidelines. This is a two stage process. The stages in this process are profit, business, marketing, graph, finance.
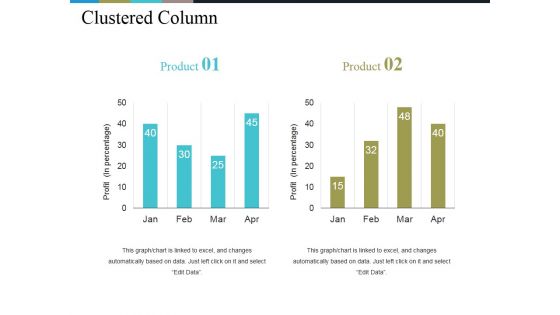
Clustered Column Ppt PowerPoint Presentation Pictures Objects
This is a clustered column ppt powerpoint presentation pictures objects. This is a two stage process. The stages in this process are profit, business, marketing, finance graph.
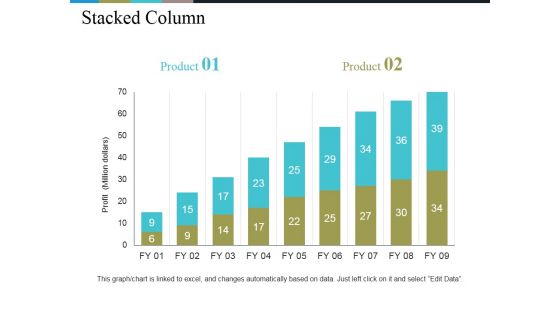
Stacked Column Ppt PowerPoint Presentation Styles File Formats
This is a stacked column ppt powerpoint presentation styles file formats. This is a two stage process. The stages in this process are profit, growth, business, graph, strategy.
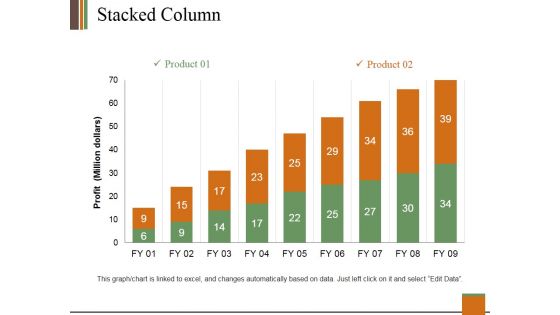
Stacked Column Ppt PowerPoint Presentation Outline Information
This is a stacked column ppt powerpoint presentation outline information. This is a two stage process. The stages in this process are profit, product, bar graph, growth, success.
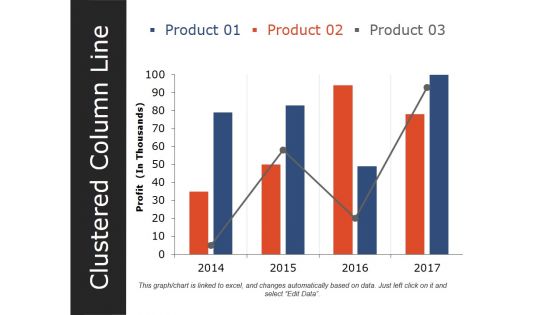
Clustered Column Line Ppt PowerPoint Presentation Layouts Structure
This is a clustered column line ppt powerpoint presentation layouts structure. This is a three stage process. The stages in this process are product, profit, graph, growth, success.
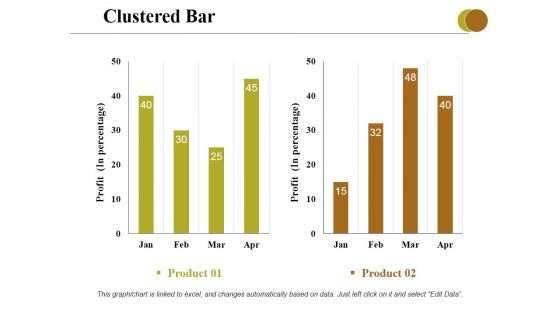
Clustered Bar Ppt PowerPoint Presentation Professional Grid
This is a clustered bar ppt powerpoint presentation professional grid. This is a two stage process. The stages in this process are profit, business, marketing, graph, strategy.
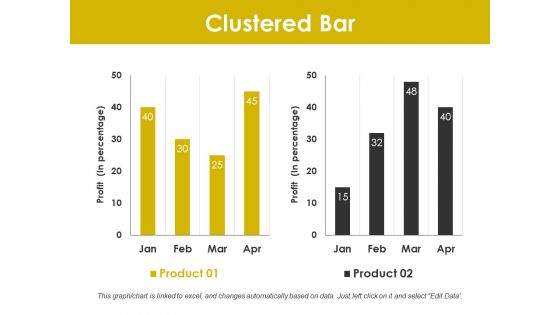
Clustered Bar Ppt PowerPoint Presentation Layouts Layout
This is a clustered bar ppt powerpoint presentation layouts layout. This is a two stage process. The stages in this process are profit, graph, business, marketing, finance.
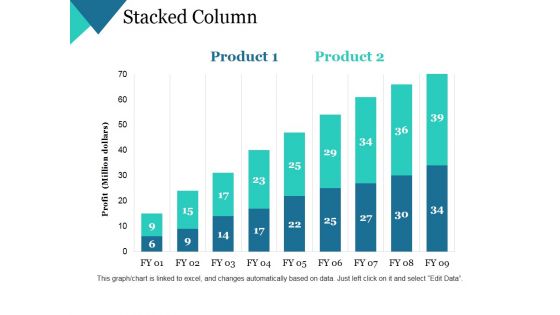
Stacked Column Ppt PowerPoint Presentation Gallery Slide
This is a stacked column ppt powerpoint presentation gallery slide. This is a two stage process. The stages in this process are profit, business, marketing, growth, strategy.
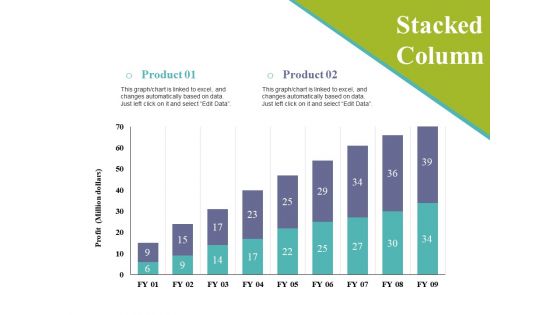
Stacked Column Ppt PowerPoint Presentation Styles Sample
This is a stacked column ppt powerpoint presentation styles sample. This is a two stage process. The stages in this process are profit, business, marketing, growth, graph.
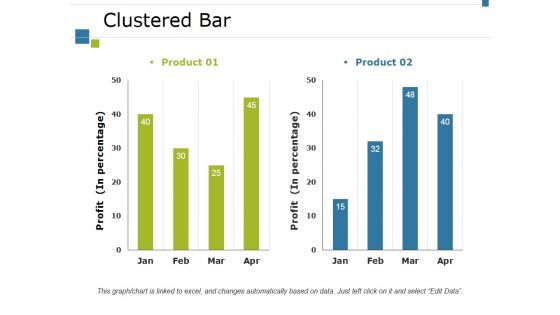
Clustered Bar Ppt PowerPoint Presentation Styles Portfolio
This is a clustered bar ppt powerpoint presentation styles portfolio. This is a two stage process. The stages in this process are product, profit, bar graph, growth, success.
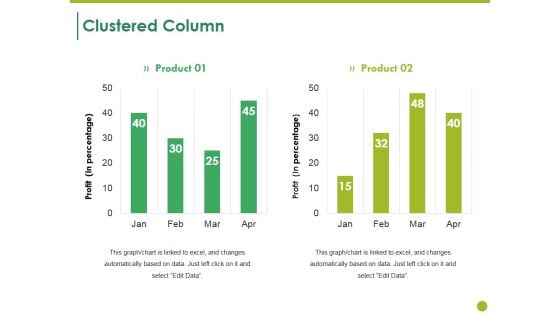
Clustered Column Ppt PowerPoint Presentation Layouts Ideas
This is a clustered column ppt powerpoint presentation layouts ideas. This is a two stage process. The stages in this process are product, profit, bar graph, growth, finance.
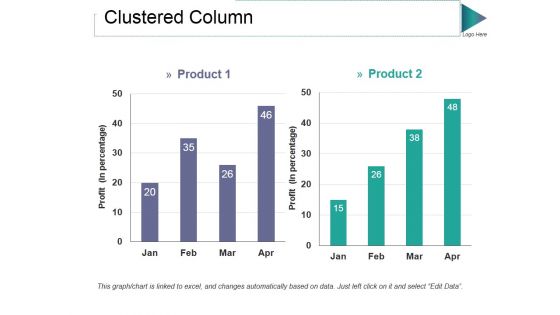
Clustered Column Ppt PowerPoint Presentation Professional Styles
This is a clustered column ppt powerpoint presentation professional styles. This is a two stage process. The stages in this process are product, profit, bar graph, growth, success.
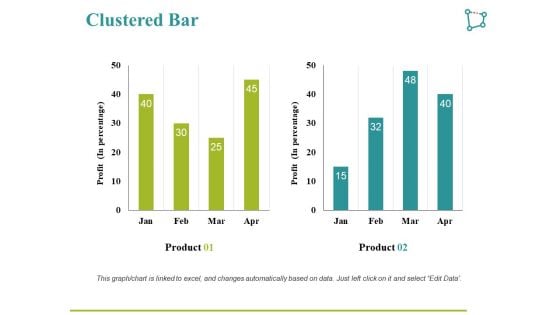
Clustered Bar Ppt PowerPoint Presentation Slides Deck
This is a clustered bar ppt powerpoint presentation slides deck. This is a two stage process. The stages in this process are product, profit, bar graph.
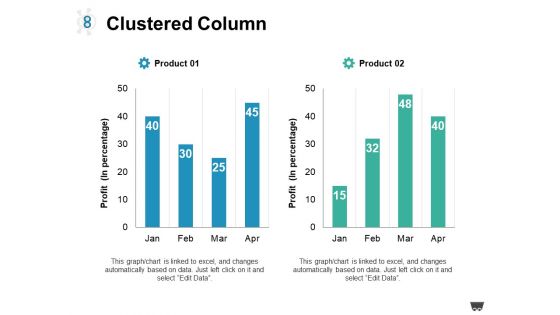
Clustered Column Ppt PowerPoint Presentation Show Introduction
This is a clustered column ppt powerpoint presentation show introduction. This is a two stage process. The stages in this process are product, profit, bar graph.
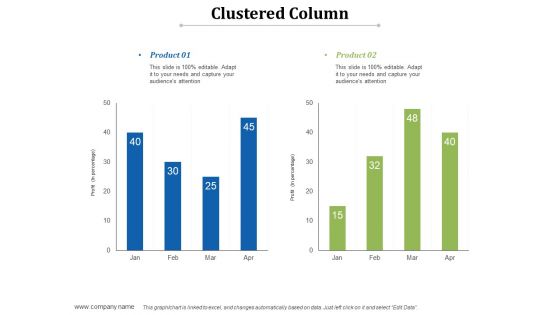
Clustered Column Ppt PowerPoint Presentation Styles Templates
This is a clustered column ppt powerpoint presentation styles templates. This is a two stage process. The stages in this process are product, profit, bar graph.
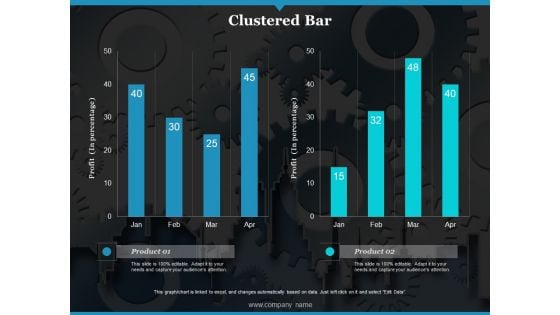
Clustered Bar Ppt PowerPoint Presentation Slides Graphic Tips
This is a clustered bar ppt powerpoint presentation slides graphic tips. This is a two stage process. The stages in this process are profit, product, clustered bar.
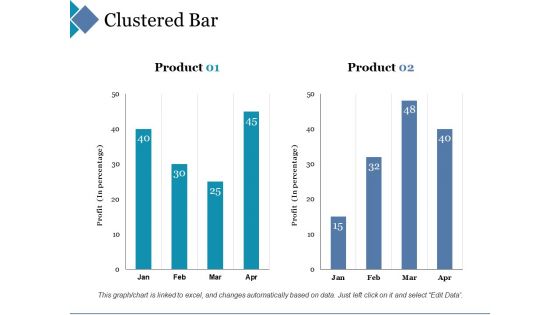
Clustered Bar Ppt PowerPoint Presentation Layouts Professional
This is a clustered bar ppt powerpoint presentation layouts professional. This is a two stage process. The stages in this process are clustered bar, product, profit, percentage.
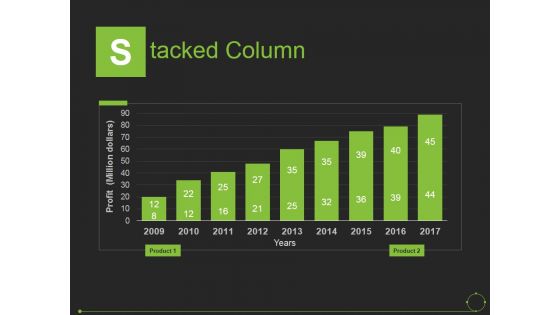
Stacked Column Ppt PowerPoint Presentation Slides Introduction
This is a stacked column ppt powerpoint presentation slides introduction. This is a nine stage process. The stages in this process are years, profit, product, business, marketing.
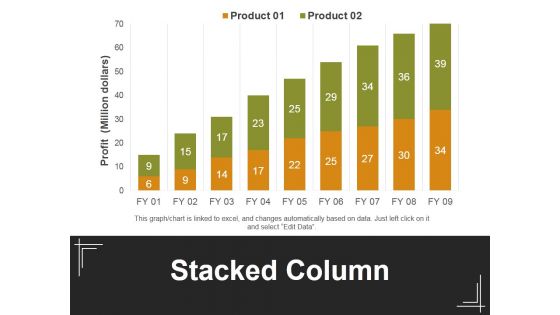
Stacked Column Ppt PowerPoint Presentation Outline Maker
This is a stacked column ppt powerpoint presentation outline maker. This is a two stage process. The stages in this process are profit, stacked bar, product, business, marketing.
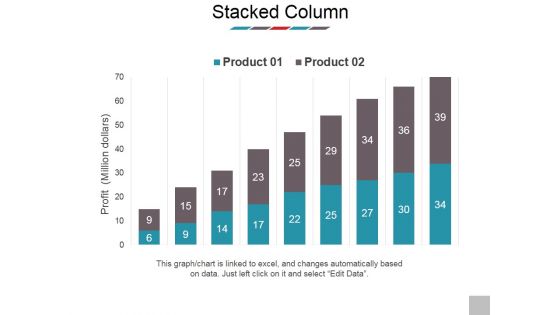
Stacked Column Ppt PowerPoint Presentation Professional Deck
This is a stacked column ppt powerpoint presentation professional deck. This is a two stage process. The stages in this process are profit, business, marketing, presentation, product.
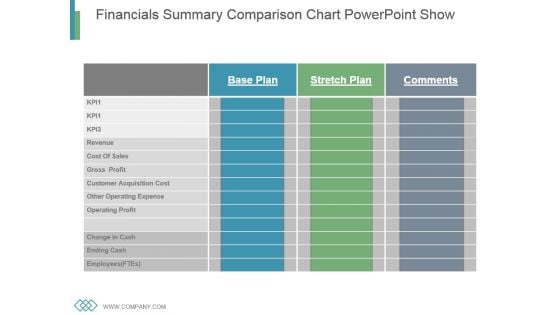
Financials Summary Comparison Chart Powerpoint Show
This is a financials summary comparison chart powerpoint show. This is a three stage process. The stages in this process are revenue, cost of sales, gross profit, customer acquisition cost, other operating cost expense, operating profit, change in cash, ending cash, employees.
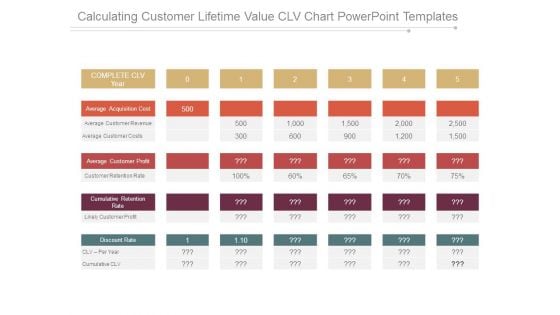
Calculating Customer Lifetime Value Clv Chart Powerpoint Templates
This is a calculating customer lifetime value clv chart powerpoint templates. This is a five stage process. The stages in this process are complete clv year, average acquisition cost, average customer revenue, average customer costs, average customer profit, customer retention rate, cumulative retention rate, likely customer profit, discount rate, clv per year, cumulative clv.

Financials Base Plan Table Chart Ppt Slide Templates
This is a financials base plan table chart ppt slide templates. This is a five stage process. The stages in this process are kpi, revenue, cost of sales, gross profit, customer acquisition cost, other operating cost expense, operating profit, change in cash, ending cash, employees ftes.
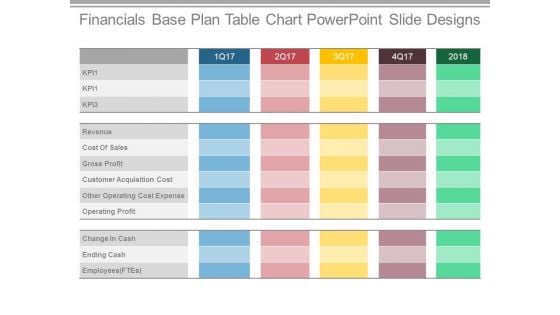
Financials Base Plan Table Chart Powerpoint Slide Designs
This is a financials base plan table chart powerpoint slide designs. This is a five stage process. The stages in this process are revenue, cost of sales, gross profit, customer acquisition cost, other operating cost expense, operating profit, change in cash, ending cash.

Lifetime Customer Value Lcv Display Table Powerpoint Themes
This is a lifetime customer value lcv display table powerpoint themes. This is a five stage process. The stages in this process are complete clv year, average acquisition cost, average customer revenue, average customer costs, average customer profit, customer retention rate, cumulative retention rate, likely customer profit, discount rate, clv per year, cumulative clv.
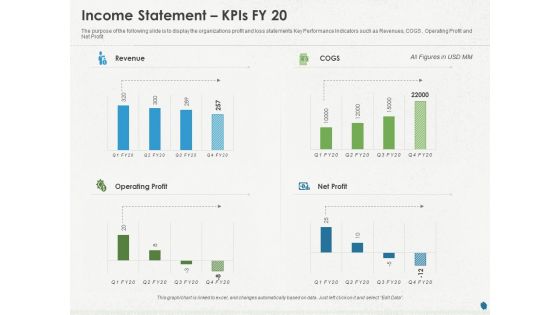
Distressed Debt Refinancing For Organizaton Income Statement Kpis FY 20 Ppt PowerPoint Presentation Model Guide PDF
Presenting this set of slides with name distressed debt refinancing for organizaton income statement kpis fy 20 ppt powerpoint presentation model guide pdf. The topics discussed in these slides are revenue, cogs, operating profit, net profit. This is a completely editable PowerPoint presentation and is available for immediate download. Download now and impress your audience.
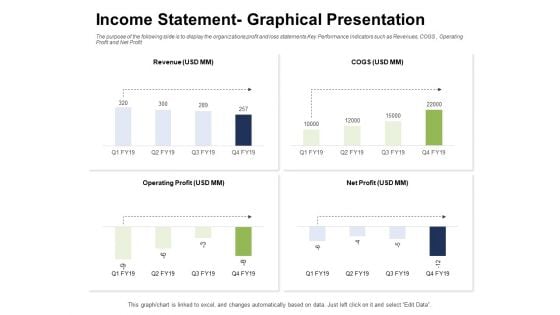
Ways To Bounce Back From Insolvency Income Statement Graphical Presentation Slides PDF
Presenting this set of slides with name ways to bounce back from insolvency income statement graphical presentation slides pdf. The topics discussed in these slides are revenue, operating profit, net profit. This is a completely editable PowerPoint presentation and is available for immediate download. Download now and impress your audience.
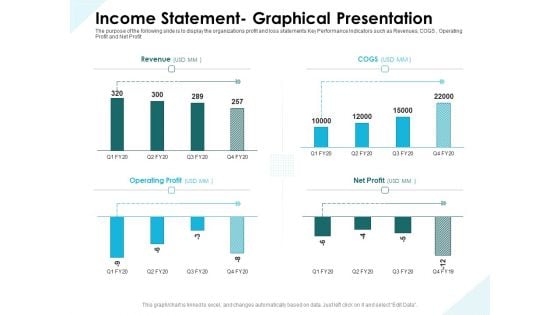
Issues Which Leads To Insolvency Income Statement Graphical Presentation Download PDF
Presenting this set of slides with name issues which leads to insolvency income statement graphical presentation download pdf. The topics discussed in these slides are revenue, operating profit, net profit. This is a completely editable PowerPoint presentation and is available for immediate download. Download now and impress your audience.
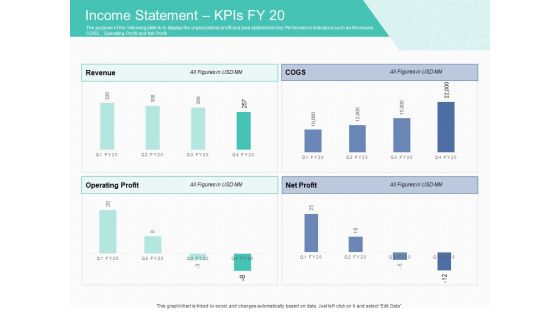
Corporate Debt Refinancing And Restructuring Income Statement Kpis FY 20 Pictures PDF
Presenting this set of slides with name corporate debt refinancing and restructuring income statement kpis fy 20 pictures pdf. The topics discussed in these slides are revenue, cogs, operating profit, net profit. This is a completely editable PowerPoint presentation and is available for immediate download. Download now and impress your audience.
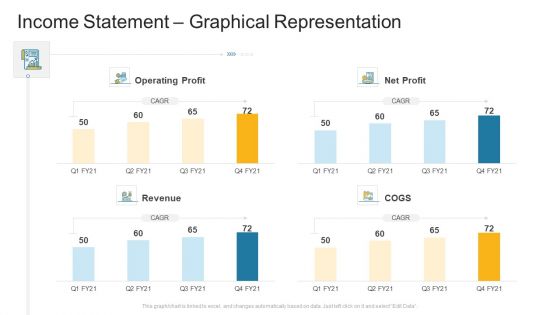
Income Statement Graphical Representation Company Profile Ppt Infographic Template Guidelines PDF
Deliver an awe inspiring pitch with this creative income statement graphical representation company profile ppt infographic template guidelines pdf bundle. Topics like operating profit, net profit, revenue, cogs can be discussed with this completely editable template. It is available for immediate download depending on the needs and requirements of the user.
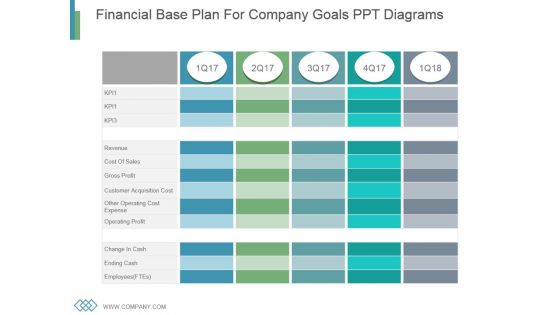
Financial Base Plan For Company Goals Ppt Diagrams
This is a financial base plan for company goals ppt diagrams. This is a five stage process. The stages in this process are revenue, cost of sales, gross profit, customer acquisition cost, other operating cost expense, operating profit, change in cash, ending cash, employees.
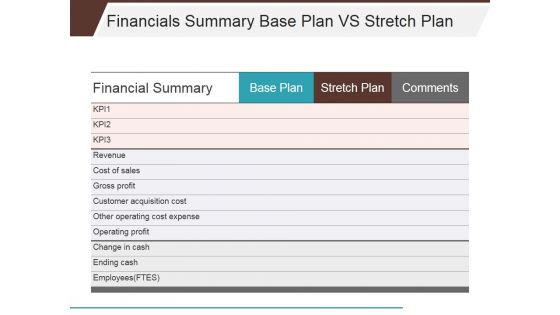
Financials Summary Base Plan Vs Stretch Plan Ppt PowerPoint Presentation Infographics Themes
This is a financials summary base plan vs stretch plan ppt powerpoint presentation infographics themes. This is a three stage process. The stages in this process are revenue, cost of sales, gross profit, customer acquisition cost, other operating cost expense, operating profit.
Increase In Dollar Graph Finance PowerPoint Templates And PowerPoint Themes 0912
Increase In Dollar Graph Finance PowerPoint Templates And PowerPoint Themes 0912-Microsoft Powerpoint Templates and Background with business graph with arrow showing profits-Business graph with arrow showing profits, signs, success, finance, business, arrows Encourage teams with our Increase In Dollar Graph Finance PowerPoint Templates And PowerPoint Themes 0912. Download without worries with our money back guaranteee.
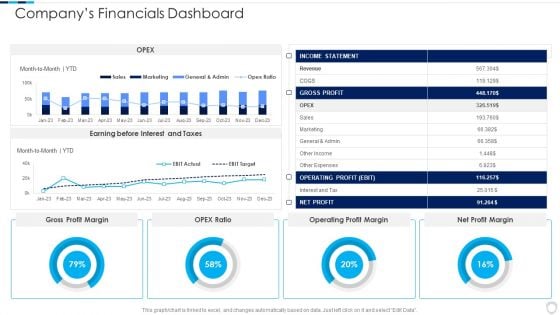
Financial Report Of An IT Firm Companys Financials Dashboard Infographics PDF
Deliver an awe inspiring pitch with this creative Financial Report Of An IT Firm Companys Financials Dashboard Infographics PDF bundle. Topics like Operating Profit, Gross Profit, Income Statement can be discussed with this completely editable template. It is available for immediate download depending on the needs and requirements of the user.
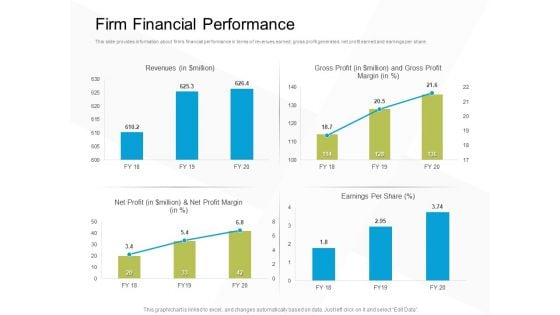
Business Evacuation Plan Firm Financial Performance Ppt PowerPoint Presentation Professional Inspiration PDF
Presenting this set of slides with name business evacuation plan firm financial performance ppt powerpoint presentation professional inspiration pdf. The topics discussed in these slides are revenues, gross profit, net profit, earnings per share. This is a completely editable PowerPoint presentation and is available for immediate download. Download now and impress your audience.
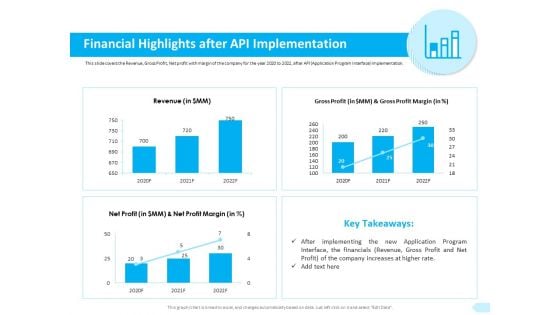
API Integration Software Development Financial Highlights After API Implementation Structure PDF
Presenting this set of slides with name api integration software development financial highlights after api implementation structure pdf. The topics discussed in these slides are revenue, gross profit, net profit. This is a completely editable PowerPoint presentation and is available for immediate download. Download now and impress your audience.
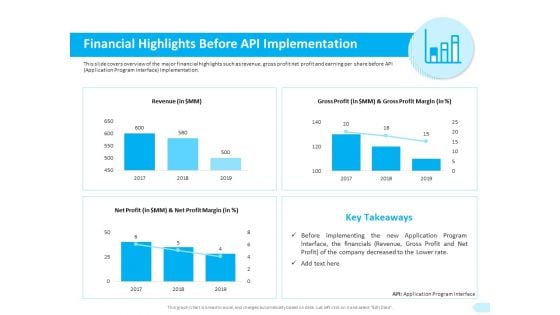
API Integration Software Development Financial Highlights Before API Implementation Template PDF
Presenting this set of slides with name api integration software development financial highlights before api implementation template pdf. The topics discussed in these slides are revenue, gross profit, net profit. This is a completely editable PowerPoint presentation and is available for immediate download. Download now and impress your audience.
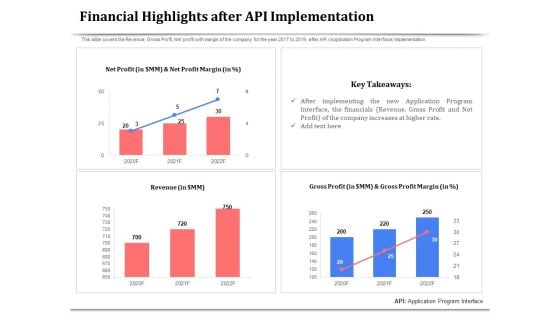
API Management For Building Software Applications Financial Highlights After API Implementation Brochure PDF
Presenting this set of slides with name api management for building software applications financial highlights after api implementation brochure pdf. The topics discussed in these slides are net profit, key takeaways, revenue, gross profit. This is a completely editable PowerPoint presentation and is available for immediate download. Download now and impress your audience.
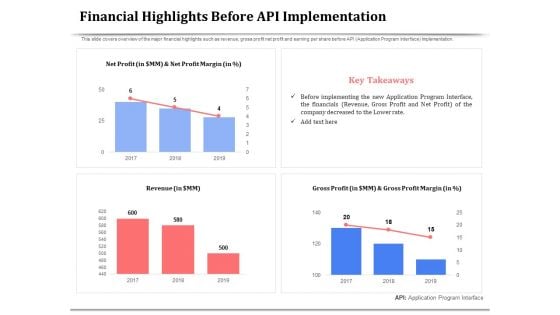
API Management For Building Software Applications Financial Highlights Before API Implementation Summary PDF
Presenting this set of slides with name api management for building software applications financial highlights before api implementation summary pdf. The topics discussed in these slides are net profit, key takeaways, revenue, gross profit. This is a completely editable PowerPoint presentation and is available for immediate download. Download now and impress your audience.
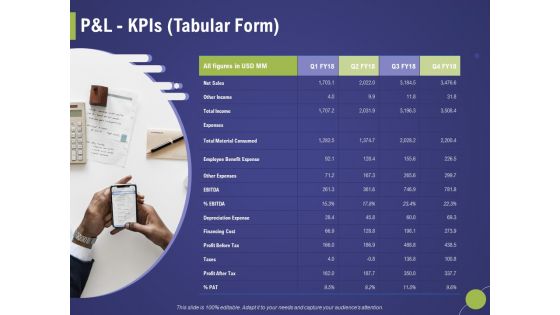
Firm Capability Assessment Pandl Kpis Tabular Form Ppt Infographic Template Inspiration PDF
Presenting this set of slides with name firm capability assessment pandl kpis tabular form ppt infographic template inspiration pdf. The topics discussed in these slides are revenue, net profit, operating profit, cogs. This is a completely editable PowerPoint presentation and is available for immediate download. Download now and impress your audience.
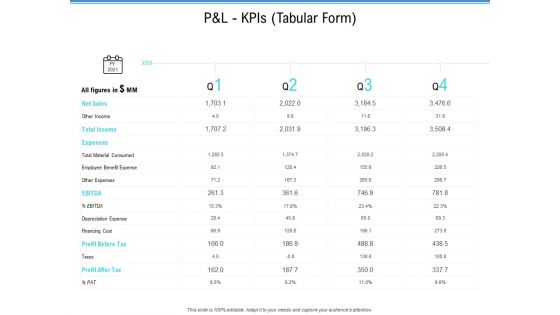
Enterprise Analysis P And L Kpis Tabular Form Ppt Slides Graphics Download PDF
Deliver and pitch your topic in the best possible manner with this enterprise analysis p and l kpis tabular form ppt slides graphics download pdf. Use them to share invaluable insights on operating profit, net profit, cogs, revenue and impress your audience. This template can be altered and modified as per your expectations. So, grab it now.
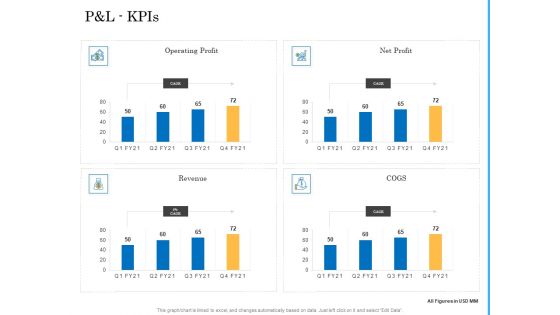
Deal Assessment Audit Process P And L Kpis Download PDF
Deliver and pitch your topic in the best possible manner with this deal assessment audit process p and l kpis download pdf. Use them to share invaluable insights on operating profit, net profit, revenue, cogs and impress your audience. This template can be altered and modified as per your expectations. So, grab it now.
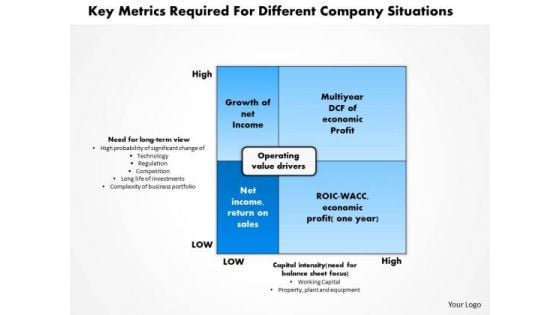
Business Framework Key Metrics Required For Different Company Situations PowerPoint Presentation
This diagram has been designed with framework of key metrics required for different company situations. This diagram contains rectangle of operating value drivers with four sections inside it representing terms like growth of net Income, multiyear DCF of economic profit, net income, return on sales, ROIC-WACC, and economic profit. Use this as a major element in streamlining any business process.
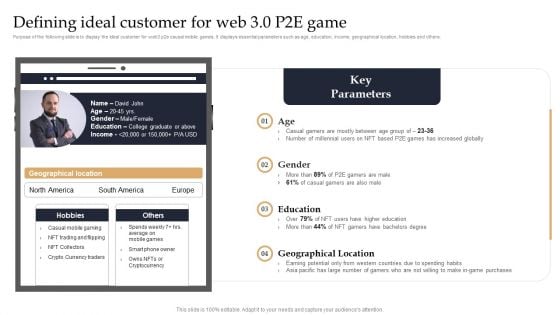
Web 3 0 Blockchain Based P2E Mobile Game Sector Report Promotional Plan Defining Ideal Customer For Web Template PDF
Purpose of the following slide is to display the ideal customer for web3 p2e causal mobile games. It displays essential parameters such as age, education, income, geographical location, hobbies and others. Get a simple yet stunning designed Web 3 0 Blockchain Based P2E Mobile Game Sector Report Promotional Plan Defining Ideal Customer For Web Template PDF. It is the best one to establish the tone in your meetings. It is an excellent way to make your presentations highly effective. So, download this PPT today from Slidegeeks and see the positive impacts. Our easy-to-edit Web 3 0 Blockchain Based P2E Mobile Game Sector Report Promotional Plan Defining Ideal Customer For Web Icons PDF can be your go-to option for all upcoming conferences and meetings. So, what are you waiting for. Grab this template today.

Value Proposition Product Benefits Ppt PowerPoint Presentation Influencers
This is a value proposition product benefits ppt powerpoint presentation influencers. This is a six stage process. The stages in this process are benefit, business, marketing, management, icons.
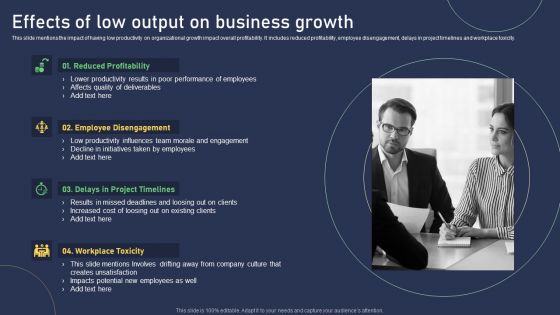
Effects Of Low Output On Business Growth Diagrams PDF
This slide mentions the impact of having low productivity on organizational growth impact overall profitability. It includes reduced profitability, employee disengagement, delays in project timelines and workplace toxicity. Presenting Effects Of Low Output On Business Growth Diagrams PDF to dispense important information. This template comprises four stages. It also presents valuable insights into the topics including Reduced Profitability, Employee Disengagement, Workplace Toxicity. This is a completely customizable PowerPoint theme that can be put to use immediately. So, download it and address the topic impactfully.
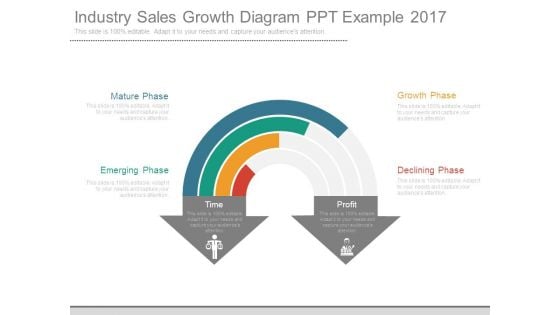
Industry Sales Growth Diagram Ppt Example 2017
This is a industry sales growth diagram ppt example 2017. This is a four stage process. The stages in this process are emerging phase, mature phase, growth phase, declining phase, time, profit.
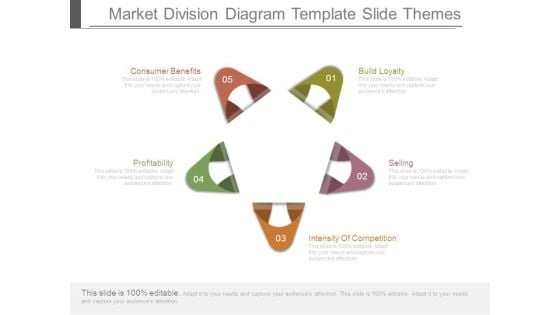
Market Division Diagram Template Slide Themes
This is a market division diagram template slide themes. This is a five stage process. The stages in this process are build loyalty, selling, intensity of competition, profitability, consumer benefits.
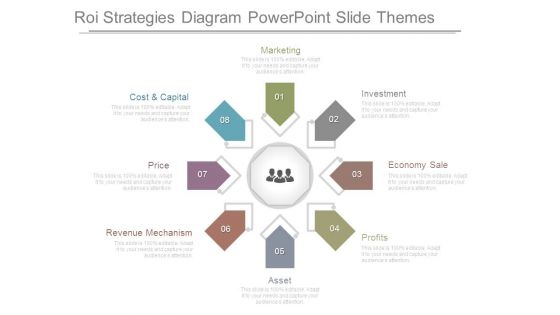
Roi Strategies Diagram Powerpoint Slide Themes
This is a roi strategies diagram powerpoint slide themes. This is a eight stage process. The stages in this process are marketing, investment, economy sale, profits, asset, revenue mechanism, price, cost and capital.
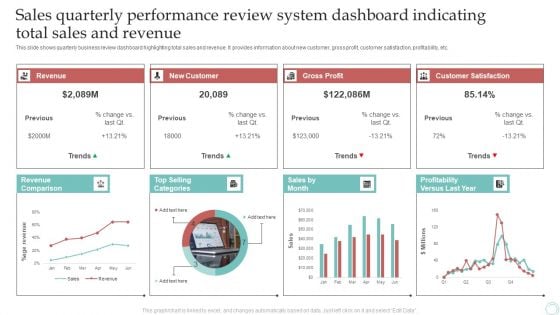
Sales Quarterly Performance Review System Dashboard Indicating Total Sales And Revenue Download PDF
This slide shows quarterly business review dashboard highlighting total sales and revenue. It provides information about new customer, gross profit, customer satisfaction, profitability, etc. Pitch your topic with ease and precision using this Sales Quarterly Performance Review System Dashboard Indicating Total Sales And Revenue Download PDF. This layout presents information on Revenue, New Customer, Gross Profit. It is also available for immediate download and adjustment. So, changes can be made in the color, design, graphics or any other component to create a unique layout.
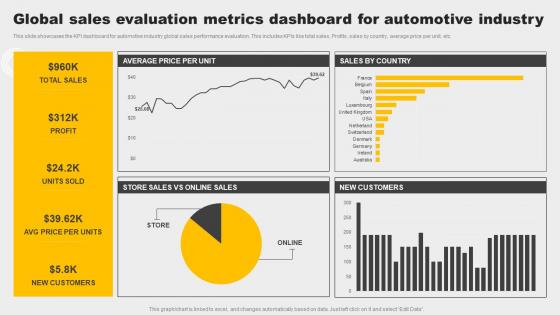
Global Sales Evaluation Metrics Dashboard For Automotive Industry Demonstration Pdf
This slide showcases the KPI dashboard for automotive industry global sales performance evaluation. This includes KPIs like total sales, Profits, sales by country, average price per unit, etc. Pitch your topic with ease and precision using this Global Sales Evaluation Metrics Dashboard For Automotive Industry Demonstration Pdf. This layout presents information on Customers, Profit, Sales. It is also available for immediate download and adjustment. So, changes can be made in the color, design, graphics or any other component to create a unique layout. This slide showcases the KPI dashboard for automotive industry global sales performance evaluation. This includes KPIs like total sales, Profits, sales by country, average price per unit, etc.
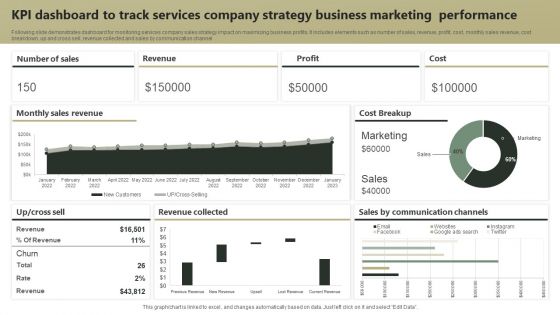
KPI Dashboard To Track Services Company Strategy Business Marketing Performance Guidelines PDF
Following slide demonstrates dashboard for monitoring services company sales strategy impact on maximizing business profits. It includes elements such as number of sales, revenue, profit, cost, monthly sales revenue, cost breakdown, up and cross sell, revenue collected and sales by communication channel. Showcasing this set of slides titled KPI Dashboard To Track Services Company Strategy Business Marketing Performance Guidelines PDF. The topics addressed in these templates are Revenue, Profit, Cost. All the content presented in this PPT design is completely editable. Download it and make adjustments in color, background, font etc. as per your unique business setting.
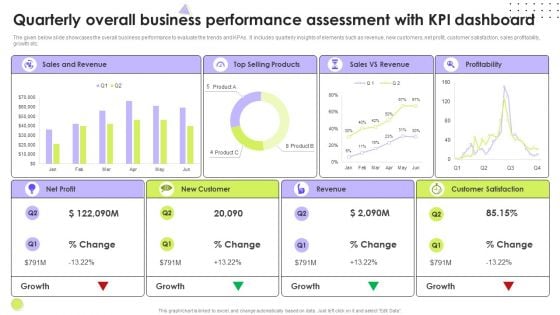
Quarterly Overall Business Performance Assessment With Kpi Dashboard Microsoft PDF
The given below slide showcases the overall business performance to evaluate the trends and KPAs. It includes quarterly insights of elements such as revenue, new customers, net profit, customer satisfaction, sales profitability, growth etc. Pitch your topic with ease and precision using this Quarterly Overall Business Performance Assessment With Kpi Dashboard Microsoft PDF. This layout presents information on Revenue, Customer Satisfaction, Net Profit. It is also available for immediate download and adjustment. So, changes can be made in the color, design, graphics or any other component to create a unique layout.
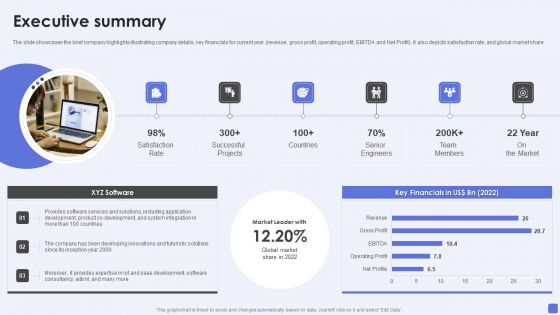
Software Services Business Profile Executive Summary Ppt PowerPoint Presentation File Elements PDF
The slide showcases the brief company highlights illustrating company details, key financials for current year revenue, gross profit, operating profit, EBITDA and Net Profit. It also depicts satisfaction rate, and global market share. Deliver an awe inspiring pitch with this creative Software Services Business Profile Executive Summary Ppt PowerPoint Presentation File Elements PDF bundle. Topics like Satisfaction Rate, Successful Projects, Senior Engineers can be discussed with this completely editable template. It is available for immediate download depending on the needs and requirements of the user.
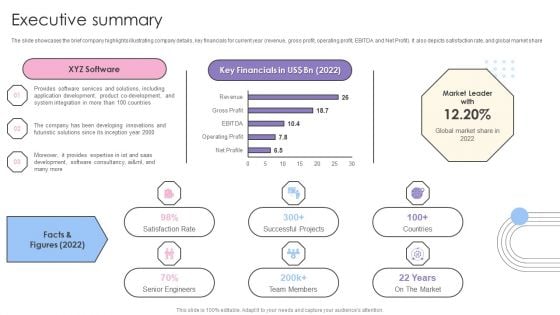
Software Products And Solutions Firm Details Executive Summary Clipart PDF
The slide showcases the brief company highlights illustrating company details, key financials for current year revenue, gross profit, operating profit, EBITDA and Net Profit. It also depicts satisfaction rate, and global market share. Deliver and pitch your topic in the best possible manner with this Software Products And Solutions Firm Details Executive Summary Clipart PDF. Use them to share invaluable insights on XYZ Software, Key Financials, Market Leader and impress your audience. This template can be altered and modified as per your expectations. So, grab it now.
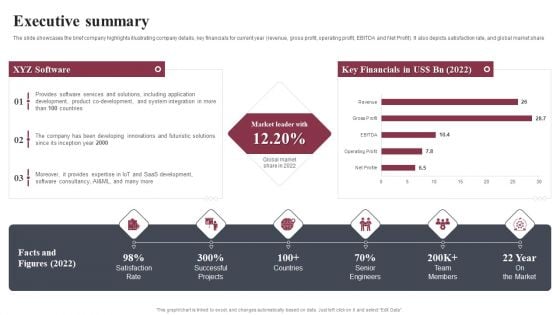
Business Software Development Company Profile Executive Summary Introduction PDF
The slide showcases the brief company highlights illustrating company details, key financials for current year revenue, gross profit, operating profit, EBITDA and Net Profit. It also depicts satisfaction rate, and global market share. Deliver an awe inspiring pitch with this creative Business Software Development Company Profile Executive Summary Introduction PDF bundle. Topics like Key Financials US Dollar, Market Leader, Inception Year 2000 can be discussed with this completely editable template. It is available for immediate download depending on the needs and requirements of the user.
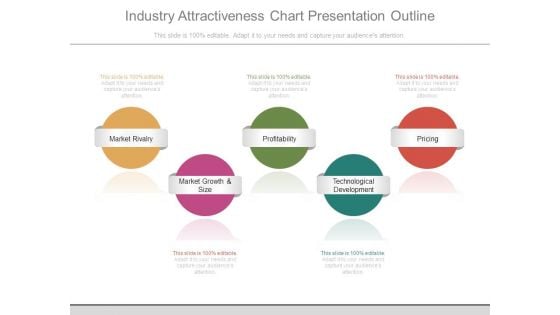
Industry Attractiveness Chart Presentation Outline
This is a industry attractiveness chart presentation outline. This is a five stage process. The stages in this process are market rivalry, market growth and size, profitability, technological development, pricing.
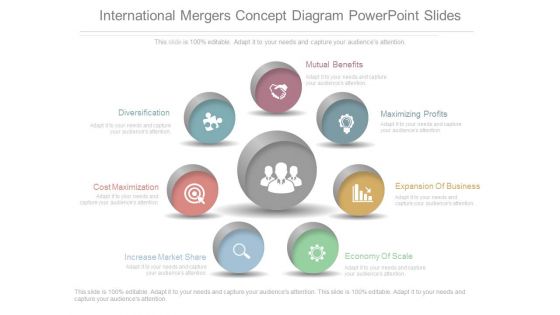
International Mergers Concept Diagram Powerpoint Slides
This is an international mergers concept diagram powerpoint slides. This is a seven stage process. The stages in this process are mutual benefits, maximizing profits, expansion of business, economy of scale, increase market share, cost maximization, diversification.

Annual Business Financial Summary Dashboard Themes PDF
This slide shows annual financial report dashboard of company to monitor yearly business performance. It includes various indicators such as revenue, net profits, costs and breakdown of cost. Showcasing this set of slides titled Annual Business Financial Summary Dashboard Themes PDF. The topics addressed in these templates are Revenue, Costs, Net Profit. All the content presented in this PPT design is completely editable. Download it and make adjustments in color, background, font etc. as per your unique business setting.
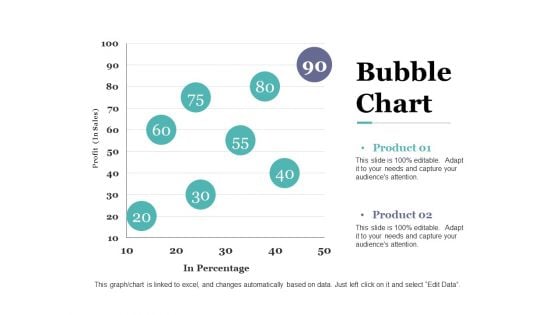
Bubble Chart Ppt PowerPoint Presentation Outline Deck
This is a bubble chart ppt powerpoint presentation outline deck. This is a two stage process. The stages in this process are in percentage, profit, bubble chart, business, marketing.
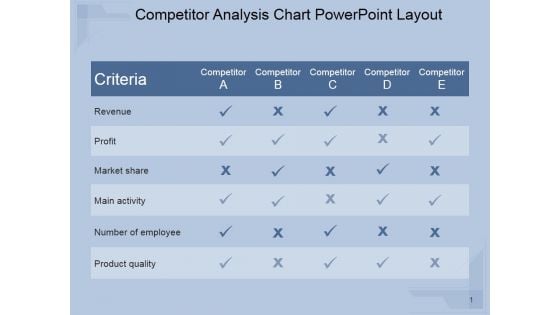
Competitor Analysis Chart Ppt PowerPoint Presentation Visuals
This is a competitor analysis chart ppt powerpoint presentation visuals. This is a five stage process. The stages in this process are revenue, profit, market share, main activity, number of employee, product quality.
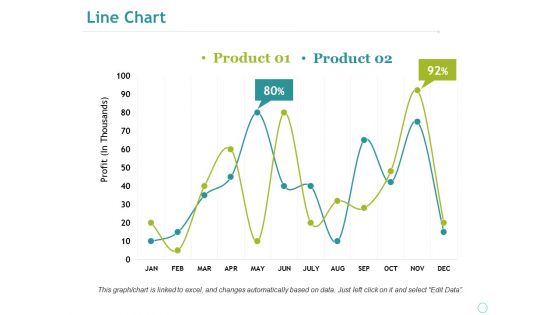
Line Chart Ppt PowerPoint Presentation Professional Portfolio
This is a line chart ppt powerpoint presentation professional portfolio. This is a two stage process. The stages in this process are business, marketing, profit, percentage, graph, strategy, finance.
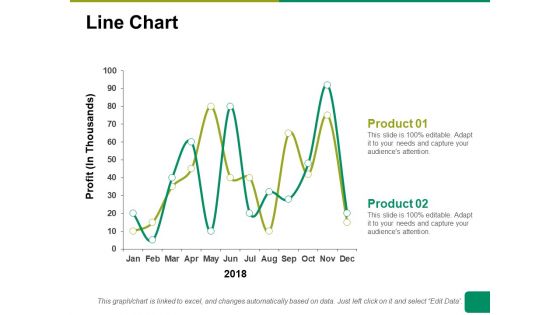
Line Chart Ppt PowerPoint Presentation Summary Ideas
This is a line chart ppt powerpoint presentation summary ideas. This is a two stage process. The stages in this process are line chart, profit, product, financial years, business.
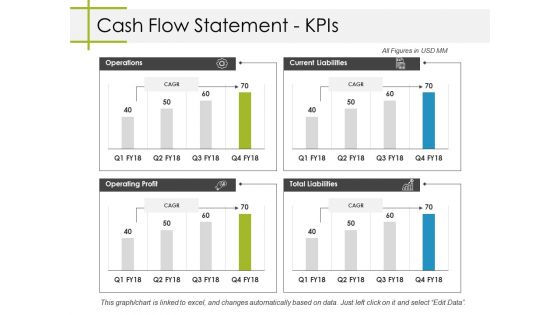
Cash Flow Statement Kpis Ppt PowerPoint Presentation Styles Themes
This is a cash flow statement kpis ppt powerpoint presentation styles themes. This is a four stage process. The stages in this process are business, operations, operating profit, total liabilities, current liabilities.
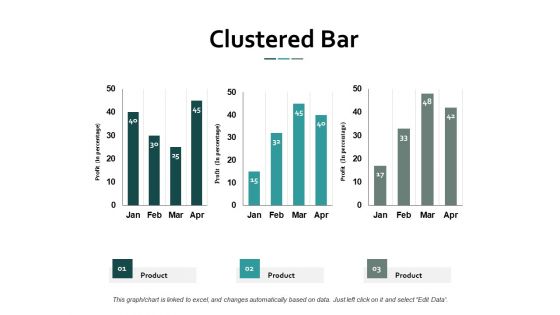
Clustered Bar Finance Ppt Powerpoint Presentation Ideas Themes
This is a clustered bar finance ppt powerpoint presentation ideas themes. This is a three stage process. The stages in this process are clustered bar, product, in percentage, years, profit.
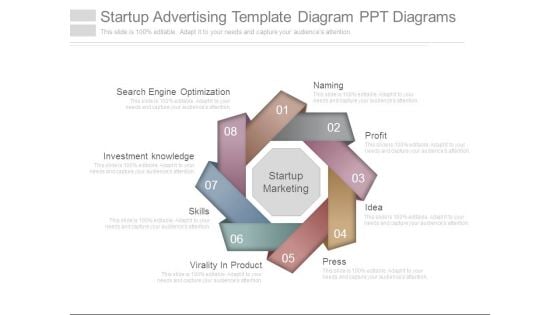
Startup Advertising Template Diagram Ppt Diagrams
This is a startup advertising template diagram ppt diagrams. This is a eight stage process. The stages in this process are startup marketing, search engine optimization, investment knowledge, skills, virality in product, press, idea, profit, naming.
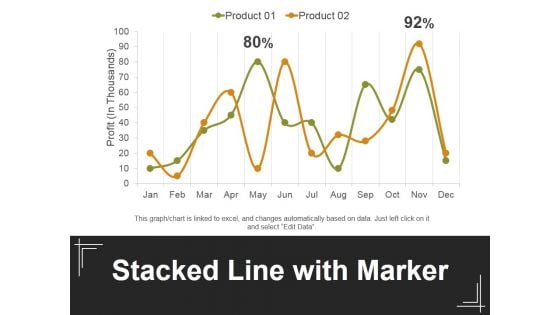
Stacked Line With Marker Ppt PowerPoint Presentation Ideas Themes
This is a stacked line with marker ppt powerpoint presentation ideas themes. This is a two stage process. The stages in this process are profit, stacked bar, product, business, marketing.
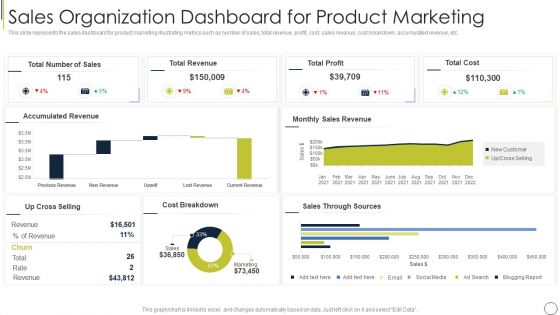
Sales Organization Dashboard For Product Marketing Themes PDF
This slide represents the sales dashboard for product marketing illustrating metrics such as number of sales, total revenue, profit, cost, sales revenue, cost breakdown, accumulated revenue, etc. Pitch your topic with ease and precision using this sales organization dashboard for product marketing themes pdf. This layout presents information on total cost, total profit, total revenue. It is also available for immediate download and adjustment. So, changes can be made in the color, design, graphics or any other component to create a unique layout.
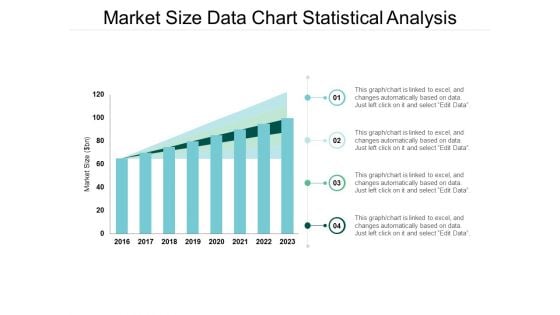
Market Size Data Chart Statistical Analysis Ppt Powerpoint Presentation Model Format
This is a market size data chart statistical analysis ppt powerpoint presentation model format. The topics discussed in this diagram are market growth, market opportunity, market profitability. This is a completely editable PowerPoint presentation, and is available for immediate download.
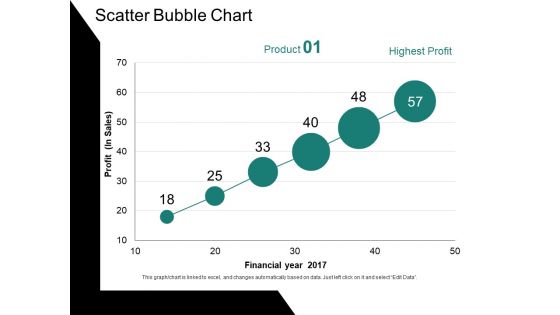
Scatter Bubble Chart Ppt PowerPoint Presentation Ideas Gallery
This is a scatter bubble chart ppt powerpoint presentation ideas gallery. This is a six stage process. The stages in this process are profit, financial year, chart, business, growth.

Area Chart Ppt PowerPoint Presentation Infographic Template Layout
This is a area chart ppt powerpoint presentation infographic template layout. This is a two stage process. The stages in this process are product, profit, area chart, growth, success.
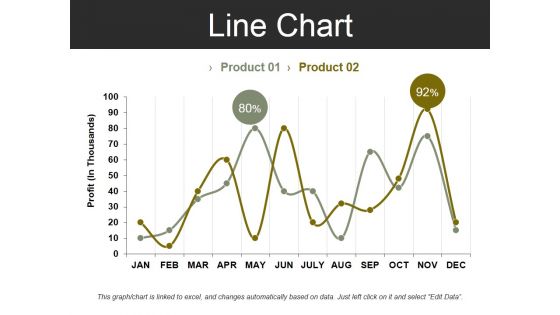
Line Chart Template 2 Ppt PowerPoint Presentation Summary Design Inspiration
This is a line chart template 2 ppt powerpoint presentation summary design inspiration. This is a two stage process. The stages in this process are profit, business, marketing, finance, chart.
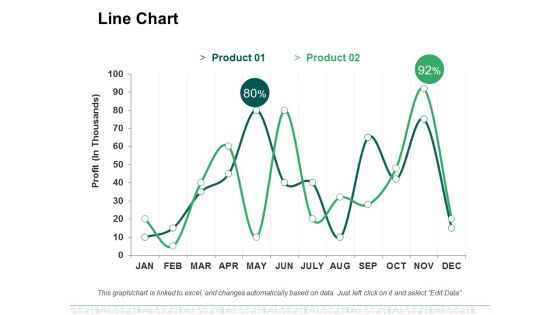
Line Chart Ppt PowerPoint Presentation File Designs Download
This is a line chart ppt powerpoint presentation file designs download. This is a two stage process. The stages in this process are business, marketing, profit, line chart, percentage.
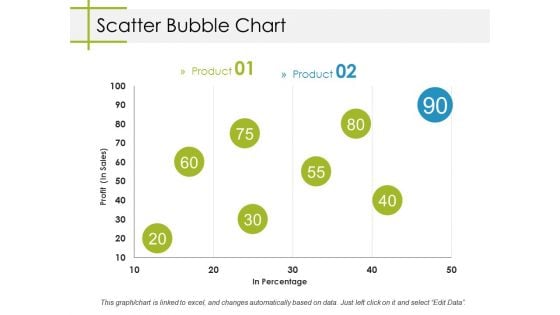
Scatter Bubble Chart Ppt PowerPoint Presentation Model Designs
This is a scatter bubble chart ppt powerpoint presentation model designs. This is a two stage process. The stages in this process are business, profit, in percentage, bubble chart, marketing.
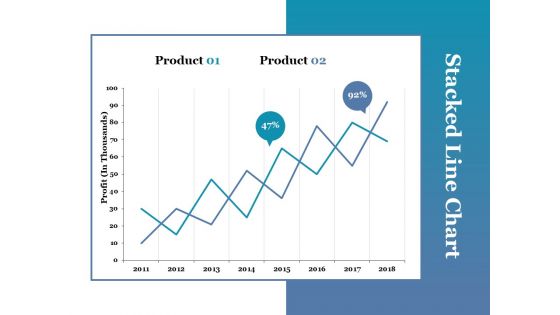
Stacked Line Chart Ppt PowerPoint Presentation Portfolio Picture
This is a stacked line chart ppt powerpoint presentation portfolio picture. This is a two stage process. The stages in this process are stacked line chart, product, profit, growth.
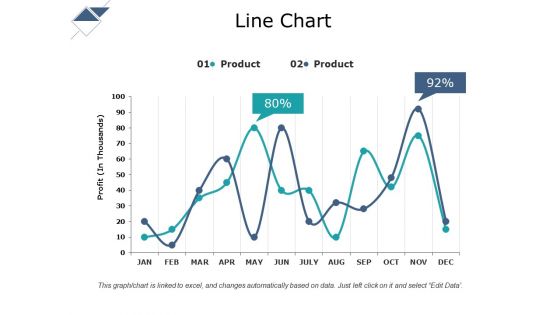
Line Chart Ppt PowerPoint Presentation Gallery Format Ideas
This is a line chart ppt powerpoint presentation gallery format ideas. This is a two stage process. The stages in this process are line chart, product, in year, profit.
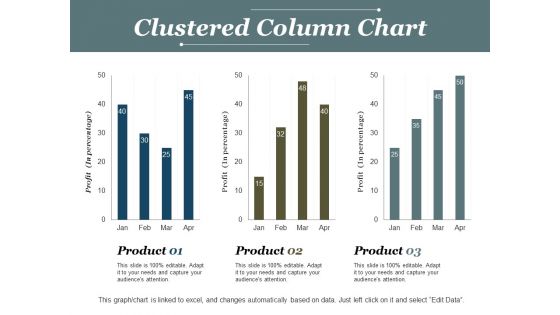
Clustered Column Chart Ppt PowerPoint Presentation Model Deck
This is a clustered column chart ppt powerpoint presentation model deck. This is a three stage process. The stages in this process are clustered column chart, product, finance, profit, business.
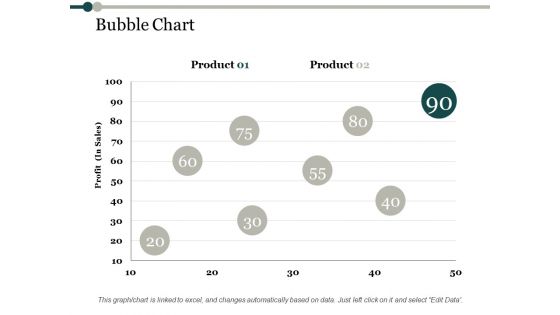
Bubble Chart Process Analysis Ppt PowerPoint Presentation Ideas Files
This is a bubble chart process analysis ppt powerpoint presentation ideas files. This is a two stage process. The stages in this process are bubble chart, product, profit, finance, business.
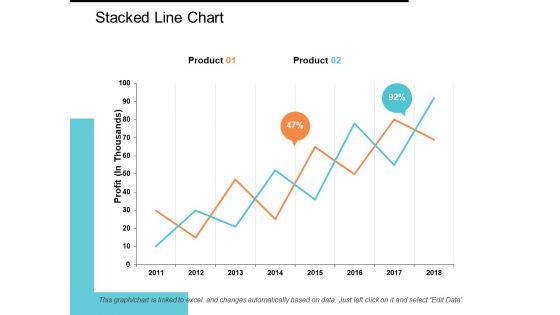
Stacked Line Chart Ppt PowerPoint Presentation Model Show
This is a stacked line chart ppt powerpoint presentation model show. This is a two stage process. The stages in this process are stacked line chart, product, profit, percentage, growth.
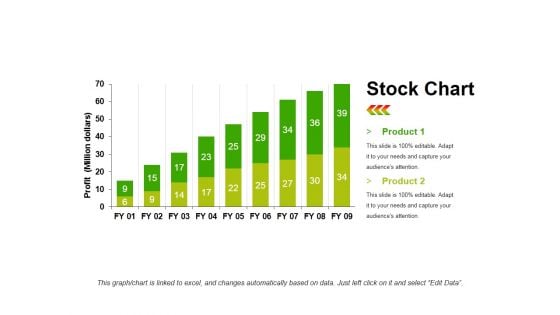
Stock Chart Template 1 Ppt PowerPoint Presentation Infographic Template Objects
This is a stock chart template 1 ppt powerpoint presentation infographic template objects. This is a two stage process. The stages in this process are product, profit, bar graph, growth, success.
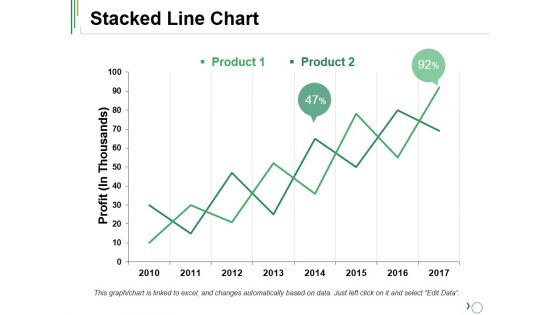
Stacked Line Chart Ppt PowerPoint Presentation Ideas Outfit
This is a stacked line chart ppt powerpoint presentation ideas outfit. This is a two stage process. The stages in this process are product, stacked line, profit, growth, success.
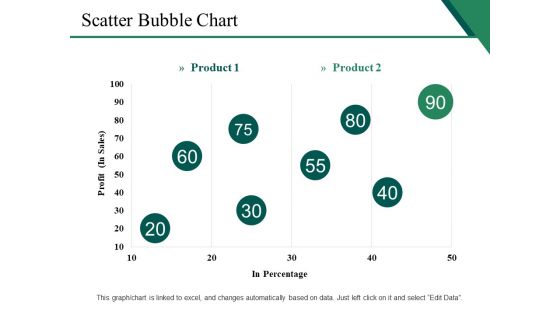
Scatter Bubble Chart Ppt PowerPoint Presentation Gallery Show
This is a scatter bubble chart ppt powerpoint presentation gallery show. This is a two stage process. The stages in this process are profit, in percentage, finance, marketing, business.
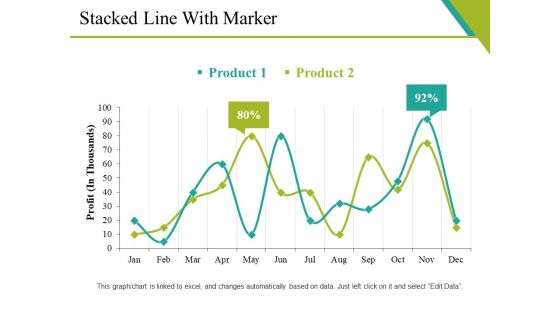
Stacked Line With Marker Ppt PowerPoint Presentation Gallery Diagrams
This is a stacked line with marker ppt powerpoint presentation gallery diagrams. This is a two stage process. The stages in this process are graph, business, marketing, strategy, profit.
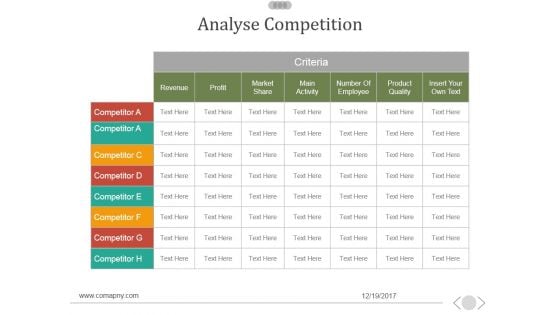
Analyse Competition Ppt PowerPoint Presentation Themes
This is a analyse competition ppt powerpoint presentation themes. This is a seven stage process. The stages in this process are profit, revenue, market share, main activity, number of employee.
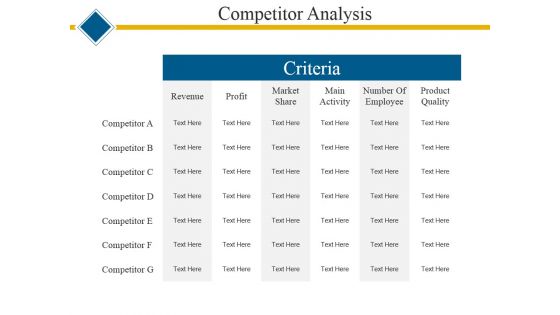
Competitor Analysis Ppt PowerPoint Presentation Professional Themes
This is a competitor analysis ppt powerpoint presentation professional themes. This is a six stage process. The stages in this process are revenue, profit, market share, main activity, number of employee, product quality.

Scatter Chart Template 2 Ppt PowerPoint Presentation Slides
This is a scatter chart template 2 ppt powerpoint presentation slides. This is a eight stage process. The stages in this process are business, marketing, scatter chart, profit, management.
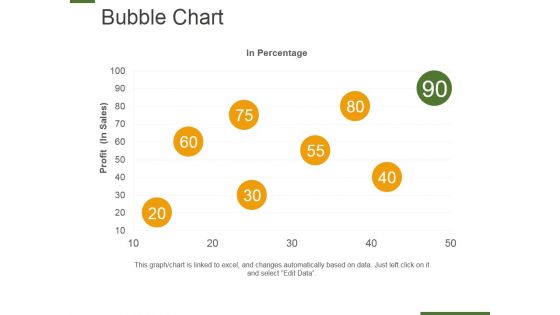
Bubble Chart Ppt PowerPoint Presentation Layouts Design Ideas
This is a bubble chart ppt powerpoint presentation layouts design ideas. This is a eight stage process. The stages in this process are in percentage, profit, bubble chart, business, marketing.
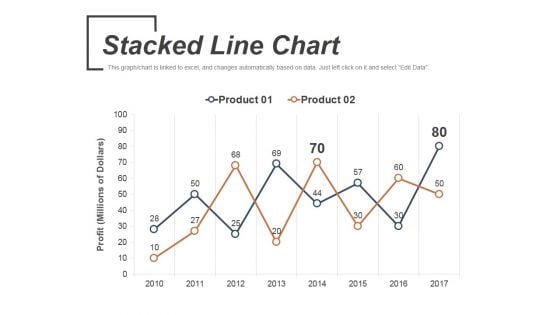
Stacked Line Chart Ppt PowerPoint Presentation Outline Examples
This is a stacked line chart ppt powerpoint presentation outline examples. This is a two stage process. The stages in this process are product, stacked line chart, business, marketing, profit.
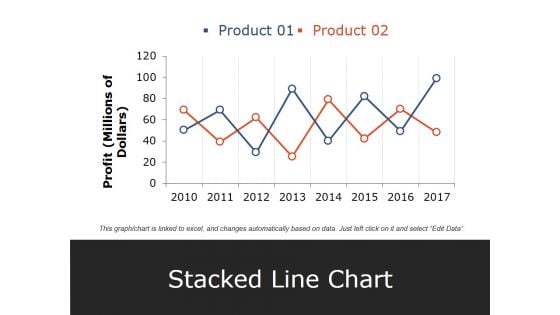
Stacked Line Chart Ppt PowerPoint Presentation Pictures Elements
This is a stacked line chart ppt powerpoint presentation pictures elements. This is a two stage process. The stages in this process are product, profit, stacked line chart, year, business.

Scatter Bubble Chart Ppt PowerPoint Presentation Professional Model
This is a scatter bubble chart ppt powerpoint presentation professional model. This is a six stage process. The stages in this process are sales in profit, financial year, growth, business, marketing, strategy.
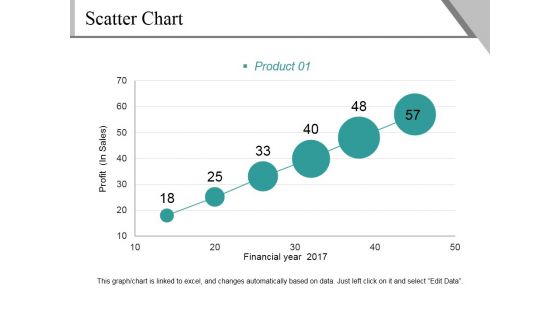
Scatter Chart Ppt PowerPoint Presentation File Background Image
This is a scatter chart ppt powerpoint presentation file background image. This is a six stage process. The stages in this process are profit, financial year, product, growth, success.
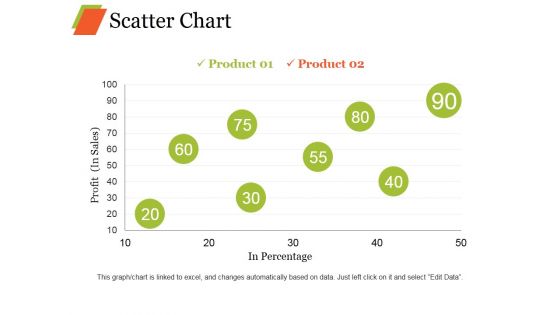
Scatter Chart Ppt PowerPoint Presentation Professional Graphic Images
This is a scatter chart ppt powerpoint presentation professional graphic images. This is a eight stage process. The stages in this process are product, profit, in percentage growth, business.
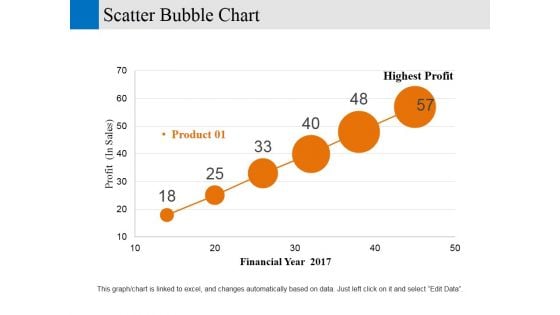
Scatter Bubble Chart Ppt PowerPoint Presentation Gallery Designs Download
This is a scatter bubble chart ppt powerpoint presentation gallery designs download. This is a six stage process. The stages in this process are financial year, profit, business, marketing, strategy.
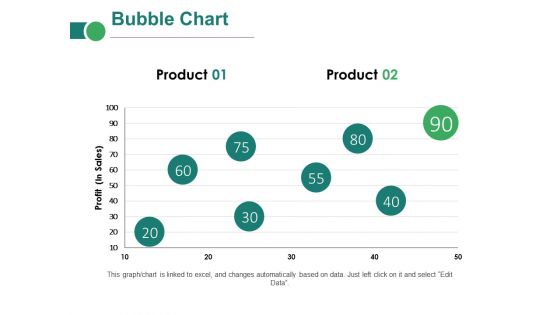
Bubble Chart Ppt PowerPoint Presentation Layouts Clipart Images
This is a bubble chart ppt powerpoint presentation layouts clipart images. This is a two stage process. The stages in this process are business, marketing, profit, innovation, technology, idea bulb.
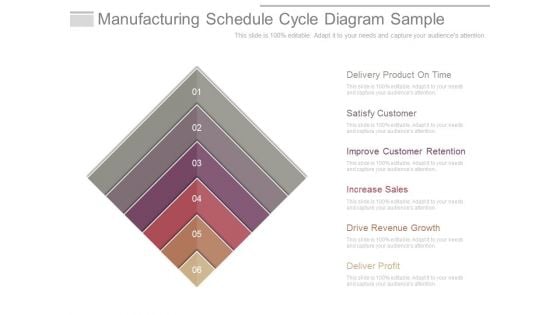
Manufacturing Schedule Cycle Diagram Sample
This is a manufacturing schedule cycle diagram sample. This is a six stage process. The stages in this process are delivery product on time, satisfy customer, improve customer retention, increase sales, drive revenue growth, deliver profit.
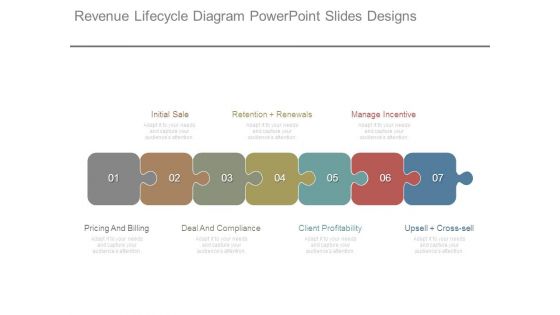
Revenue Lifecycle Diagram Powerpoint Slides Designs
This is a revenue lifecycle diagram powerpoint slides designs. This is a seven stage process. The stages in this process are initial sale, pricing and billing, deal and compliance, client profitability, upsell cross sell, manage incentive, retention renewals.
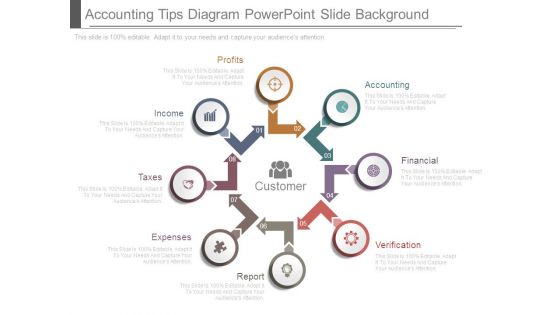
Accounting Tips Diagram Powerpoint Slide Background
This is a accounting tips diagram powerpoint slide background. This is a eight stage process. The stages in this process are accounting, financial, verification, report, expenses, taxes, income, profits, customer.
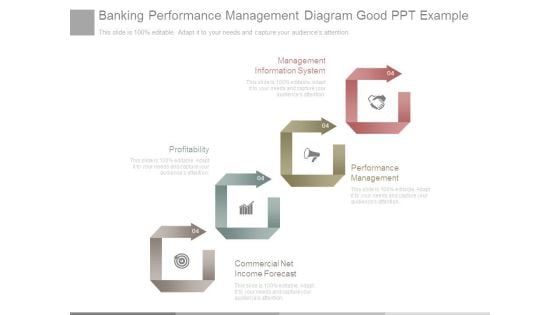
Banking Performance Management Diagram Good Ppt Example
This is a banking performance management diagram good ppt example. This is a four stage process. The stages in this process are management information system, profitability, performance management, commercial net income forecast.
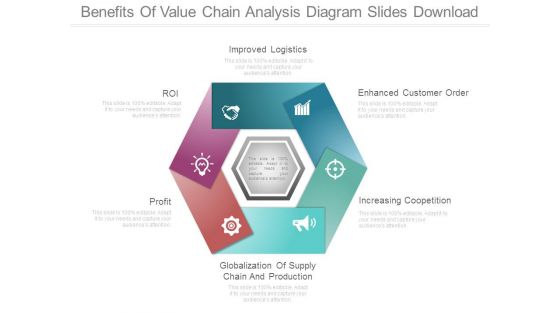
Benefits Of Value Chain Analysis Diagram Slides Download
This is a benefits of value chain analysis diagram slides download. This is a six stage process. The stages in this process are improved logistics, roi, profit, globalization of supply chain and production, enhanced customer order, increasing coopetition.
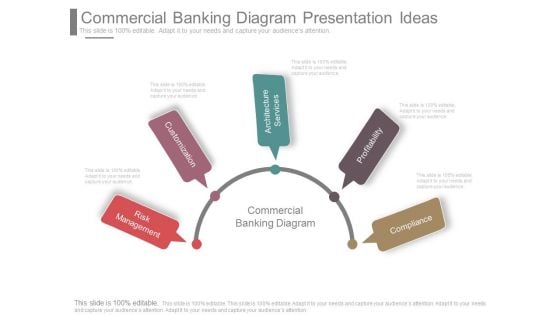
Commercial Banking Diagram Presentation Ideas
This is a commercial banking diagram presentation ideas. This is a five stage process. The stages in this process are risk management, customization, architecture services, profitability, compliance, commercial banking diagram.
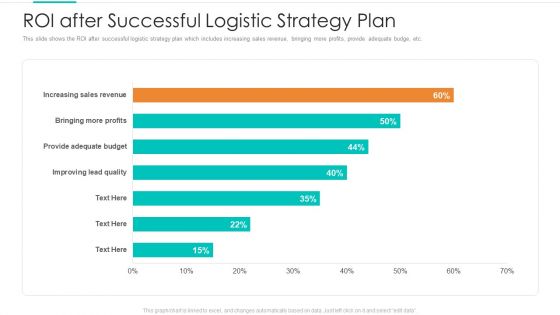
Planning Logistic Technique Superior Supply Chain Execution Roi After Successful Logistic Strategy Plan Themes PDF
This slide shows the ROI after successful logistic strategy plan which includes increasing sales revenue, bringing more profits, provide adequate budge, etc. Deliver an awe-inspiring pitch with this creative planning logistic technique superior supply chain execution roi after successful logistic strategy plan themes pdf bundle. Topics like sales revenue, profits, provide adequate budge can be discussed with this completely editable template. It is available for immediate download depending on the needs and requirements of the user.
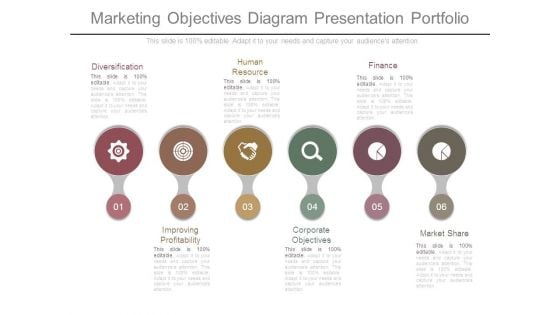
Marketing Objectives Diagram Presentation Portfolio
This is a marketing objectives diagram presentation portfolio. This is a six stage process. The stages in this process are diversification, human resource, finance, improving profitability, corporate objectives, market share.
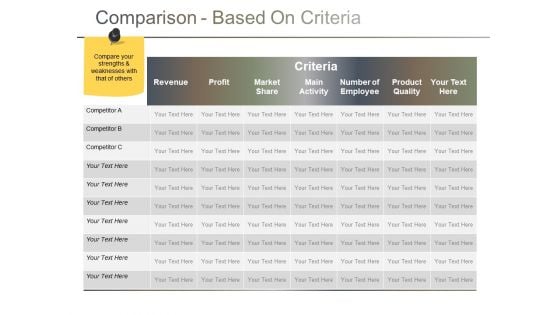
Comparison Based On Criteria Ppt PowerPoint Presentation Gallery Themes
This is a comparison based on criteria ppt powerpoint presentation gallery themes. This is a seven stage process. The stages in this process are revenue, profit, market share, main activity, product quality.

Example Of Optimized Investment Sample Diagram Powerpoint Graphics
This is a example of optimized investment sample diagram powerpoint graphics. This is a eight stage process. The stages in this process are customer, performance, profit, capital protection, leverage, yield enhancement, sales, brand growth.

Manufacturing Schedule Cycle Diagram Ppt Sample
This is a manufacturing schedule cycle diagram ppt sample. This is a six stage process. The stages in this process are delivery product on time, satisfy customer, improve customer retention, increase sales, drive revenue growth, deliver profit.

 Home
Home