Profit Icon

Scatter Bubble Chart Ppt PowerPoint Presentation Professional Model
This is a scatter bubble chart ppt powerpoint presentation professional model. This is a six stage process. The stages in this process are sales in profit, financial year, growth, business, marketing, strategy.
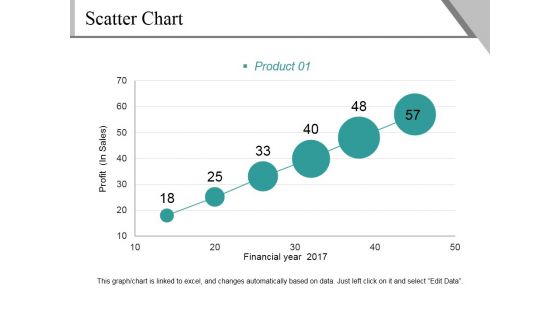
Scatter Chart Ppt PowerPoint Presentation File Background Image
This is a scatter chart ppt powerpoint presentation file background image. This is a six stage process. The stages in this process are profit, financial year, product, growth, success.
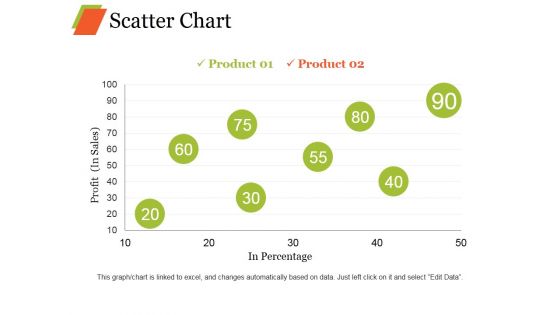
Scatter Chart Ppt PowerPoint Presentation Professional Graphic Images
This is a scatter chart ppt powerpoint presentation professional graphic images. This is a eight stage process. The stages in this process are product, profit, in percentage growth, business.
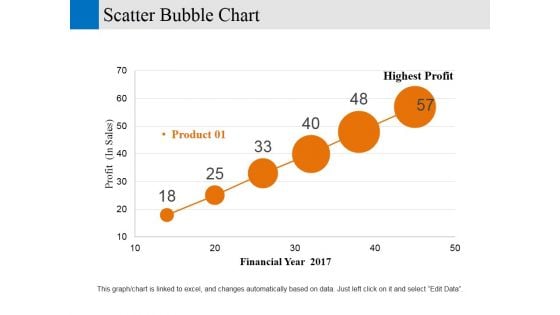
Scatter Bubble Chart Ppt PowerPoint Presentation Gallery Designs Download
This is a scatter bubble chart ppt powerpoint presentation gallery designs download. This is a six stage process. The stages in this process are financial year, profit, business, marketing, strategy.
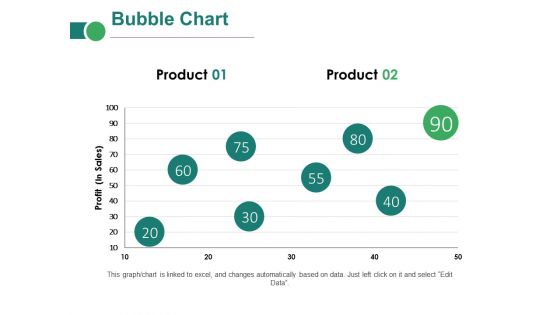
Bubble Chart Ppt PowerPoint Presentation Layouts Clipart Images
This is a bubble chart ppt powerpoint presentation layouts clipart images. This is a two stage process. The stages in this process are business, marketing, profit, innovation, technology, idea bulb.
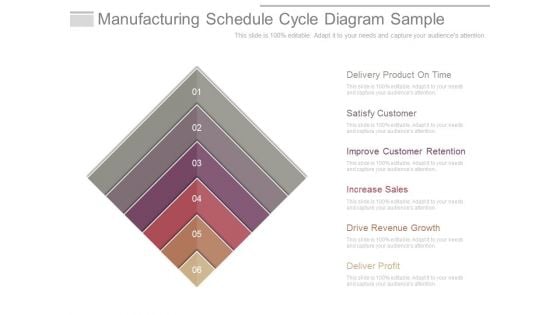
Manufacturing Schedule Cycle Diagram Sample
This is a manufacturing schedule cycle diagram sample. This is a six stage process. The stages in this process are delivery product on time, satisfy customer, improve customer retention, increase sales, drive revenue growth, deliver profit.
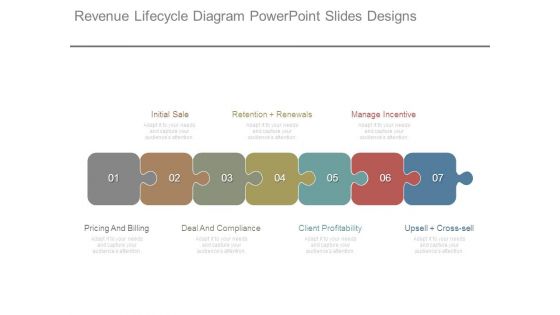
Revenue Lifecycle Diagram Powerpoint Slides Designs
This is a revenue lifecycle diagram powerpoint slides designs. This is a seven stage process. The stages in this process are initial sale, pricing and billing, deal and compliance, client profitability, upsell cross sell, manage incentive, retention renewals.
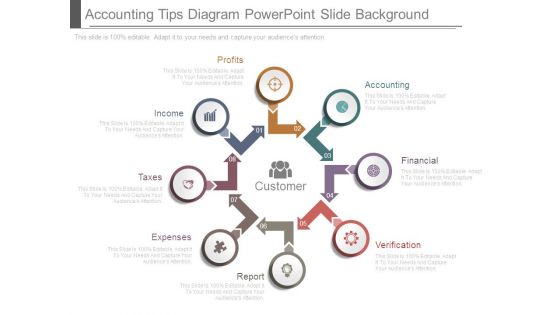
Accounting Tips Diagram Powerpoint Slide Background
This is a accounting tips diagram powerpoint slide background. This is a eight stage process. The stages in this process are accounting, financial, verification, report, expenses, taxes, income, profits, customer.
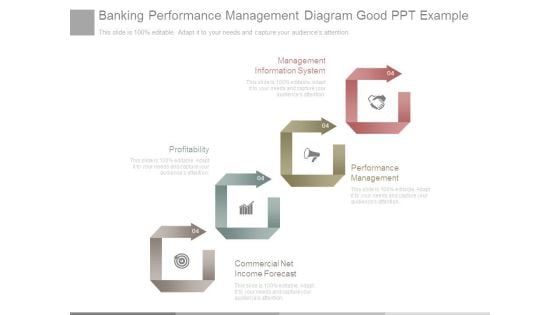
Banking Performance Management Diagram Good Ppt Example
This is a banking performance management diagram good ppt example. This is a four stage process. The stages in this process are management information system, profitability, performance management, commercial net income forecast.
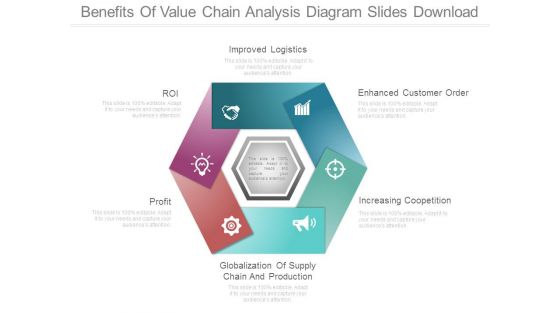
Benefits Of Value Chain Analysis Diagram Slides Download
This is a benefits of value chain analysis diagram slides download. This is a six stage process. The stages in this process are improved logistics, roi, profit, globalization of supply chain and production, enhanced customer order, increasing coopetition.
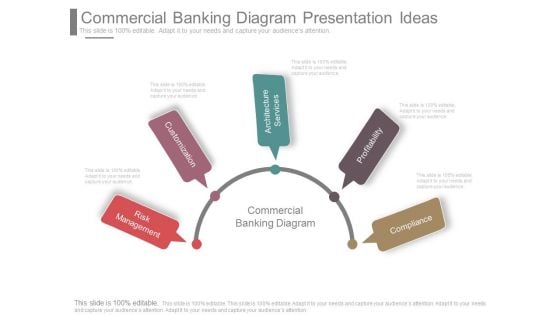
Commercial Banking Diagram Presentation Ideas
This is a commercial banking diagram presentation ideas. This is a five stage process. The stages in this process are risk management, customization, architecture services, profitability, compliance, commercial banking diagram.
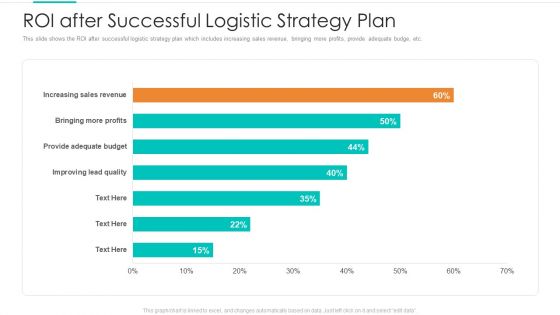
Planning Logistic Technique Superior Supply Chain Execution Roi After Successful Logistic Strategy Plan Themes PDF
This slide shows the ROI after successful logistic strategy plan which includes increasing sales revenue, bringing more profits, provide adequate budge, etc. Deliver an awe-inspiring pitch with this creative planning logistic technique superior supply chain execution roi after successful logistic strategy plan themes pdf bundle. Topics like sales revenue, profits, provide adequate budge can be discussed with this completely editable template. It is available for immediate download depending on the needs and requirements of the user.
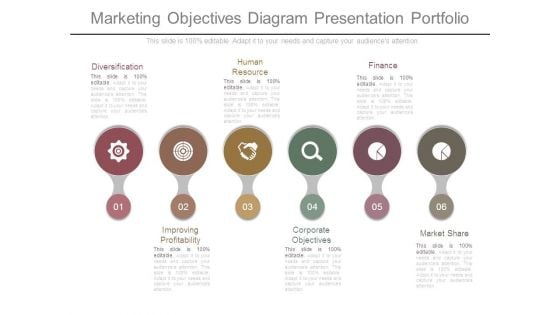
Marketing Objectives Diagram Presentation Portfolio
This is a marketing objectives diagram presentation portfolio. This is a six stage process. The stages in this process are diversification, human resource, finance, improving profitability, corporate objectives, market share.
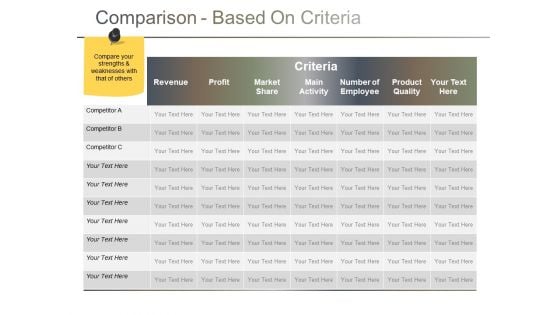
Comparison Based On Criteria Ppt PowerPoint Presentation Gallery Themes
This is a comparison based on criteria ppt powerpoint presentation gallery themes. This is a seven stage process. The stages in this process are revenue, profit, market share, main activity, product quality.

Example Of Optimized Investment Sample Diagram Powerpoint Graphics
This is a example of optimized investment sample diagram powerpoint graphics. This is a eight stage process. The stages in this process are customer, performance, profit, capital protection, leverage, yield enhancement, sales, brand growth.

Manufacturing Schedule Cycle Diagram Ppt Sample
This is a manufacturing schedule cycle diagram ppt sample. This is a six stage process. The stages in this process are delivery product on time, satisfy customer, improve customer retention, increase sales, drive revenue growth, deliver profit.
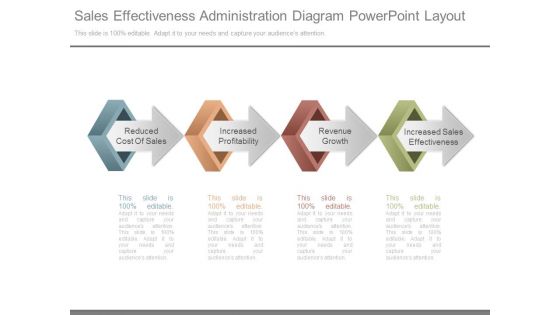
Sales Effectiveness Administration Diagram Powerpoint Layout
This is a sales effectiveness administration diagram powerpoint layout. This is a four stage process. The stages in this process are reduced cost of sales, increased profitability, revenue growth, increased sales effectiveness.
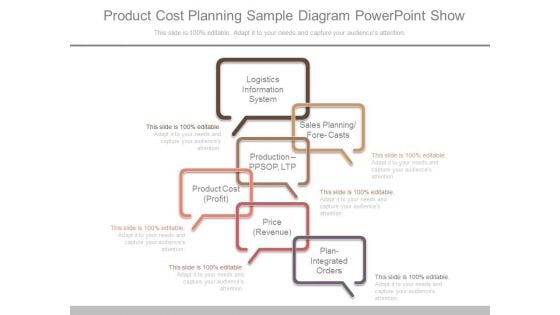
Product Cost Planning Sample Diagram Powerpoint Show
This is a product cost planning sample diagram powerpoint show. This is a six stage process. The stages in this process are logistics information system, sales planning, forecasts, production ppsop, ltp, product cost profit, price revenue, plan integrated orders.
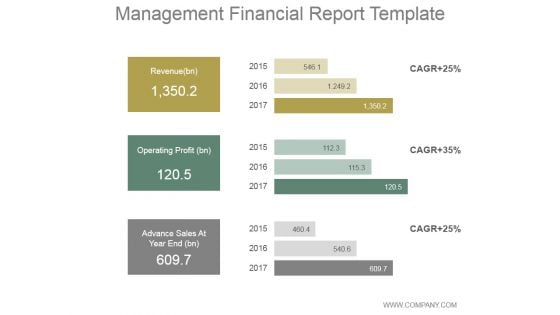
Management Financial Report Ppt PowerPoint Presentation Diagrams
This is a management financial report ppt powerpoint presentation diagrams. This is a three stage process. The stages in this process are revenue, operating profit, advance sales at year end.

Executive Summary Ppt PowerPoint Presentation Outline Diagrams
This is a executive summary ppt powerpoint presentation outline diagrams. This is a two stage process. The stages in this process are revenue, profits, operational cost, total customers, marketing channels.
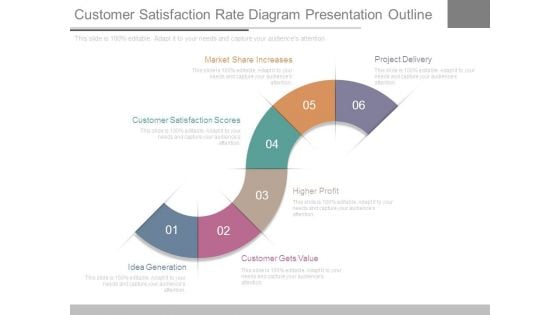
Customer Satisfaction Rate Diagram Presentation Outline
This is a customer satisfaction rate diagram presentation outline. This is a six stage process. The stages in this process are idea generation, customer gets value, higher profit, customer satisfaction scores, market share increases, project delivery.
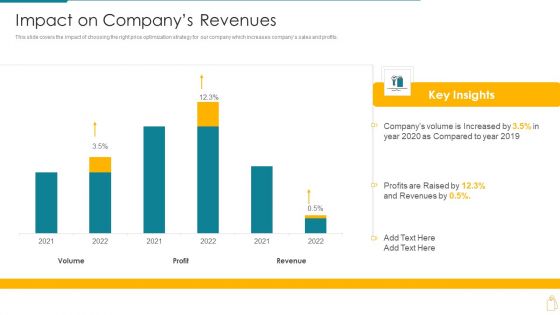
Cost And Income Optimization Impact On Companys Revenues Rules PDF
This slide covers the impact of choosing the right price optimization strategy for our company which increases companys sales and profits. Deliver an awe inspiring pitch with this creative cost and income optimization impact on companys revenues rules pdf bundle. Topics like volume, profit, revenue, 2021 to 2022 can be discussed with this completely editable template. It is available for immediate download depending on the needs and requirements of the user.
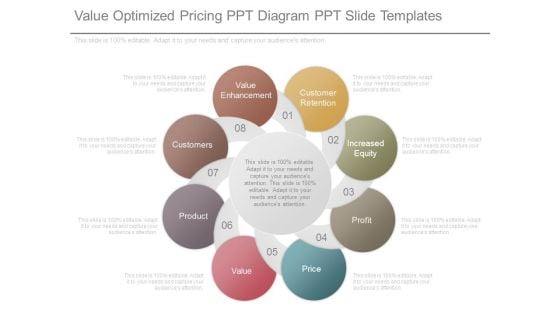
Value Optimized Pricing Ppt Diagram Ppt Slide Templates
This is a value optimized pricing ppt diagram ppt slide templates. This is a eight stage process. The stages in this process are value enhancement, customers, product, value, customer retention, increased equity, profit, price.

Business Management Information Systems Diagram Presentation Deck
This is a business management information systems diagram presentation deck. This is a seven stage process. The stages in this process are corporations, consulting with a firm or as a freelancer, government, education, technology entrepreneurship, healthcare, non profits.
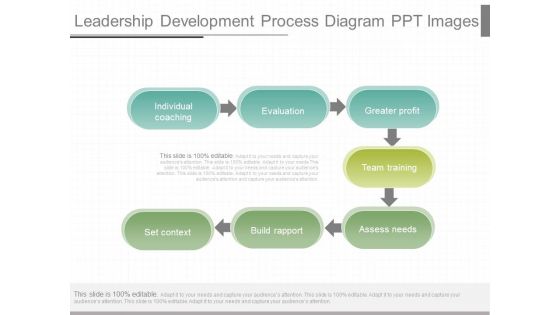
Leadership Development Process Diagram Ppt Images
This is a leadership development process diagram ppt images. This is a seven stage process. The stages in this process are individual coaching, evaluation, greater profit, team training, assess needs, build rapport, set context.
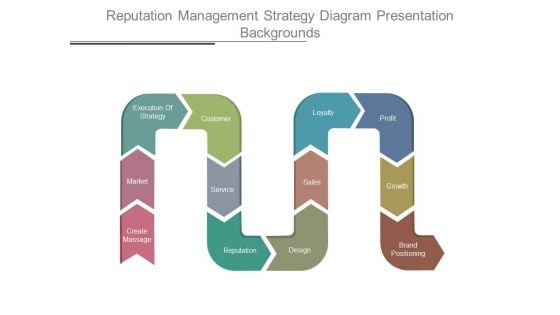
Reputation Management Strategy Diagram Presentation Backgrounds
This is a reputation management strategy diagram presentation backgrounds. This is a twelve stage process. The stages in this process are create massage, market, execution of strategy, customer, service, reputation, design, sales, loyalty, profit, growth, brand positioning.
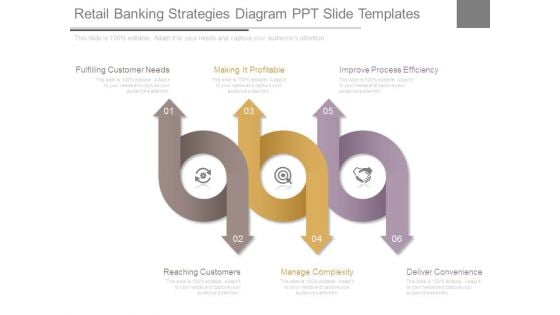
Retail Banking Strategies Diagram Ppt Slide Templates
This is a retail banking strategies diagram ppt slide templates. This is a six stage process. The stages in this process are fulfilling customer needs, making it profitable, improve process efficiency, reaching customers, manage complexity, deliver convenience.
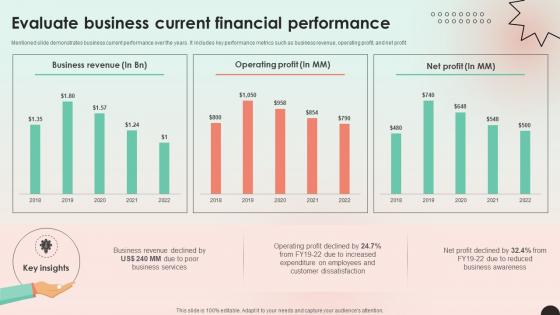
Web Consulting Business Evaluate Business Current Financial Performance
Mentioned slide demonstrates business current performance over the years. It includes key performance metrics such as business revenue, operating profit, and net profit. Are you searching for a Web Consulting Business Evaluate Business Current Financial Performance that is uncluttered, straightforward, and original Its easy to edit, and you can change the colors to suit your personal or business branding. For a presentation that expresses how much effort you have put in, this template is ideal With all of its features, including tables, diagrams, statistics, and lists, its perfect for a business plan presentation. Make your ideas more appealing with these professional slides. Download Web Consulting Business Evaluate Business Current Financial Performance from Slidegeeks today. Mentioned slide demonstrates business current performance over the years. It includes key performance metrics such as business revenue, operating profit, and net profit.
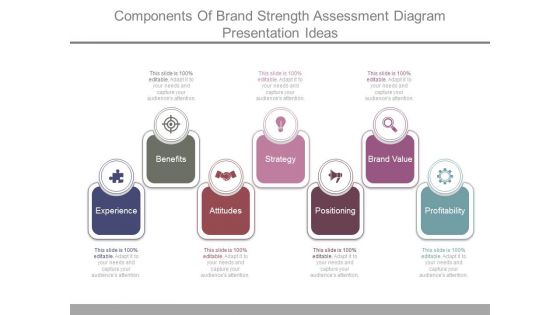
Components Of Brand Strength Assessment Diagram Presentation Ideas
This is a components of brand strength assessment diagram presentation ideas. This is a seven stage process. The stages in this process are benefits, experience, attitudes, strategy, positioning, brand value, profitability.
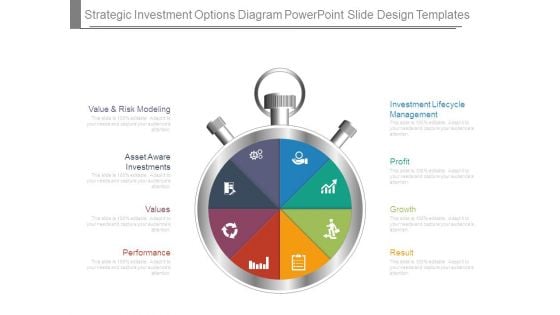
Strategic Investment Options Diagram Powerpoint Slide Design Templates
This is a strategic investment options diagram powerpoint slide design templates. This is a eight stage process. The stages in this process are value and risk modeling, asset aware investments, values, performance, investment lifecycle management, profit, growth, result.
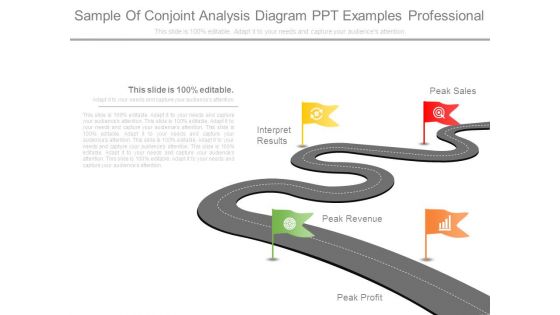
Sample Of Conjoint Analysis Diagram Ppt Examples Professional
This is a sample of conjoint analysis diagram ppt examples professional. This is a four stage process. The stages in this process are peak profit, peak revenue, interpret results, peak sales.
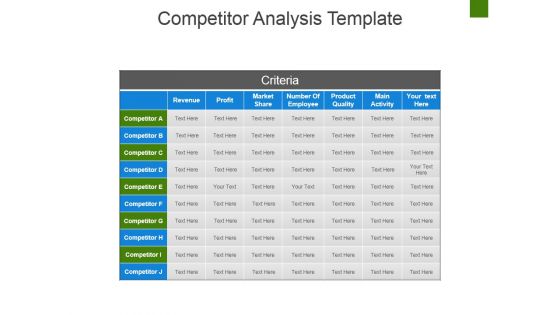
Competitor Analysis Template Ppt PowerPoint Presentation Pictures Diagrams
This is a competitor analysis template ppt powerpoint presentation pictures diagrams. This is a seven stage process. The stages in this process are revenue, profit, market share, number of employee, product quality, main activity.
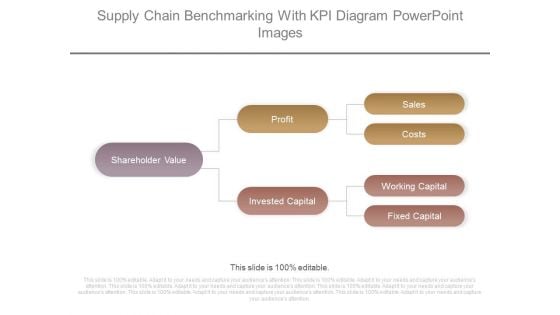
Supply Chain Benchmarking With Kpi Diagram Powerpoint Images
This is a supply chain benchmarking with kpi diagram powerpoint images. This is a three stage process. The stages in this process are shareholder value, profit, invested capital, sales, costs, working capital, fixed capital.

Business Diagram Roulette Wheel For Business Risk Presentation Template
Our above slide displays graphics of roulette wheel. Download our above diagram to express views on gambling, business risk and profit. Use this diagram to get good comments from viewers.
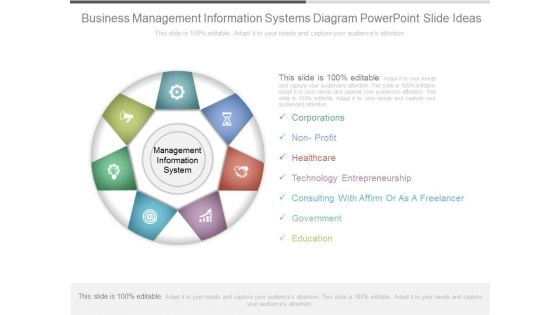
Business Management Information Systems Diagram Powerpoint Slide Ideas
This is a business management information systems diagram powerpoint slide ideas. This is a seven stage process. The stages in this process are corporations, non profit, healthcare, technology entrepreneurship, consulting with affirm or as a freelancer, government, education.
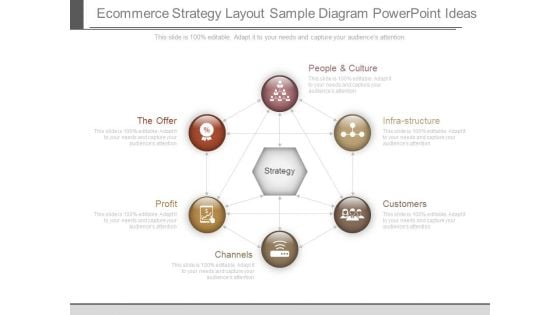
E Commerce Strategy Layout Sample Diagram Powerpoint Ideas
This is a e commerce strategy layout sample diagram powerpoint ideas. This is a six stage process. The stages in this process are people and culture, the offer, infrastructure, customers, channels, profit, strategy.\n\n\n\n
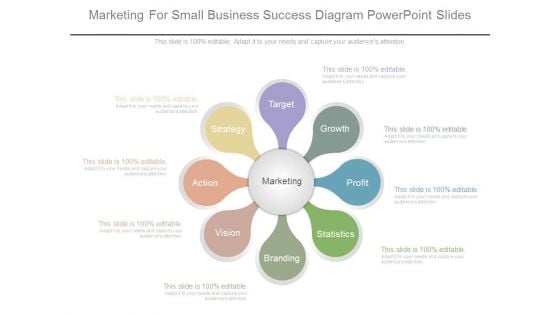
Marketing For Small Business Success Diagram Powerpoint Slides
This is a marketing for small business success diagram powerpoint slides. This is a eight stage process. The stages in this process are target, growth, profit, statistics, branding, vision, action, strategy, marketing.
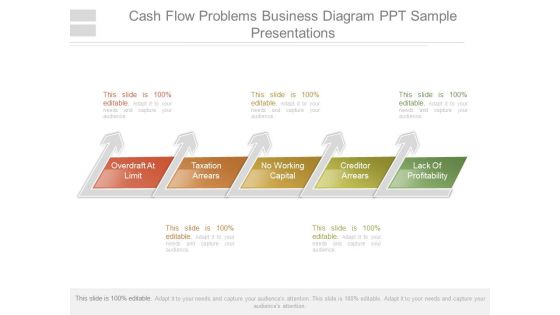
Cash Flow Problems Business Diagram Ppt Sample Presentations
This is a cash flow problems business diagram ppt sample presentations. This is a five stage process. The stages in this process are overdraft at limit, taxation arrears, no working capital, creditor arrears, lack of profitability.
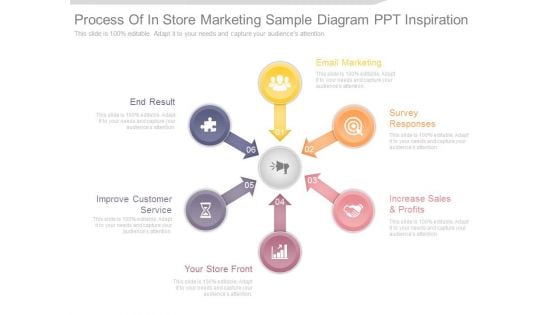
Process Of In Store Marketing Sample Diagram Ppt Inspiration
This is a process of in store marketing sample diagram ppt inspiration. This is a six stage process. The stages in this process are end result, improve customer service, your store front, increase sales and profits, survey responses, email marketing.
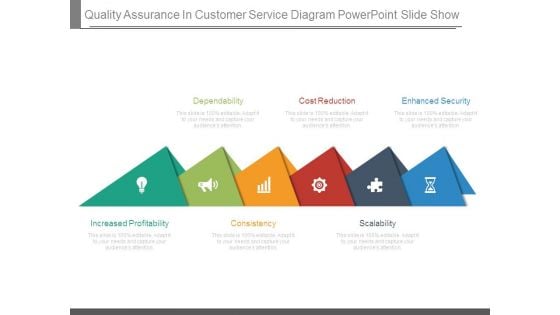
Quality Assurance In Customer Service Diagram Powerpoint Slide Show
This is a quality assurance in customer service diagram powerpoint slide show. This is a six stage process. The stages in this process are dependability, cost reduction, enhanced security, scalability, consistency, increased profitability.
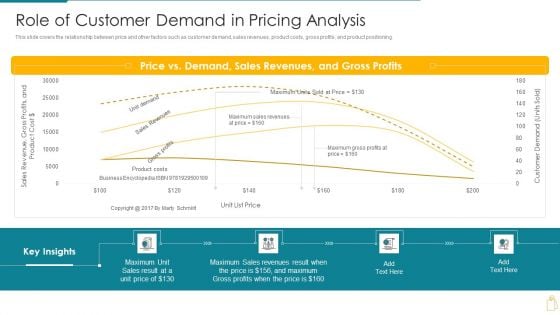
Cost And Income Optimization Role Of Customer Demand In Pricing Analysis Topics PDF
This slide covers the relationship between price and other factors such as customer demand, sales revenues, product costs, gross profits, and product positioning. Deliver an awe inspiring pitch with this creative cost and income optimization role of customer demand in pricing analysis topics pdf bundle. Topics like gross profits, sales revenues, price vs demand can be discussed with this completely editable template. It is available for immediate download depending on the needs and requirements of the user.
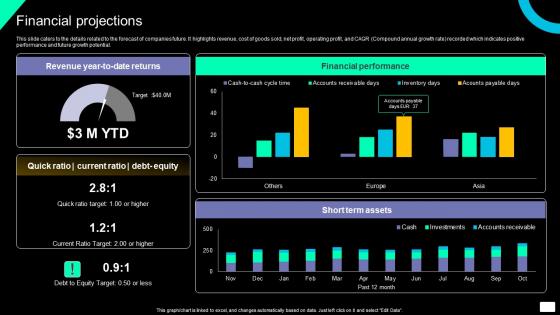
Financial Projections Brand Exposure And Lead Generation Software Investment Designs Pdf
This slide caters to the details related to the forecast of companies future. It highlights revenue, cost of goods sold, net profit, operating profit, and CAGR Compound annual growth rate recorded which indicates positive performance and future growth potential. Present like a pro with Financial Projections Brand Exposure And Lead Generation Software Investment Designs Pdf Create beautiful presentations together with your team, using our easy-to-use presentation slides. Share your ideas in real-time and make changes on the fly by downloading our templates. So whether you are in the office, on the go, or in a remote location, you can stay in sync with your team and present your ideas with confidence. With Slidegeeks presentation got a whole lot easier. Grab these presentations today. This slide caters to the details related to the forecast of companies future. It highlights revenue, cost of goods sold, net profit, operating profit, and CAGR Compound annual growth rate recorded which indicates positive performance and future growth potential.
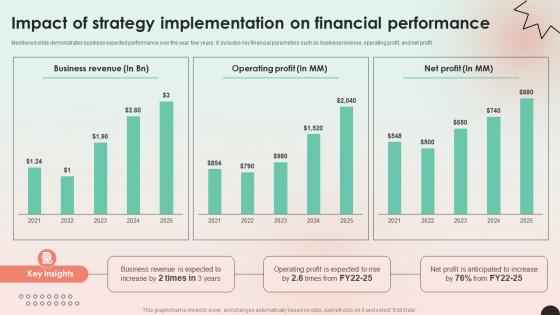
Web Consulting Business Impact Of Strategy Implementation On Financial
Mentioned slide demonstrates business expected performance over the year few years. It includes key financial parameters such as business revenue, operating profit, and net profit. Here you can discover an assortment of the finest PowerPoint and Google Slides templates. With these templates, you can create presentations for a variety of purposes while simultaneously providing your audience with an eye-catching visual experience. Download Web Consulting Business Impact Of Strategy Implementation On Financial to deliver an impeccable presentation. These templates will make your job of preparing presentations much quicker, yet still, maintain a high level of quality. Slidegeeks has experienced researchers who prepare these templates and write high-quality content for you. Later on, you can personalize the content by editing the Web Consulting Business Impact Of Strategy Implementation On Financial. Mentioned slide demonstrates business expected performance over the year few years. It includes key financial parameters such as business revenue, operating profit, and net profit.
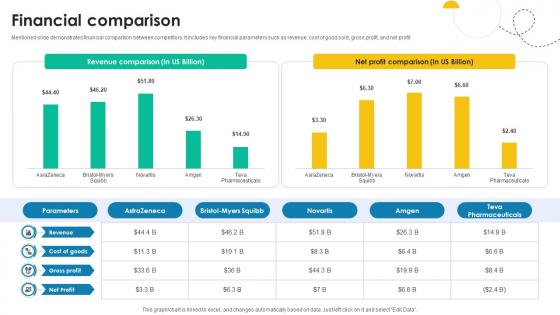
Financial Comparison Medical Research And Development Company Profile CP SS V
Mentioned slide demonstrates financial comparison between competitors. It includes key financial parameters such as revenue, cost of good sold, gross profit, and net profit. Are you in need of a template that can accommodate all of your creative concepts This one is crafted professionally and can be altered to fit any style. Use it with Google Slides or PowerPoint. Include striking photographs, symbols, depictions, and other visuals. Fill, move around, or remove text boxes as desired. Test out color palettes and font mixtures. Edit and save your work, or work with colleagues. Download Financial Comparison Medical Research And Development Company Profile CP SS V and observe how to make your presentation outstanding. Give an impeccable presentation to your group and make your presentation unforgettable. Mentioned slide demonstrates financial comparison between competitors. It includes key financial parameters such as revenue, cost of good sold, gross profit, and net profit.

Executive Summary Vehicle Manufacturing Company Profile CP SS V
This slide represents the executive summary of Mitsubishi, which includes details regarding the team, revenue, net profit, operating segment, and gross profit. Do you have an important presentation coming up Are you looking for something that will make your presentation stand out from the rest Look no further than Executive Summary Vehicle Manufacturing Company Profile CP SS V. With our professional designs, you can trust that your presentation will pop and make delivering it a smooth process. And with Slidegeeks, you can trust that your presentation will be unique and memorable. So why wait Grab Executive Summary Vehicle Manufacturing Company Profile CP SS V today and make your presentation stand out from the rest This slide represents the executive summary of Mitsubishi, which includes details regarding the team, revenue, net profit, operating segment, and gross profit.
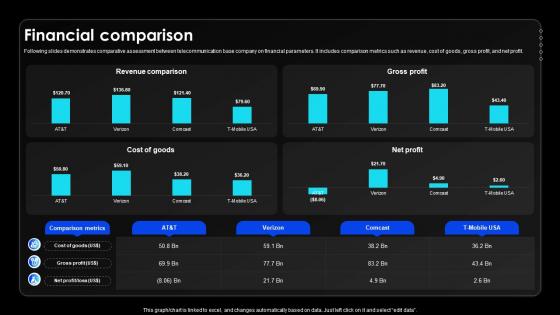
Financial Comparison Wireless Communication Services Provider Company Profile CP SS V
Following slides demonstrates comparative assessment between telecommunication base company on financial parameters. It includes comparison metrics such as revenue, cost of goods, gross profit, and net profit.If your project calls for a presentation, then Slidegeeks is your go-to partner because we have professionally designed, easy-to-edit templates that are perfect for any presentation. After downloading, you can easily edit Financial Comparison Wireless Communication Services Provider Company Profile CP SS V and make the changes accordingly. You can rearrange slides or fill them with different images. Check out all the handy templates Following slides demonstrates comparative assessment between telecommunication base company on financial parameters. It includes comparison metrics such as revenue, cost of goods, gross profit, and net profit.
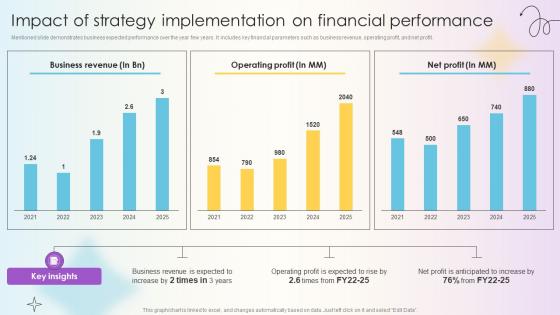
Managing Technical And Non Impact Of Strategy Implementation On Financial
Mentioned slide demonstrates business expected performance over the year few years. It includes key financial parameters such as business revenue, operating profit, and net profit. Slidegeeks has constructed Managing Technical And Non Impact Of Strategy Implementation On Financial after conducting extensive research and examination. These presentation templates are constantly being generated and modified based on user preferences and critiques from editors. Here, you will find the most attractive templates for a range of purposes while taking into account ratings and remarks from users regarding the content. This is an excellent jumping-off point to explore our content and will give new users an insight into our top-notch PowerPoint Templates. Mentioned slide demonstrates business expected performance over the year few years. It includes key financial parameters such as business revenue, operating profit, and net profit.
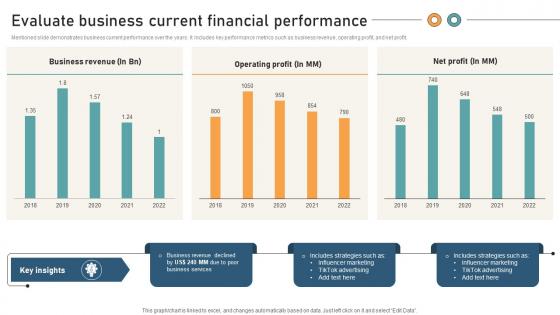
Comprehensive Guide For Website Evaluate Business Current Financial Performance
Mentioned slide demonstrates business current performance over the years. It includes key performance metrics such as business revenue, operating profit, and net profit. This Comprehensive Guide For Website Evaluate Business Current Financial Performance from Slidegeeks makes it easy to present information on your topic with precision. It provides customization options, so you can make changes to the colors, design, graphics, or any other component to create a unique layout. It is also available for immediate download, so you can begin using it right away. Slidegeeks has done good research to ensure that you have everything you need to make your presentation stand out. Make a name out there for a brilliant performance. Mentioned slide demonstrates business current performance over the years. It includes key performance metrics such as business revenue, operating profit, and net profit.
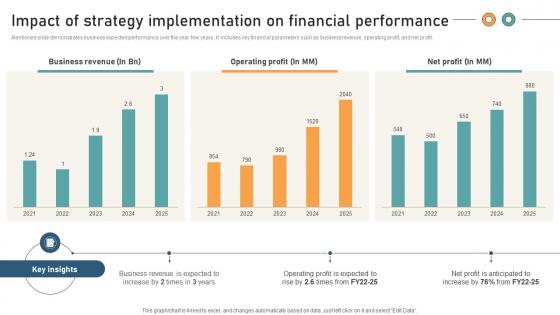
Comprehensive Guide For Website Impact Of Strategy Implementation On Financial
Mentioned slide demonstrates business expected performance over the year few years. It includes key financial parameters such as business revenue, operating profit, and net profit. Boost your pitch with our creative Comprehensive Guide For Website Impact Of Strategy Implementation On Financial. Deliver an awe-inspiring pitch that will mesmerize everyone. Using these presentation templates you will surely catch everyones attention. You can browse the ppts collection on our website. We have researchers who are experts at creating the right content for the templates. So you do not have to invest time in any additional work. Just grab the template now and use them. Mentioned slide demonstrates business expected performance over the year few years. It includes key financial parameters such as business revenue, operating profit, and net profit.
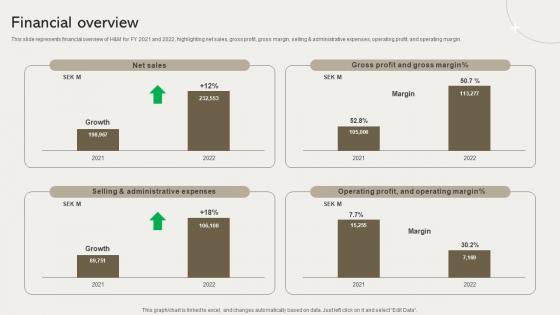
Financial Overview Clothing Retailer Company Profile CP SS V
This slide represents financial overview of HandM for FY 2021 and 2022, highlighting net sales, gross profit, gross margin, selling and administrative expenses, operating profit, and operating margin. Do you have an important presentation coming up Are you looking for something that will make your presentation stand out from the rest Look no further than Financial Overview Clothing Retailer Company Profile CP SS V. With our professional designs, you can trust that your presentation will pop and make delivering it a smooth process. And with Slidegeeks, you can trust that your presentation will be unique and memorable. So why wait Grab Financial Overview Clothing Retailer Company Profile CP SS V today and make your presentation stand out from the rest This slide represents financial overview of HandM for FY 2021 and 2022, highlighting net sales, gross profit, gross margin, selling and administrative expenses, operating profit, and operating margin.
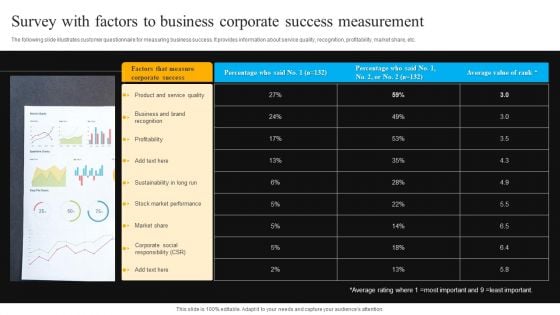
Survey With Factors To Business Corporate Success Measurement Themes PDF
The following slide illustrates customer questionnaire for measuring business success. It provides information about service quality, recognition, profitability, market share, etc. Pitch your topic with ease and precision using this Survey With Factors To Business Corporate Success Measurement Themes PDF. This layout presents information on Business And Brand, Profitability, Stock Market Performance. It is also available for immediate download and adjustment. So, changes can be made in the color, design, graphics or any other component to create a unique layout.
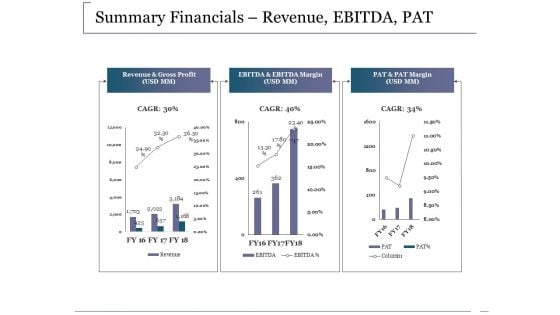
Summary Financials Revenue Ebitda Pat Ppt PowerPoint Presentation Outline Infographics
This is a summary financials revenue ebitda pat ppt powerpoint presentation outline infographics. This is a three stage process. The stages in this process are revenue and gross profit, ebitda and ebitda margin, pat and pat margin, business, marketing.
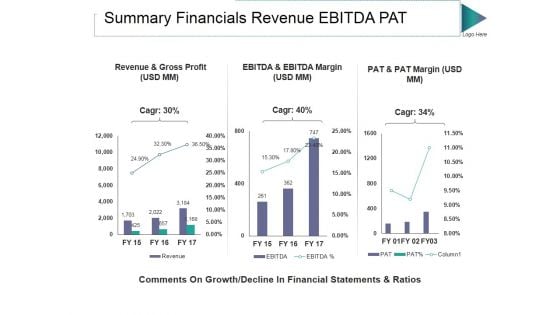
Summary Financials Revenue Ebitda Pat Ppt PowerPoint Presentation Visuals
This is a summary financials revenue ebitda pat ppt powerpoint presentation visuals. This is a three stage process. The stages in this process are revenue and gross profit, pat and pat margin, ebitda and ebitda margin.
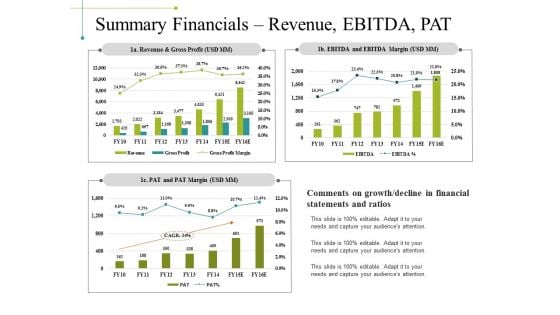
Summary Financials Revenue Ebitda Pat Ppt PowerPoint Presentation Inspiration Templates
This is a summary financials revenue ebitda pat ppt powerpoint presentation inspiration templates. This is a three stage process. The stages in this process are revenue and gross profit, pat and pat margin, ebitda and ebitda margin, business, marketing.
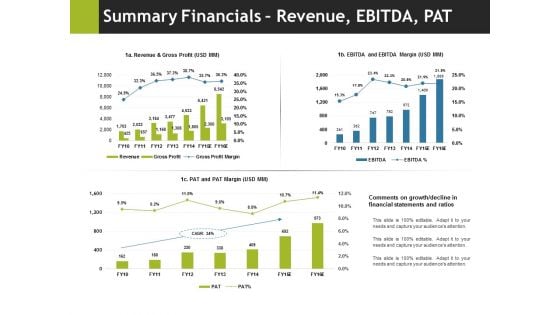
Summary Financials Revenue Ebitda Pat Ppt PowerPoint Presentation Pictures Outline
This is a summary financials revenue ebitda pat ppt powerpoint presentation pictures outline. This is a three stage process. The stages in this process are business, marketing, pat and pat margin, ebitda and ebitda margin, revenue and gross profit.
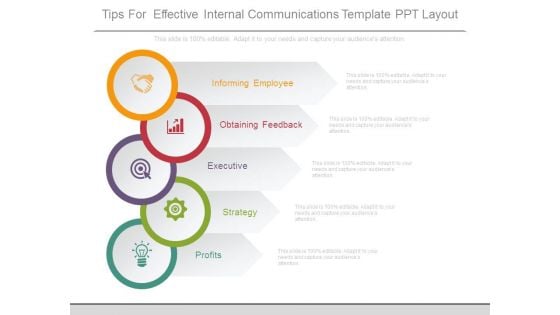
Tips For Effective Internal Communications Template Ppt Layout
This is a tips for effective internal communications template ppt layout. This is a five stage process. The stages in this process are informing employee, obtaining feedback, executive, strategy, profits.
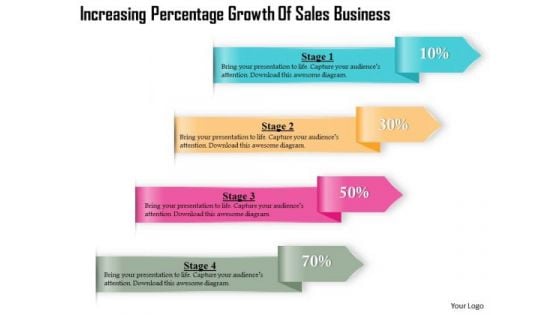
Consulting Slides Increasing Percentage Growth Of Sales Business Presentation
This diagram is designed with graphics of text boxes showing percentage growth. Use this diagram in presentations to display growth in sales or profit. This diagram is editable and can be easily adjusted.
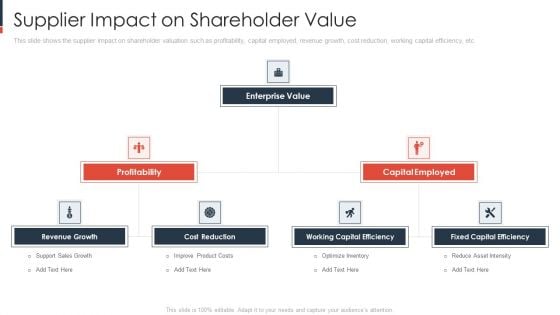
Supplier Impact On Shareholder Value Elements PDF
This slide shows the supplier impact on shareholder valuation such as profitability, capital employed, revenue growth, cost reduction, working capital efficiency, etc.Presenting supplier impact on shareholder value elements pdf to provide visual cues and insights. Share and navigate important information on two stages that need your due attention. This template can be used to pitch topics like revenue growth, profitability, capital employed. In addtion, this PPT design contains high resolution images, graphics, etc, that are easily editable and available for immediate download.
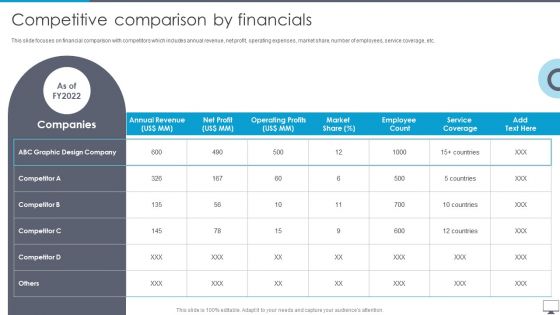
Graphic Designing And Visual Arts Company Profile Competitive Comparison By Financials Themes PDF
This slide focuses on financial comparison with competitors which includes annual revenue, net profit, operating expenses, market share, number of employees, service coverage, etc. Deliver an awe inspiring pitch with this creative Graphic Designing And Visual Arts Company Profile Competitive Comparison By Financials Themes PDF bundle. Topics like Annual Revenue, Operating Profits, Service Coverage can be discussed with this completely editable template. It is available for immediate download depending on the needs and requirements of the user.
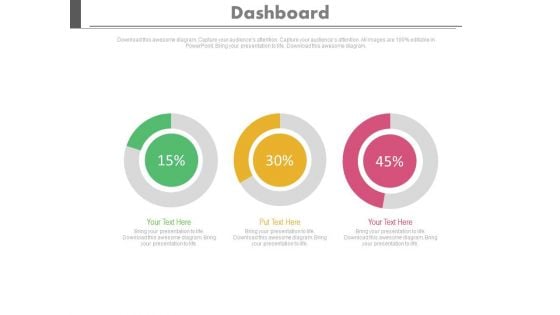
Three Dashboard With Percentage Value Growth Powerpoint Slides
This PowerPoint template has been designed with three dashboards. Use this PPT slide to depict rise in business profit. This professional diagram slide will help you express your views to target audience.
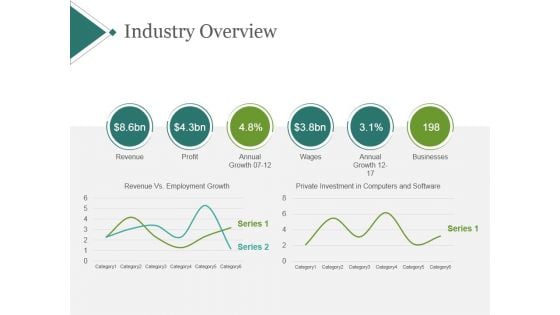
Industry Overview Template 1 Ppt PowerPoint Presentation Deck
This is a industry overview template 1 ppt powerpoint presentation deck. This is a six stage process. The stages in this process are revenue, profit, annual growth, wages, annual growth, businesses.

Current State Analysis Financial Comparison Ppt Powerpoint Presentation File Graphic Tips
This is a current state analysis financial comparison ppt powerpoint presentation file graphic tips. This is a five stage process. The stages in this process are revenue, profits, cash balance.
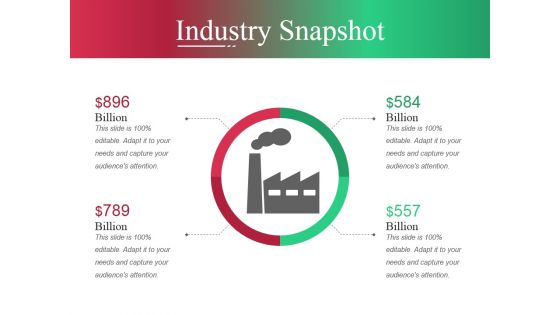
Industry Snapshot Template Ppt PowerPoint Presentation Slides Shapes
This is a industry snapshot template ppt powerpoint presentation slides shapes. This is a two stage process. The stages in this process are revenue, profit, annual growth, wages, annual growth, business.
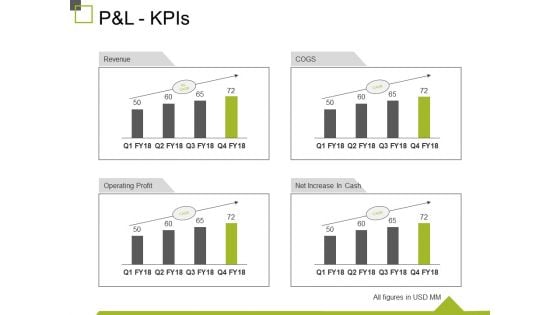
P And L Kpis Ppt PowerPoint Presentation Show Design Inspiration
This is a p and l kpis ppt powerpoint presentation show design inspiration. This is a four stage process. The stages in this process are revenue, operating profit, cogs, net increase in cash, business.
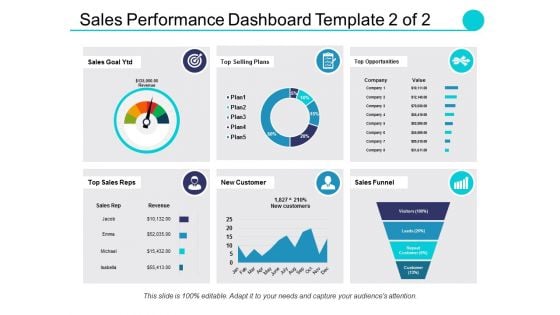
Sales Performance Dashboard Template Ppt PowerPoint Presentation Professional Elements
This is a sales performance dashboard template ppt powerpoint presentation professional elements. This is a eight stage process. The stages in this process are sales comparison, sales by product category, sales by month, brand profitability, revenue.

Weekly Sales Performance KPI Dashboard For Revenue Generation Brochure PDF
The following slide exhibits dashboard to maintain revenue and management under control. It presents information related to profits, cross selling, costs, etc. Pitch your topic with ease and precision using this Weekly Sales Performance KPI Dashboard For Revenue Generation Brochure PDF. This layout presents information on Total Sales, Revenue, Profit, Cost. It is also available for immediate download and adjustment. So, changes can be made in the color, design, graphics or any other component to create a unique layout.
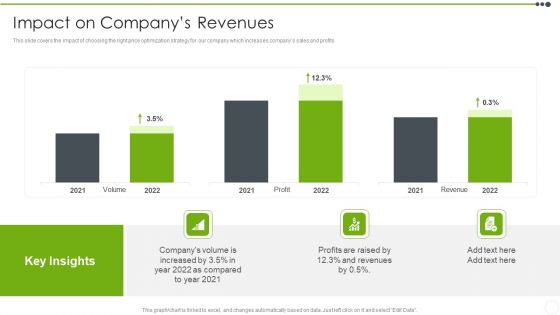
Estimating The Price Impact On Companys Revenues Infographics PDF
This slide covers the impact of choosing the right price optimization strategy for our company which increases companys sales and profits. Deliver an awe inspiring pitch with this creative Estimating The Price Impact On Companys Revenues Infographics PDF bundle. Topics like Profits, Revenues can be discussed with this completely editable template. It is available for immediate download depending on the needs and requirements of the user.

Monthly Financial Metrics Dashboard With Revenue And Expenditure Rules PDF
This slide showcases KPI dashboard for monitoring financial health of business to ensure smooth flow of business operations. It includes details such as COGS, net profit, cost breakdown, etc. Showcasing this set of slides titled Monthly Financial Metrics Dashboard With Revenue And Expenditure Rules PDF. The topics addressed in these templates are Net Profit, Costs, Expenditure. All the content presented in this PPT design is completely editable. Download it and make adjustments in color, background, font etc. as per your unique business setting.

Increase In Prizes Real Estate PowerPoint Templates And PowerPoint Themes 0912
Increase In Prizes Real Estate PowerPoint Templates And PowerPoint Themes Presentations-Microsoft Powerpoint Templates and Background with coins showing increasing profits-Increase In Prizes Real Estate PowerPoint Templates And PowerPoint Themes PresentationsThis PPT can be used for presentations relating to-Coins showing increasing profits, real estate, money, finance, business, marketing Many factors can create a distraction. Our Increase In Prizes Real Estate PowerPoint Templates And PowerPoint Themes 0912 will not let them fall for it.
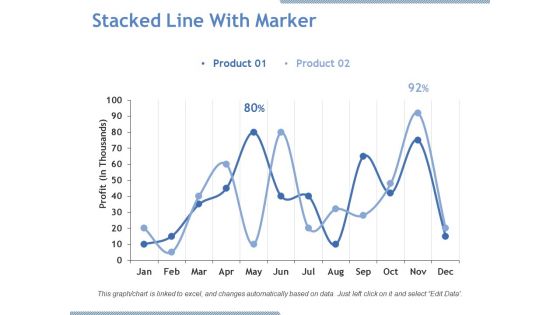
Stacked Line With Marker Ppt PowerPoint Presentation Pictures Graphics Download
This is a stacked line with marker ppt powerpoint presentation pictures graphics download. This is a two stage process. The stages in this process are product, profit, line chart, business, growth.

Competitive Sales Strategy Development Plan For Revenue Growth Metrics To Measure Sales Sample PDF
This slide focuses on metrics to measure sales team performance that covers total sales, revenue, profit, cost, incremental sales, accumulated revenue, cost breakdown, etc. Deliver and pitch your topic in the best possible manner with this Competitive Sales Strategy Development Plan For Revenue Growth Metrics To Measure Sales Sample PDF. Use them to share invaluable insights on Sales Revenue, Profit, Cost and impress your audience. This template can be altered and modified as per your expectations. So, grab it now.
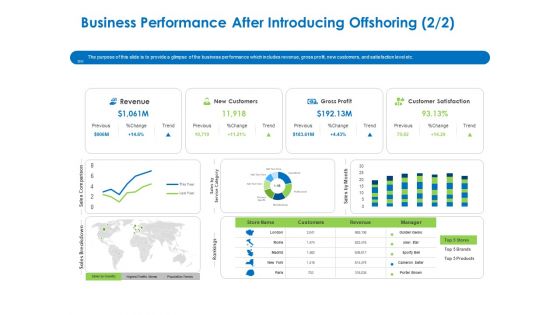
Relocation Of Business Process Offshoring Business Performance After Introducing Offshoring Revenue Download PDF
The purpose of this slide is to provide a glimpse of the business performance which includes revenue, gross profit, new customers, and satisfaction level etc. Deliver an awe-inspiring pitch with this creative relocation of business process offshoring business performance after introducing offshoring revenue download pdf bundle. Topics like revenue, new customers, gross profit, customer satisfaction can be discussed with this completely editable template. It is available for immediate download depending on the needs and requirements of the user.
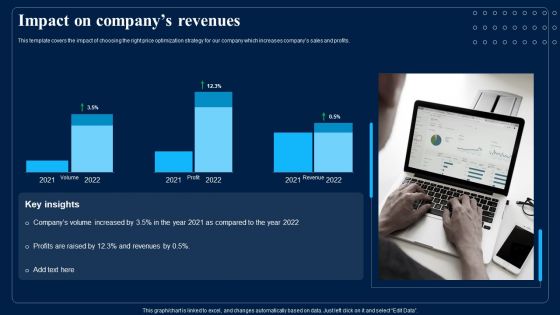
Identifying Optimum Pricing Methods For Business Impact On Companys Revenues Introduction PDF
This template covers the impact of choosing the right price optimization strategy for our company which increases companys sales and profits. Deliver an awe inspiring pitch with this creative Identifying Optimum Pricing Methods For Business Impact On Companys Revenues Introduction PDF bundle. Topics like Profits, Revenues can be discussed with this completely editable template. It is available for immediate download depending on the needs and requirements of the user.
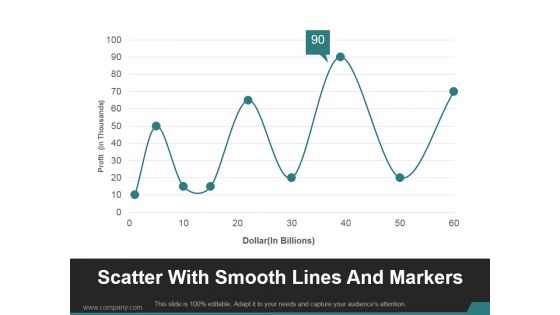
Scatter With Smooth Lines And Markers Ppt PowerPoint Presentation Show
This is a scatter with smooth lines and markers ppt powerpoint presentation show. This is a nine stage process. The stages in this process are business, marketing, line chart, profit, management.
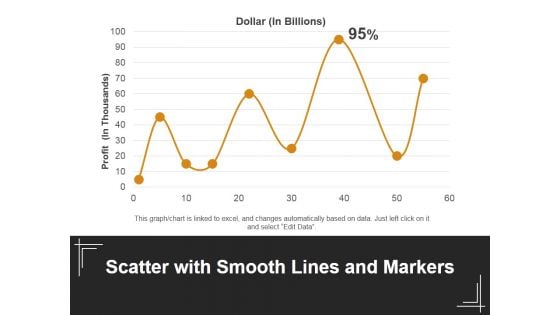
Scatter With Smooth Lines And Markers Ppt PowerPoint Presentation Outline Design Ideas
This is a scatter with smooth lines and markers ppt powerpoint presentation outline design ideas. This is a one stage process. The stages in this process are dollar, profit, line chart, business, marketing.
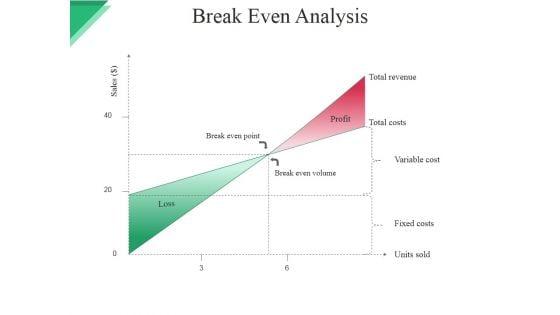
Break Even Analysis Ppt PowerPoint Presentation Styles Samples
This is a break even analysis ppt powerpoint presentation styles samples. This is a two stage process. The stages in this process are break even point, break even volume, profit, total revenue, total costs, variable cost.
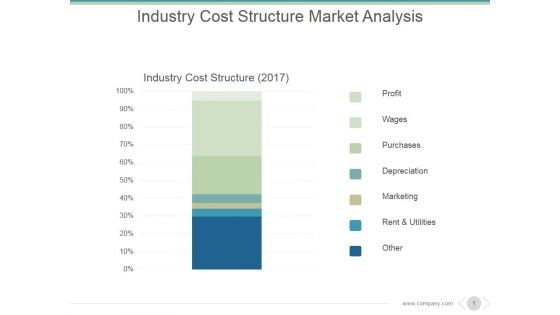
Industry Cost Structure Market Analysis Ppt PowerPoint Presentation Deck
This is a industry cost structure market analysis ppt powerpoint presentation deck. This is a seven stage process. The stages in this process are profit, wages, purchases, depreciation, marketing, rent and utilities.

Financial Projection Graph Template 1 Ppt PowerPoint Presentation Guide
This is a financial projection graph template 1 ppt powerpoint presentation guide. This is a three stage process. The stages in this process are annual sales, gross margin, net profit.
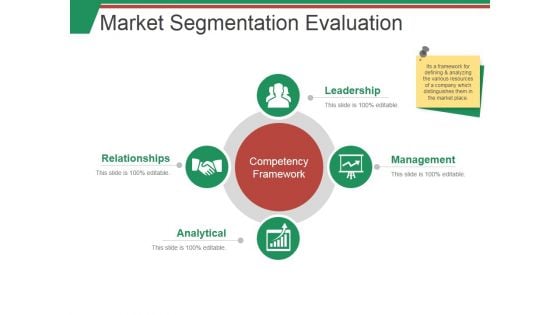
Market Segmentation Evaluation Template 1 Ppt PowerPoint Presentation Summary Smartart
This is a market segmentation evaluation template 1 ppt powerpoint presentation summary smartart. This is a two stage process. The stages in this process are market sales, net profit, beverages, milk product, nutrition.
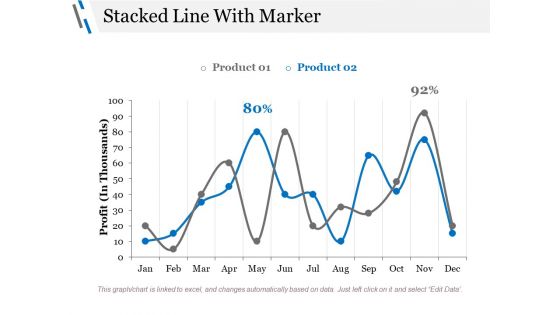
Stacked Line With Marker Ppt PowerPoint Presentation Styles Graphics Design
This is a stacked line with marker ppt powerpoint presentation styles graphics design. This is a three stage process. The stages in this process are profit, business, marketing, finance, percentage.
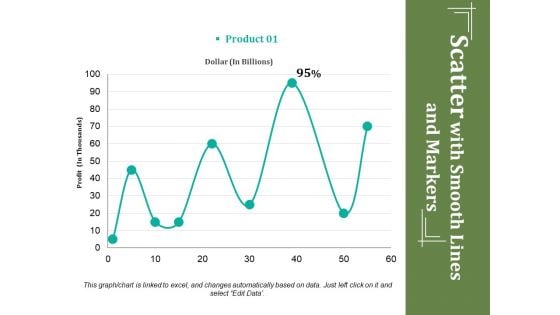
Scatter With Smooth Lines And Markers Ppt PowerPoint Presentation Ideas Deck
This is a scatter with smooth lines and markers ppt powerpoint presentation ideas deck. This is a one stage process. The stages in this process are profit, dollar, percentage, business, growth.
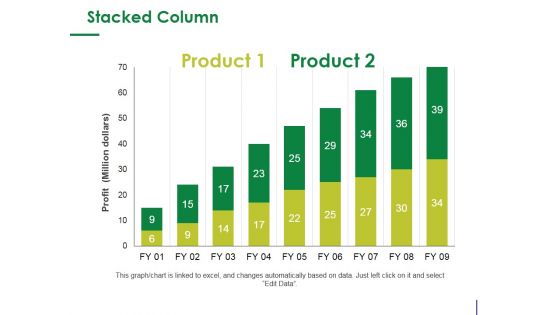
Stacked Column Ppt PowerPoint Presentation Infographic Template Design Ideas
This is a stacked column ppt powerpoint presentation infographic template design ideas. This is a two stage process. The stages in this process are product, profit, bar graph, growth, success.
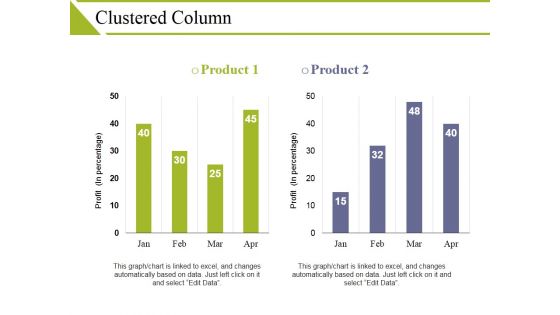
Clustered Column Ppt PowerPoint Presentation Visual Aids Show
This is a clustered column ppt powerpoint presentation visual aids show. This is a two stage process. The stages in this process are product, profit, business, bar graph, finance.
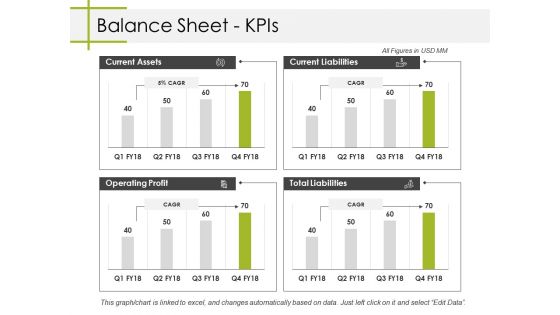
Balance Sheet Kpis Ppt PowerPoint Presentation Summary Designs Download
This is a balance sheet kpis ppt powerpoint presentation summary designs download. This is a four stage process. The stages in this process are current assets, current liabilities, total liabilities, operating profit, business.
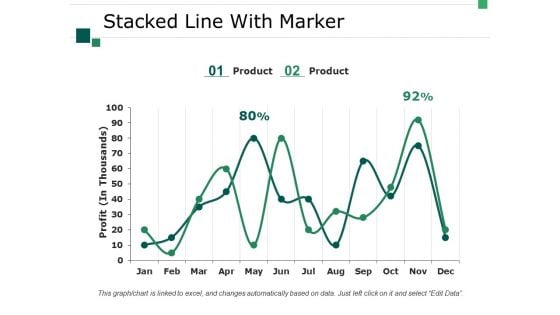
Stacked Line With Marker Ppt PowerPoint Presentation Professional Designs Download
This is a stacked line with marker ppt powerpoint presentation professional designs download. This is a two stage process. The stages in this process are business, marketing, strategy, graph, profit.
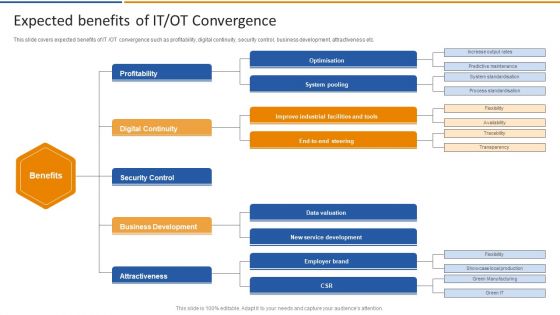
Smart Venture Digitial Transformation Expected Benefits Of IT OT Convergence Topics PDF
This slide covers expected benefits of IT or OT convergence such as profitability, digital continuity, security control, business development, attractiveness etc. This is a four template with various stages. Focus and dispense information on four stages using this creative set, that comes with editable features. It contains large content boxes to add your information on topics like Profitability, Digital Continuity, Security Control, Business Development. You can also showcase facts, figures, and other relevant content using this PPT layout. Grab it now.
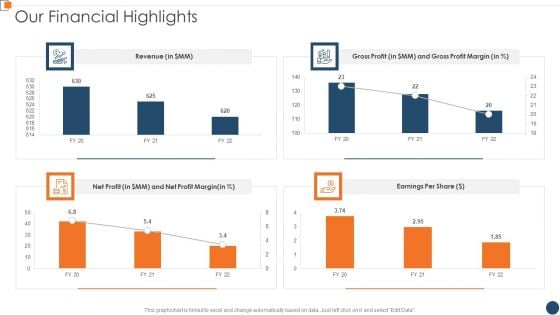
BANT Sales Lead Qualification Model Our Financial Highlights Background PDF
This graph or chart is linked to excel and change automatically based on data. Just left click on it and select Edit Data. Deliver an awe inspiring pitch with this creative BANT Sales Lead Qualification Model Our Financial Highlights Background PDF bundle. Topics like Gross Profit, Net Profit, Earnings Per can be discussed with this completely editable template. It is available for immediate download depending on the needs and requirements of the user.
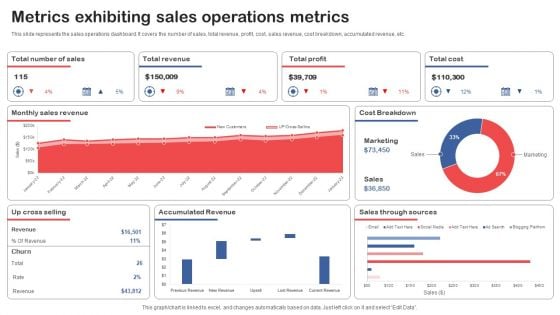
Metrics Exhibiting Sales Operations Metrics Topics PDF
This slide represents the sales operations dashboard. It covers the number of sales, total revenue, profit, cost, sales revenue, cost breakdown, accumulated revenue, etc. Showcasing this set of slides titled Metrics Exhibiting Sales Operations Metrics Topics PDF. The topics addressed in these templates are Total Revenue, Total Profit, Total Cost. All the content presented in this PPT design is completely editable. Download it and make adjustments in color, background, font etc. as per your unique business setting.
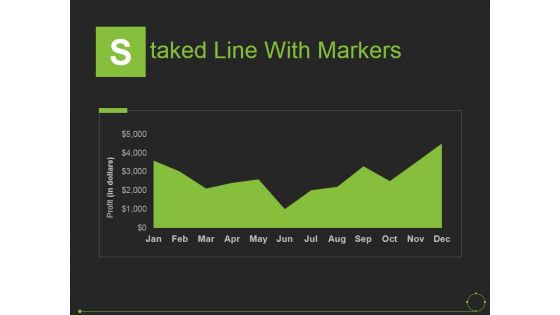
Staked Line With Markers Ppt PowerPoint Presentation Pictures Examples
This is a staked line with markers ppt powerpoint presentation pictures examples. This is a one stage process. The stages in this process are years, profit, product, business, marketing.
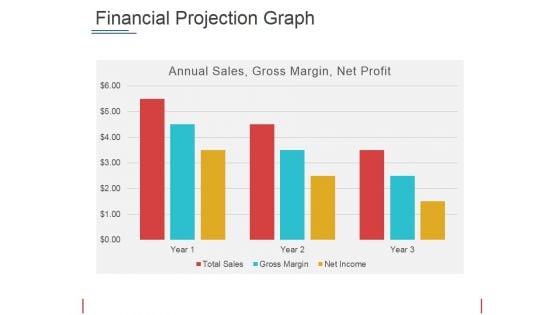
Financial Projection Graph Template 2 Ppt PowerPoint Presentation Show Picture
This is a financial projection graph template 2 ppt powerpoint presentation show picture. This is a three stage process. The stages in this process are annual sales, gross margin, net profit, years.
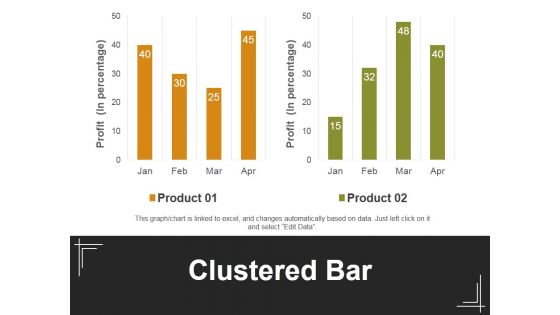
Clustered Bar Ppt PowerPoint Presentation Summary Design Inspiration
This is a clustered bar ppt powerpoint presentation summary design inspiration. This is a two stage process. The stages in this process are product, clustered bar, profit, business, marketing.
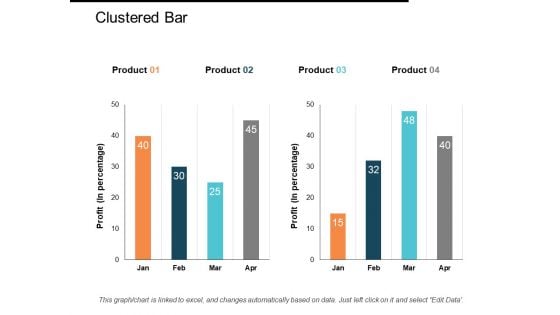
Clustered Bar Ppt PowerPoint Presentation Gallery Inspiration
This is a clustered bar ppt powerpoint presentation gallery inspiration. This is a four stage process. The stages in this process are clustered bar, product, profit, business, bar graph.
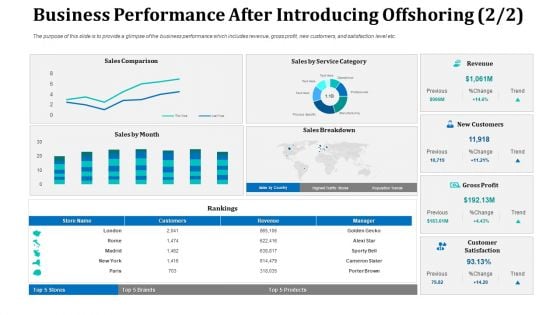
Business Performance After Introducing Offshoring Sales Background PDF
The purpose of this slide is to provide a glimpse of the business performance which includes revenue, gross profit, new customers, and satisfaction level etc. Deliver and pitch your topic in the best possible manner with this business performance after introducing offshoring sales background pdf. Use them to share invaluable insights on sales, gross profit, customers, revenue and impress your audience. This template can be altered and modified as per your expectations. So, grab it now.
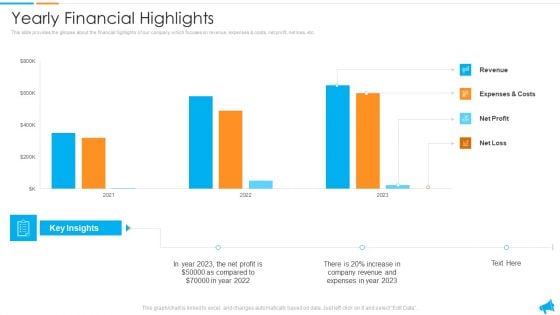
Strategy For Regional Economic Progress Outlining Yearly Financial Highlights Professional PDF
This slide provides the glimpse about the financial highlights of our company which focuses on revenue, expenses and costs, net profit, net loss, etc. Deliver an awe inspiring pitch with this creative strategy for regional economic progress outlining yearly financial highlights professional pdf bundle. Topics like revenue, expenses, net profit, costs can be discussed with this completely editable template. It is available for immediate download depending on the needs and requirements of the user.
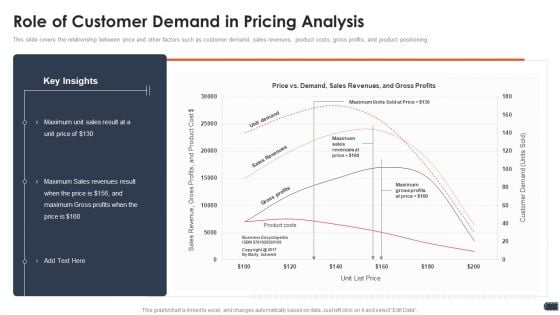
Business Pricing Model Role Of Customer Demand In Pricing Analysis Professional PDF
This slide covers the relationship between price and other factors such as customer demand, sales revenues, product costs, gross profits, and product positioning. Deliver and pitch your topic in the best possible manner with this business pricing model role of customer demand in pricing analysis professional pdf. Use them to share invaluable insights on customer demand, sales revenues, product costs, gross profits, product positioning and impress your audience. This template can be altered and modified as per your expectations. So, grab it now.
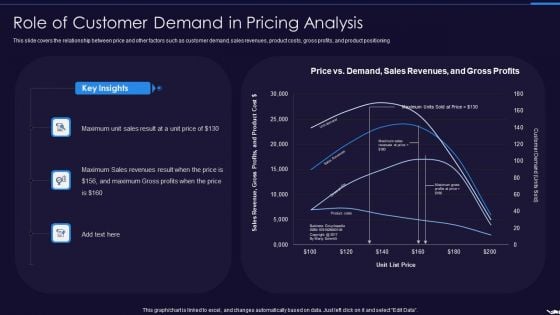
Optimize Marketing Pricing Role Of Customer Demand In Pricing Analysis Infographics PDF
This slide covers the relationship between price and other factors such as customer demand, sales revenues, product costs, gross profits, and product positioning. Deliver and pitch your topic in the best possible manner with this optimize marketing pricing role of customer demand in pricing analysis infographics pdf. Use them to share invaluable insights on gross profits, sales, revenues and impress your audience. This template can be altered and modified as per your expectations. So, grab it now.
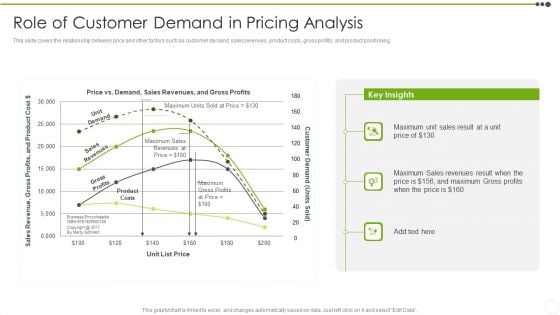
Estimating The Price Role Of Customer Demand In Pricing Analysis Download PDF
This slide covers the relationship between price and other factors such as customer demand, sales revenues, product costs, gross profits, and product positioning. Deliver an awe inspiring pitch with this creative Estimating The Price Role Of Customer Demand In Pricing Analysis Download PDF bundle. Topics like Sales, Revenues, Profits, Price can be discussed with this completely editable template. It is available for immediate download depending on the needs and requirements of the user.
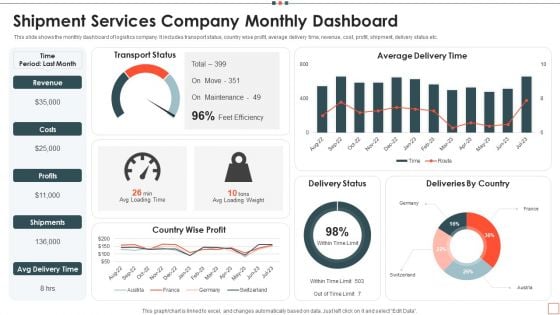
Shipment Services Company Monthly Dashboard Designs PDF
This slide shows the monthly dashboard of logistics company. It includes transport status, country wise profit, average delivery time, revenue, cost, profit, shipment, delivery status etc. Showcasing this set of slides titled Shipment Services Company Monthly Dashboard Designs PDF. The topics addressed in these templates are Costs, Revenue, Maintenance. All the content presented in this PPT design is completely editable. Download it and make adjustments in color, background, font etc. as per your unique business setting.
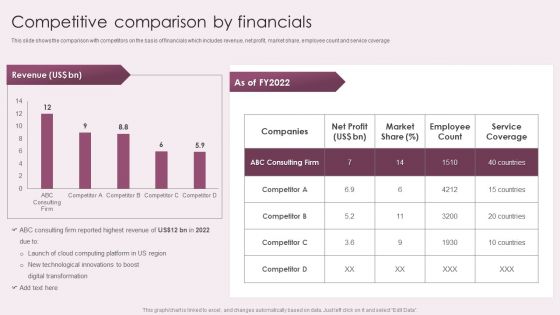
Business Advisory Solutions Company Profile Competitive Comparison By Financials Rules PDF
This slide shows the comparison with competitors on the basis of financials which includes revenue, net profit, market share, employee count and service coverage. Deliver an awe inspiring pitch with this creative Business Advisory Solutions Company Profile Competitive Comparison By Financials Rules PDF bundle. Topics like Highest Revenue, Net Profit, Market Share can be discussed with this completely editable template. It is available for immediate download depending on the needs and requirements of the user.
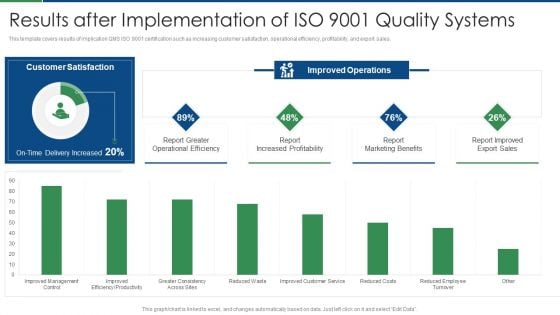
International Standard For Quality Management System Results After Implementation Of ISO 9001 Brochure PDF
This template covers results of implication QMS ISO 9001 certification such as increasing customer satisfaction, operational efficiency, profitability, and export sales. Deliver and pitch your topic in the best possible manner with this international standard for quality management system results after implementation of iso 9001 brochure pdf. Use them to share invaluable insights on operational efficiency, increased profitability, marketing benefits, sales and impress your audience. This template can be altered and modified as per your expectations. So, grab it now.
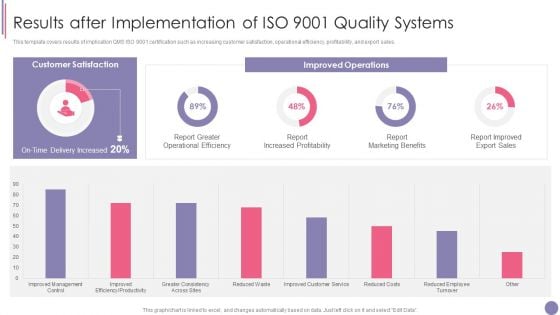
ISO 9001 Quality Assurance Software Accreditation Results After Implementation Of ISO 9001 Quality Systems Summary PDF
This template covers results of implication QMS ISO 9001 certification such as increasing customer satisfaction, operational efficiency, profitability, and export sales. Deliver and pitch your topic in the best possible manner with this ISO 9001 Quality Assurance Software Accreditation Results After Implementation Of ISO 9001 Quality Systems Summary PDF. Use them to share invaluable insights on Report Increased Profitability, Report Marketing Benefits, Quality Systems and impress your audience. This template can be altered and modified as per your expectations. So, grab it now.

ISO 9001 Standard For Quality Control Results After Implementation Of ISO 9001 Quality Systems Demonstration PDF
This template covers results of implication QMS ISO 9001 certification such as increasing customer satisfaction, operational efficiency, profitability, and export sales. Deliver an awe inspiring pitch with this creative ISO 9001 Standard For Quality Control Results After Implementation Of ISO 9001 Quality Systems Demonstration PDF bundle. Topics like Report Marketing Benefits, Report Increased Profitability, Report Improved Export Sales can be discussed with this completely editable template. It is available for immediate download depending on the needs and requirements of the user.
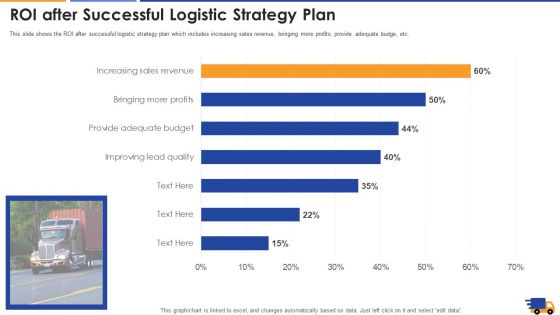
ROI After Successful Logistic Strategy Plan Brochure PDF
This slide shows the ROI after successful logistic strategy plan which includes increasing sales revenue, bringing more profits, provide adequate budge, etc. Deliver an awe inspiring pitch with this creative roi after successful logistic strategy plan brochure pdf bundle. Topics like quality, strategy plan, profit, budget can be discussed with this completely editable template. It is available for immediate download depending on the needs and requirements of the user.
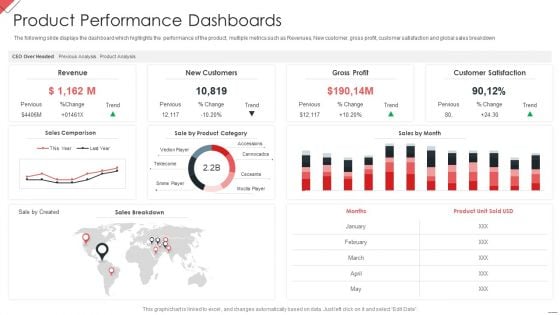
New Commodity Market Viability Review Product Performance Dashboards Guidelines PDF
The following slide displays the dashboard which highlights the performance of the product, multiple metrics such as Revenues, New customer, gross profit, customer satisfaction and global sales breakdown Deliver and pitch your topic in the best possible manner with this New Commodity Market Viability Review Product Performance Dashboards Guidelines PDF Use them to share invaluable insights on Gross Profit, Customer Satisfaction, Product Category and impress your audience. This template can be altered and modified as per your expectations. So, grab it now.
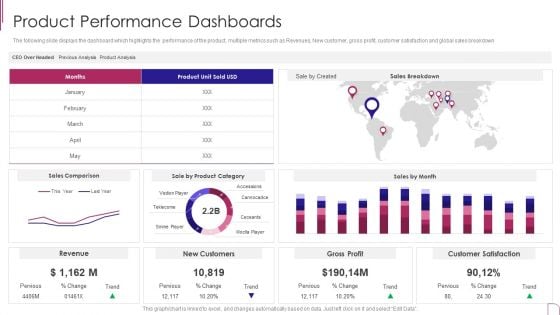
Yearly Product Performance Assessment Repor Product Performance Dashboards Designs PDF
The following slide displays the dashboard which highlights the performance of the product, multiple metrics such as Revenues, New customer, gross profit, customer satisfaction and global sales breakdown.Deliver and pitch your topic in the best possible manner with this Yearly Product Performance Assessment Repor Product Performance Dashboards Designs PDF Use them to share invaluable insights on Gross Profit, Customer Satisfaction, Sales Comparison and impress your audience. This template can be altered and modified as per your expectations. So, grab it now.
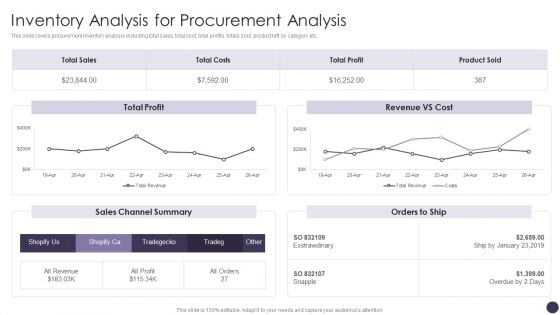
Inventory Analysis For Procurement Analysis Clipart PDF
This slide covers procurement inventory analysis including total sales, total cost, total profits, totals sold, product left by category etc. Deliver an awe inspiring pitch with this creative Inventory Analysis For Procurement Analysis Clipart PDF bundle. Topics like Total Profit, Revenue VS Cost, Channel Summary can be discussed with this completely editable template. It is available for immediate download depending on the needs and requirements of the user.
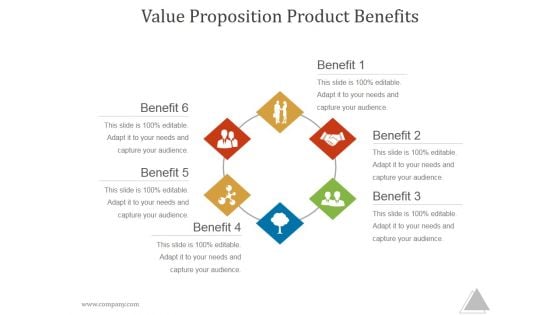
Value Proposition Product Benefits Slide2 Ppt PowerPoint Presentation Ideas
This is a value proposition product benefits slide2 ppt powerpoint presentation ideas. This is a four stage process. The stages in this process are product benefit, icons, strategy, management.
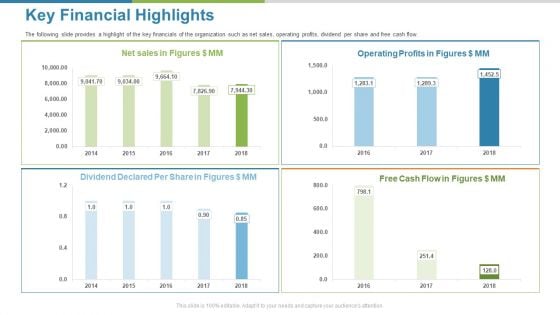
Work Execution Liability Key Financial Highlights Ppt Ideas Template PDF
The following slide provides a highlight of the key financials of the organization such as net sales, operating profits, dividend per share and free cash flow. Deliver and pitch your topic in the best possible manner with this work execution liability key financial highlights ppt ideas template pdf. Use them to share invaluable insights on operating profits, sales, cash flow, dividend declared and impress your audience. This template can be altered and modified as per your expectations. So, grab it now.
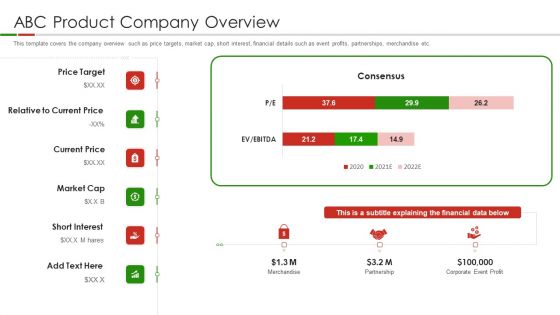
Organic Food Pitch Deck ABC Product Company Overview Ppt Infographics Styles PDF
This template covers the company overview such as price targets, market cap, short interest, financial details such as event profits, partnerships, merchandise etc. Deliver an awe inspiring pitch with this creative organic food pitch deck abc product company overview ppt infographics styles pdf bundle. Topics like merchandise, partnership, corporate event profit, financial data, price target can be discussed with this completely editable template. It is available for immediate download depending on the needs and requirements of the user.
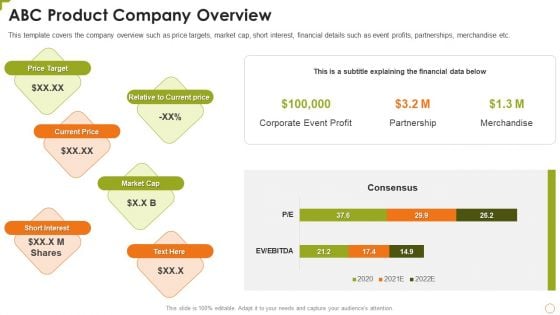
Food Product Pitch Deck ABC Product Company Overview Rules PDF
This template covers the company overview such as price targets, market cap, short interest, financial details such as event profits, partnerships, merchandise etc. Deliver and pitch your topic in the best possible manner with this food product pitch deck abc product company overview rules pdf. Use them to share invaluable insights on corporate, profit, partnership and impress your audience. This template can be altered and modified as per your expectations. So, grab it now.
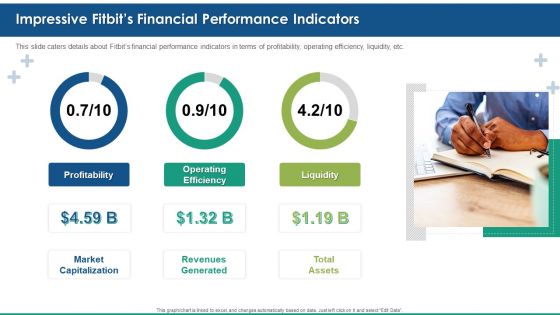
Fitbit Venture Capital Investment Elevator Impressive Fitbits Financial Performance Indicators Structure PDF
This slide caters details about Fitbits financial performance indicators in terms of profitability, operating efficiency, liquidity, etc. Deliver and pitch your topic in the best possible manner with this fitbit venture capital investment elevator impressive fitbits financial performance indicators structure pdf. Use them to share invaluable insights on profitability, operating efficiency, liquidity and impress your audience. This template can be altered and modified as per your expectations. So, grab it now.
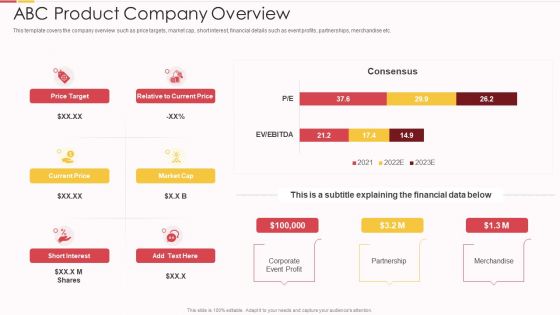
Packed Food Investor Funding Abc Product Company Overview Ppt Infographics Vector PDF
This template covers the company overview such as price targets, market cap, short interest, financial details such as event profits, partnerships, merchandise etc. Deliver an awe inspiring pitch with this creative packed food investor funding abc product company overview ppt infographics vector pdf bundle. Topics like financial, event profit, interest, price can be discussed with this completely editable template. It is available for immediate download depending on the needs and requirements of the user.
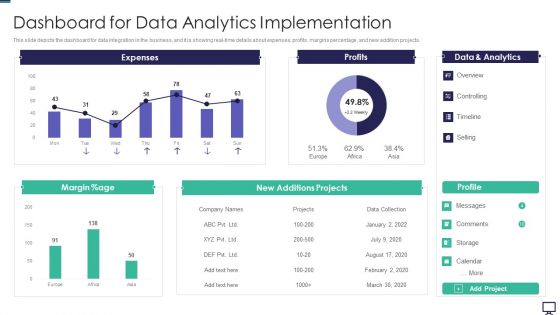
Dashboard For Data Analytics Implementation Ppt Model Files PDF
This slide depicts the dashboard for data integration in the business, and it is showing real time details about expenses, profits, margins percentage, and new addition projects. Deliver and pitch your topic in the best possible manner with this dashboard for data analytics implementation ppt model files pdf. Use them to share invaluable insights on expenses, profits, analytics, data and impress your audience. This template can be altered and modified as per your expectations. So, grab it now.
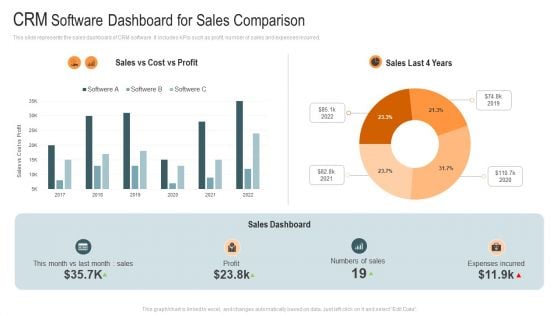
CRM Software Dashboard For Sales Comparison Mockup PDF
This slide represents the sales dashboard of CRM software. It includes KPIs such as profit, number of sales and expenses incurred. Pitch your topic with ease and precision using this CRM Software Dashboard For Sales Comparison Mockup PDF. This layout presents information on Profit, Sales Dashboard, Expenses Incurred. It is also available for immediate download and adjustment. So, changes can be made in the color, design, graphics or any other component to create a unique layout.
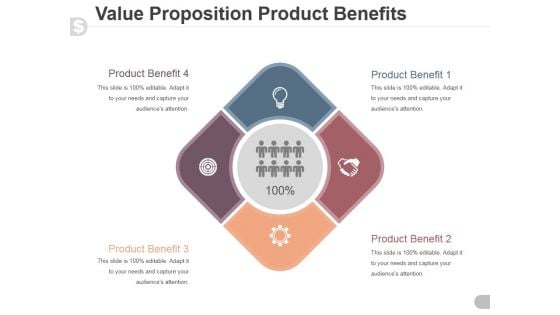
Value Proposition Product Benefits Template 1 Ppt PowerPoint Presentation Slide
This is a value proposition product benefits template 1 ppt powerpoint presentation slide. This is a four stage process. The stages in this process are business, marketing, product, icon, innovation.
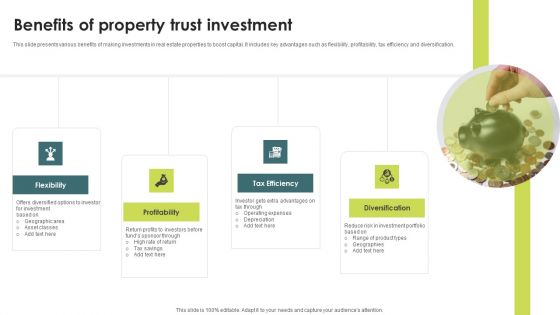
Benefits Of Property Trust Investment Introduction PDF
This slide presents various benefits of making investments in real estate properties to boost capital. It includes key advantages such as flexibility, profitability, tax efficiency and diversification.Presenting Benefits Of Property Trust Investment Introduction PDF to dispense important information. This template comprises four stages. It also presents valuable insights into the topics including Flexibility, Profitability, Tax Efficiency. This is a completely customizable PowerPoint theme that can be put to use immediately. So, download it and address the topic impactfully.
Power Point Arrow Presentation Activities PowerPoint Templates Backgrounds For Slides
3d, achievement, aim, arrows, business, career, chart, development, direction, diversity, education, financial, forecast, forward, glossy, graph, group, growth, higher, icon, increase, internet, investment, leader, leadership, moving, onwards, outlook, path, plan, prediction, price, profit, progress, property, race, sales, series, success, target, team, teamwork, turn, upwards, vector, win, winner Carry it off elegantly with our Power Point Arrow Presentation Activities PowerPoint Templates Backgrounds For Slides. Get your thoughts into fashion.
PowerPoint Arrows Parallel Executing Sequential Program Slides
abstract, achievement, aim, arrow, blue, business, button, career, chart, color, communication, competition, concept, development, direction, education, financial, forecast, forward, glossy, gradient, graph, group, growth, higher, icon, illustration, increase, investment, leader, leadership, moving, onwards, outlook, path, plan, prediction, price, profit, progress, property, sales, series, success, target, team, teamwork, upwards, vector, yellow Never fail to impress with our PowerPoint Arrows Parallel Executing Sequential Program Slides. You will be at the top of your game.
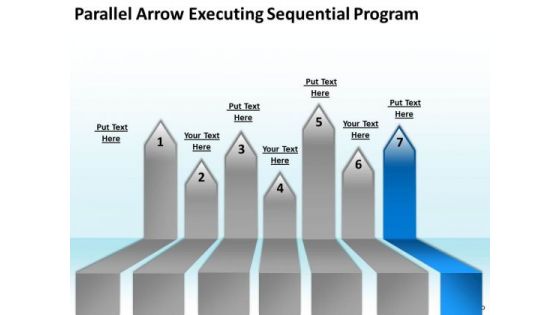
PowerPoint Circular Arrows Parallel Executing Sequential Program Slides
abstract, achievement, aim, arrow, blue, business, button, career, chart, color, communication, competition, concept, development, direction, education, financial, forecast, forward, glossy, gradient, graph, group, growth, higher, icon, illustration, increase, investment, leader, leadership, moving, onwards, outlook, path, plan, prediction, price, profit, progress, property, sales, series, success, target, team, teamwork, upwards, vector, yellow Win easily with our PowerPoint Circular Arrows Parallel Executing Sequential Program Slides. Download without worries with our money back guaranteee.
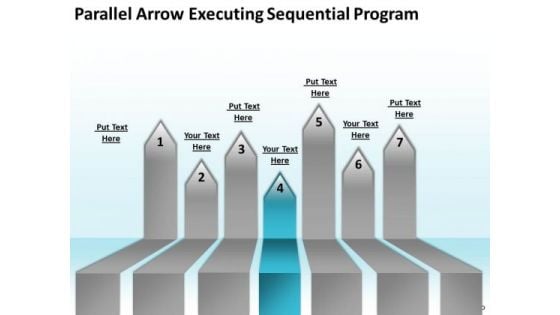
PowerPoint Arrows Parallel Executing Sequential Program Templates
abstract, achievement, aim, arrow, blue, business, button, career, chart, color, communication, competition, concept, development, direction, education, financial, forecast, forward, glossy, gradient, graph, group, growth, higher, icon, illustration, increase, investment, leader, leadership, moving, onwards, outlook, path, plan, prediction, price, profit, progress, property, sales, series, success, target, team, teamwork, upwards, vector, yellow Our PowerPoint Arrows Parallel Executing Sequential Program Templates are like a deep breath. They ensure your ideas endure.
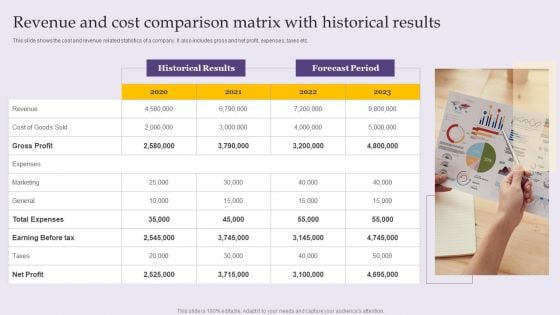
Revenue And Cost Comparison Matrix With Historical Results Sample PDF
This slide shows the cost and revenue related statistics of a company. It also includes gross and net profit, expenses, taxes etc. Presenting Revenue And Cost Comparison Matrix With Historical Results Sample PDF to dispense important information. This template comprises one stage. It also presents valuable insights into the topics including Expenses, Total Expenses, Gross Profit. This is a completely customizable PowerPoint theme that can be put to use immediately. So, download it and address the topic impactfully.
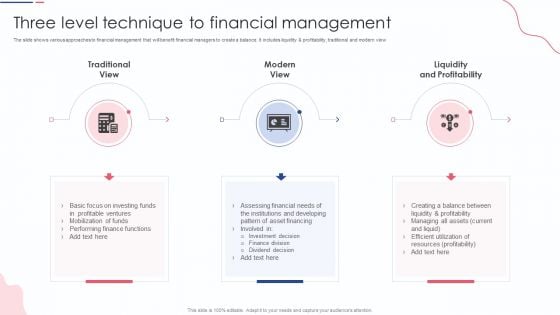
Three Level Technique To Financial Management Guidelines PDF
The slide shows various approaches to financial management that will benefit financial managers to create a balance. It includes liquidity and profitability, traditional and modern view. Presenting Three Level Technique To Financial Management Guidelines PDF to dispense important information. This template comprises three stages. It also presents valuable insights into the topics including Traditional View, Modern View, Liquidity And Profitability. This is a completely customizable PowerPoint theme that can be put to use immediately. So, download it and address the topic impactfully.
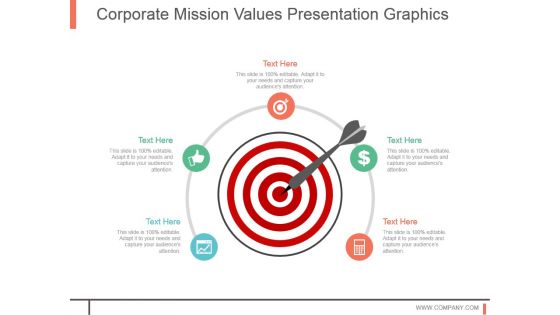
Corporate Mission Values Presentation Graphics
This is a corporate mission values presentation graphics. This is a five stage process. The stages in this process are icons, marketing, business, strategy, management, our goal.
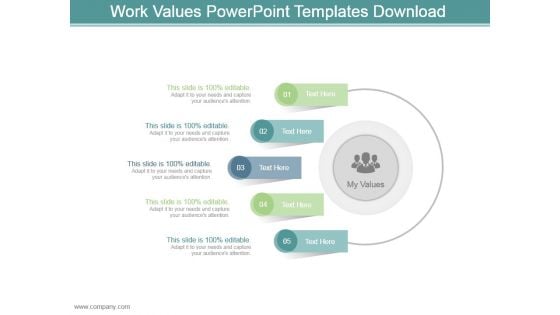
Work Values Powerpoint Templates Download
This is a work values powerpoint templates download. This is a five stage process. The stages in this process are semi circular, icon, business, marketing, success.
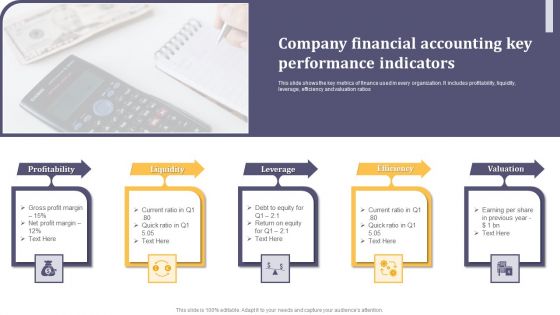
Company Financial Accounting Key Performance Indicators Ppt Slides PDF
This slide shows the key metrics of finance used in every organization. It includes profitability, liquidity, leverage, efficiency and valuation ratios. Presenting Company Financial Accounting Key Performance Indicators Ppt Slides PDF to dispense important information. This template comprises five stages. It also presents valuable insights into the topics including Profitability, Liquidity, Leverage. This is a completely customizable PowerPoint theme that can be put to use immediately. So, download it and address the topic impactfully.
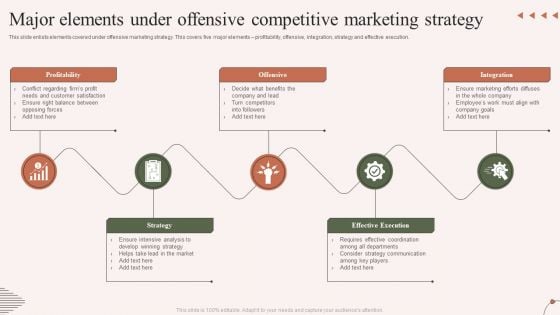
Major Elements Under Offensive Competitive Marketing Strategy Demonstration PDF
This slide enlists elements covered under offensive marketing strategy. This covers five major elements profitability, offensive, integration, strategy and effective execution. Presenting Major Elements Under Offensive Competitive Marketing Strategy Demonstration PDF to dispense important information. This template comprises five stages. It also presents valuable insights into the topics including Profitability, Strategy, Offensive. This is a completely customizable PowerPoint theme that can be put to use immediately. So, download it and address the topic impactfully.
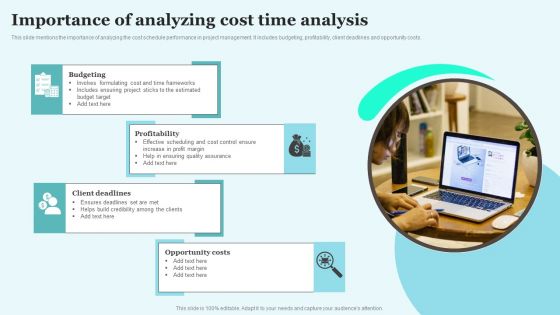
Importance Of Analyzing Cost Time Analysis Elements PDF
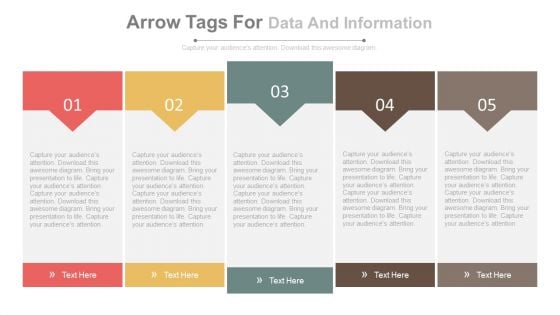
Five Sequential Text Boxes For Information Display Powerpoint Slides
This PowerPoint template has been creatively designed with the right amount of colors. The slide has a lot of space for text. The slide can be used to explain a 5 steps or changes occurring. While this slide can be used for graphically present a comparison between different variants of the same product, it can also be used to compare different products as well. The biggest advantage that you have with this slide is that you can explain the features or the differences in detail all thanks to the space available to add as much text as you want. Use this professionally made slide to demonstrate a sequence or a planned or proposed sequence to your audience. The slide is completely customizable and you can add colors, font and icons of your choice as per your needs and convenience. One of the tags has been highlighted and can be used to demonstrate the primary or the best package or the value for money product or service package.
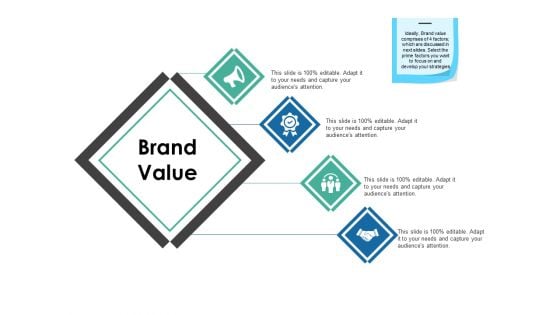
Brand Value Ppt PowerPoint Presentation Layouts Portfolio
This is a brand value ppt powerpoint presentation layouts portfolio. This is a four stage process. The stages in this process are value, business, marketing, strategy, icons.
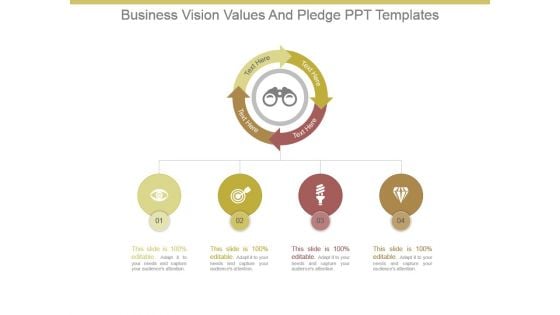
Business Vision Values And Pledge Ppt Templates
This is a business vision values and pledge ppt templates. This is a four stage process. The stages in this process are vision, management, icons, arrows, strategy.
Corporate Vision Values Powerpoint Slide Background Image
This is a corporate vision values powerpoint slide background image. This is a four stage process. The stages in this process are corporate, vision, icon, business, marketing.
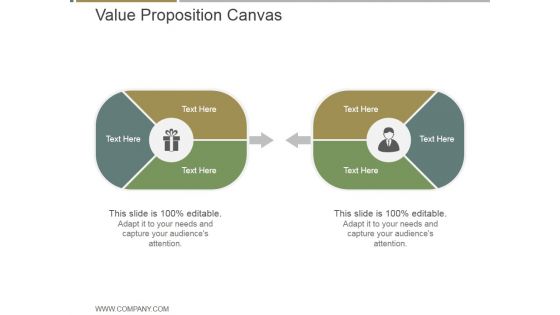
Value Proposition Canvas Ppt PowerPoint Presentation Rules
This is a value proposition canvas ppt powerpoint presentation rules. This is a two stage process. The stages in this process are business, marketing, success, steps, icons.
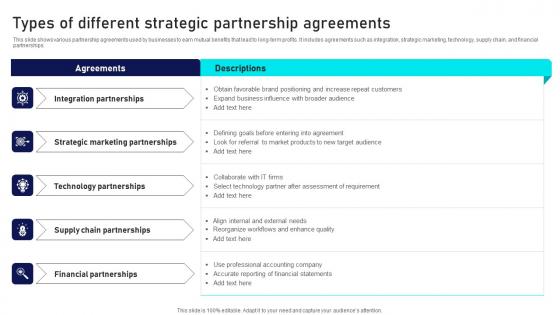
Types Of Different Strategic Partnership Agreements Themes Pdf
This slide shows various partnership agreements used by businesses to earn mutual benefits that lead to long-term profits. It includes agreements such as integration, strategic marketing, technology, supply chain, and financial partnerships. Pitch your topic with ease and precision using this Types Of Different Strategic Partnership Agreements Themes Pdf. This layout presents information on Integration Partnerships, Strategic Marketing Partnerships, Technology Partnerships. It is also available for immediate download and adjustment. So, changes can be made in the color, design, graphics or any other component to create a unique layout. This slide shows various partnership agreements used by businesses to earn mutual benefits that lead to long-term profits. It includes agreements such as integration, strategic marketing, technology, supply chain, and financial partnerships.
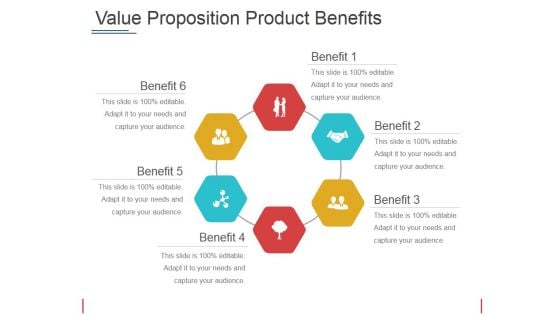
Value Proposition Product Benefits Template 1 Ppt PowerPoint Presentation Visual Aids Backgrounds
This is a value proposition product benefits template 1 ppt powerpoint presentation visual aids backgrounds. This is a six stage process. The stages in this process are benefit, business, icons, process, marketing.

Value Proposition Product Benefits Template 2 Ppt PowerPoint Presentation Outline Shapes
This is a value proposition product benefits template 2 ppt powerpoint presentation outline shapes. This is a four stage process. The stages in this process are product benefit, business, icons, process, marketing.
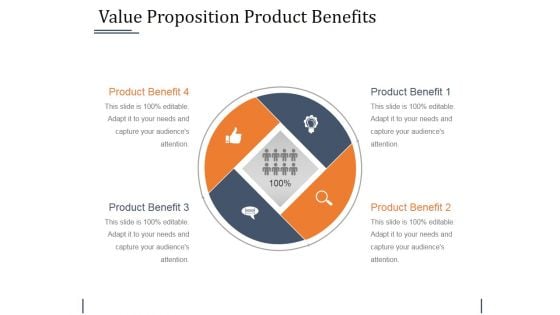
Value Proposition Product Benefits Template 1 Ppt PowerPoint Presentation Show Slide
This is a value proposition product benefits template 1 ppt powerpoint presentation show slide. This is a four stage process. The stages in this process are business, icons, marketing, strategy, process, management.

Value Proposition Product Benefits Template 2 Ppt PowerPoint Presentation Pictures Tips
This is a value proposition product benefits template 2 ppt powerpoint presentation pictures tips. This is a six stage process. The stages in this process are business, icons, marketing, strategy, process, management.
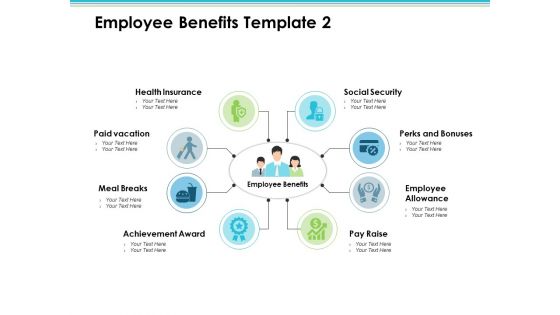
Employee Benefits Employee Value Proposition Ppt PowerPoint Presentation Visual Aids Infographic Template
This is a employee benefits employee value proposition ppt powerpoint presentation visual aids infographic template. This is a eight stage process. The stages in this process are business, management, strategy, analysis, icons.
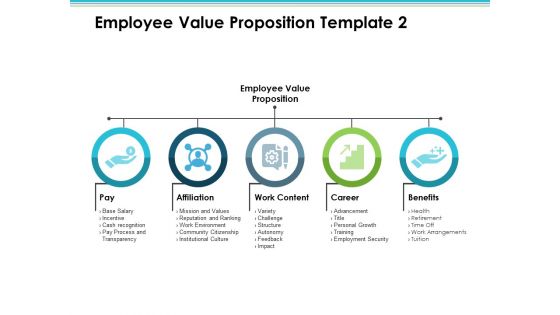
Employee Value Proposition Pay Affiliation Benefits Ppt PowerPoint Presentation Show Good
This is a employee value proposition pay affiliation benefits ppt powerpoint presentation show good. This is a five stage process. The stages in this process are business, management, strategy, analysis, icons.
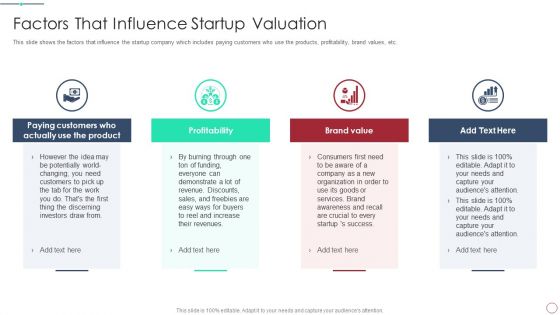
Initial Phase Investor Value For New Business Factors That Influence Startup Valuation Structure PDF
This slide shows the factors that influence the startup company which includes paying customers who use the products, profitability, brand values, etc. This is a initial phase investor value for new business factors that influence startup valuation structure pdf template with various stages. Focus and dispense information on four stages using this creative set, that comes with editable features. It contains large content boxes to add your information on topics like profitability, customers, value, consumers. You can also showcase facts, figures, and other relevant content using this PPT layout. Grab it now.
Australian Flag National Patriotic Theme PowerPoint Templates Ppt Backgrounds For Slides 0413
We present our Australian Flag National Patriotic Theme PowerPoint Templates PPT Backgrounds For Slides 0413.Present our Government PowerPoint Templates because Our PowerPoint Templates and Slides will let Your superior ideas hit the target always and everytime. Use our Finance PowerPoint Templates because Our PowerPoint Templates and Slides will let Your superior ideas hit the target always and everytime. Download our Success PowerPoint Templates because Your audience will believe you are the cats whiskers. Download and present our Shapes PowerPoint Templates because It will mark the footprints of your journey. Illustrate how they will lead you to your desired destination. Download and present our Business PowerPoint Templates because You can Double your output with our PowerPoint Templates and Slides. They make beating deadlines a piece of cake.Use these PowerPoint slides for presentations relating to Australia flag icons theme, government, business, finance, success, shapes. The prominent colors used in the PowerPoint template are Red, Blue, White. Our Australian Flag National Patriotic Theme PowerPoint Templates Ppt Backgrounds For Slides 0413 always show a full face. Get a complete view from any angle.
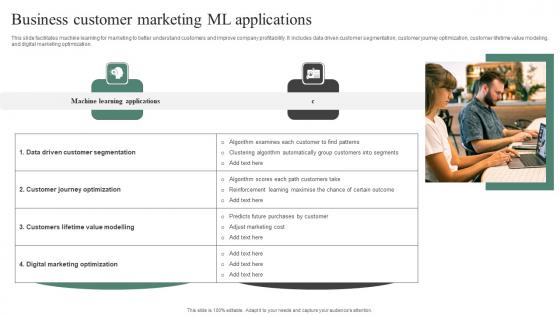
Business Customer Marketing ML Applications Themes Pdf
This slide facilitates machine learning for marketing to better understand customers and improve company profitability. It includes data driven customer segmentation, customer journey optimization, customer lifetime value modeling, and digital marketing optimization. Pitch your topic with ease and precision using this Business Customer Marketing ML Applications Themes Pdf. This layout presents information on Machine Learning Applications, Description. It is also available for immediate download and adjustment. So, changes can be made in the color, design, graphics or any other component to create a unique layout. This slide facilitates machine learning for marketing to better understand customers and improve company profitability. It includes data driven customer segmentation, customer journey optimization, customer lifetime value modeling, and digital marketing optimization.
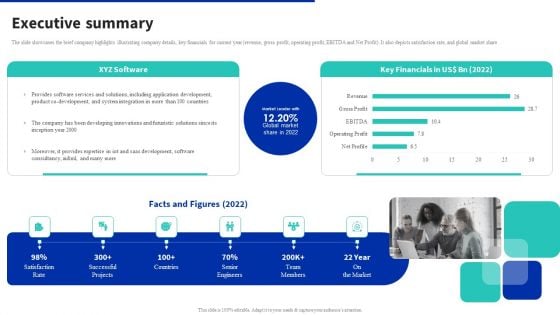
Digital Products Company Outline Executive Summary Designs PDF
The slide showcases the brief company highlights illustrating company details, key financials for current year revenue, gross profit, operating profit, EBITDA and Net Profit. It also depicts satisfaction rate, and global market share. Do you know about Slidesgeeks Digital Products Company Outline Executive Summary Designs PDF These are perfect for delivering any kind od presentation. Using it, create PowerPoint presentations that communicate your ideas and engage audiences. Save time and effort by using our pre designed presentation templates that are perfect for a wide range of topic. Our vast selection of designs covers a range of styles, from creative to business, and are all highly customizable and easy to edit. Download as a PowerPoint template or use them as Google Slides themes.
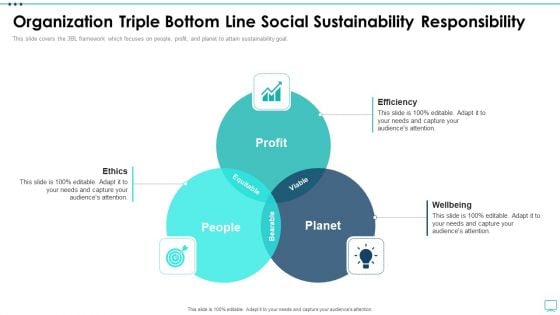
Strategic Business Plan Effective Tools Organization Triple Bottom Line Social Sustainability Rules PDF
This slide covers the 3BL framework which focuses on people, profit, and planet to attain sustainability goal. Presenting strategic business plan effective tools organization triple bottom line social sustainability rules pdf to provide visual cues and insights. Share and navigate important information on three stages that need your due attention. This template can be used to pitch topics like efficiency, wellbeing, ethics, profit, planet, people. In addtion, this PPT design contains high resolution images, graphics, etc, that are easily editable and available for immediate download.
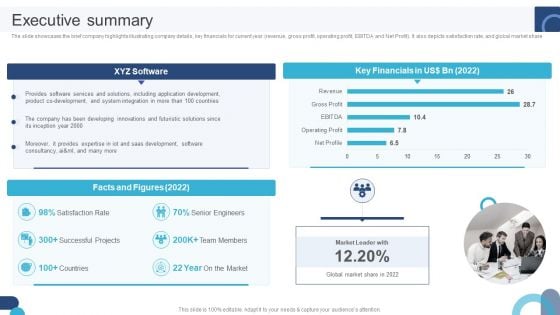
Digital Application Software Development Business Profile Executive Summary Structure PDF
The slide showcases the brief company highlights illustrating company details, key financials for current year revenue, gross profit, operating profit, EBITDA and Net Profit. It also depicts satisfaction rate, and global market share. If you are looking for a format to display your unique thoughts, then the professionally designed Digital Application Software Development Business Profile Executive Summary Structure PDF is the one for you. You can use it as a Google Slides template or a PowerPoint template. Incorporate impressive visuals, symbols, images, and other charts. Modify or reorganize the text boxes as you desire. Experiment with shade schemes and font pairings. Alter, share or cooperate with other people on your work. Download Digital Application Software Development Business Profile Executive Summary Structure PDF and find out how to give a successful presentation. Present a perfect display to your team and make your presentation unforgettable.
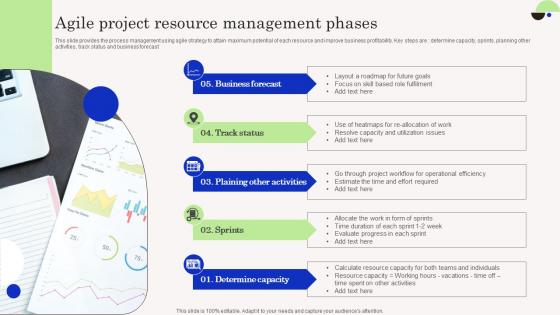
Agile Project Resource Management Phases Summary Pdf
This slide provides the process management using agile strategy to attain maximum potential of each resource and improve business profitability. Key steps are determine capacity, sprints, planning other activities, track status and business forecast Showcasing this set of slides titled Agile Project Resource Management Phases Summary Pdf. The topics addressed in these templates are Business Forecast, Track Status, Plaining Other Activities. All the content presented in this PPT design is completely editable. Download it and make adjustments in color, background, font etc. as per your unique business setting. This slide provides the process management using agile strategy to attain maximum potential of each resource and improve business profitability. Key steps are determine capacity, sprints, planning other activities, track status and business forecast
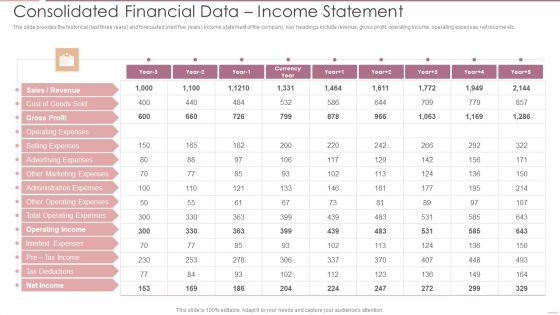
Investment Banking Security Underwriting Pitchbook Consolidated Financial Data Income Statement Diagrams PDF
The slide provides the historical last three years and forecasted next five years income statement of the company. Key headings include revenue, gross profit, operating income, operating expenses, net income etc.Deliver and pitch your topic in the best possible manner with this Investment Banking Security Underwriting Pitchbook Consolidated Financial Data Income Statement Diagrams PDF Use them to share invaluable insights on Gross Profit, Operating Expenses, Advertising Expenses and impress your audience. This template can be altered and modified as per your expectations. So, grab it now.
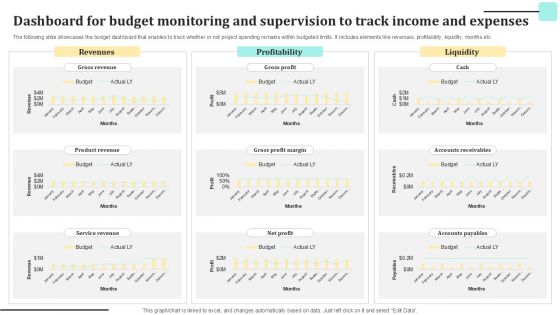
Dashboard For Budget Monitoring And Supervision To Track Income And Expenses Guidelines PDF
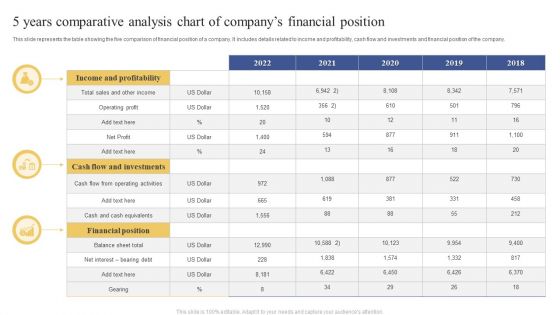
5 Years Comparative Analysis Chart Of Companys Financial Position Ppt Layouts Structure PDF
This slide represents the table showing the five comparison of financial position of a company. It includes details related to income and profitability, cash flow and investments and financial position of the company. Showcasing this set of slides titled 5 Years Comparative Analysis Chart Of Companys Financial Position Ppt Layouts Structure PDF. The topics addressed in these templates are Income And Profitability, Financial Position, Balance Sheet Total. All the content presented in this PPT design is completely editable. Download it and make adjustments in color, background, font etc. as per your unique business setting.
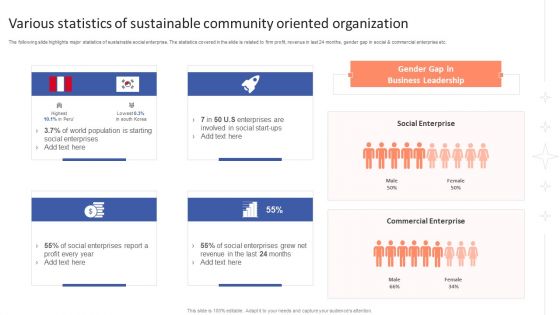
Various Statistics Of Sustainable Community Oriented Organization Themes PDF
The following slide highlights major statistics of sustainable social enterprise. The statistics covered in the slide is related to firm profit, revenue in last 24 months, gender gap in social and commercial enterprise etc. Persuade your audience using this Various Statistics Of Sustainable Community Oriented Organization Themes PDF. This PPT design covers four stages, thus making it a great tool to use. It also caters to a variety of topics including Social Enterprises, Enterprises, Profit. Download this PPT design now to present a convincing pitch that not only emphasizes the topic but also showcases your presentation skills.
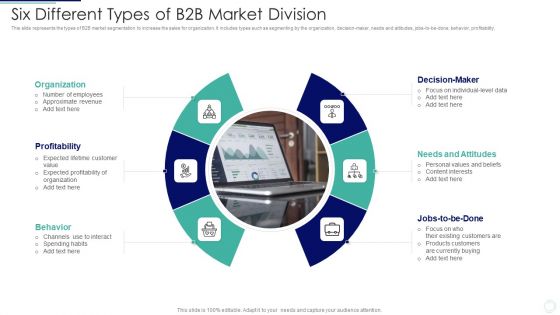
Six Different Types Of B2B Market Division Themes PDF
This slide represents the types of B2B market segmentation to increase the sales for organization. It includes types such as segmenting by the organization, decision-maker, needs and attitudes, jobs to be done, behavior, profitability. Persuade your audience using this Six Different Types Of B2B Market Division Themes PDF. This PPT design covers six stages, thus making it a great tool to use. It also caters to a variety of topics including Organization, Profitability, Behavior. Download this PPT design now to present a convincing pitch that not only emphasizes the topic but also showcases your presentation skills.
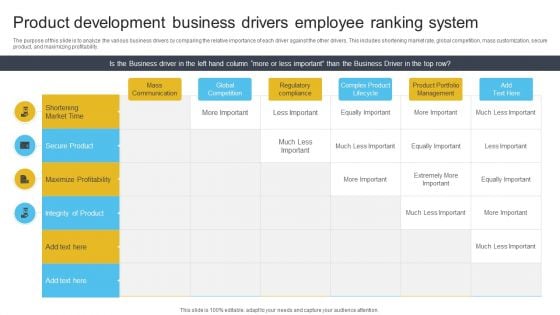
Product Development Business Drivers Employee Ranking System Themes PDF
The purpose of this slide is to analyze the various business drivers by comparing the relative importance of each driver against the other drivers. This includes shortening market rate, global competition, mass customization, secure product, and maximizing profitability. Pitch your topic with ease and precision using this Product Development Business Drivers Employee Ranking System Themes PDF. This layout presents information on Maximize Profitability, Secure Product, Global Competition. It is also available for immediate download and adjustment. So, changes can be made in the color, design, graphics or any other component to create a unique layout.
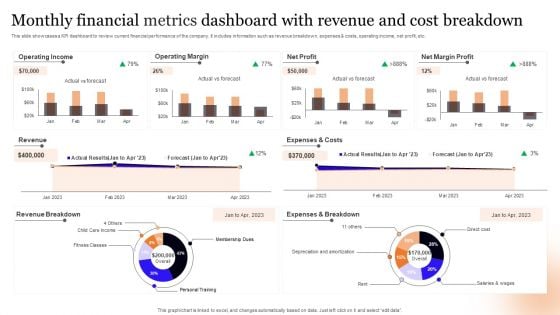
Monthly Financial Metrics Dashboard With Revenue And Cost Breakdown Information PDF
This slide showcases a KPI dashboard to review current financial performance of the company. It includes information such as revenue breakdown, expenses and costs, operating income, net profit, etc. Pitch your topic with ease and precision using this Monthly Financial Metrics Dashboard With Revenue And Cost Breakdown Information PDF. This layout presents information on Operating Income, Operating Margin, Net Profit. It is also available for immediate download and adjustment. So, changes can be made in the color, design, graphics or any other component to create a unique layout.
My Values Template 1 Ppt PowerPoint Presentation Infographics Information
This is a my values template 1 ppt powerpoint presentation infographics information. This is a six stage process. The stages in this process areprocess, business, marketing, strategy, icons.
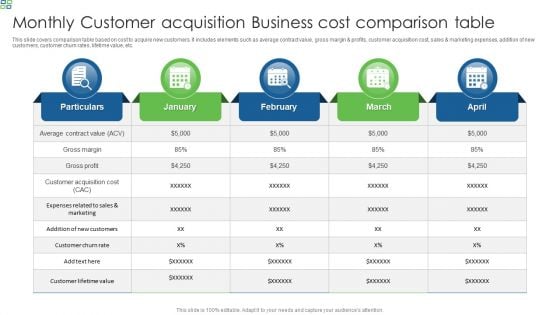
Monthly Customer Acquisition Business Cost Comparison Table Diagrams PDF
This slide covers comparison table based on cost to acquire new customers. It includes elements such as average contract value, gross margin and profits, customer acquisition cost, sales and marketing expenses, addition of new customers, customer churn rates, lifetime value, etc. Pitch your topic with ease and precision using this Monthly Customer Acquisition Business Cost Comparison Table Diagrams PDF. This layout presents information on Gross Profit, Gross Margin, Customer Churn Rate. It is also available for immediate download and adjustment. So, changes can be made in the color, design, graphics or any other component to create a unique layout.
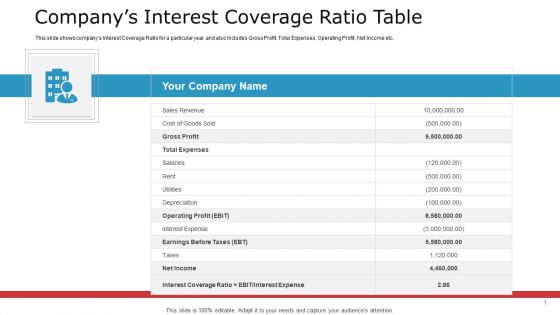
Pitch Deck To Raise Capital From Commercial Financial Institution Using Bonds Companys Interest Coverage Ratio Table Themes PDF
This slide shows companys Interest Coverage Ratio for a particular year and also includes Gross Profit, Total Expenses, Operating Profit, Net Income etc.Deliver and pitch your topic in the best possible manner with this pitch deck to raise capital from commercial financial institution using bonds companys interest coverage ratio table themes pdf. Use them to share invaluable insights on total expenses, interest expense, sales revenue and impress your audience. This template can be altered and modified as per your expectations. So, grab it now.
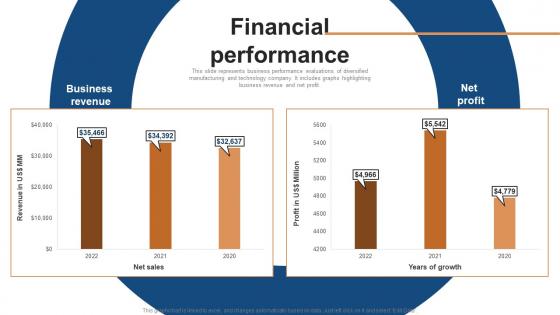
Financial Performance Conglomerate Company Fund Raising Pitch Deck Background Pdf
This slide represents business performance evaluations of diversified manufacturing and technology company. It includes graphs highlighting business revenue and net profit. From laying roadmaps to briefing everything in detail, our templates are perfect for you. You can set the stage with your presentation slides. All you have to do is download these easy-to-edit and customizable templates. Financial Performance Conglomerate Company Fund Raising Pitch Deck Background Pdf will help you deliver an outstanding performance that everyone would remember and praise you for. Do download this presentation today. This slide represents business performance evaluations of diversified manufacturing and technology company. It includes graphs highlighting business revenue and net profit.
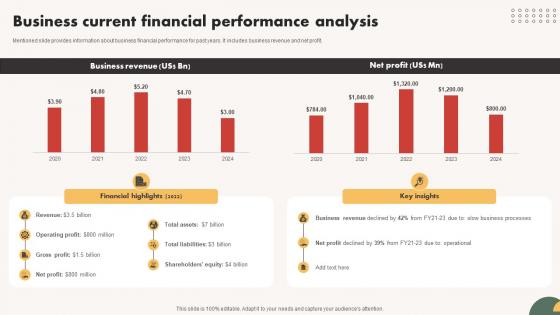
Automated Communication System Business Current Financial Performance Analysis
Mentioned slide provides information about business financial performance for past years. It includes business revenue and net profit. From laying roadmaps to briefing everything in detail, our templates are perfect for you. You can set the stage with your presentation slides. All you have to do is download these easy-to-edit and customizable templates. Automated Communication System Business Current Financial Performance Analysis will help you deliver an outstanding performance that everyone would remember and praise you for. Do download this presentation today. Mentioned slide provides information about business financial performance for past years. It includes business revenue and net profit.
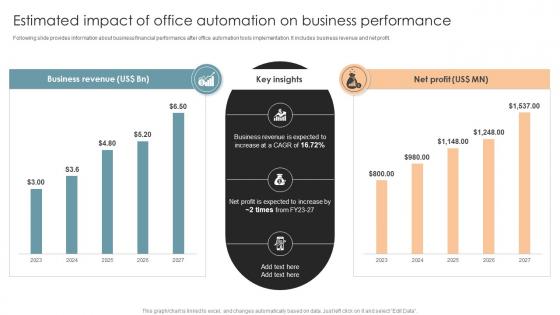
Estimated Impact Of Office Automation On Business Office Process Optimization To Increase Cost Efficiency
Following slide provides information about business financial performance after office automation tools implementation. It includes business revenue and net profit.If your project calls for a presentation, then Slidegeeks is your go-to partner because we have professionally designed, easy-to-edit templates that are perfect for any presentation. After downloading, you can easily edit Estimated Impact Of Office Automation On Business Office Process Optimization To Increase Cost Efficiency and make the changes accordingly. You can rearrange slides or fill them with different images. Check out all the handy templates Following slide provides information about business financial performance after office automation tools implementation. It includes business revenue and net profit.
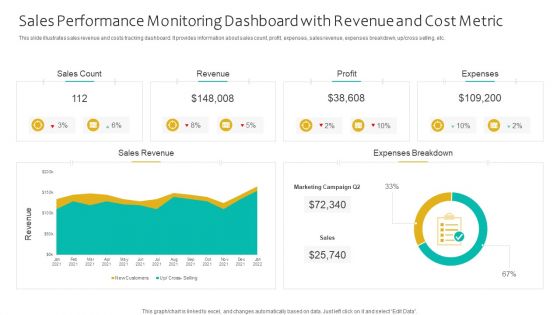
Sales Performance Monitoring Dashboard With Revenue And Cost Metric Ppt Portfolio Good PDF
This slide illustrates sales revenue and costs tracking dashboard. It provides information about sales count, profit, expenses, sales revenue, expenses breakdown, up or cross selling, etc. Showcasing this set of slides titled Sales Performance Monitoring Dashboard With Revenue And Cost Metric Ppt Portfolio Good PDF. The topics addressed in these templates are Sales Count, Revenue, Profit, Expenses. All the content presented in this PPT design is completely editable. Download it and make adjustments in color, background, font etc. as per your unique business setting.
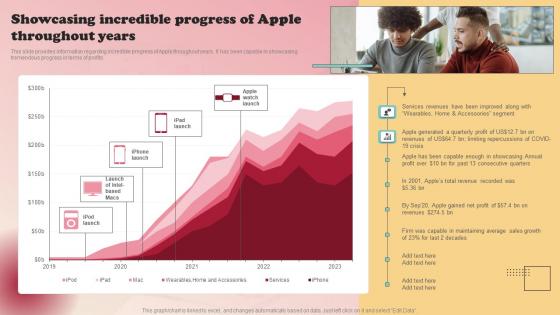
Product Branding Strategy Of Apple Showcasing Incredible Progress Of Apple Information Pdf
This slide provides information regarding incredible progress of Apple throughout years. It has been capable in showcasing tremendous progress in terms of profits. Find a pre-designed and impeccable Product Branding Strategy Of Apple Showcasing Incredible Progress Of Apple Information Pdf. The templates can ace your presentation without additional effort. You can download these easy-to-edit presentation templates to make your presentation stand out from others. So, what are you waiting for Download the template from Slidegeeks today and give a unique touch to your presentation. This slide provides information regarding incredible progress of Apple throughout years. It has been capable in showcasing tremendous progress in terms of profits.
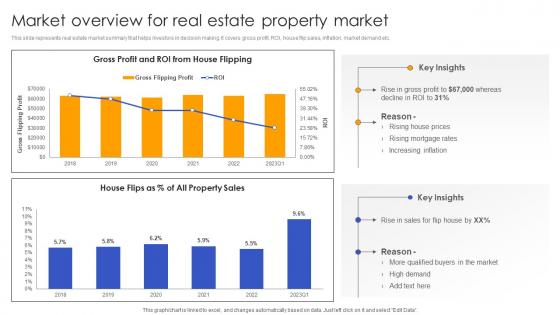
Market Overview For Real Estate Property Effective Real Estate Flipping Approaches Portrait Pdf
This slide represents real estate market summary that helps investors in decision making. It covers gross profit, ROI, house flip sales, inflation, market demand etc. There are so many reasons you need a Market Overview For Real Estate Property Effective Real Estate Flipping Approaches Portrait Pdf. The first reason is you can not spend time making everything from scratch, Thus, Slidegeeks has made presentation templates for you too. You can easily download these templates from our website easily. This slide represents real estate market summary that helps investors in decision making. It covers gross profit, ROI, house flip sales, inflation, market demand etc.
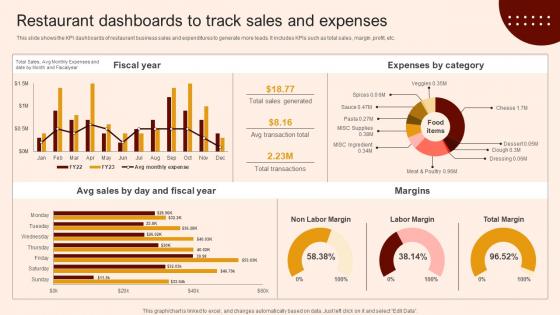
Create A Restaurant Marketing Restaurant Dashboards To Track Sales And Expenses
This slide shows the KPI dashboards of restaurant business sales and expenditures to generate more leads. It includes KPIs such as total sales, margin ,profit, etc. There are so many reasons you need a Create A Restaurant Marketing Restaurant Dashboards To Track Sales And Expenses. The first reason is you can not spend time making everything from scratch, Thus, Slidegeeks has made presentation templates for you too. You can easily download these templates from our website easily. This slide shows the KPI dashboards of restaurant business sales and expenditures to generate more leads. It includes KPIs such as total sales, margin ,profit, etc.
Two Men Moving On Growth Graph Vector Ppt PowerPoint Presentation Professional Microsoft
This is a two men moving on growth graph vector ppt powerpoint presentation professional microsoft. This is a three stage process. The stages in this process are benefits icon, advantage icon, plus point icon.
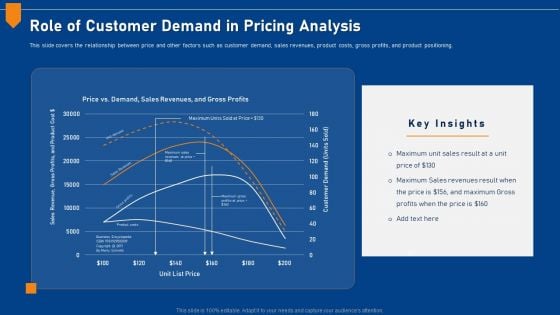
Evaluating Price Efficiency In Organization Role Of Customer Demand In Pricing Analysis Infographics PDF
This slide covers the relationship between price and other factors such as customer demand, sales revenues, product costs, gross profits, and product positioning. Deliver and pitch your topic in the best possible manner with this evaluating price efficiency in organization role of customer demand in pricing analysis infographics pdf. Use them to share invaluable insights on customer demand, sales revenues, product costs, gross profits, product positioning and impress your audience. This template can be altered and modified as per your expectations. So, grab it now.
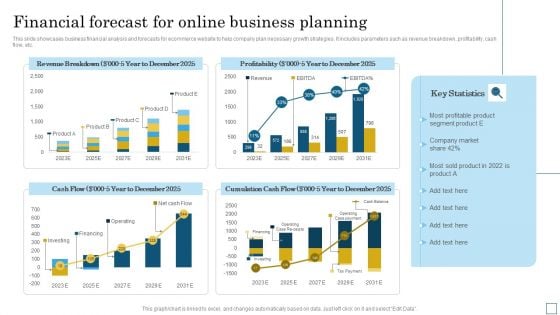
Financial Forecast For Online Business Planning Pictures PDF
This slide showcases business financial analysis and forecasts for ecommerce website to help company plan necessary growth strategies. It includes parameters such as revenue breakdown, profitability, cash flow, etc. Pitch your topic with ease and precision using this Financial Forecast For Online Business Planning Pictures PDF. This layout presents information on Cumulation Cash Flow, Profitability, Revenue Breakdown. It is also available for immediate download and adjustment. So, changes can be made in the color, design, graphics or any other component to create a unique layout.
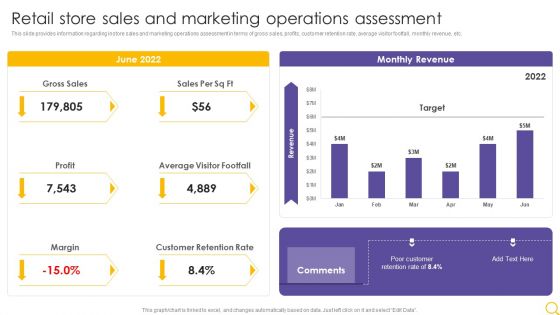
Retail Outlet Operational Efficiency Analytics Retail Store Sales And Marketing Operations Assessment Designs PDF
This slide provides information regarding instore sales and marketing operations assessment in terms of gross sales, profits, customer retention rate, average visitor footfall, monthly revenue, etc. Deliver and pitch your topic in the best possible manner with this Retail Outlet Operational Efficiency Analytics Retail Store Sales And Marketing Operations Assessment Designs PDF. Use them to share invaluable insights on Gross Sales, Profit, Average Visitor Footfall and impress your audience. This template can be altered and modified as per your expectations. So, grab it now.
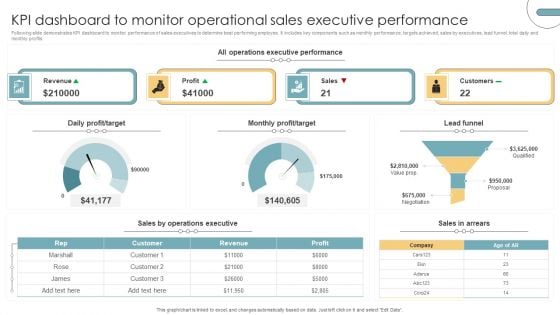
KPI Dashboard To Monitor Operational Sales Executive Performance Portrait PDF
Following slide demonstrates KPI dashboard to monitor performance of sales executives to determine best performing employee. It includes key components such as monthly performance, targets achieved, sales by executives, lead funnel, total daily and monthly profits. Pitch your topic with ease and precision using this KPI Dashboard To Monitor Operational Sales Executive Performance Portrait PDF. This layout presents information on Revenue, Profit, Sales, Customers. It is also available for immediate download and adjustment. So, changes can be made in the color, design, graphics or any other component to create a unique layout.
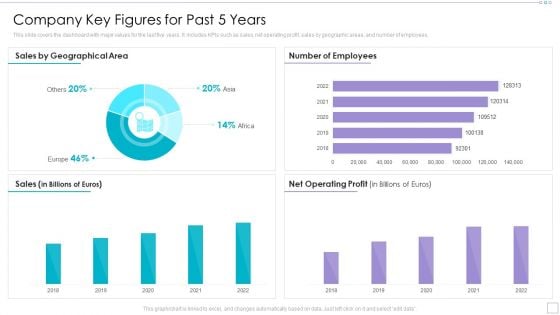
Clothing Business Market Entry Strategy Company Key Figures For Past 5 Years Infographics PDF
This slide covers the dashboard with major values for the last five years. It includes KPIs such as sales, net operating profit, sales by geographic areas, and number of employees. Deliver an awe inspiring pitch with this creative Clothing Business Market Entry Strategy Company Key Figures For Past 5 Years Infographics PDF bundle. Topics like Geographical Area, Operating Profit, Billions Of Euros can be discussed with this completely editable template. It is available for immediate download depending on the needs and requirements of the user.
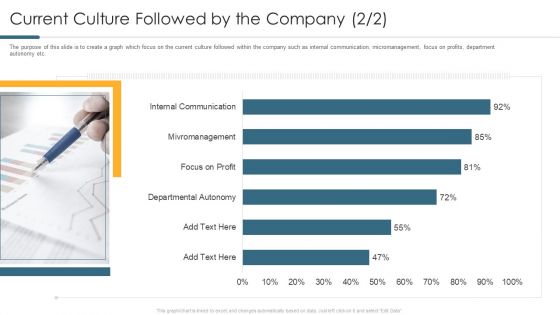
Current Culture Followed By The Company Grid Template PDF
The purpose of this slide is to create a graph which focus on the current culture followed within the company such as internal communication, micromanagement, focus on profits, department autonomy etc. Deliver and pitch your topic in the best possible manner with this current culture followed by the company grid template pdf. Use them to share invaluable insights on departmental autonomy, focus on profit, internal communication, mivromanagement and impress your audience. This template can be altered and modified as per your expectations. So, grab it now.
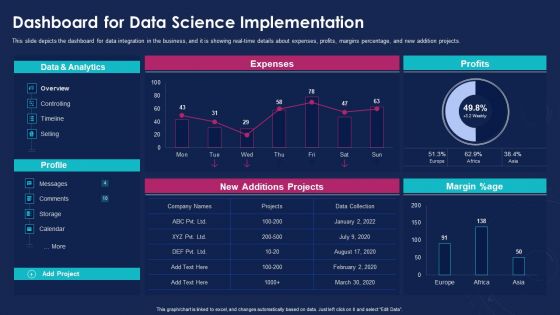
Data Analytics IT Dashboard For Data Science Implementation Ppt Portfolio Pictures PDF
This slide depicts the dashboard for data integration in the business, and it is showing real-time details about expenses, profits, margins percentage, and new addition projects. Deliver and pitch your topic in the best possible manner with this data analytics it dashboard for data science implementation ppt portfolio pictures pdf. Use them to share invaluable insights on data and analytics, margin percentage, profits, expenses, new additions projects and impress your audience. This template can be altered and modified as per your expectations. So, grab it now.

Infrastructure Expansion KPI Dashboard For Investment Project Management Inspiration PDF
This slide covers management dashboard for analyzing the project performance and progress. It include KPIs such as total claims to date, total costs to date, project status, profits, number of days left, etc. Showcasing this set of slides titled Infrastructure Expansion KPI Dashboard For Investment Project Management Inspiration PDF. The topics addressed in these templates are Claims And Costs, Project Status, Profits. All the content presented in this PPT design is completely editable. Download it and make adjustments in color, background, font etc. as per your unique business setting.
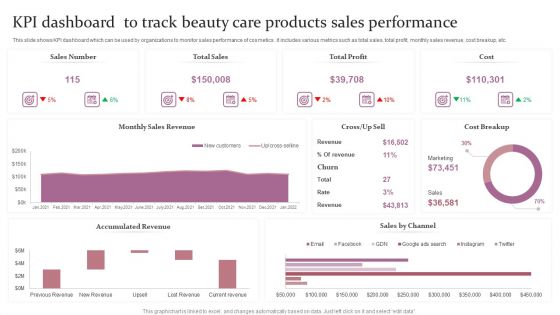
KPI Dashboard To Track Beauty Care Products Sales Performance Ppt Outline Pictures PDF
This slide shows the key performance indicators dashboard which can be used to analyze current financial position of cosmetic business. It includes metrics such as sales, expenses, profit, cash in hand, etc. Showcasing this set of slides titled KPI Dashboard To Track Beauty Care Products Sales Performance Ppt Outline Pictures PDF. The topics addressed in these templates are Sales Number, Total Sales, Total Profit, Cost. All the content presented in this PPT design is completely editable. Download it and make adjustments in color, background, font etc. as per your unique business setting.
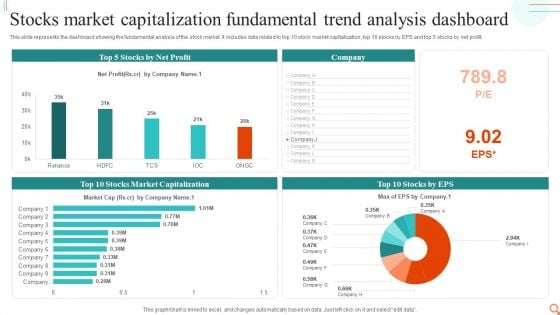
Stocks Market Capitalization Fundamental Trend Analysis Dashboard Designs PDF
This slide represents the dashboard showing the fundamental analysis of the stock market. It includes data related to top 10 stock market capitalization, top 10 stocks by EPS and top 5 stocks by net profit.Showcasing this set of slides titled Stocks Market Capitalization Fundamental Trend Analysis Dashboard Designs PDF. The topics addressed in these templates are Market Capitalization, Net Profit. All the content presented in this PPT design is completely editable. Download it and make adjustments in color, background, font etc. as per your unique business setting.
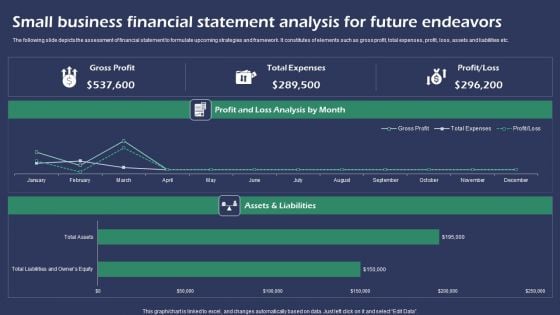
Small Business Financial Statement Analysis For Future Endeavors Mockup PDF
The following slide depicts the assessment of financial statement to formulate upcoming strategies and framework. It constitutes of elements such as gross profit, total expenses, profit, loss, assets and liabilities etc. Showcasing this set of slides titled Small Business Financial Statement Analysis For Future Endeavors Mockup PDF. The topics addressed in these templates are Small Business, Financial Statement Analysis. All the content presented in this PPT design is completely editable. Download it and make adjustments in color, background, font etc. as per your unique business setting.

Ppt Circular Interpretation Of 9 Steps Involved Procedure PowerPoint Templates
PPT circular interpretation of 9 steps involved procedure PowerPoint Templates-Use this Circular flow diagram to describe key strategic issues and information flows and internal communication.-PPT circular interpretation of 9 steps involved procedure PowerPoint Templates-Affiliate, Affiliation, Arrow, Business, Chart, Circular, Commerce, Concept, Contribution, Cycle, Development, Diagram, Idea, Informative, Internet, Join, Making, Manage, Management, Market, Marketing, Member, Money, Network, Partner, Partnership, Pay, Paying, Performance, Plans, Process, Productive, Productivity, Profit, Profitable, Project, Recruit, Recruiting, Recruitment, Refer, Referral, Referring, Revenue, Sales, Socialize, Steps, Strategy Get classy with our Ppt Circular Interpretation Of 9 Steps Involved Procedure PowerPoint Templates. They ensure A-list clients.
Ppt Circular Interpretation Of 12 Steps Involved Procedure PowerPoint Templates
PPT circular interpretation of 12 steps involved procedure PowerPoint Templates-Use this Circular flow diagram to describe key strategic issues and information flows and internal communication.-PPT circular interpretation of 12 steps involved procedure PowerPoint Templates-Affiliate, Affiliation, Arrow, Business, Chart, Circular, Commerce, Concept, Contribution, Cycle, Development, Diagram, Idea, Informative, Internet, Join, Making, Manage, Management, Market, Marketing, Member, Money, Network, Partner, Partnership, Pay, Paying, Performance, Plans, Process, Productive, Productivity, Profit, Profitable, Project, Recruit, Recruiting, Recruitment, Refer, Referral, Referring, Revenue, Sales, Socialize, Steps, Strategy Serve presentations with our Ppt Circular Interpretation Of 12 Steps Involved Procedure PowerPoint Templates. Download without worries with our money back guaranteee.
Ppt Circular Flow Of 5 Steps Involved Development PowerPoint Templates
PPT circular flow of 5 steps involved development PowerPoint Templates-Use this Circular flow diagram to describe key strategic issues and information flows and internal communication.-PPT circular flow of 5 steps involved development PowerPoint Templates-Affiliate, Affiliation, Arrow, Business, Chart, Circular, Commerce, Concept, Contribution, Cycle, Development, Diagram, Idea, Informative, Internet, Join, Making, Manage, Management, Market, Marketing, Member, Money, Network, Partner, Partnership, Pay, Paying, Performance, Plans, Process, Productive, Productivity, Profit, Profitable, Project, Recruit, Recruiting, Recruitment, Refer, Referral, Referring, Revenue, Sales, Socialize, Steps, Strategy Rule the roost with our Ppt Circular Flow Of 5 Steps Involved Development PowerPoint Templates. They will enthrone your thoughts.
Ppt Horizontal Illustration Of Financial Process Using 6 State Diagram PowerPoint Templates
PPT horizontal illustration of financial process using 6 state diagram PowerPoint Templates-This diagram can be used in analyzing, designing, documenting or managing a process or program in various fields.-PPT horizontal illustration of financial process using 6 state diagram PowerPoint Templates-Abstract, Achievement, Aim, Arrow, Background, Business, Chart, Communication, Company, Competition, Concept, Design, Development, Diagram, Direction, Finance, Financial, Forecast, Forward, Goal, Graph, Graphic, Growth, Icon, Illustration, Increase, Investment, Leader, Leadership, Marketing, Motion, Moving, Orange, Path, Price, Process, Profit, Progress, Shape, Sign, Success, Symbol, Target, Team, Teamwork, Up, Upwards Spread awareness of digital tools. Whatever the divide our PT&s will bridge it.
Ppt Homogeneous Demonstration Of Financial Process Using Stage 3 PowerPoint Templates
PPT homogeneous demonstration of financial process using stage 3 PowerPoint Templates-With this pre-designed process arrows diagram you can visualize almost any type of concept, chronological process or steps of your strategies.-PPT homogeneous demonstration of financial process using stage 3 PowerPoint Templates-Abstract, Achievement, Aim, Arrow, Background, Business, Chart, Communication, Company, Competition, Concept, Design, Development, Diagram, Direction, Finance, Financial, Forecast, Forward, Goal, Graph, Graphic, Growth, Icon, Illustration, Increase, Investment, Leader, Leadership, Marketing, Motion, Moving, Orange, Path, Price, Process, Profit, Progress, Shape, Sign, Success, Symbol, Target, Team, Teamwork, Up, Upwards Book you place at the top with our Ppt Homogeneous Demonstration Of Financial Process Using Stage 3 PowerPoint Templates. You will come out on top.

 Home
Home