Program Dashboard
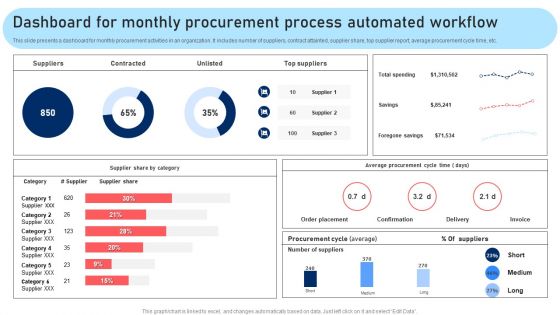
Dashboard For Monthly Procurement Process Automated Workflow Rules PDF
This slide presents a dashboard for monthly procurement activities in an organization. It includes number of suppliers, contract attainted, supplier share, top supplier report, average procurement cycle time, etc. Are you searching for a Dashboard For Monthly Procurement Process Automated Workflow Rules PDF that is uncluttered, straightforward, and original Its easy to edit, and you can change the colors to suit your personal or business branding. For a presentation that expresses how much effort you have put in, this template is ideal. With all of its features, including tables, diagrams, statistics, and lists, its perfect for a business plan presentation. Make your ideas more appealing with these professional slides. Download Dashboard For Monthly Procurement Process Automated Workflow Rules PDF from Slidegeeks today.
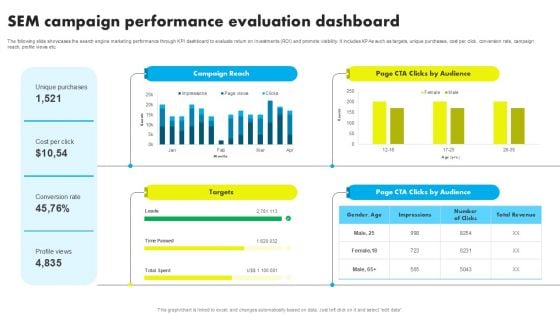
SEM Campaign Performance Evaluation Dashboard Ppt Icon Graphics Tutorials PDF
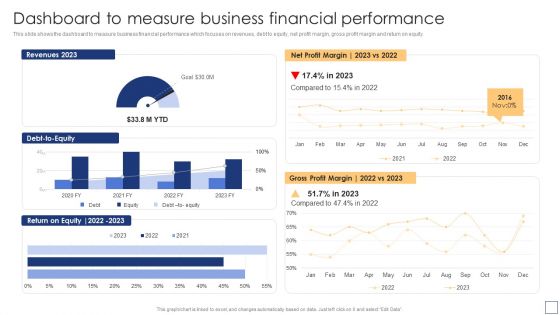
Dashboard To Measure Business Financial Performance Summary PDF
This slide shows the dashboard to measure business financial performance which focuses on revenues, debt to equity, net profit margin, gross profit margin and return on equity. Are you searching for a Dashboard To Measure Business Financial Performance Summary PDF that is uncluttered, straightforward, and original Its easy to edit, and you can change the colors to suit your personal or business branding. For a presentation that expresses how much effort youve put in, this template is ideal With all of its features, including tables, diagrams, statistics, and lists, its perfect for a business plan presentation. Make your ideas more appealing with these professional slides. Download Dashboard To Measure Business Financial Performance Summary PDF from Slidegeeks today.
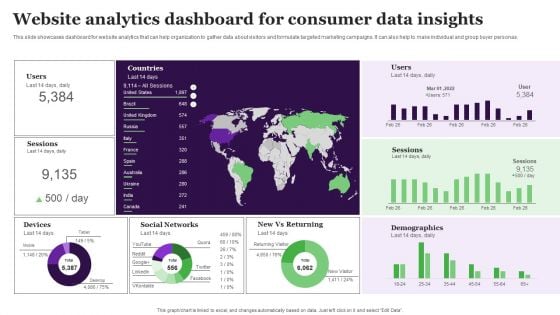
Website Analytics Dashboard For Consumer Data Insights Clipart PDF
This slide showcases dashboard for website analytics that can help organization to gather data about visitors and formulate targeted marketing campaigns. It can also help to make individual and group buyer personas. Want to ace your presentation in front of a live audience Our Website Analytics Dashboard For Consumer Data Insights Clipart PDF can help you do that by engaging all the users towards you.. Slidegeeks experts have put their efforts and expertise into creating these impeccable powerpoint presentations so that you can communicate your ideas clearly. Moreover, all the templates are customizable, and easy-to-edit and downloadable. Use these for both personal and commercial use.
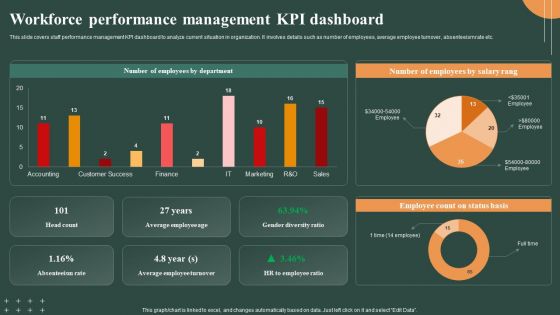
Techniques To Optimize Workforce Performance Management Kpi Dashboard Professional PDF
This slide covers staff performance management KPI dashboard to analyze current situation in organization. It involves details such as number of employees, average employee turnover, absenteeism rate etc. Whether you have daily or monthly meetings, a brilliant presentation is necessary. Techniques To Optimize Workforce Performance Management Kpi Dashboard Professional PDF can be your best option for delivering a presentation. Represent everything in detail using Techniques To Optimize Workforce Performance Management Kpi Dashboard Professional PDF and make yourself stand out in meetings. The template is versatile and follows a structure that will cater to your requirements. All the templates prepared by Slidegeeks are easy to download and edit. Our research experts have taken care of the corporate themes as well. So, give it a try and see the results.
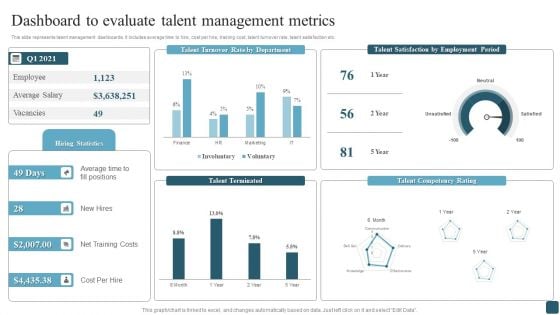
Dashboard To Evaluate Talent Management Metrics Professional PDF
This slide represents talent management dashboards. It includes average time to hire, cost per hire, training cost, talent turnover rate, talent satisfaction etc. Whether you have daily or monthly meetings, a brilliant presentation is necessary. Dashboard To Evaluate Talent Management Metrics Professional PDF can be your best option for delivering a presentation. Represent everything in detail using Dashboard To Evaluate Talent Management Metrics Professional PDF and make yourself stand out in meetings. The template is versatile and follows a structure that will cater to your requirements. All the templates prepared by Slidegeeks are easy to download and edit. Our research experts have taken care of the corporate themes as well. So, give it a try and see the results.
Website Performance Tracking And Monitoring Dashboard Ppt Slides Files PDF
The following slide showcases a dashboard to track and measure website performance. It includes key elements such as visits, average session duration, bounce rate, page views, goal conversion, visits by week, traffic sources, top channels by conversions, etc. Whether you have daily or monthly meetings, a brilliant presentation is necessary. Website Performance Tracking And Monitoring Dashboard Ppt Slides Files PDF can be your best option for delivering a presentation. Represent everything in detail using Website Performance Tracking And Monitoring Dashboard Ppt Slides Files PDF and make yourself stand out in meetings. The template is versatile and follows a structure that will cater to your requirements. All the templates prepared by Slidegeeks are easy to download and edit. Our research experts have taken care of the corporate themes as well. So, give it a try and see the results.
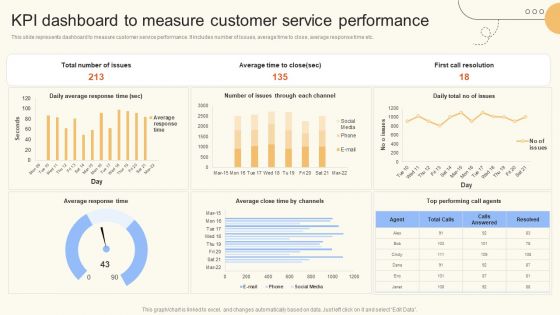
KPI Dashboard To Measure Customer Service Performance Pictures PDF
This slide represents dashboard to measure customer service performance. It includes number of issues, average time to close, average response time etc. Whether you have daily or monthly meetings, a brilliant presentation is necessary. KPI Dashboard To Measure Customer Service Performance Pictures PDF can be your best option for delivering a presentation. Represent everything in detail using KPI Dashboard To Measure Customer Service Performance Pictures PDF and make yourself stand out in meetings. The template is versatile and follows a structure that will cater to your requirements. All the templates prepared by Slidegeeks are easy to download and edit. Our research experts have taken care of the corporate themes as well. So, give it a try and see the results.
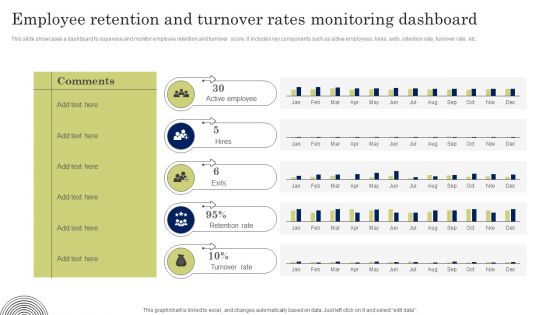
Employee Retention And Turnover Rates Monitoring Dashboard Designs PDF
This slide showcases a dashboard to supervise and monitor employee retention and turnover score. It includes key components such as active employees, hires, exits, retention rate, turnover rate, etc. Whether you have daily or monthly meetings, a brilliant presentation is necessary. Employee Retention And Turnover Rates Monitoring Dashboard Designs PDF can be your best option for delivering a presentation. Represent everything in detail using Employee Retention And Turnover Rates Monitoring Dashboard Designs PDF and make yourself stand out in meetings. The template is versatile and follows a structure that will cater to your requirements. All the templates prepared by Slidegeeks are easy to download and edit. Our research experts have taken care of the corporate themes as well. So, give it a try and see the results.
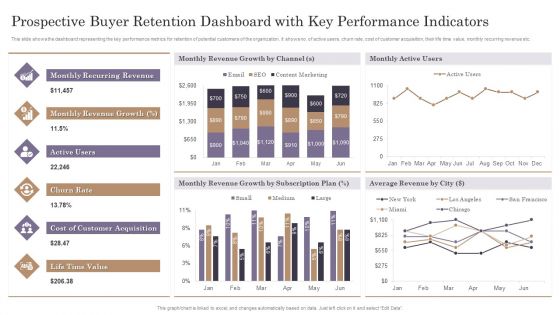
Prospective Buyer Retention Dashboard With Key Performance Indicators Themes PDF
This slide shows the dashboard representing the key performance metrics for retention of potential customers of the organization. It shows no. of active users, churn rate, cost of customer acquisition, their life time value, monthly recurring revenue etc.Pitch your topic with ease and precision using this Prospective Buyer Retention Dashboard With Key Performance Indicators Themes PDF. This layout presents information on Recurring Revenue, Revenue Growth, Customer Acquisition. It is also available for immediate download and adjustment. So, changes can be made in the color, design, graphics or any other component to create a unique layout.
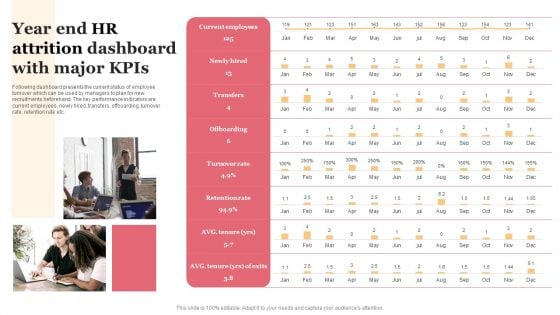
Year End HR Attrition Dashboard With Major Kpis Demonstration PDF
Following dashboard presents the current status of employee turnover which can be used by managers to plan for new recruitments beforehand. The key performance indicators are current employees, newly hired, transfers, offboarding, turnover rate, retention rate etc. Persuade your audience using this Year End HR Attrition Dashboard With Major Kpis Demonstration PDF. This PPT design covers one stages, thus making it a great tool to use. It also caters to a variety of topics including Retention Rate, Turnover Rate, Offboarding. Download this PPT design now to present a convincing pitch that not only emphasizes the topic but also showcases your presentation skills.
Optimize Brand Valuation Corporate Branding Performance Tracking Dashboard Structure PDF
This slide provides information regarding corporate branding performance tracking dashboard in terms of leads, conversion metrics, web traffic, etc. Whether you have daily or monthly meetings, a brilliant presentation is necessary. Optimize Brand Valuation Corporate Branding Performance Tracking Dashboard Structure PDF can be your best option for delivering a presentation. Represent everything in detail using Optimize Brand Valuation Corporate Branding Performance Tracking Dashboard Structure PDF and make yourself stand out in meetings. The template is versatile and follows a structure that will cater to your requirements. All the templates prepared by Slidegeeks are easy to download and edit. Our research experts have taken care of the corporate themes as well. So, give it a try and see the results.
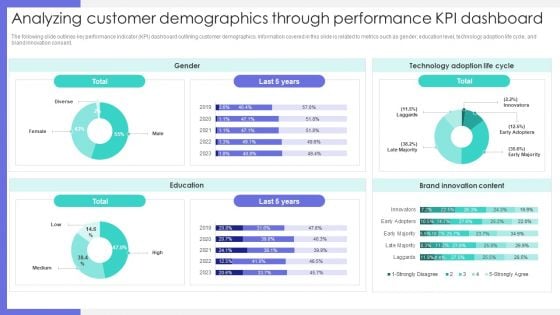
Analyzing Customer Demographics Through Performance KPI Dashboard Graphics PDF
The following slide outlines key performance indicator KPI dashboard outlining customer demographics. Information covered in this slide is related to metrics such as gender, education level, technology adoption life cycle, and brand innovation consent. Find a pre designed and impeccable Analyzing Customer Demographics Through Performance KPI Dashboard Graphics PDF. The templates can ace your presentation without additional effort. You can download these easy to edit presentation templates to make your presentation stand out from others. So, what are you waiting for Download the template from Slidegeeks today and give a unique touch to your presentation.
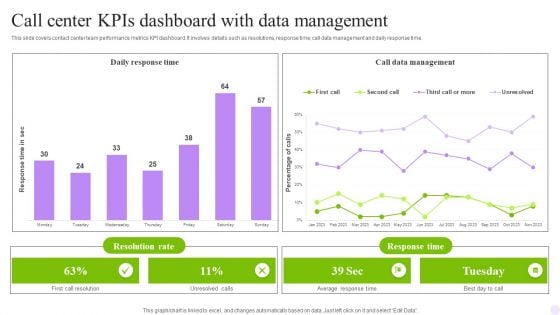
Call Center Kpis Dashboard With Data Management Infographics PDF
This slide covers contact center metrics KPI dashboard with call data details. It involves details such as total number of contacts handled, product sales, repeated calls and contact handles per day. Pitch your topic with ease and precision using this Call Center Kpis Dashboard With Data Management Infographics PDF. This layout presents information on Achieved, Contacts Handled, Repeated Calls. It is also available for immediate download and adjustment. So, changes can be made in the color, design, graphics or any other component to create a unique layout.
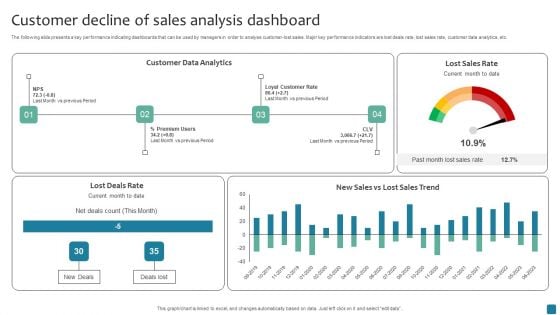
Customer Decline Of Sales Analysis Dashboard Rules PDF
The following slide presents a key performance indicating dashboards that can be used by managers in order to analyse customer-lost sales. Major key performance indicators are lost deals rate, lost sales rate, customer data analytics, etc. Pitch your topic with ease and precision using this Customer Decline Of Sales Analysis Dashboard Rules PDF. This layout presents information on Customer Data Analytics. It is also available for immediate download and adjustment. So, changes can be made in the color, design, graphics or any other component to create a unique layout.
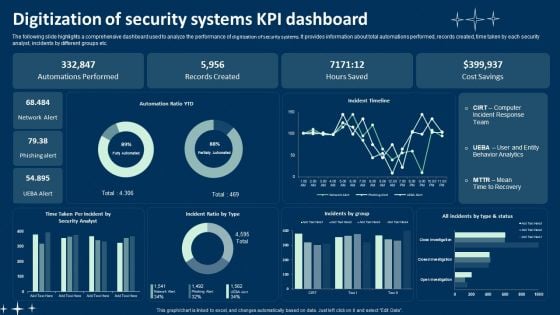
Digitization Of Security Systems KPI Dashboard Ppt Summary Portfolio PDF
The following slide highlights a comprehensive dashboard used to analyze the performance of digitization of security systems. It provides information about total automations performed, records created, time taken by each security analyst, incidents by different groups etc. Showcasing this set of slides titled Digitization Of Security Systems KPI Dashboard Ppt Summary Portfolio PDF. The topics addressed in these templates are Automations Performed, Records Created, Hours Saved. All the content presented in this PPT design is completely editable. Download it and make adjustments in color, background, font etc. as per your unique business setting.

Call Center Kpis Agent Performance Dashboard Clipart PDF
This slide covers contact center agent performance metrics KPI dashboard. It involves metrics such as number of calls, average response time, average hold time, daily average transfer rate and agents with most hold time and transfer rate. Showcasing this set of slides titled Call Center Kpis Agent Performance Dashboard Clipart PDF. The topics addressed in these templates are Transfer Rate, Call Center, Hold Time. All the content presented in this PPT design is completely editable. Download it and make adjustments in color, background, font etc. as per your unique business setting.
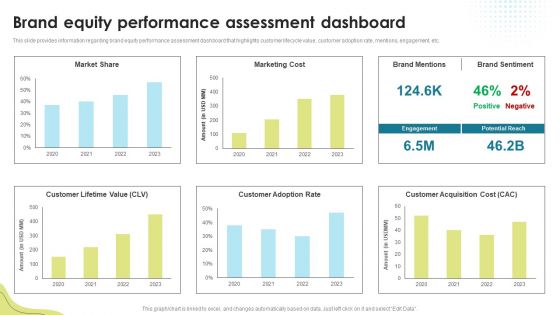
Brand Equity Performance Assessment Dashboard Brand Administration Template PDF
This slide provides information regarding brand equity performance assessment dashboard that highlights customer lifecycle value, customer adoption rate, mentions, engagement, etc. This modern and well-arranged Brand Equity Performance Assessment Dashboard Brand Administration Template PDF provides lots of creative possibilities. It is very simple to customize and edit with the Powerpoint Software. Just drag and drop your pictures into the shapes. All facets of this template can be edited with Powerpoint no extra software is necessary. Add your own material, put your images in the places assigned for them, adjust the colors, and then you can show your slides to the world, with an animated slide included.
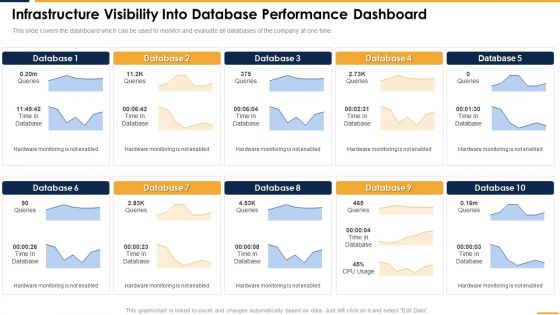
Infrastructure Visibility Into Database Performance Dashboard Rules PDF
This slide covers the dashboard which can be used to monitor and evaluate all databases of the company at one time. This modern and well arranged Infrastructure Visibility Into Database Performance Dashboard Rules PDF provides lots of creative possibilities. It is very simple to customize and edit with the Powerpoint Software. Just drag and drop your pictures into the shapes. All facets of this template can be edited with Powerpoint no extra software is necessary. Add your own material, put your images in the places assigned for them, adjust the colors, and then you can show your slides to the world, with an animated slide included.
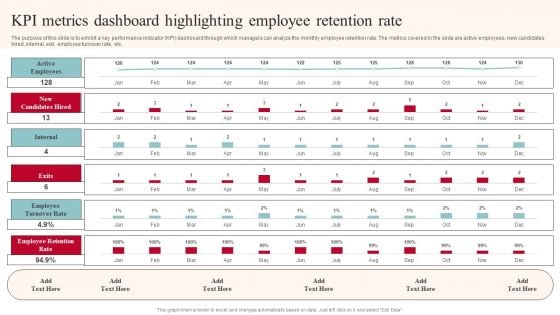
KPI Metrics Dashboard Highlighting Employee Retention Rate Structure PDF
The purpose of this slide is to exhibit a key performance indicator KPI dashboard through which managers can analyze the monthly employee retention rate. The metrics covered in the slide are active employees, new candidates hired, internal, exit, employee turnover rate, etc. Do you have to make sure that everyone on your team knows about any specific topic I yes, then you should give KPI Metrics Dashboard Highlighting Employee Retention Rate Structure PDF a try. Our experts have put a lot of knowledge and effort into creating this impeccable KPI Metrics Dashboard Highlighting Employee Retention Rate Structure PDF. You can use this template for your upcoming presentations, as the slides are perfect to represent even the tiniest detail. You can download these templates from the Slidegeeks website and these are easy to edit. So grab these today.
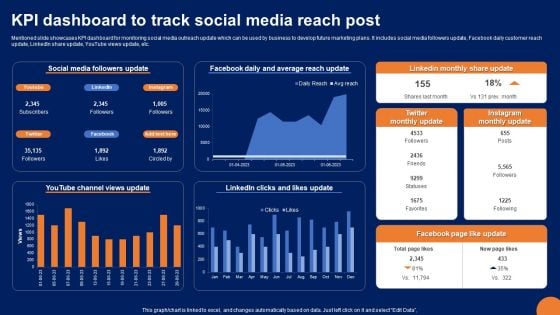
KPI Dashboard To Track Social Media Reach Post Portrait PDF
Mentioned slide showcases KPI dashboard for monitoring social media outreach update which can be used by business to develop future marketing plans. It includes social media followers update, Facebook daily customer reach update, LinkedIn share update, YouTube views update, etc. Showcasing this set of slides titled KPI Dashboard To Track Social Media Reach Post Portrait PDF. The topics addressed in these templates are Social Media Followers Update, Facebook Daily, Average Reach Update. All the content presented in this PPT design is completely editable. Download it and make adjustments in color, background, font etc. as per your unique business setting.
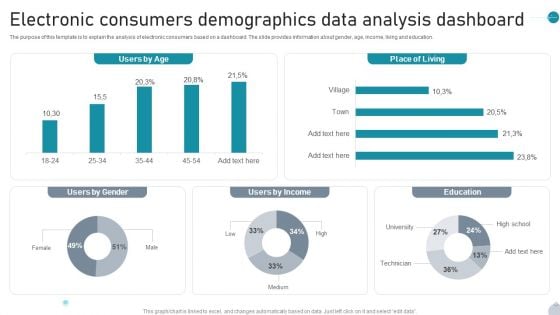
Electronic Consumers Demographics Data Analysis Dashboard Topics PDF
The purpose of this template is to explain the analysis of electronic consumers based on a dashboard. The slide provides information about gender, age, income, living and education. Showcasing this set of slides titled Electronic Consumers Demographics Data Analysis Dashboard Topics PDF. The topics addressed in these templates are Users By Age, Place Of Living, Users By Income All the content presented in this PPT design is completely editable. Download it and make adjustments in color, background, font etc. as per your unique business setting.
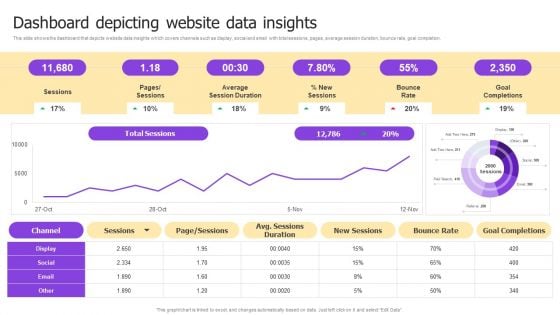
Implementing Brand Development Dashboard Depicting Website Data Insights Guidelines PDF
This slide shows the dashboard that depicts website data insights which covers channels such as display, social and email with total sessions, pages, average session duration, bounce rate, goal completion. Get a simple yet stunning designed Implementing Brand Development Dashboard Depicting Website Data Insights Guidelines PDF. It is the best one to establish the tone in your meetings. It is an excellent way to make your presentations highly effective. So, download this PPT today from Slidegeeks and see the positive impacts. Our easy-to-edit Implementing Brand Development Dashboard Depicting Website Data Insights Guidelines PDF can be your go-to option for all upcoming conferences and meetings. So, what are you waiting for Grab this template today.
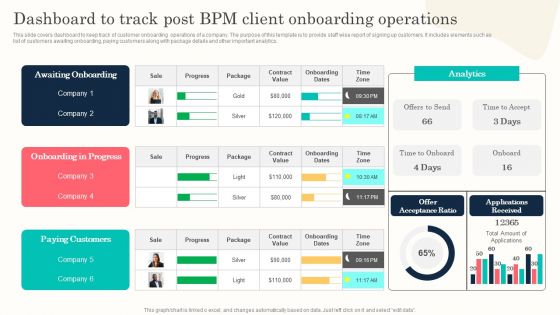
Dashboard To Track Post BPM Client Onboarding Operations Professional PDF
This slide covers dashboard to keep track of customer onboarding operations of a company. The purpose of this template is to provide staff wise report of signing up customers. It includes elements such as list of customers awaiting onboarding, paying customers along with package details and other important analytics. Do you have to make sure that everyone on your team knows about any specific topic I yes, then you should give Dashboard To Track Post BPM Client Onboarding Operations Professional PDF a try. Our experts have put a lot of knowledge and effort into creating this impeccable Dashboard To Track Post BPM Client Onboarding Operations Professional PDF. You can use this template for your upcoming presentations, as the slides are perfect to represent even the tiniest detail. You can download these templates from the Slidegeeks website and these are easy to edit. So grab these today.
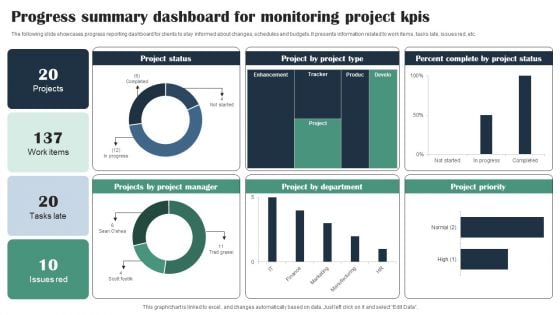
Progress Summary Dashboard For Monitoring Project Kpis Infographics PDF
The following slide showcases progress reporting dashboard for clients to stay informed about changes, schedules and budgets. It presents information related to work items, tasks late, issues red, etc. Pitch your topic with ease and precision using this Progress Summary Dashboard For Monitoring Project Kpis Infographics PDF. This layout presents information on Project Status, Project Manager, Project Type, Percent Complete. It is also available for immediate download and adjustment. So, changes can be made in the color, design, graphics or any other component to create a unique layout.
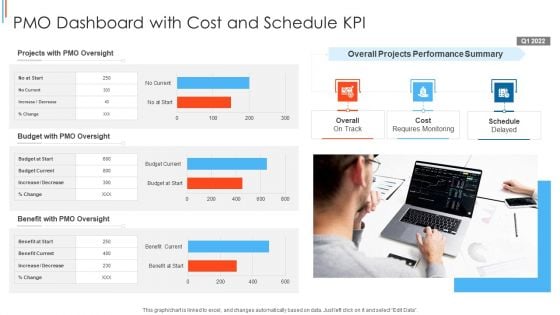
PMO Dashboard With Cost And Schedule KPI Template PDF
Showcasing this set of slides titled PMO Dashboard With Cost And Schedule KPI Themes PDF The topics addressed in these templates are Projects With Pmo Oversight, Budget With Pmo Oversight, Benefit With Pmo Oversight All the content presented in this PPT design is completely editable. Download it and make adjustments in color, background, font etc. as per your unique business setting.
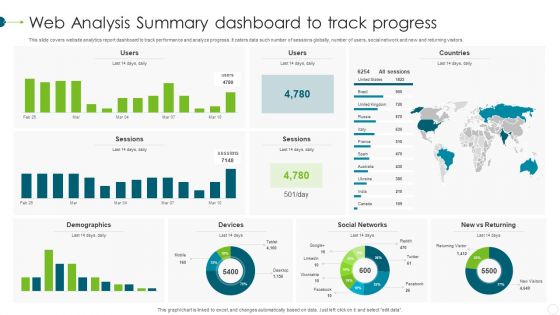
Web Analysis Summary Dashboard To Track Progress Elements PDF
This slide covers website analytics report dashboard to track performance and analyze progress. It caters data such number of sessions globally, number of users, social network and new and returning visitors. Showcasing this set of slides titled Web Analysis Summary Dashboard To Track Progress Elements PDF. The topics addressed in these templates are Demographics, Devices, Social Networks. All the content presented in this PPT design is completely editable. Download it and make adjustments in color, background, font etc. as per your unique business setting.
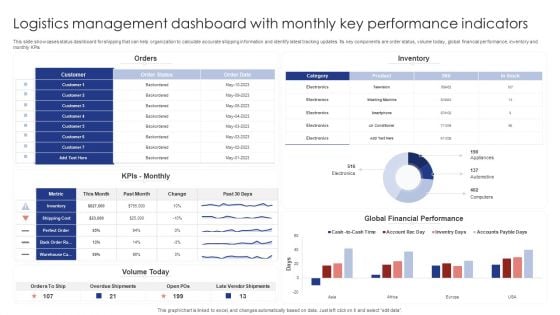
Logistics Management Dashboard With Monthly Key Performance Indicators Rules PDF
This slide showcases status dashboard for shipping that can help organization to calculate accurate shipping information and identify latest tracking updates. Its key components are order status, volume today, global financial performance, inventory and monthly KPIs. Pitch your topic with ease and precision using this Logistics Management Dashboard With Monthly Key Performance Indicators Rules PDF. This layout presents information on Orders, Inventory, Kpis Monthly. It is also available for immediate download and adjustment. So, changes can be made in the color, design, graphics or any other component to create a unique layout.
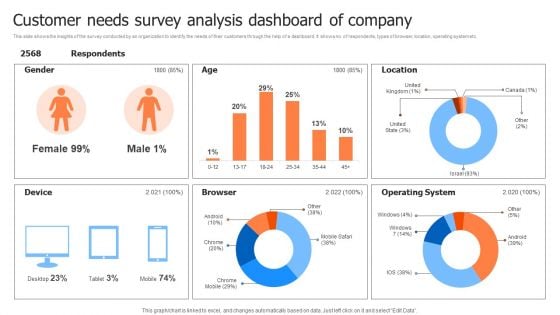
Customer Needs Survey Analysis Dashboard Of Company Inspiration PDF
This slide shows the insights of the survey conducted by an organization to identify the needs of their customers through the help of a dashboard. It shows no. of respondents, types of browser, location, operating system etc. Showcasing this set of slides titled Customer Needs Survey Analysis Dashboard Of Company Inspiration PDF. The topics addressed in these templates are Operating System, Location, Device. All the content presented in this PPT design is completely editable. Download it and make adjustments in color, background, font etc. as per your unique business setting.
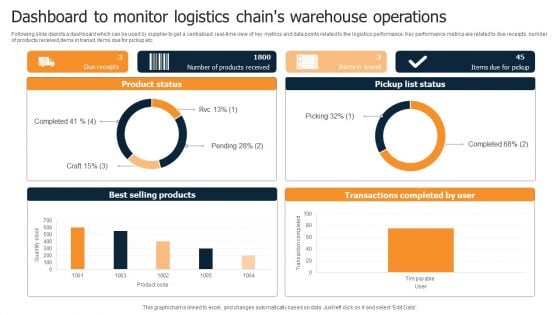
Dashboard To Monitor Logistics Chains Warehouse Operations Diagrams PDF
Following slide depicts a dashboard which can be used by supplier to get a centralized, real-time view of key metrics and data points related to the logistics performance. Key performance metrics are related to due receipts, number of products received,items in transit, items due for pickup etc. Pitch your topic with ease and precision using this Dashboard To Monitor Logistics Chains Warehouse Operations Diagrams PDF. This layout presents information on Product Status, Pickup List Status, Best Selling Products. It is also available for immediate download and adjustment. So, changes can be made in the color, design, graphics or any other component to create a unique layout.
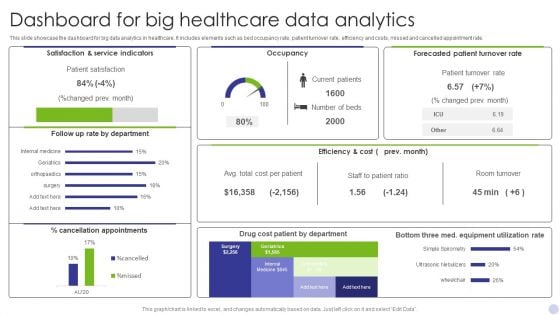
Dashboard For Big Healthcare Data Analytics Graphics PDF
This slide showcase the dashboard for big data analytics in healthcare. It includes elements such as bed occupancy rate, patient turnover rate, efficiency and costs, missed and cancelled appointment rate. Showcasing this set of slides titled Dashboard For Big Healthcare Data Analytics Graphics PDF. The topics addressed in these templates are Satisfaction Service Indicators, Occupancy, Forecasted Patient Turnover. All the content presented in this PPT design is completely editable. Download it and make adjustments in color, background, font etc. as per your unique business setting.
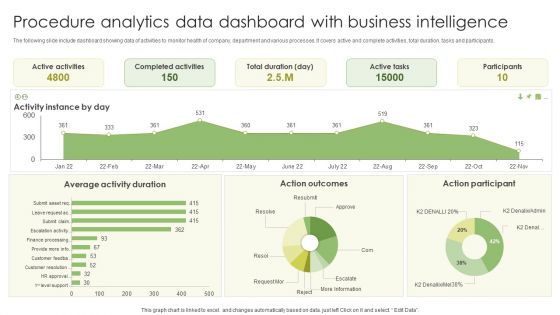
Procedure Analytics Data Dashboard With Business Intelligence Slides PDF
The following slide include dashboard showing data of activities to monitor health of company, department and various processes. It covers active and complete activities, total duration, tasks and participants. Pitch your topic with ease and precision using this Procedure Analytics Data Dashboard With Business Intelligence Slides PDF. This layout presents information on Active Activities, Completed Activities, Active Tasks . It is also available for immediate download and adjustment. So, changes can be made in the color, design, graphics or any other component to create a unique layout.
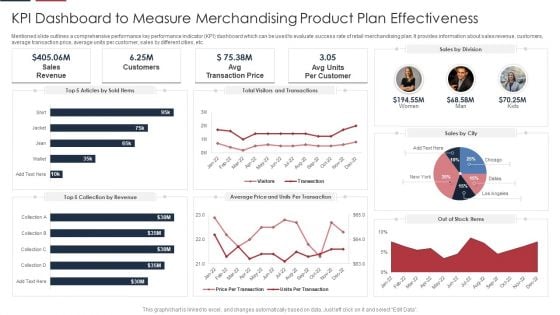
KPI Dashboard To Measure Merchandising Product Plan Effectiveness Guidelines PDF
Mentioned slide outlines a comprehensive performance key performance indicator KPI dashboard which can be used to evaluate success rate of retail merchandising plan. It provides information about sales revenue, customers, average transaction price, average units per customer, sales by different cities, etc. Showcasing this set of slides titled KPI Dashboard To Measure Merchandising Product Plan Effectiveness Guidelines PDF. The topics addressed in these templates are Sales, Customers, Price. All the content presented in this PPT design is completely editable. Download it and make adjustments in color, background, font etc. as per your unique business setting.
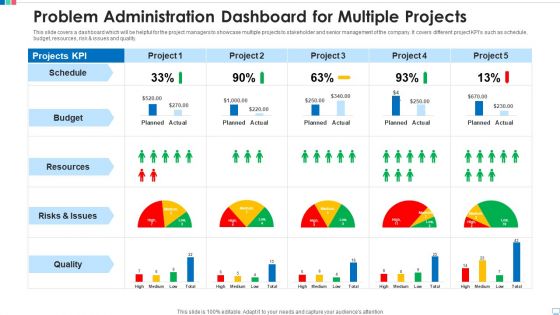
Problem Administration Dashboard For Multiple Projects Professional PDF
This slide covers a dashboard which will be helpful for the project managers to showcase multiple projects to stakeholder and senior management of the company. It covers different project KPIs such as schedule, budget, resources, risk and issues and quality. Showcasing this set of slides titled problem administration dashboard for multiple projects professional pdf. The topics addressed in these templates are schedule, budget, resources, risks and issues, quality. All the content presented in this PPT design is completely editable. Download it and make adjustments in color, background, font etc. as per your unique business setting.

Business Operations Dashboard Ppt PowerPoint Presentation Styles Pictures PDF
This slide shows dashboard for measuring business operations. It includes details of total production, weekly average production, scrap and scrap average in each production line. It also covers daily production statistics, production trend, project summary, events and distribution.Deliver an awe-inspiring pitch with this creative business operations dashboard ppt powerpoint presentation styles pictures pdf. bundle. Topics like production trend, daily production, production summary, distribution can be discussed with this completely editable template. It is available for immediate download depending on the needs and requirements of the user.
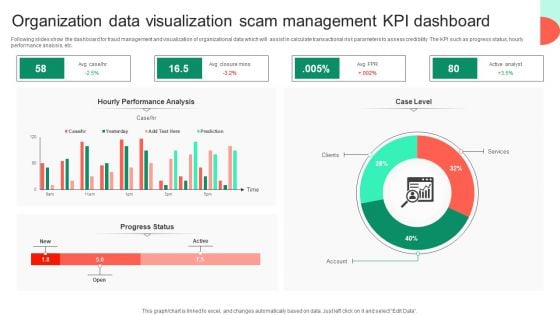
Organization Data Visualization Scam Management KPI Dashboard Rules PDF
Following slides show the dashboard for fraud management and visualization of organizational data which will assist in calculate transactional risk parameters to assess credibility. The KPI such as progress status, hourly performance analysis, etc. Showcasing this set of slides titled Organization Data Visualization Scam Management KPI Dashboard Rules PDF. The topics addressed in these templates are Hourly Performance Analysis, Services, Organization Data Visualization. All the content presented in this PPT design is completely editable. Download it and make adjustments in color, background, font etc. as per your unique business setting.
Plan Dashboard For Tracking Location Wise Revenue Diagrams PDF
This slide presents a dashboard which will assist managers to track the revenue of each branch having geographical presence in different corners of the world. The key performance indicators are total revenue, location wise rent, branch performance among many others.Pitch your topic with ease and precision using this Plan Dashboard For Tracking Location Wise Revenue Diagrams PDF. This layout presents information on Taxes Paid, Current Month, Branch Performance, Previous Quarter. It is also available for immediate download and adjustment. So, changes can be made in the color, design, graphics or any other component to create a unique layout.
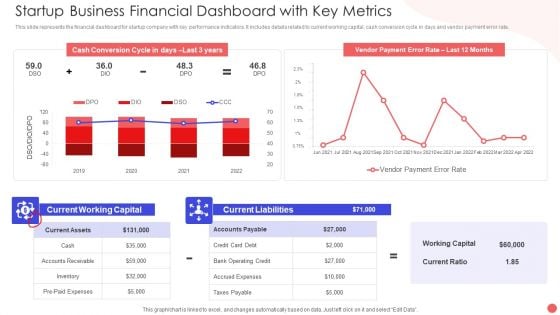
Startup Business Financial Dashboard With Key Metrics Sample PDF
This slide represents the financial dashboard for startup company with key performance indicators. It includes details related to current working capital, cash conversion cycle in days and vendor payment error rate. Pitch your topic with ease and precision using this Startup Business Financial Dashboard With Key Metrics Sample PDF. This layout presents information on Cash Conversion Cycle, Current Working Capital, Current Liabilities Debt. It is also available for immediate download and adjustment. So, changes can be made in the color, design, graphics or any other component to create a unique layout.
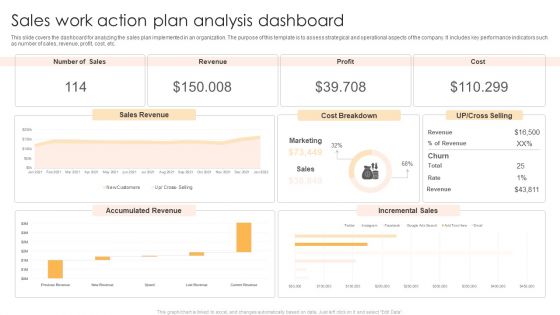
Sales Work Action Plan Analysis Dashboard Brochure PDF
This slide covers the dashboard for analyzing the sales plan implemented in an organization. The purpose of this template is to assess strategical and operational aspects of the company. It includes key performance indicators such as number of sales, revenue, profit, cost, etc. Showcasing this set of slides titled Sales Work Action Plan Analysis Dashboard Brochure PDF. The topics addressed in these templates are Sales Revenue, Cost Breakdown, Accumulated Revenue. All the content presented in this PPT design is completely editable. Download it and make adjustments in color, background, font etc. as per your unique business setting.
Retail Assortment Dashboard Depicting Store Performance Ppt Icon Structure PDF
This slide shows product assortment dashboard depicting store performance which can benefit managers in reviewing the current situation of outlets and make decisions according to reached benchmarks. It includes details about achieved sales, rate of conversion, weekday vs. Weekend sales, daily trend, etc. Showcasing this set of slides titled Retail Assortment Dashboard Depicting Store Performance Ppt Icon Structure PDF. The topics addressed in these templates are Achieved Sales, Rate Of Conversion, Daily Trend, Outlet Sales. All the content presented in this PPT design is completely editable. Download it and make adjustments in color, background, font etc. as per your unique business setting.
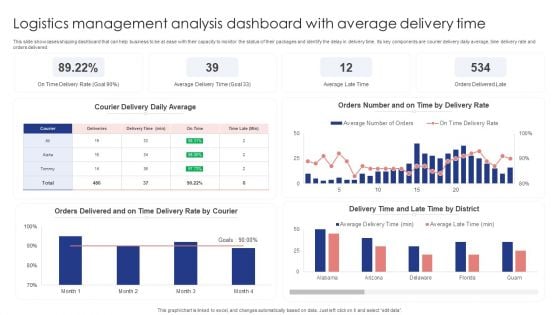
Logistics Management Analysis Dashboard With Average Delivery Time Themes PDF
This slide showcases shipping dashboard that can help business to be at ease with their capacity to monitor the status of their packages and identify the delay in delivery time. Its key components are courier delivery daily average, time delivery rate and orders delivered. Showcasing this set of slides titled Logistics Management Analysis Dashboard With Average Delivery Time Themes PDF. The topics addressed in these templates are Courier Delivery Daily Average, Delivery Rate, Orders Delivered. All the content presented in this PPT design is completely editable. Download it and make adjustments in color, background, font etc. as per your unique business setting.

Agile Prioritization Methodology Agile Software Development Dashboard Microsoft PDF
Presenting this set of slides with name agile prioritization methodology agile software development dashboard microsoft pdf. The topics discussed in these slides are web team, marketing, mobile team, customer support. This is a completely editable PowerPoint presentation and is available for immediate download. Download now and impress your audience.
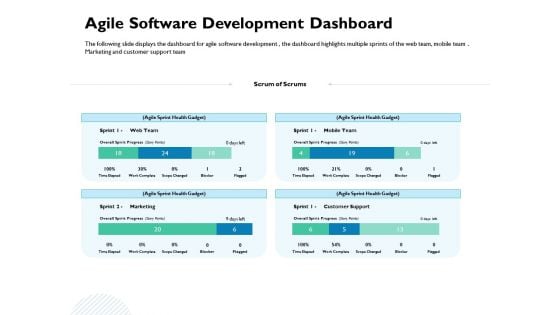
Waterfall Project Prioritization Methodology Agile Software Development Dashboard Structure PDF
Presenting this set of slides with name waterfall project prioritization methodology agile software development dashboard structure pdf. The topics discussed in these slides are web team, marketing, mobile team, customer support. This is a completely editable PowerPoint presentation and is available for immediate download. Download now and impress your audience.
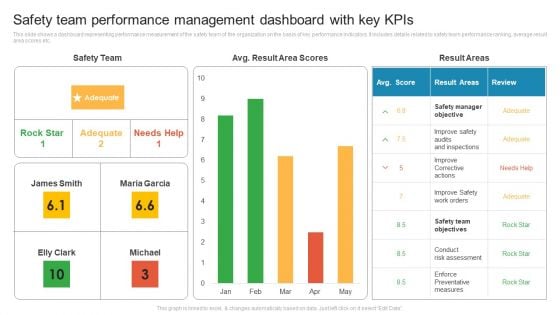
Safety Team Performance Management Dashboard With Key Kpis Rules PDF
This slide shows a dashboard representing performance measurement of the safety team of the organization on the basis of key performance indicators. It includes details related to safety team performance ranking, average result area scores etc. Pitch your topic with ease and precision using this Safety Team Performance Management Dashboard With Key Kpis Rules PDF. This layout presents information on Improve Corrective Actions, Safety Manager Objective, Conduct Risk Assessment. It is also available for immediate download and adjustment. So, changes can be made in the color, design, graphics or any other component to create a unique layout.
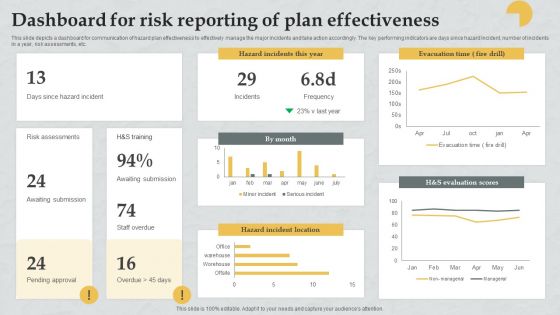
Dashboard For Risk Reporting Of Plan Effectiveness Download PDF
This slide depicts a dashboard for communication of hazard plan effectiveness to effectively manage the major incidents and take action accordingly. The key performing indicators are days since hazard incident, number of incidents in a year, risk assessments, etc. Showcasing this set of slides titled Dashboard For Risk Reporting Of Plan Effectiveness Download PDF. The topics addressed in these templates are Risk Assessments, Awaiting Submission, Awaiting Submission. All the content presented in this PPT design is completely editable. Download it and make adjustments in color, background, font etc. as per your unique business setting.
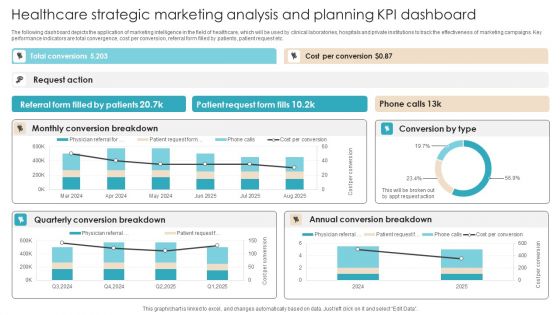
Healthcare Strategic Marketing Analysis And Planning Kpi Dashboard Elements PDF
The following dashboard depicts the application of marketing intelligence in the field of healthcare, which will be used by clinical laboratories, hospitals and private institutions to track the effectiveness of marketing campaigns. Key performance indicators are total convergence, cost per conversion, referral form filled by patients, patient request etc. Showcasing this set of slides titled Healthcare Strategic Marketing Analysis And Planning Kpi Dashboard Elements PDF. The topics addressed in these templates are Quarterly Conversion Breakdown, Annual Conversion Breakdown, Patient Request. All the content presented in this PPT design is completely editable. Download it and make adjustments in color, background, font etc. as per your unique business setting.
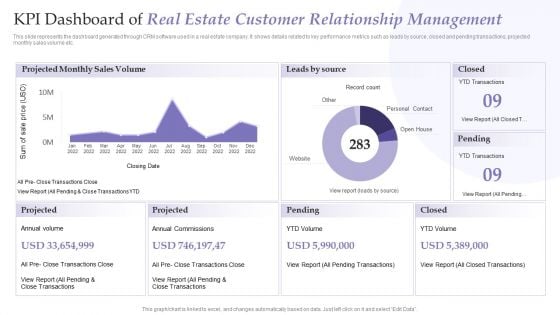
KPI Dashboard Of Real Estate Customer Relationship Management Pictures PDF
This slide represents the dashboard generated through CRM software used in a real estate company. It shows details related to key performance metrics such as leads by source, closed and pending transactions, projected monthly sales volume etc. Showcasing this set of slides titled KPI Dashboard Of Real Estate Customer Relationship Management Pictures PDF. The topics addressed in these templates are Projected Monthly Sales Volume, Leads By Source, Annual Commissions. All the content presented in this PPT design is completely editable. Download it and make adjustments in color, background, font etc. as per your unique business setting.
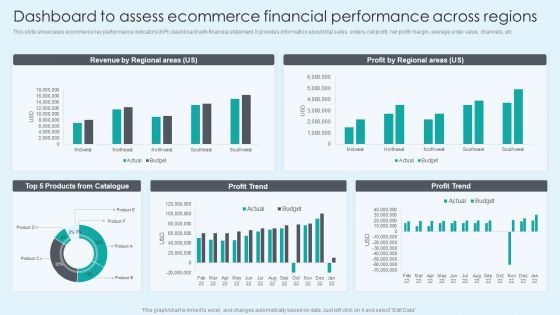
Dashboard To Assess Ecommerce Financial Performance Across Regions Themes PDF
This slide showcases ecommerce key performance indicators KPI dashboard with financial statement. It provides information about total sales, orders, net profit, net profit margin, average order value, channels, etc. Here you can discover an assortment of the finest PowerPoint and Google Slides templates. With these templates, you can create presentations for a variety of purposes while simultaneously providing your audience with an eye catching visual experience. Download Dashboard To Assess Ecommerce Financial Performance Across Regions Themes PDF to deliver an impeccable presentation. These templates will make your job of preparing presentations much quicker, yet still, maintain a high level of quality. Slidegeeks has experienced researchers who prepare these templates and write high quality content for you. Later on, you can personalize the content by editing the Dashboard To Assess Ecommerce Financial Performance Across Regions Themes PDF.
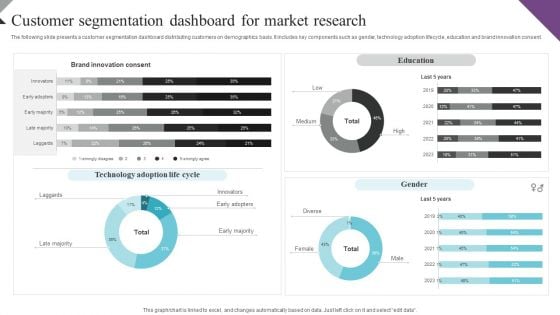
Customer Segmentation And Behavioral Analysis Customer Segmentation Dashboard Designs PDF
The following slide presents a customer segmentation dashboard distributing customers on demographics basis. It includes key components such as gender, technology adoption lifecycle, education and brand innovation consent. If you are looking for a format to display your unique thoughts, then the professionally designed Customer Segmentation And Behavioral Analysis Customer Segmentation Dashboard Designs PDF is the one for you. You can use it as a Google Slides template or a PowerPoint template. Incorporate impressive visuals, symbols, images, and other charts. Modify or reorganize the text boxes as you desire. Experiment with shade schemes and font pairings. Alter, share or cooperate with other people on your work. Download Customer Segmentation And Behavioral Analysis Customer Segmentation Dashboard Designs PDF and find out how to give a successful presentation. Present a perfect display to your team and make your presentation unforgettable.

The Digital Project Managers Project Change Management Kpi Dashboard
This slide represents KPI dashboard to effectively track and monitor effectiveness of changes implemented in organizational projects. It includes details related to KPIs such as changes investigated, submitted, approved, declined, etc. This The Digital Project Managers Project Change Management Kpi Dashboard from Slidegeeks makes it easy to present information on your topic with precision. It provides customization options, so you can make changes to the colors, design, graphics, or any other component to create a unique layout. It is also available for immediate download, so you can begin using it right away. Slidegeeks has done good research to ensure that you have everything you need to make your presentation stand out. Make a name out there for a brilliant performance. This slide represents KPI dashboard to effectively track and monitor effectiveness of changes implemented in organizational projects. It includes details related to KPIs such as changes investigated, submitted, approved, declined, etc.
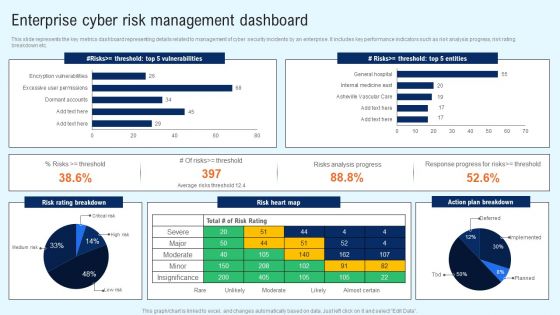
Implementing Cyber Security Incident Enterprise Cyber Risk Dashboard Professional PDF
This slide represents the key metrics dashboard representing details related to management of cyber security incidents by an enterprise. It includes key performance indicators such as risk analysis progress, risk rating breakdown etc. Do you have an important presentation coming up Are you looking for something that will make your presentation stand out from the rest Look no further than Implementing Cyber Security Incident Enterprise Cyber Risk Dashboard Professional PDF. With our professional designs, you can trust that your presentation will pop and make delivering it a smooth process. And with Slidegeeks, you can trust that your presentation will be unique and memorable. So why wait Grab Implementing Cyber Security Incident Enterprise Cyber Risk Dashboard Professional PDF today and make your presentation stand out from the rest.
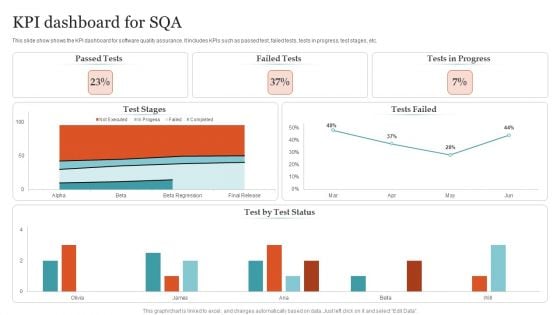
KPI Dashboard For SQA Ppt PowerPoint Presentation Gallery Structure PDF
This slide show shows the KPI dashboard for software quality assurance. It includes KPIs such as passed test, failed tests, tests in progress, test stages, etc. Pitch your topic with ease and precision using this KPI Dashboard For SQA Ppt PowerPoint Presentation Gallery Structure PDF. This layout presents information on Passed Tests, Failed Tests, Tests Progress . It is also available for immediate download and adjustment. So, changes can be made in the color, design, graphics or any other component to create a unique layout.
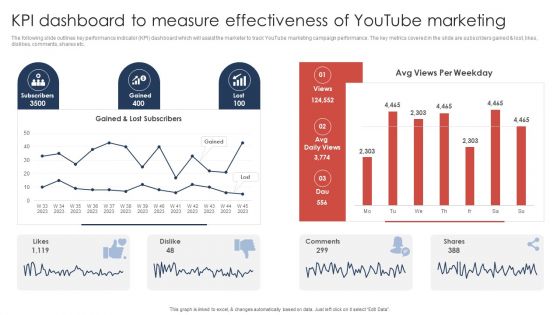
Kpi Dashboard To Measure Effectiveness Of Youtube Marketing Slides PDF
The following slide outlines key performance indicator KPI dashboard which will assist the marketer to track YouTube marketing campaign performance. The key metrics covered in the slide are subscribers gained and lost, likes, dislikes, comments, shares etc. Do you have an important presentation coming up Are you looking for something that will make your presentation stand out from the rest Look no further than Kpi Dashboard To Measure Effectiveness Of Youtube Marketing Slides PDF. With our professional designs, you can trust that your presentation will pop and make delivering it a smooth process. And with Slidegeeks, you can trust that your presentation will be unique and memorable. So why wait Grab Kpi Dashboard To Measure Effectiveness Of Youtube Marketing Slides PDF today and make your presentation stand out from the rest.
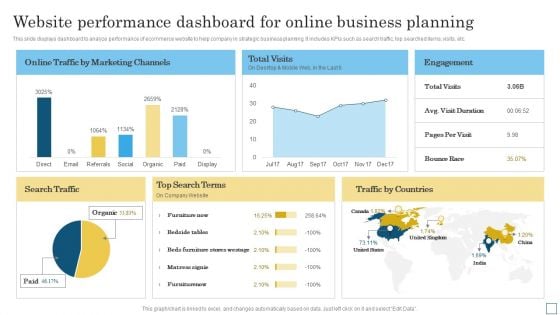
Website Performance Dashboard For Online Business Planning Graphics PDF
This slide displays dashboard to analyze performance of ecommerce website to help company in strategic business planning. It includes KPIs such as search traffic, top searched items, visits, etc. Showcasing this set of slides titled Website Performance Dashboard For Online Business Planning Graphics PDF. The topics addressed in these templates are Marketing Channels, Bounce Race, Search Traffic. All the content presented in this PPT design is completely editable. Download it and make adjustments in color, background, font etc. as per your unique business setting.
Work From Home Performance Management Dashboard Icons PDF
The following slide outlines a comprehensive key performance indicator KPI dashboard that can be used to showcase employees performance during work from home WFH. Information covered in this slide is related to average result area scores etc. Do you have to make sure that everyone on your team knows about any specific topic. I yes, then you should give Work From Home Performance Management Dashboard Icons PDF a try. Our experts have put a lot of knowledge and effort into creating this impeccable Work From Home Performance Management Dashboard Icons PDF. You can use this template for your upcoming presentations, as the slides are perfect to represent even the tiniest detail. You can download these templates from the Slidegeeks website and these are easy to edit. So grab these today.
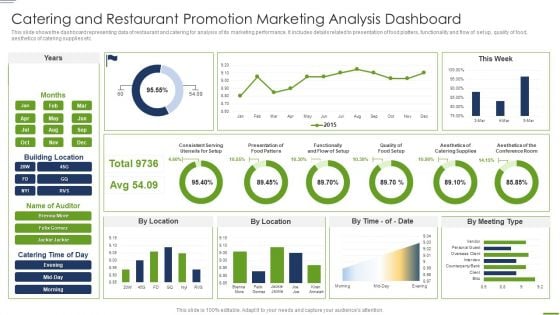
Catering And Restaurant Promotion Marketing Analysis Dashboard Graphics PDF
This slide shows the dashboard representing data of restaurant and catering for analysis of its marketing performance. It includes details related to presentation of food platters, functionality and flow of set up, quality of food, aesthetics of catering supplies etc.Showcasing this set of slides titled Catering And Restaurant Promotion Marketing Analysis Dashboard Graphics PDF The topics addressed in these templates are Consistent Serving, Functionally, Quality Food All the content presented in this PPT design is completely editable. Download it and make adjustments in color, background, font etc. as per your unique business setting.
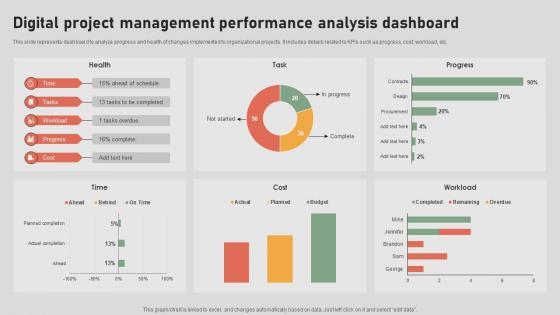
The Digital Project Managers Digital Project Management Performance Analysis Dashboard
This slide represents dashboard to analyze progress and health of changes implemented to organizational projects. It includes details related to KPIs such as progress, cost, workload, etc. Are you in need of a template that can accommodate all of your creative concepts This one is crafted professionally and can be altered to fit any style. Use it with Google Slides or PowerPoint. Include striking photographs, symbols, depictions, and other visuals. Fill, move around, or remove text boxes as desired. Test out color palettes and font mixtures. Edit and save your work, or work with colleagues. Download The Digital Project Managers Digital Project Management Performance Analysis Dashboard and observe how to make your presentation outstanding. Give an impeccable presentation to your group and make your presentation unforgettable. This slide represents dashboard to analyze progress and health of changes implemented to organizational projects. It includes details related to KPIs such as progress, cost, workload, etc.
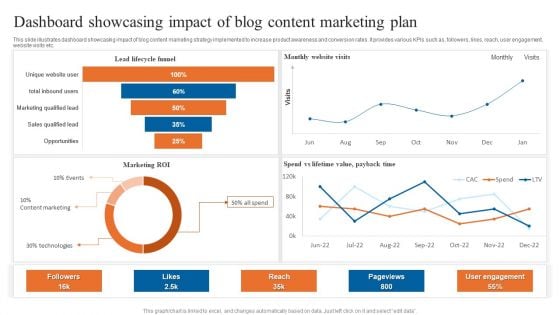
Dashboard Showcasing Impact Of Blog Content Marketing Plan Summary PDF
This slide illustrates dashboard showcasing impact of blog content marketing strategy implemented to increase product awareness and conversion rates. It provides various KPIs such as, followers, likes, reach, user engagement, website visits etc. Pitch your topic with ease and precision using this Dashboard Showcasing Impact Of Blog Content Marketing Plan Summary PDF. This layout presents information on User Engagement, Monthly Website Visits, Spend Lifetime Value, Payback Time. It is also available for immediate download and adjustment. So, changes can be made in the color, design, graphics or any other component to create a unique layout.
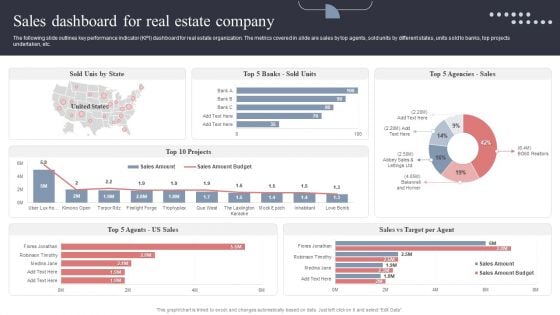
Sales Dashboard For Real Estate Company Topics PDF
The following slide outlines key performance indicator KPI dashboard for real estate organization. The metrics covered in slide are sales by top agents, sold units by different states, units sold to banks, top projects undertaken, etc. This Sales Dashboard For Real Estate Company Topics PDF is perfect for any presentation, be it in front of clients or colleagues. It is a versatile and stylish solution for organizing your meetings. The Sales Dashboard For Real Estate Company Topics PDF features a modern design for your presentation meetings. The adjustable and customizable slides provide unlimited possibilities for acing up your presentation. Slidegeeks has done all the homework before launching the product for you. So, do not wait, grab the presentation templates today
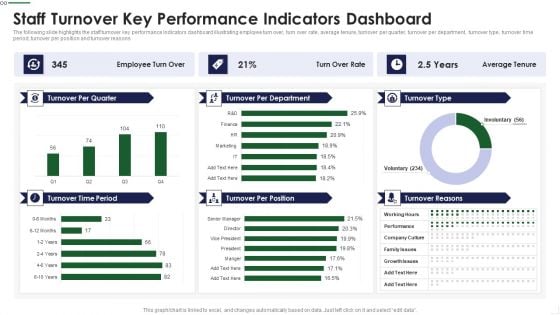
Staff Turnover Key Performance Indicators Dashboard Sample PDF
The following slide highlights the staff turnover key performance Indicators dashboard illustrating employee turn over, turn over rate, average tenure, turnover per quarter, turnover per department, turnover type, turnover time period, turnover per position and turnover reasons Deliver and pitch your topic in the best possible manner with this Staff Turnover Key Performance Indicators Dashboard Sample PDF Use them to share invaluable insights on Management Goals, Subjective Appraisal, Product Defects and impress your audience. This template can be altered and modified as per your expectations. So, grab it now.


 Continue with Email

 Home
Home


