Program Dashboard
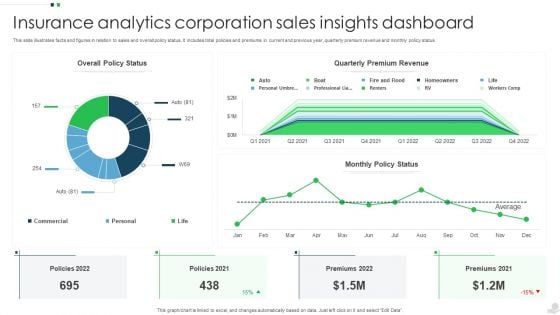
Insurance Analytics Corporation Sales Insights Dashboard Structure PDF
This slide illustrates facts and figures in relation to sales and overall policy status. It includes total policies and premiums in current and previous year, quarterly premium revenue and monthly policy status. Pitch your topic with ease and precision using this Insurance Analytics Corporation Sales Insights Dashboard Structure PDF. This layout presents information on Quarterly Premium Revenue, Sales Insights Dashboard, Insurance Analytics Corporation. It is also available for immediate download and adjustment. So, changes can be made in the color, design, graphics or any other component to create a unique layout.
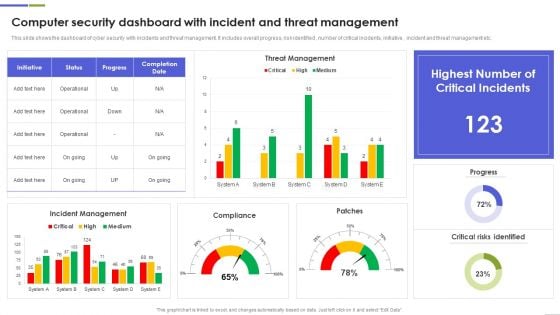
Computer Security Dashboard With Incident And Threat Management Rules PDF
This slide shows the dashboard of cyber security with incidents and threat management. It includes overall progress, risk identified , number of critical incidents, initiative , incident and threat management etc.Showcasing this set of slides titled Computer Security Dashboard With Incident And Threat Management Rules PDF The topics addressed in these templates are Critical Incidents, Risks Identified, Compliance All the content presented in this PPT design is completely editable. Download it and make adjustments in color, background, font etc. as per your unique business setting.
Weekly Tracking Dashboard For Social Media Content Inspiration PDF
This slide showcases weekly content tracking dashboard that can help organization to track the statistics of social media blogs and videos. Its key components are avg impressions per post, avg reach per post, avg engagement rate and avg click through rate.Showcasing this set of slides titled Weekly Tracking Dashboard For Social Media Content Inspiration PDF The topics addressed in these templates are Impressions Per, Impression On Facebook, Posts Reactions All the content presented in this PPT design is completely editable. Download it and make adjustments in color, background, font etc. as per your unique business setting.
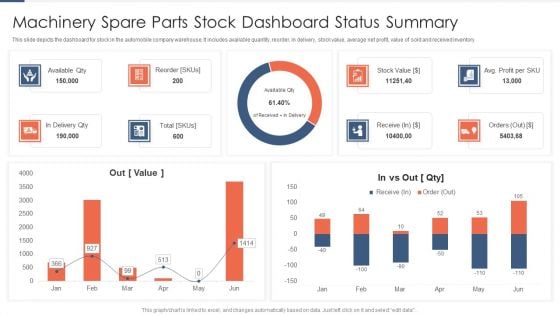
Machinery Spare Parts Stock Dashboard Status Summary Topics PDF
This slide depicts the dashboard for stock in the automobile company warehouse. It includes available quantity, reorder, in delivery, stock value, average net profit, value of sold and received inventory. Pitch your topic with ease and precision using this Machinery Spare Parts Stock Dashboard Status Summary Topics PDF. This layout presents information on Available Qty, Delivery Qty, Reorder. It is also available for immediate download and adjustment. So, changes can be made in the color, design, graphics or any other component to create a unique layout.
HR Dashboard To Tackle Low Output Icons PDF
This slide depicts the dashboard used by human resource management to track employee productivity rate and identify bottlenecks in performance. It includes status of tickets, occupancy and resolution rate, net promoter score and track of agents solving tickets. Showcasing this set of slides titled HR Dashboard To Tackle Low Output Icons PDF. The topics addressed in these templates are Resolution Rate, Occupancy Rate, Net Promoter Score. All the content presented in this PPT design is completely editable. Download it and make adjustments in color, background, font etc. as per your unique business setting.
Marketing And Operations Dashboard For Ecommerce Business Icons PDF
This slide covers sales and operations dashboard for ecommerce business. It involves details such as total sales generated, number of brands, total revenue generated, number of units sold and gender and age range breakdown. Showcasing this set of slides titled Marketing And Operations Dashboard For Ecommerce Business Icons PDF. The topics addressed in these templates are Total Sales Generated, Total Revenue Generated, Returning Consumers. All the content presented in this PPT design is completely editable. Download it and make adjustments in color, background, font etc. as per your unique business setting.
Marketing And Operations Dashboard For Performance Management Icons PDF
This slide covers sales and operation dashboard for performance management. It involves details such as number of new buyers, sales revenue, average revenue per unit etc. Pitch your topic with ease and precision using this Marketing And Operations Dashboard For Performance Management Icons PDF. This layout presents information on Average Revenue Per Unit, Customer Acquisition Cost, Customer Lifetime Value. It is also available for immediate download and adjustment. So, changes can be made in the color, design, graphics or any other component to create a unique layout.

Marketing And Operations Dashboard To Drive Effective Productivity Background PDF
This slide covers sales and operations dashboard to drive effective productivity. It involves details such as number of account assigned, working accounts, engaged accounts and total account activity. Pitch your topic with ease and precision using this Marketing And Operations Dashboard To Drive Effective Productivity Background PDF. This layout presents information on Total Account Activity, Number Of Working Account, Engaged Account. It is also available for immediate download and adjustment. So, changes can be made in the color, design, graphics or any other component to create a unique layout.
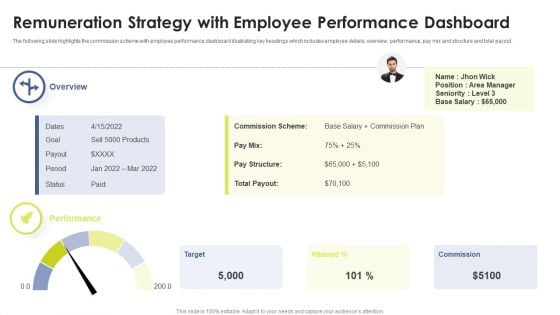
Remuneration Strategy With Employee Performance Dashboard Ppt Styles Themes PDF
The following slide highlights the commission scheme with employee performance dashboard illustrating key headings which includes employee details, overview, performance, pay mix and structure and total payout. Persuade your audience using this Remuneration Strategy With Employee Performance Dashboard Ppt Styles Themes PDF. This PPT design covers one stages, thus making it a great tool to use. It also caters to a variety of topics including Target, Attained, Commission. Download this PPT design now to present a convincing pitch that not only emphasizes the topic but also showcases your presentation skills.
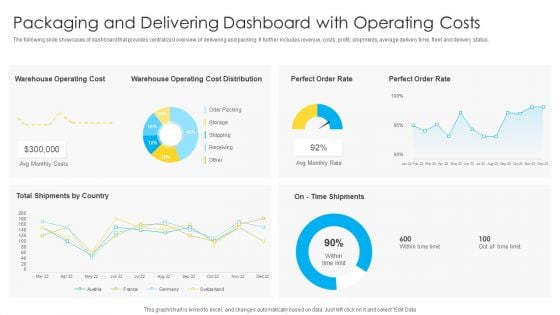
Packaging And Delivering Dashboard With Operating Costs Topics PDF
The following slide showcases of dashboard that provides centralized overview of delivering and packing. It further includes revenue, costs, profit, shipments, average delivery time, fleet and delivery status. Showcasing this set of slides titled Packaging And Delivering Dashboard With Operating Costs Topics PDF. The topics addressed in these templates are Warehouse Operating Cost, Perfect Order Rate, Avg Monthly Costs. All the content presented in this PPT design is completely editable. Download it and make adjustments in color, background, font etc. as per your unique business setting.
KPI Dashboard For Tracking Supply Chain Costs Inspiration PDF
This slide represents the KPI dashboard to track the multiple cost associated with supply chain in food manufacturing industry. It includes information regarding cash to cash cycle in days, carry cost of inventory along with details of net sales. Deliver an awe inspiring pitch with this creative KPI Dashboard For Tracking Supply Chain Costs Inspiration PDF bundle. Topics like Supply Chain Costs, Average Cash, Service can be discussed with this completely editable template. It is available for immediate download depending on the needs and requirements of the user.
Gross Profit Margin Dashboard With Revenue Vs Expenses Icons PDF
This slide showcases dashboard that can help organization to evaluate the revenue generated and expenses incurred in conducting operations. It also showcases gross profit and margin of last financial year. Pitch your topic with ease and precision using this Gross Profit Margin Dashboard With Revenue Vs Expenses Icons PDF. This layout presents information on Gross Profit Margin, EBITDA Margin, Net Profit Margin. It is also available for immediate download and adjustment. So, changes can be made in the color, design, graphics or any other component to create a unique layout.
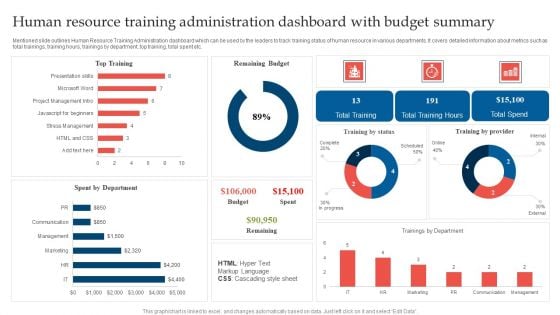
Human Resource Training Administration Dashboard With Budget Summary Microsoft PDF
Mentioned slide outlines Human Resource Training Administration dashboard which can be used by the leaders to track training status of human resource in various departments. It covers detailed information about metrics such as total trainings, training hours, trainings by department, top training, total spent etc. Showcasing this set of slides titled Human Resource Training Administration Dashboard With Budget Summary Microsoft PDF. The topics addressed in these templates are Remaining Budget, Top Training, Spent Department. All the content presented in this PPT design is completely editable. Download it and make adjustments in color, background, font etc. as per your unique business setting.
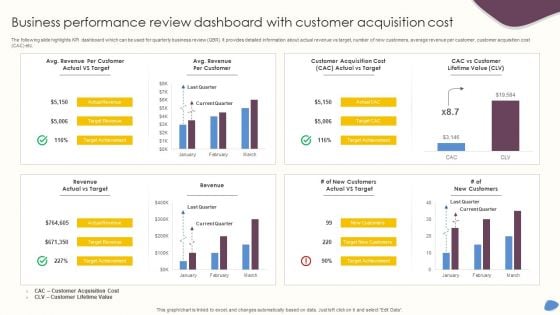
Business Performance Review Dashboard With Customer Acquisition Cost Diagrams PDF
The following slide highlights KPI dashboard which can be used for quarterly business review QBR. It provides detailed information about actual revenue vs target, number of new customers, average revenue per customer, customer acquisition cost CAC etc. Pitch your topic with ease and precision using this Business Performance Review Dashboard With Customer Acquisition Cost Diagrams PDF. This layout presents information on Revenue, Customer Acquisition Cost, Current Quarter. It is also available for immediate download and adjustment. So, changes can be made in the color, design, graphics or any other component to create a unique layout.
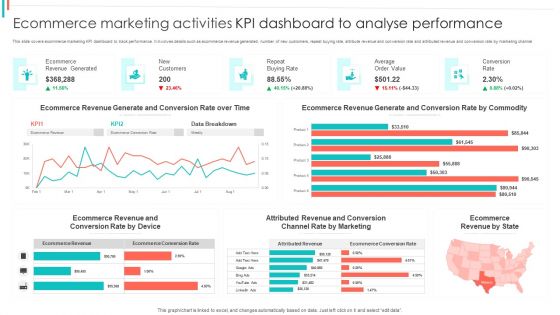
Ecommerce Marketing Activities KPI Dashboard To Analyse Performance Guidelines PDF
This slide covers ecommerce marketing KPI dashboard to track performance. It involves details such as ecommerce revenue generated, number of new customers, repeat buying rate, attribute revenue and conversion rate and attributed revenue and conversion rate by marketing channel.Pitch your topic with ease and precision using this Ecommerce Marketing Activities KPI Dashboard To Analyse Performance Guidelines PDF. This layout presents information on Revenue Generated, Ecommerce Revenue, Generate Conversion. It is also available for immediate download and adjustment. So, changes can be made in the color, design, graphics or any other component to create a unique layout.
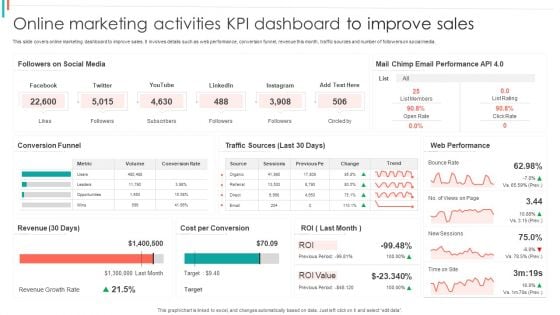
Online Marketing Activities KPI Dashboard To Improve Sales Ideas PDF
This slide covers online marketing dashboard to improve sales. It involves details such as web performance, conversion funnel, revenue this month, traffic sources and number of followers on social media.Pitch your topic with ease and precision using this Online Marketing Activities KPI Dashboard To Improve Sales Ideas PDF. This layout presents information on Email Performance, Web Performance, Cost Conversion. It is also available for immediate download and adjustment. So, changes can be made in the color, design, graphics or any other component to create a unique layout.
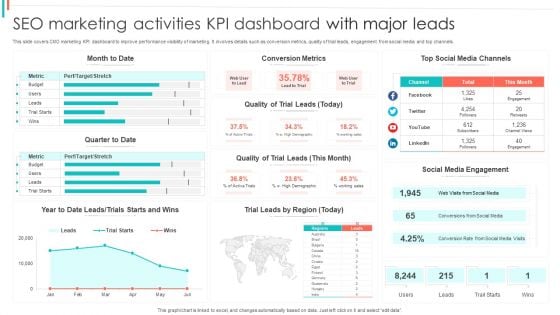
SEO Marketing Activities KPI Dashboard With Major Leads Formats PDF
This slide covers CMO marketing KPI dashboard to improve performance visibility of marketing. It involves details such as conversion metrics, quality of trial leads, engagement from social media and top channels.Showcasing this set of slides titled SEO Marketing Activities KPI Dashboard With Major Leads Formats PDF. The topics addressed in these templates are Conversion Metrics, Media Engagement, Conversion Rate. All the content presented in this PPT design is completely editable. Download it and make adjustments in color, background, font etc. as per your unique business setting.
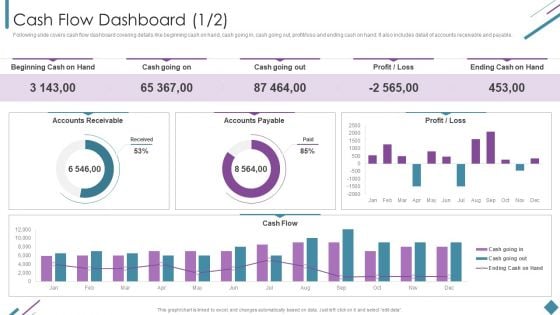
Metrics To Measure Business Performance Cash Flow Dashboard Rules PDF
Following slide covers cash flow dashboard covering details like beginning cash on hand, cash going in, cash going out, profit or loss and ending cash on hand. It also includes detail of accounts receivable and payable. Deliver an awe inspiring pitch with this creative Metrics To Measure Business Performance Cash Flow Dashboard Rules PDF bundle. Topics like Beginning Cash Hand, Cash Going Out, Accounts Payable, Accounts Receivable can be discussed with this completely editable template. It is available for immediate download depending on the needs and requirements of the user.
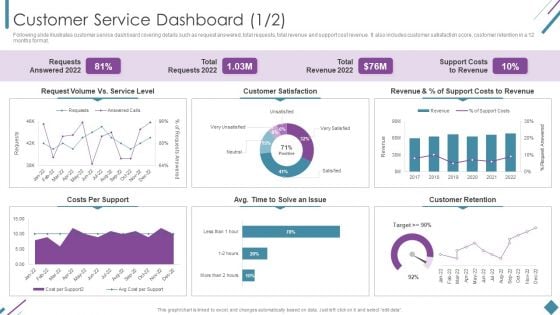
Metrics To Measure Business Performance Customer Service Dashboard Sample PDF
Following slide illustrates customer service dashboard covering details such as request answered, total requests, total revenue and support cost revenue. It also includes customer satisfaction score, customer retention in a 12 months format. Deliver and pitch your topic in the best possible manner with this Metrics To Measure Business Performance Customer Service Dashboard Sample PDF. Use them to share invaluable insights on Requests Answered 2022, Total Requests 2022, Total Revenue 2022 and impress your audience. This template can be altered and modified as per your expectations. So, grab it now.
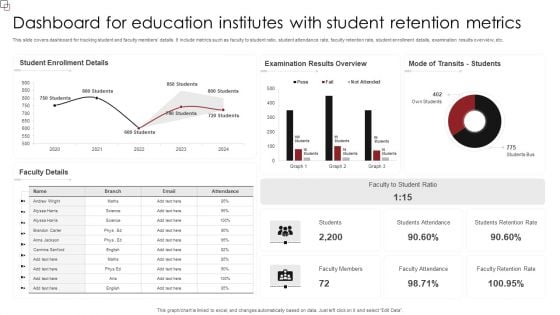
Dashboard For Education Institutes With Student Retention Metrics Slides PDF
This slide covers dashboard for tracking student and faculty members details. It include metrics such as faculty to student ratio, student attendance rate, faculty retention rate, student enrollment details, examination results overview, etc. Showcasing this set of slides titled Dashboard For Education Institutes With Student Retention Metrics Slides PDF. The topics addressed in these templates are Student Enrollment Details, Examination Results Overview, Faculty Student Ratio. All the content presented in this PPT design is completely editable. Download it and make adjustments in color, background, font etc. as per your unique business setting.
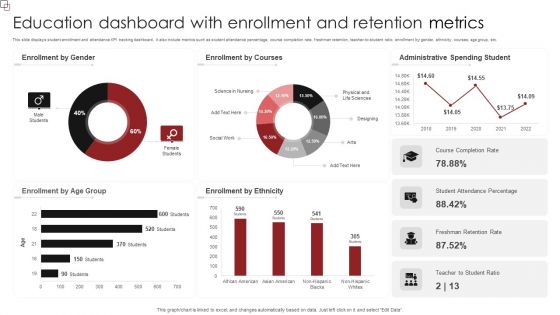
Education Dashboard With Enrollment And Retention Metrics Sample PDF
This slide displays student enrollment and attendance KPI tracking dashboard. It also include metrics such as student attendance percentage, course completion rate, freshman retention, teacher-to-student ratio, enrollment by gender, ethnicity, courses, age group, etc. Pitch your topic with ease and precision using this Education Dashboard With Enrollment And Retention Metrics Sample PDF. This layout presents information on Enrollment Gender, Enrollment Courses, Administrative Spending Student. It is also available for immediate download and adjustment. So, changes can be made in the color, design, graphics or any other component to create a unique layout.
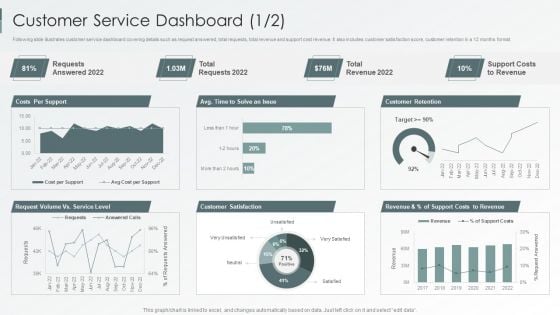
Enterprise Sustainability Performance Metrics Customer Service Dashboard Professional PDF
Following slide illustrates customer service dashboard covering details such as request answered, total requests, total revenue and support cost revenue. It also includes customer satisfaction score, customer retention in a 12 months format.Deliver and pitch your topic in the best possible manner with this Enterprise Sustainability Performance Metrics Customer Service Dashboard Professional PDF. Use them to share invaluable insights on Customer Satisfaction, Customer Retention, Support Revenue and impress your audience. This template can be altered and modified as per your expectations. So, grab it now.
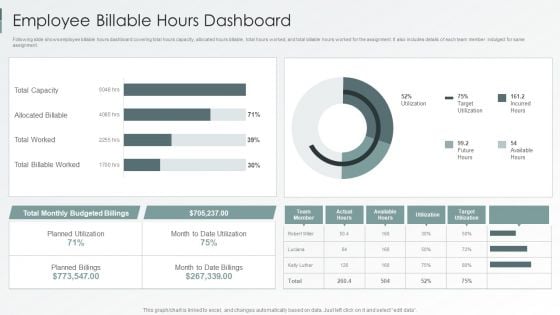
Enterprise Sustainability Performance Metrics Employee Billable Hours Dashboard Information PDF
Following slide shows employee billable hours dashboard covering total hours capacity, allocated hours billable, total hours worked, and total billable hours worked for the assignment. It also includes details of each team member indulged for same assignment.Deliver an awe inspiring pitch with this creative Enterprise Sustainability Performance Metrics Employee Billable Hours Dashboard Information PDF bundle. Topics like Billable Worked, Allocated Billable, Total Capacity can be discussed with this completely editable template. It is available for immediate download depending on the needs and requirements of the user.
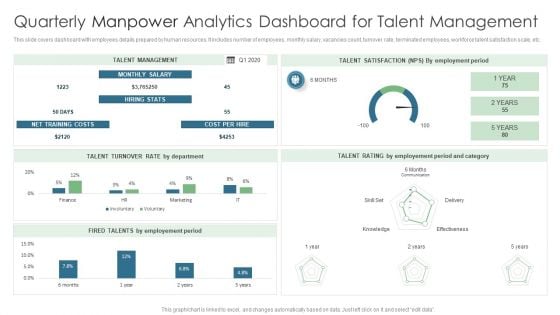
Quarterly Manpower Analytics Dashboard For Talent Management Infographics PDF
This slide covers dashboard with employees details prepared by human resources. It includes number of employees, monthly salary, vacancies count, turnover rate, terminated employees, workforce talent satisfaction scale, etc. Showcasing this set of slides titled Quarterly Manpower Analytics Dashboard For Talent Management Infographics PDF. The topics addressed in these templates are Talent Management, Cost Per Hire, Net Training Costs. All the content presented in this PPT design is completely editable. Download it and make adjustments in color, background, font etc. as per your unique business setting.
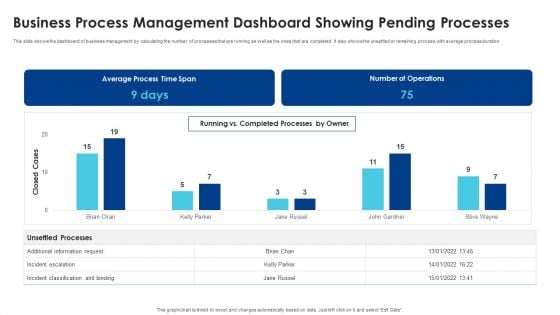
Business Process Management Dashboard Showing Pending Processes Graphics PDF
This slide shows the dashboard of business management by calculating the number of processes that are running as well as the ones that are completed. It also shows the unsettled or remaining process with average process duration. Showcasing this set of slides titled Business Process Management Dashboard Showing Pending Processes Graphics PDF. The topics addressed in these templates are Average Process, Time Span, Number Operations. All the content presented in this PPT design is completely editable. Download it and make adjustments in color, background, font etc. as per your unique business setting.
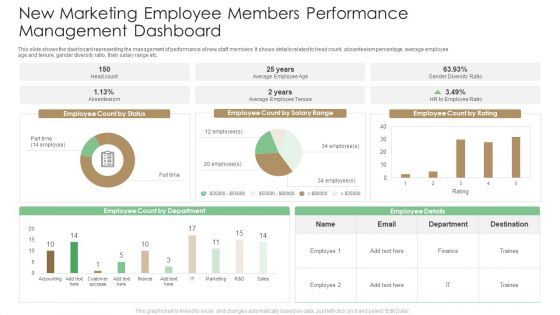
New Marketing Employee Members Performance Management Dashboard Summary PDF
This slide shows the dashboard representing the management of performance of new staff members. It shows details related to head count, absenteeism percentage, average employee age and tenure, gender diversity ratio, their salary range etc. Pitch your topic with ease and precision using this New Marketing Employee Members Performance Management Dashboard Summary PDF. This layout presents information on Employee Ratio, Average Employee Tenure. It is also available for immediate download and adjustment. So, changes can be made in the color, design, graphics or any other component to create a unique layout.
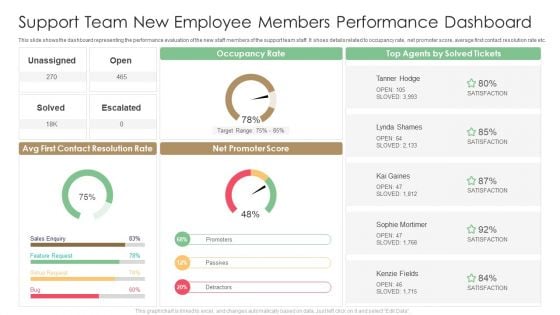
Support Team New Employee Members Performance Dashboard Designs PDF
This slide shows the dashboard representing the performance evaluation of the new staff members of the support team staff. It shoes details related to occupancy rate, net promoter score, average first contact resolution rate etc. Pitch your topic with ease and precision using this Support Team New Employee Members Performance Dashboard Designs PDF. This layout presents information on Target Range, Occupancy Rate, Contact Resolution Rate. It is also available for immediate download and adjustment. So, changes can be made in the color, design, graphics or any other component to create a unique layout.
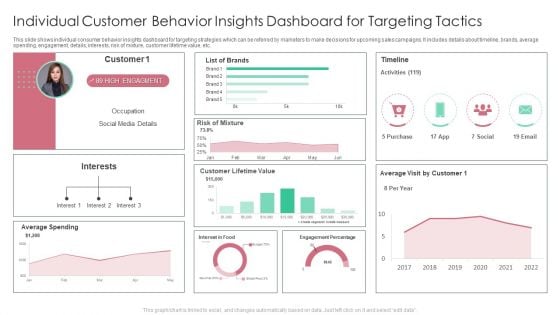
Individual Customer Behavior Insights Dashboard For Targeting Tactics Slides PDF
This slide shows individual consumer behavior insights dashboard for targeting strategies which can be referred by marketers to make decisions for upcoming sales campaigns. It includes details about timeline, brands, average spending, engagement, details, interests, risk of mixture, customer lifetime value, etc. Showcasing this set of slides titled Individual Customer Behavior Insights Dashboard For Targeting Tactics Slides PDF. The topics addressed in these templates are Customer, Timeline, Interests. All the content presented in this PPT design is completely editable. Download it and make adjustments in color, background, font etc. as per your unique business setting.
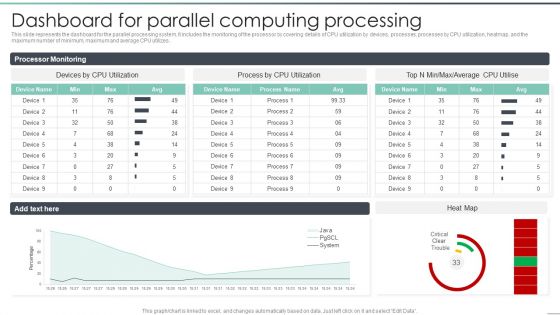
Parallel Computing Processing Dashboard For Parallel Computing Processing Template PDF
This slide represents the dashboard for the parallel processing system. It includes the monitoring of the processor by covering details of CPU utilization by devices, processes, processes by CPU utilization, heatmap, and the maximum number of minimum, maximum and average CPU utilizes. Deliver an awe inspiring pitch with this creative Parallel Computing Processing Dashboard For Parallel Computing Processing Template PDF bundle. Topics like Average, Processor Monitoring, Device can be discussed with this completely editable template. It is available for immediate download depending on the needs and requirements of the user.
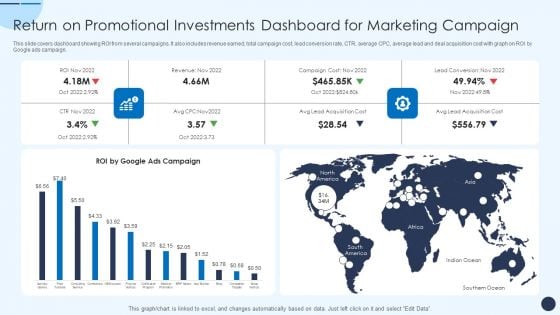
Return On Promotional Investments Dashboard For Marketing Campaign Pictures PDF
This slide covers dashboard showing ROI from several campaigns. It also includes revenue earned, total campaign cost, lead conversion rate, CTR, average CPC, average lead and deal acquisition cost with graph on ROI by Google ads campaign.Showcasing this set of slides titled Return On Promotional Investments Dashboard For Marketing Campaign Pictures PDF. The topics addressed in these templates are Campaign Cost, Lead Conversion, Acquisition Cost. All the content presented in this PPT design is completely editable. Download it and make adjustments in color, background, font etc. as per your unique business setting.
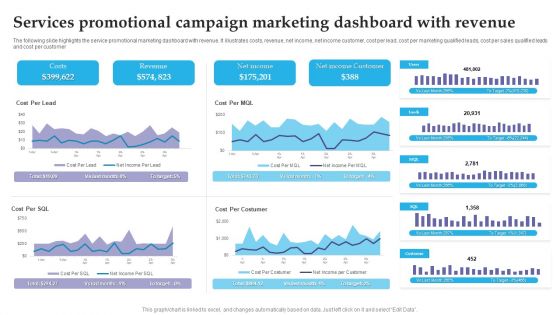
Services Promotional Campaign Marketing Dashboard With Revenue Brochure PDF
The following slide highlights the service promotional marketing dashboard with revenue. It illustrates costs, revenue, net income, net income customer, cost per lead, cost per marketing qualified leads, cost per sales qualified leads and cost per customer. Pitch your topic with ease and precision using this Services Promotional Campaign Marketing Dashboard With Revenue Brochure PDF. This layout presents information on Costs, Revenue, Net Income. It is also available for immediate download and adjustment. So, changes can be made in the color, design, graphics or any other component to create a unique layout.
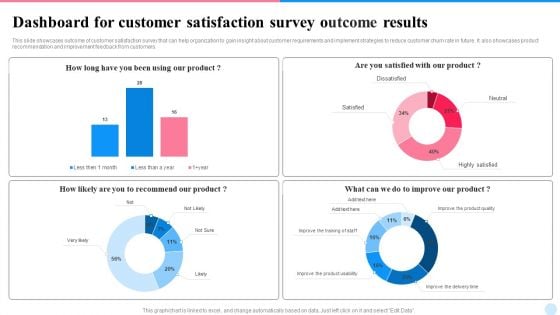
Dashboard For Customer Satisfaction Survey Outcome Results Topics PDF
This slide showcases outcome of customer satisfaction survey that can help organization to gain insight about customer requirements and implement strategies to reduce customer churn rate in future. It also showcases product recommendation and improvement feedback from customers. Pitch your topic with ease and precision using this Dashboard For Customer Satisfaction Survey Outcome Results Topics PDF. This layout presents information on Dashboard, Customer Satisfaction, Survey Outcome Results. It is also available for immediate download and adjustment. So, changes can be made in the color, design, graphics or any other component to create a unique layout.
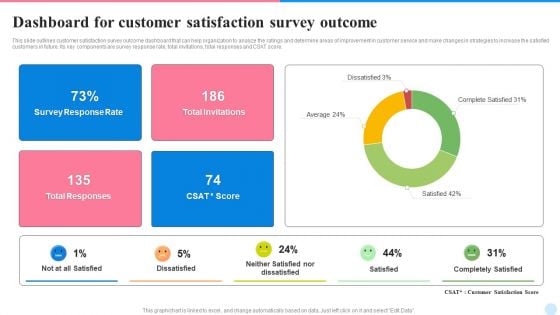
Dashboard For Customer Satisfaction Survey Outcome Demonstration PDF
This slide outlines customer satisfaction survey outcome dashboard that can help organization to analyze the ratings and determine areas of improvement in customer service and make changes in strategies to increase the satisfied customers in future. Its key components are survey response rate, total invitations, total responses and CSAT score. Showcasing this set of slides titled Dashboard For Customer Satisfaction Survey Outcome Demonstration PDF. The topics addressed in these templates are Total Invitations, Survey Response Rate, Total Responses. All the content presented in this PPT design is completely editable. Download it and make adjustments in color, background, font etc. as per your unique business setting.
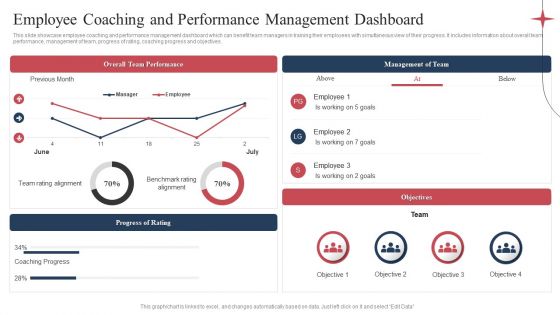
Employee Coaching And Performance Management Dashboard Microsoft PDF
This slide showcase employee coaching and performance management dashboard which can benefit team managers in training their employees with simultaneous view of their progress. It includes information about overall team performance, management of team, progress of rating, coaching progress and objectives. Showcasing this set of slides titled Employee Coaching And Performance Management Dashboard Microsoft PDF. The topics addressed in these templates are Overall Team Performance, Management Of Team, Objectives, Progress Of Rating. All the content presented in this PPT design is completely editable. Download it and make adjustments in color, background, font etc. as per your unique business setting.
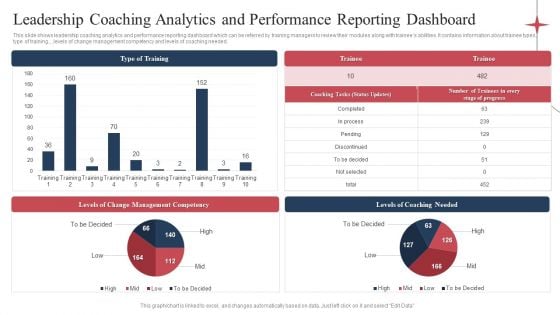
Leadership Coaching Analytics And Performance Reporting Dashboard Demonstration PDF
This slide shows leadership coaching analytics and performance reporting dashboard which can be referred by training managers to review their modules along with trainees abilities. It contains information about trainee types, type of training., ,levels of change management competency and levels of coaching needed. Pitch your topic with ease and precision using this Leadership Coaching Analytics And Performance Reporting Dashboard Demonstration PDF. This layout presents information on Levels Coaching Needed, Levels Change Management, Type Training. It is also available for immediate download and adjustment. So, changes can be made in the color, design, graphics or any other component to create a unique layout.
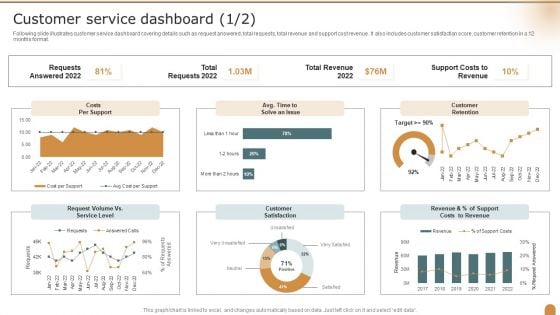
Customer Service Dashboard Company Performance Evaluation Using KPI Themes PDF
Following slide illustrates customer service dashboard covering details such as request answered, total requests, total revenue and support cost revenue. It also includes customer satisfaction score, customer retention in a 12 months format. Deliver and pitch your topic in the best possible manner with this Customer Service Dashboard Company Performance Evaluation Using KPI Themes PDF. Use them to share invaluable insights on Requests Answered, Total Revenue, Customer Retention and impress your audience. This template can be altered and modified as per your expectations. So, grab it now.
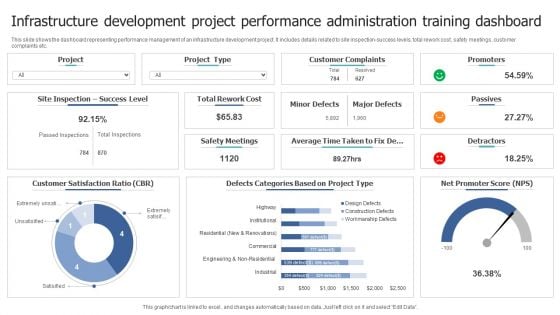
Infrastructure Development Project Performance Administration Training Dashboard Professional PDF
This slide shows the dashboard representing performance management of an infrastructure development project. It includes details related to site inspection success levels, total rework cost, safety meetings, customer complaints etc. Showcasing this set of slides titled Infrastructure Development Project Performance Administration Training Dashboard Professional PDF. The topics addressed in these templates are Customer Satisfaction Ratio, Customer Complaints, Rework Cost. All the content presented in this PPT design is completely editable. Download it and make adjustments in color, background, font etc. as per your unique business setting.
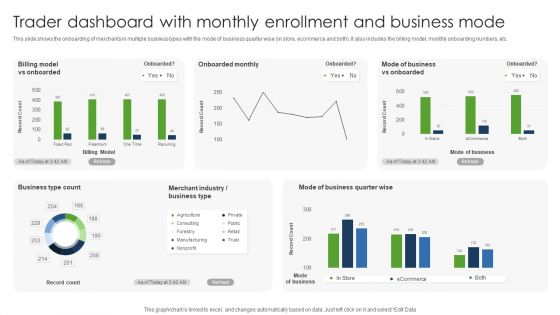
Trader Dashboard With Monthly Enrollment And Business Mode Professional PDF
This slide shows the onboarding of merchants in multiple business types with the mode of business quarter wise in store, ecommerce and both. It also includes the billing model, monthly onboarding numbers, etc. Showcasing this set of slides titled Trader Dashboard With Monthly Enrollment And Business Mode Professional PDF. The topics addressed in these templates are Monthly Enrollment, Business Mode, Trader Dashboard. All the content presented in this PPT design is completely editable. Download it and make adjustments in color, background, font etc. as per your unique business setting.
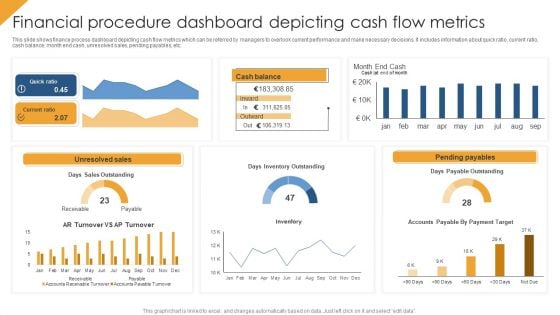
Financial Procedure Dashboard Depicting Cash Flow Metrics Structure PDF
This slide shows finance process dashboard depicting cash flow metrics which can be referred by managers to overlook current performance and make necessary decisions. It includes information about quick ratio, current ratio, cash balance, month end cash, unresolved sales, pending payables, etc. Pitch your topic with ease and precision using this Financial Procedure Dashboard Depicting Cash Flow Metrics Structure PDF. This layout presents information on Quick Ratio, Unresolved Sales, Pending Payables. It is also available for immediate download and adjustment. So, changes can be made in the color, design, graphics or any other component to create a unique layout.
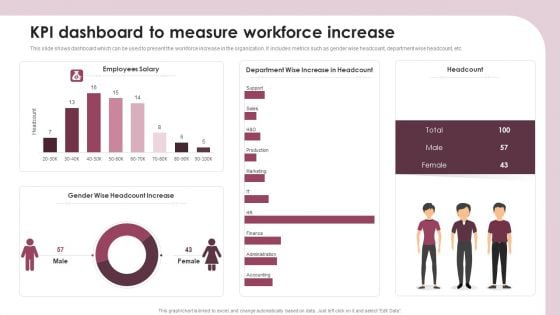
KPI Dashboard To Measure Workforce Increase Ppt Slides Elements PDF
This slide shows dashboard which can be used to present the workforce increase in the organization. It includes metrics such as gender wise headcount, department wise headcount, etc. Showcasing this set of slides titled KPI Dashboard To Measure Workforce Increase Ppt Slides Elements PDF. The topics addressed in these templates are Employees Salary, Headcount, Gender Wise, Headcount Increase. All the content presented in this PPT design is completely editable. Download it and make adjustments in color, background, font etc. as per your unique business setting.
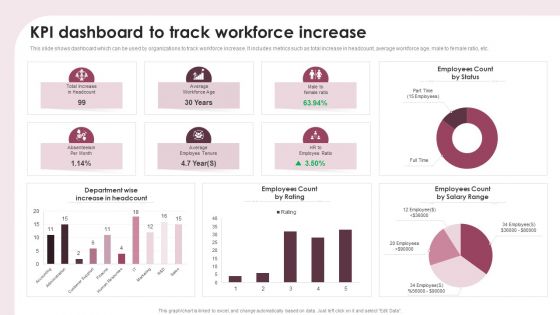
KPI Dashboard To Track Workforce Increase Ppt Show Portfolio PDF
This slide shows dashboard which can be used by organizations to track workforce increase. It includes metrics such as total increase in headcount, average workforce age, male to female ratio, etc. Pitch your topic with ease and precision using this KPI Dashboard To Track Workforce Increase Ppt Show Portfolio PDF. This layout presents information on Department Wise, Increase Headcount, Employees Count Rating. It is also available for immediate download and adjustment. So, changes can be made in the color, design, graphics or any other component to create a unique layout.
Altcoins Portfolio Tracking Metrics Dashboard Ppt Inspiration Background Images PDF
This slide covers dashboard for tracking different cryptocurrencies value and growth. It includes metrics such as incomes and expenses, market values, cryptocurrency transactions history, overall growth percentages, exchange rates, etc. Showcasing this set of slides titled Altcoins Portfolio Tracking Metrics Dashboard Ppt Inspiration Background Images PDF. The topics addressed in these templates are Balance, 3 Currencies, Transactions. All the content presented in this PPT design is completely editable. Download it and make adjustments in color, background, font etc. as per your unique business setting.
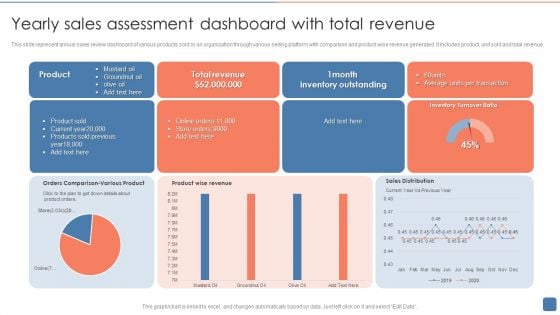
Yearly Sales Assessment Dashboard With Total Revenue Introduction PDF
This slide represent annual sales review dashboard of various products sold by an organization through various selling platform with comparison and product wise revenue generated .It includes product, unit sold and total revenue. Showcasing this set of slides titled Yearly Sales Assessment Dashboard With Total Revenue Introduction PDF. The topics addressed in these templates are Product Sold, Inventory Outstanding, Average. All the content presented in this PPT design is completely editable. Download it and make adjustments in color, background, font etc. as per your unique business setting.
Monthly Project Investment Expense Tracking KPI Dashboard Themes PDF
This slide showcases KPI dashboard for analysing the variance between billed and budgeted expenses. It also include metrics such as project budget, potential, billed, cost, margin billed vs. budget labour cost, hours details by resources, etc. Pitch your topic with ease and precision using this Monthly Project Investment Expense Tracking KPI Dashboard Themes PDF. This layout presents information on Project Summary, Sales Potential. It is also available for immediate download and adjustment. So, changes can be made in the color, design, graphics or any other component to create a unique layout.
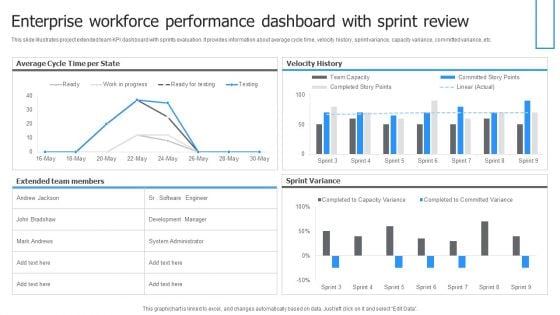
Enterprise Workforce Performance Dashboard With Sprint Review Themes PDF
This slide illustrates project extended team KPI dashboard with sprints evaluation. It provides information about average cycle time, velocity history, sprint variance, capacity variance, committed variance, etc. Showcasing this set of slides titled Enterprise Workforce Performance Dashboard With Sprint Review Themes PDF. The topics addressed in these templates are Velocity History, Sprint Variance, Average Cycle, Time Per State. All the content presented in this PPT design is completely editable. Download it and make adjustments in color, background, font etc. as per your unique business setting.
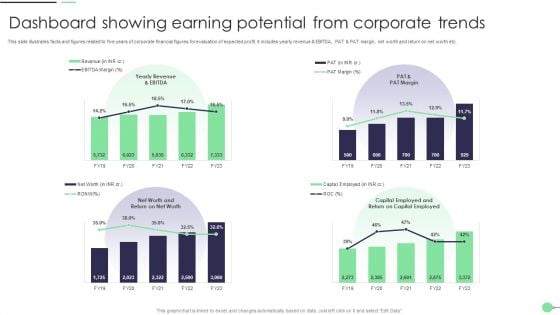
Dashboard Showing Earning Potential From Corporate Trends Demonstration PDF
This slide illustrates facts and figures related to five years of corporate financial figures for evaluation of expected profit. It includes yearly revenue and EBITDA, PAT and PAT margin, net worth and return on net worth etc. Showcasing this set of slides titled Dashboard Showing Earning Potential From Corporate Trends Demonstration PDF. The topics addressed in these templates are Potential From Corporate Trends, Dashboard Showing Earning. All the content presented in this PPT design is completely editable. Download it and make adjustments in color, background, font etc. as per your unique business setting.
Property Flipping Expenses And Profit Tracking Dashboard Ppt Good PDF
This slide covers dashboard to estimate multiple expenses incurred and profits earned by property flipping. It includes elements such repair costs, after repair value, rehab profits, purchase price, total amount of investment Made, etc. Showcasing this set of slides titled Property Flipping Expenses And Profit Tracking Dashboard Ppt Good PDF. The topics addressed in these templates are Repair Costs, Loan Amount, Down Payment. All the content presented in this PPT design is completely editable. Download it and make adjustments in color, background, font etc. as per your unique business setting.
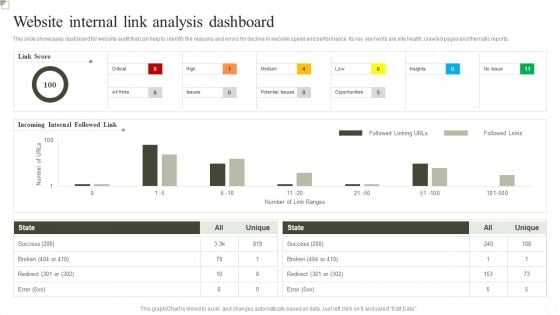
Website Internal Link Analysis Dashboard Ppt Inspiration Outline PDF
This slide showcases dashboard for website Analysis that can help to identify the reasons and errors for decline in website speed and performance. Its key elements are site health, crawled pages and thematic reports. Pitch your topic with ease and precision using this Website Internal Link Analysis Dashboard Ppt Inspiration Outline PDF. This layout presents information on Success, Incoming Internal Followed Link, Link Score. It is also available for immediate download and adjustment. So, changes can be made in the color, design, graphics or any other component to create a unique layout.
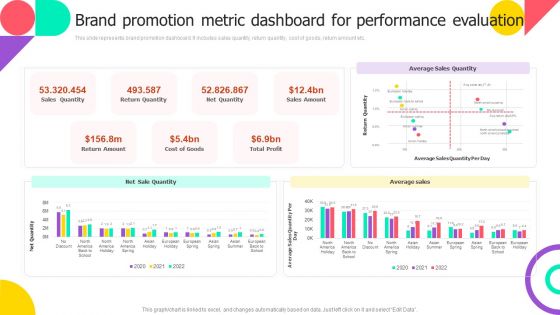
Brand Promotion Metric Dashboard For Performance Evaluation Sample PDF
This slide represents brand promotion dashboard. It includes sales quantity, return quantity, cost of goods, return amount etc. Slidegeeks is one of the best resources for PowerPoint templates. You can download easily and regulate Brand Promotion Metric Dashboard For Performance Evaluation Sample PDF for your personal presentations from our wonderful collection. A few clicks is all it takes to discover and get the most relevant and appropriate templates. Use our Templates to add a unique zing and appeal to your presentation and meetings. All the slides are easy to edit and you can use them even for advertisement purposes.

Media Of Mass Communication Marketing Campaign Assessment Dashboard Summary PDF
This slide covers mass media marketing campaign assessment KPI dashboard. It involves details such as total campaign cost, total impressions, click through rate, conversion rate and cost per click. Showcasing this set of slides titled Media Of Mass Communication Marketing Campaign Assessment Dashboard Summary PDF. The topics addressed in these templates are Total Impression, Click Through Rate, Ad Impressions, Conversions. All the content presented in this PPT design is completely editable. Download it and make adjustments in color, background, font etc. as per your unique business setting.
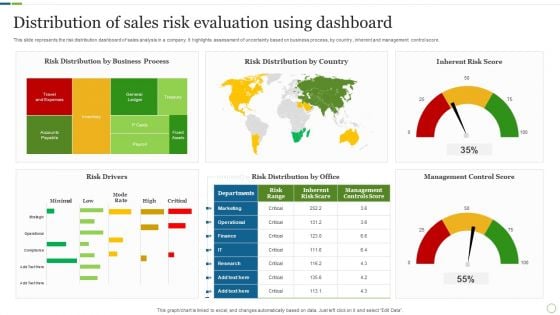
Distribution Of Sales Risk Evaluation Using Dashboard Brochure PDF
This slide represents the risk distribution dashboard of sales analysis in a company. It highlights assessment of uncertainty based on business process, by country , inherent and management control score. Showcasing this set of slides titled Distribution Of Sales Risk Evaluation Using Dashboard Brochure PDF. The topics addressed in these templates are Risk Drivers, Management Control Score, Inherent Risk Score. All the content presented in this PPT design is completely editable. Download it and make adjustments in color, background, font etc. as per your unique business setting.
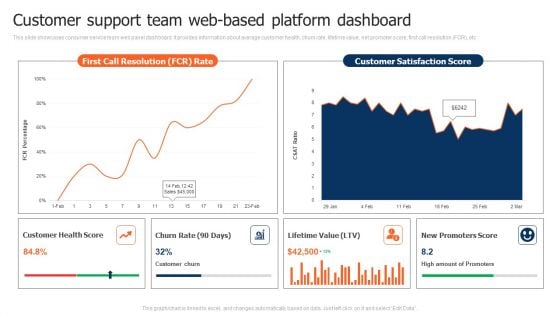
Customer Support Team Web Based Platform Dashboard Demonstration PDF
This slide showcases consumer service team web panel dashboard. It provides information about average customer health, churn rate, lifetime value, net promoter score, first call resolution FCR, etc. Pitch your topic with ease and precision using this Customer Support Team Web Based Platform Dashboard Demonstration PDF. This layout presents information on Churn Rate, Lifetime Value, Customer Health Score. It is also available for immediate download and adjustment. So, changes can be made in the color, design, graphics or any other component to create a unique layout.
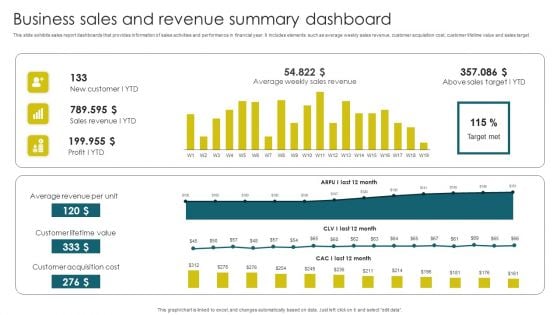
Business Sales And Revenue Summary Dashboard Brochure PDF
This slide exhibits sales report dashboards that provides information of sales activities and performance in financial year. It includes elements such as average weekly sales revenue, customer acquisition cost, customer lifetime value and sales target. Pitch your topic with ease and precision using this Business Sales And Revenue Summary Dashboard Brochure PDF. This layout presents information on Average Revenue, Customer Lifetime, Customer Acquisition. It is also available for immediate download and adjustment. So, changes can be made in the color, design, graphics or any other component to create a unique layout.
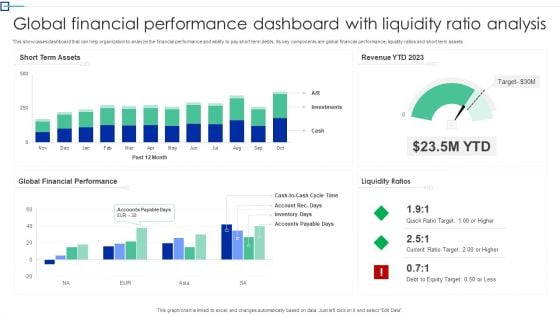
Global Financial Performance Dashboard With Liquidity Ratio Analysis Information PDF
This showcases dashboard that can help organization to analyze the financial performance and ability to pay short term debts. Its key components are global financial performance, liquidity ratios and short term assets. Pitch your topic with ease and precision using this Global Financial Performance Dashboard With Liquidity Ratio Analysis Information PDF. This layout presents information on Short Term Assets, Global Financial Performance, Liquidity Ratios. It is also available for immediate download and adjustment. So, changes can be made in the color, design, graphics or any other component to create a unique layout.
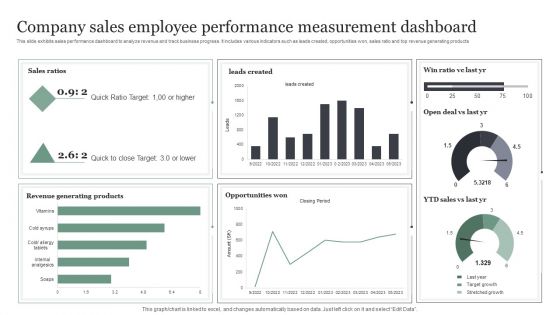
Company Sales Employee Performance Measurement Dashboard Information PDF
This slide exhibits sales performance dashboard to analyze revenue and track business progress. It includes various indicators such as leads created, opportunities won, sales ratio and top revenue generating products. Showcasing this set of slides titled Company Sales Employee Performance Measurement Dashboard Information PDF. The topics addressed in these templates are Quick Ratio Target, Opportunities Won, Revenue Generating Products. All the content presented in this PPT design is completely editable. Download it and make adjustments in color, background, font etc. as per your unique business setting.
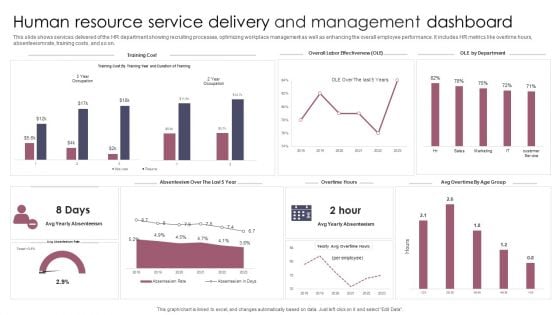
Human Resource Service Delivery And Management Dashboard Information PDF
This slide shows services delivered of the HR department showing recruiting processes, optimizing workplace management as well as enhancing the overall employee performance. It includes HR metrics like overtime hours, absenteeism rate, training costs, and so on. Pitch your topic with ease and precision using this Human Resource Service Delivery And Management Dashboard Information PDF. This layout presents information on Human Resource Service Delivery, Management Dashboard. It is also available for immediate download and adjustment. So, changes can be made in the color, design, graphics or any other component to create a unique layout.
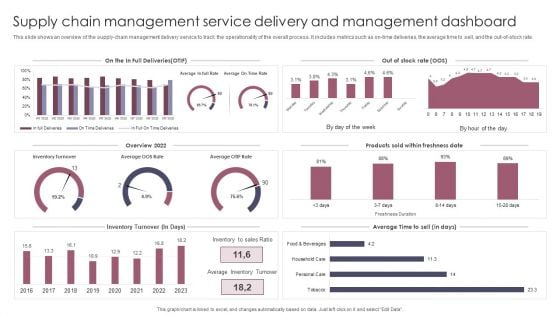
Supply Chain Management Service Delivery And Management Dashboard Guidelines PDF
This slide shows an overview of the supply chain management delivery service to track the operationality of the overall process. It includes metrics such as on time deliveries, the average time to sell, and the out of stock rate. Pitch your topic with ease and precision using this Supply Chain Management Service Delivery And Management Dashboard Guidelines PDF. This layout presents information on Supply Chain Management, Service Delivery, Management Dashboard. It is also available for immediate download and adjustment. So, changes can be made in the color, design, graphics or any other component to create a unique layout.
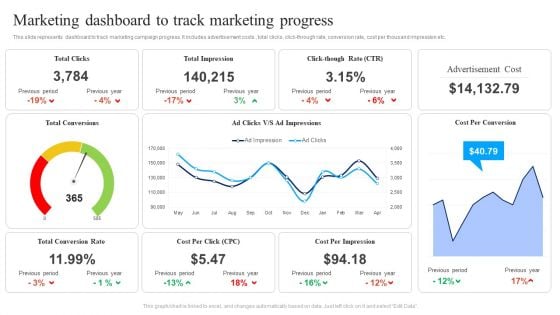
Marketing Dashboard To Track Marketing Progress Ppt Tips PDF
This slide represents dashboard to track marketing campaign progress. It includes advertisement costs , total clicks, click-through rate, conversion rate, cost per thousand impression etc. Pitch your topic with ease and precision using this Marketing Dashboard To Track Marketing Progress Ppt Tips PDF. This layout presents information on Total Clicks, Total Impression, Total Conversion Rate, Cost Per Click. It is also available for immediate download and adjustment. So, changes can be made in the color, design, graphics or any other component to create a unique layout.
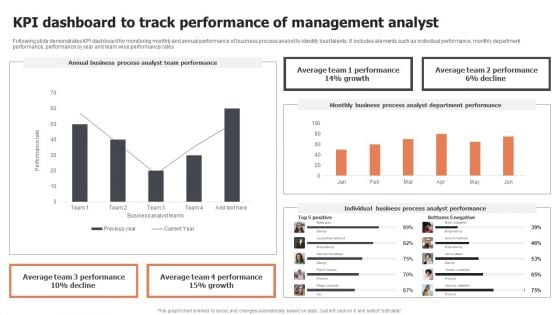
Kpi Dashboard To Track Performance Of Management Analyst Inspiration PDF
Following slide demonstrates KPI dashboard for monitoring monthly and annual performance of business process analyst to identify best talents. It includes elements such as individual performance, monthly department performance, performance by year and team wise performance rates. Showcasing this set of slides titled Kpi Dashboard To Track Performance Of Management Analyst Inspiration PDF. The topics addressed in these templates are Annual Business Process, Analyst Team Performance, Average Team. All the content presented in this PPT design is completely editable. Download it and make adjustments in color, background, font etc. as per your unique business setting.
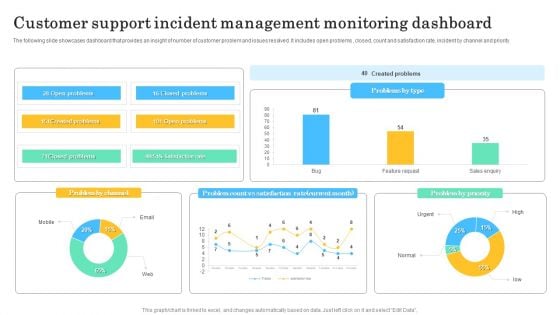
Customer Support Incident Management Monitoring Dashboard Topics PDF
The following slide showcases dashboard that provides an insight of number of customer problem and issues resolved. It includes open problems , closed, count and satisfaction rate, incident by channel and priority. Showcasing this set of slides titled Customer Support Incident Management Monitoring Dashboard Topics PDF. The topics addressed in these templates are Problem By Priority, Problem Count, Problem By Channel. All the content presented in this PPT design is completely editable. Download it and make adjustments in color, background, font etc. as per your unique business setting.


 Continue with Email

 Home
Home


