Program Dashboard
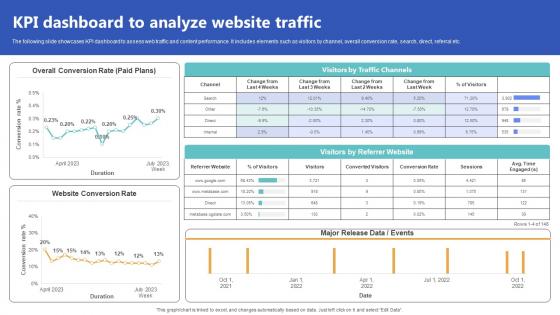
KPI Dashboard To Analyze Website Traffic Top Of The Funnel Digital Content Strategy SS V
The following slide showcases KPI dashboard to assess web traffic and content performance. It includes elements such as visitors by channel, overall conversion rate, search, direct, referral etc. Explore a selection of the finest KPI Dashboard To Analyze Website Traffic Top Of The Funnel Digital Content Strategy SS V here. With a plethora of professionally designed and pre-made slide templates, you can quickly and easily find the right one for your upcoming presentation. You can use our KPI Dashboard To Analyze Website Traffic Top Of The Funnel Digital Content Strategy SS V to effectively convey your message to a wider audience. Slidegeeks has done a lot of research before preparing these presentation templates. The content can be personalized and the slides are highly editable. Grab templates today from Slidegeeks. The following slide showcases KPI dashboard to assess web traffic and content performance. It includes elements such as visitors by channel, overall conversion rate, search, direct, referral etc.
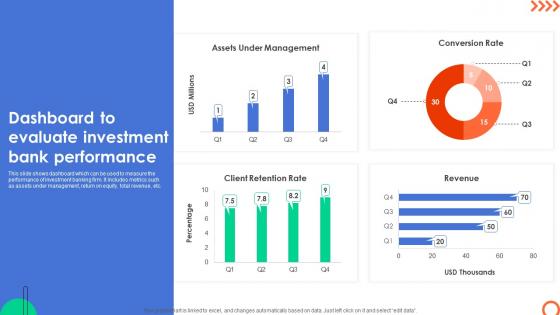
Dashboard To Evaluate Investment Bank Understanding Investment Banking Framework Fin SS V
This slide shows dashboard which can be used to measure the performance of investment banking firm. It includes metrics such as assets under management, return on equity, total revenue, etc. Find highly impressive Dashboard To Evaluate Investment Bank Understanding Investment Banking Framework Fin SS V on Slidegeeks to deliver a meaningful presentation. You can save an ample amount of time using these presentation templates. No need to worry to prepare everything from scratch because Slidegeeks experts have already done a huge research and work for you. You need to download Dashboard To Evaluate Investment Bank Understanding Investment Banking Framework Fin SS V for your upcoming presentation. All the presentation templates are 100 percent editable and you can change the color and personalize the content accordingly. Download now This slide shows dashboard which can be used to measure the performance of investment banking firm. It includes metrics such as assets under management, return on equity, total revenue, etc.
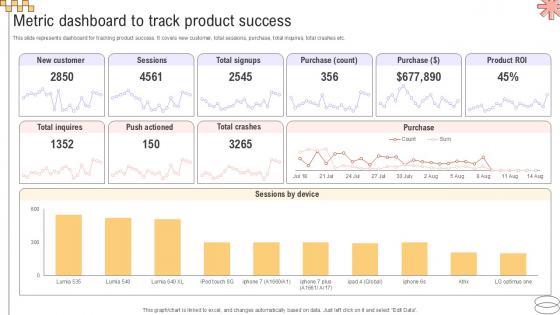
Metric Dashboard To Track Product Implementing Geographic Extension PPT Sample Strategy SS V
This slide represents dashboard for tracking product success. It covers new customer, total sessions, purchase, total inquires, total crashes etc. Explore a selection of the finest Metric Dashboard To Track Product Implementing Geographic Extension PPT Sample Strategy SS V here. With a plethora of professionally designed and pre-made slide templates, you can quickly and easily find the right one for your upcoming presentation. You can use our Metric Dashboard To Track Product Implementing Geographic Extension PPT Sample Strategy SS V to effectively convey your message to a wider audience. Slidegeeks has done a lot of research before preparing these presentation templates. The content can be personalized and the slides are highly editable. Grab templates today from Slidegeeks. This slide represents dashboard for tracking product success. It covers new customer, total sessions, purchase, total inquires, total crashes etc.
Firewall As A Service Performance Tracking Dashboard Network Security Guidelines Pdf
This slide represents the dashboard to track the performance of Firewall-as-a-Service deployed by different organizations. The purpose of this slide is to showcase the overall performance of FWaaS by demonstrating statistics of monthly threat status, etc. Crafting an eye-catching presentation has never been more straightforward. Let your presentation shine with this tasteful yet straightforward Firewall As A Service Performance Tracking Dashboard Network Security Guidelines Pdf template. It offers a minimalistic and classy look that is great for making a statement. The colors have been employed intelligently to add a bit of playfulness while still remaining professional. Construct the ideal Firewall As A Service Performance Tracking Dashboard Network Security Guidelines Pdf that effortlessly grabs the attention of your audience Begin now and be certain to wow your customers This slide represents the dashboard to track the performance of Firewall-as-a-Service deployed by different organizations. The purpose of this slide is to showcase the overall performance of FWaaS by demonstrating statistics of monthly threat status, etc.
Ultimate Guide To Cold Calling Sources Tracking Kpi Dashboard SA SS V
This slide outlines a call-tracking dashboard that helps marketers to track call quality, encompassing volume of calls, top call sources, total calls, etc. Do you have an important presentation coming up Are you looking for something that will make your presentation stand out from the rest Look no further than Ultimate Guide To Cold Calling Sources Tracking Kpi Dashboard SA SS V. With our professional designs, you can trust that your presentation will pop and make delivering it a smooth process. And with Slidegeeks, you can trust that your presentation will be unique and memorable. So why wait Grab Ultimate Guide To Cold Calling Sources Tracking Kpi Dashboard SA SS V today and make your presentation stand out from the rest This slide outlines a call-tracking dashboard that helps marketers to track call quality, encompassing volume of calls, top call sources, total calls, etc.
Performance Tracking Dashboard For Reinforcement Learning Model Role Of Reinforcement Mockup Pdf
This slide represents the performance tracking dashboard for the reinforcement learning model based on different time frames and categories. Explore a selection of the finest Performance Tracking Dashboard For Reinforcement Learning Model Role Of Reinforcement Mockup Pdf here. With a plethora of professionally designed and pre-made slide templates, you can quickly and easily find the right one for your upcoming presentation. You can use our Performance Tracking Dashboard For Reinforcement Learning Model Role Of Reinforcement Mockup Pdf to effectively convey your message to a wider audience. Slidegeeks has done a lot of research before preparing these presentation templates. The content can be personalized and the slides are highly editable. Grab templates today from Slidegeeks. This slide represents the performance tracking dashboard for the reinforcement learning model based on different time frames and categories.
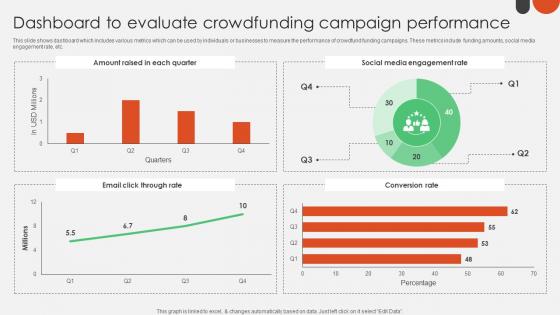
Dashboard To Evaluate Crowdfunding For Nonprofits To Support Fin SS V
This slide shows dashboard which includes various metrics which can be used by individuals or businesses to measure the performance of crowdfund funding campaigns. These metrics include funding amounts, social media engagement rate, etc. Find highly impressive Dashboard To Evaluate Crowdfunding For Nonprofits To Support Fin SS V on Slidegeeks to deliver a meaningful presentation. You can save an ample amount of time using these presentation templates. No need to worry to prepare everything from scratch because Slidegeeks experts have already done a huge research and work for you. You need to download Dashboard To Evaluate Crowdfunding For Nonprofits To Support Fin SS V for your upcoming presentation. All the presentation templates are 100 percent editable and you can change the color and personalize the content accordingly. Download now This slide shows dashboard which includes various metrics which can be used by individuals or businesses to measure the performance of crowdfund funding campaigns. These metrics include funding amounts, social media engagement rate, etc.
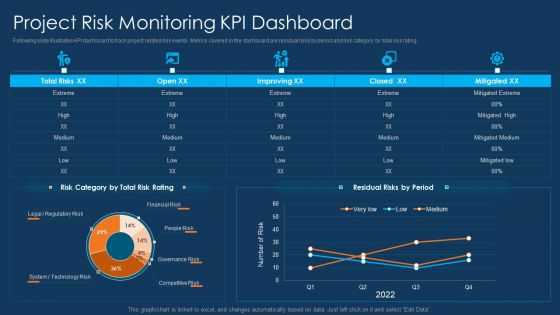
Information Technology Project Initiation Project Risk Monitoring Kpi Dashboard Background PDF
Following slide illustrates KPI dashboard to track project related risk events. Metrics covered in the dashboard are residual risks by period and risk category by total risk rating. Deliver and pitch your topic in the best possible manner with this information technology project initiation project risk monitoring kpi dashboard background pdf. Use them to share invaluable insights on project risk monitoring kpi dashboard and impress your audience. This template can be altered and modified as per your expectations. So, grab it now.
Managing It Services Spending Tracking Dashboard Playbook For Managing Us Inspiration Pdf
This slide provides information regarding the management of the digital services performance and IT spending tracking dashboard in terms of ROI, spend vs. budget, IT costs software, hardware, personnel and goals, IT spending in terms of revenues, etc. If your project calls for a presentation, then Slidegeeks is your go-to partner because we have professionally designed, easy-to-edit templates that are perfect for any presentation. After downloading, you can easily edit Managing It Services Spending Tracking Dashboard Playbook For Managing Us Inspiration Pdf and make the changes accordingly. You can rearrange slides or fill them with different images. Check out all the handy templates This slide provides information regarding the management of the digital services performance and IT spending tracking dashboard in terms of ROI, spend vs. budget, IT costs software, hardware, personnel and goals, IT spending in terms of revenues, etc.
Managing It Services Spending Tracking Dashboard Public Sector Digital Solutions Demonstration Pdf
This slide provides information regarding the management of the digital services performance and IT spending tracking dashboard in terms of ROI, spend vs. budget, IT costs software, hardware, personnel and goals, IT spending in terms of revenues, etc. The best PPT templates are a great way to save time, energy, and resources. Slidegeeks have 100 percent editable powerpoint slides making them incredibly versatile. With these quality presentation templates, you can create a captivating and memorable presentation by combining visually appealing slides and effectively communicating your message. Download Managing It Services Spending Tracking Dashboard Public Sector Digital Solutions Demonstration Pdf from Slidegeeks and deliver a wonderful presentation. This slide provides information regarding the management of the digital services performance and IT spending tracking dashboard in terms of ROI, spend vs. budget, IT costs software, hardware, personnel and goals, IT spending in terms of revenues, etc.
Customer Deal Tracking In Sales Pipeline Dashboard Strategies To Manage Sales Funnel Sample Pdf
This slide covers information regarding dashboard for tracking various customer deals in sales pipeline. Whether you have daily or monthly meetings, a brilliant presentation is necessary. Customer Deal Tracking In Sales Pipeline Dashboard Strategies To Manage Sales Funnel Sample Pdf can be your best option for delivering a presentation. Represent everything in detail using Customer Deal Tracking In Sales Pipeline Dashboard Strategies To Manage Sales Funnel Sample Pdf and make yourself stand out in meetings. The template is versatile and follows a structure that will cater to your requirements. All the templates prepared by Slidegeeks are easy to download and edit. Our research experts have taken care of the corporate themes as well. So, give it a try and see the results. This slide covers information regarding dashboard for tracking various customer deals in sales pipeline.
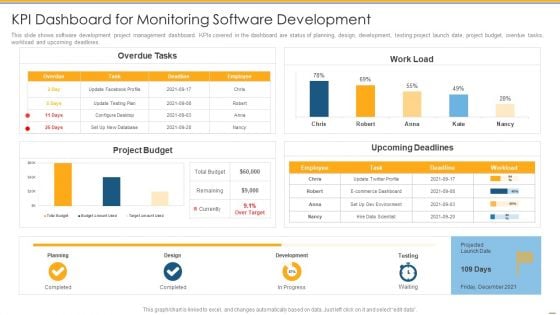
KPI Dashboard For Monitoring Software Development Ppt PowerPoint Presentation Show Deck PDF
This slide shows software development project management dashboard. KPIs covered in the dashboard are status of planning, design, development, testing project launch date, project budget, overdue tasks, workload and upcoming deadlines.Deliver an awe inspiring pitch with this creative kpi dashboard for monitoring software development ppt powerpoint presentation show deck pdf bundle. Topics like kpi dashboard for monitoring software development can be discussed with this completely editable template. It is available for immediate download depending on the needs and requirements of the user.
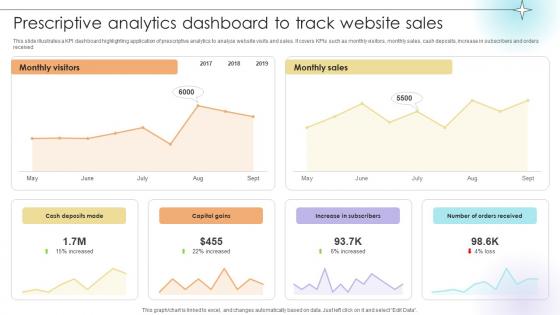
Prescriptive Analytics Dashboard To Track Website Sales Data Analytics SS V
This slide illustrates a KPI dashboard highlighting application of prescriptive analytics to analyze website visits and sales. It covers KPIs such as monthly visitors, monthly sales, cash deposits, increase in subscribers and orders received.This modern and well-arranged Prescriptive Analytics Dashboard To Track Website Sales Data Analytics SS V provides lots of creative possibilities. It is very simple to customize and edit with the Powerpoint Software. Just drag and drop your pictures into the shapes. All facets of this template can be edited with Powerpoint, no extra software is necessary. Add your own material, put your images in the places assigned for them, adjust the colors, and then you can show your slides to the world, with an animated slide included. This slide illustrates a KPI dashboard highlighting application of prescriptive analytics to analyze website visits and sales. It covers KPIs such as monthly visitors, monthly sales, cash deposits, increase in subscribers and orders received.
KPI Dashboard To Monitor Software Development Project Status Testing Icons PDF
Mentioned slide shows software development project management dashboard. KPIs covered in the dashboard are status of project budget, overdue tasks, workload and upcoming deadlines. Deliver an awe inspiring pitch with this creative kpi dashboard to monitor software development project status testing icons pdf bundle. Topics like kpi dashboard to monitor software development project status can be discussed with this completely editable template. It is available for immediate download depending on the needs and requirements of the user.
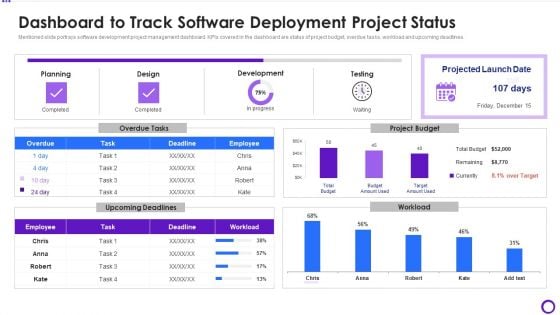
Dashboard To Track Software Deployment Project Status Ppt Slides Topics PDF
Mentioned slide portrays software development project management dashboard. KPIs covered in the dashboard are status of project budget, overdue tasks, workload and upcoming deadlines.Deliver an awe inspiring pitch with this creative dashboard to track software deployment project status ppt slides topics pdf bundle. Topics like dashboard to track software deployment project status can be discussed with this completely editable template. It is available for immediate download depending on the needs and requirements of the user.
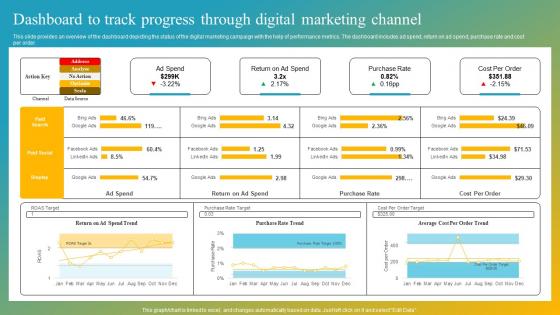
Effective Customer Engagement With Direct Response Dashboard To Track Progress Professional Pdf
This slide provides an overview of the dashboard depicting the status of the digital marketing campaign with the help of performance metrics. The dashboard includes ad spend, return on ad spend, purchase rate and cost per order. Crafting an eye-catching presentation has never been more straightforward. Let your presentation shine with this tasteful yet straightforward Effective Customer Engagement With Direct Response Dashboard To Track Progress Professional Pdf template. It offers a minimalistic and classy look that is great for making a statement. The colors have been employed intelligently to add a bit of playfulness while still remaining professional. Construct the ideal Effective Customer Engagement With Direct Response Dashboard To Track Progress Professional Pdf that effortlessly grabs the attention of your audience. Begin now and be certain to wow your customers. This slide provides an overview of the dashboard depicting the status of the digital marketing campaign with the help of performance metrics. The dashboard includes ad spend, return on ad spend, purchase rate and cost per order.
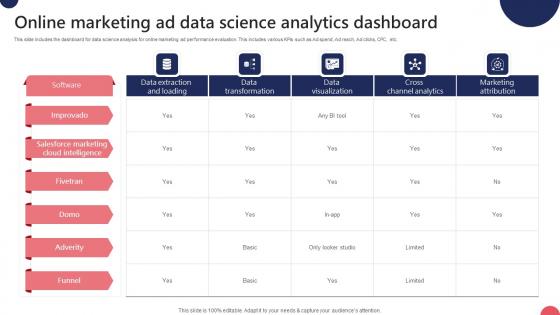
Online Marketing Ad Data Science Analytics Dashboard Ppt Inspiration Guidelines Pdf
This slide includes the dashboard for data science analysis for online marketing ad performance evaluation. This includes various KPIs such as Ad spend, Ad reach, Ad clicks, CPC, etc. Pitch your topic with ease and precision using this Online Marketing Ad Data Science Analytics Dashboard Ppt Inspiration Guidelines Pdf. This layout presents information on Ad Spend, Cost Per Thousand, Cost Per Click. It is also available for immediate download and adjustment. So, changes can be made in the color, design, graphics or any other component to create a unique layout. This slide includes the dashboard for data science analysis for online marketing ad performance evaluation. This includes various KPIs such as Ad spend, Ad reach, Ad clicks, CPC, etc.
Social Media Engagement Tracking Dashboard Cracking The Code Of Social Media
This slide depicts the social media engagement metrics dashboard. The purpose of this slide is to outline the engagement metrics such as page engagement, post key interaction, post engagement type, etc. There are so many reasons you need a Social Media Engagement Tracking Dashboard Cracking The Code Of Social Media. The first reason is you can not spend time making everything from scratch, Thus, Slidegeeks has made presentation templates for you too. You can easily download these templates from our website easily. This slide depicts the social media engagement metrics dashboard. The purpose of this slide is to outline the engagement metrics such as page engagement, post key interaction, post engagement type, etc.
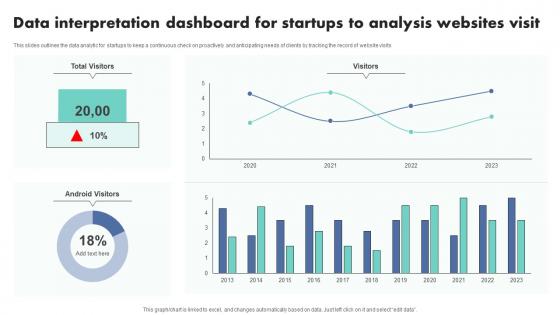
Data Interpretation Dashboard For Startups To Analysis Websites Visit Themes Pdf
This slides outlines the data analytic for startups to keep a continuous check on proactively and anticipating needs of clients by tracking the record of website visits.Showcasing this set of slides titled Data Interpretation Dashboard For Startups To Analysis Websites Visit Themes Pdf The topics addressed in these templates are Data Interpretation, Dashboard Startups, Analysis Websites Visit All the content presented in this PPT design is completely editable. Download it and make adjustments in color, background, font etc. as per your unique business setting. This slides outlines the data analytic for startups to keep a continuous check on proactively and anticipating needs of clients by tracking the record of website visits.
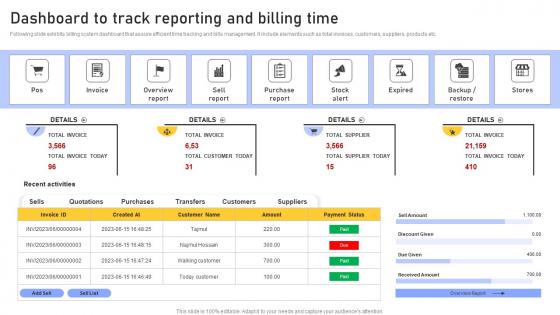
Dashboard To Track Reporting Enhancing Customer Service Operations Using CRM Technology Inspiration Pdf
Following slide exhibits billing system dashboard that assure efficient time tracking and bills management. It include elements such as total invoices, customers, suppliers, products etc. Slidegeeks is here to make your presentations a breeze with Dashboard To Track Reporting Enhancing Customer Service Operations Using CRM Technology Inspiration Pdf With our easy to use and customizable templates, you can focus on delivering your ideas rather than worrying about formatting. With a variety of designs to choose from, you are sure to find one that suits your needs. And with animations and unique photos, illustrations, and fonts, you can make your presentation pop. So whether you are giving a sales pitch or presenting to the board, make sure to check out Slidegeeks first Following slide exhibits billing system dashboard that assure efficient time tracking and bills management. It include elements such as total invoices, customers, suppliers, products etc.
Kpi Dashboard For Tracking Enhance Client Engagement With Interactive Advertising Background Pdf
This slide shows KPI dashboard for assessing performance of social media platforms. It provides information about followers, likes, clicks, shares, impressions, engaged users, new followers, etc. The Kpi Dashboard For Tracking Enhance Client Engagement With Interactive Advertising Background Pdf is a compilation of the most recent design trends as a series of slides. It is suitable for any subject or industry presentation, containing attractive visuals and photo spots for businesses to clearly express their messages. This template contains a variety of slides for the user to input data, such as structures to contrast two elements, bullet points, and slides for written information. Slidegeeks is prepared to create an impression. This slide shows KPI dashboard for assessing performance of social media platforms. It provides information about followers, likes, clicks, shares, impressions, engaged users, new followers, etc.
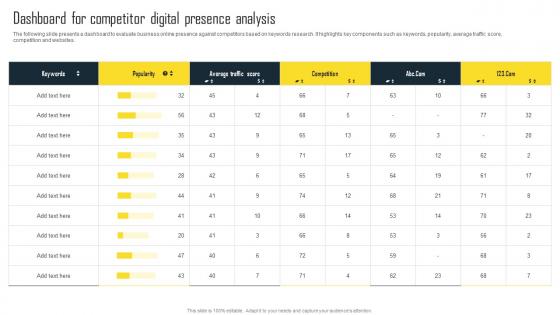
Dashboard For Competitor Digital Presence Efficient Plan For Conducting Competitor Microsoft Pdf
The following slide presents a dashboard to evaluate business online presence against competitors based on keywords research. It highlights key components such as keywords, popularity, average traffic score, competition and websites. The best PPT templates are a great way to save time, energy, and resources. Slidegeeks have 100 percent editable powerpoint slides making them incredibly versatile. With these quality presentation templates, you can create a captivating and memorable presentation by combining visually appealing slides and effectively communicating your message. Download Dashboard For Competitor Digital Presence Efficient Plan For Conducting Competitor Microsoft Pdf from Slidegeeks and deliver a wonderful presentation. The following slide presents a dashboard to evaluate business online presence against competitors based on keywords research. It highlights key components such as keywords, popularity, average traffic score, competition and websites.
Student Data Tracking Application Dashboard Impact Of IoT Technology On Education IoT SS V
Following slide represents dashboard that provides accurate student data to analyze performance using educational apps. It includes metrics such as grades, attendance, average grades, progress rate, etc. From laying roadmaps to briefing everything in detail, our templates are perfect for you. You can set the stage with your presentation slides. All you have to do is download these easy-to-edit and customizable templates. Student Data Tracking Application Dashboard Impact Of IoT Technology On Education IoT SS V will help you deliver an outstanding performance that everyone would remember and praise you for. Do download this presentation today. Following slide represents dashboard that provides accurate student data to analyze performance using educational apps. It includes metrics such as grades, attendance, average grades, progress rate, etc.
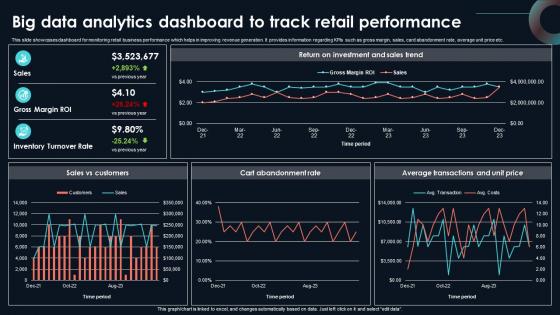
Big Data Analytics Dashboard To Track Developing Strategic Insights Using Big Data Analytics SS V
This slide showcases dashboard for monitoring retail business performance which helps in improving revenue generation. It provides information regarding KPIs such as gross margin, sales, card abandonment rate, average unit price etc. If your project calls for a presentation, then Slidegeeks is your go-to partner because we have professionally designed, easy-to-edit templates that are perfect for any presentation. After downloading, you can easily edit Big Data Analytics Dashboard To Track Developing Strategic Insights Using Big Data Analytics SS V and make the changes accordingly. You can rearrange slides or fill them with different images. Check out all the handy templates This slide showcases dashboard for monitoring retail business performance which helps in improving revenue generation. It provides information regarding KPIs such as gross margin, sales, card abandonment rate, average unit price etc.
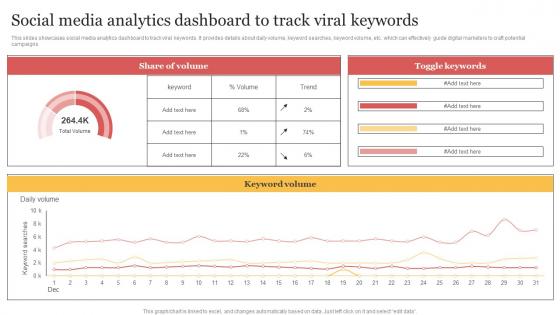
Social Media Analytics Dashboard To Track Viral Keywords Organizing Buzzworthy Social Themes Pdf
This slides showcases social media analytics dashboard to track viral keywords. It provides details about daily volume, keyword searches, keyword volume, etc. which can effectively guide digital marketers to craft potential campaigns. The Social Media Analytics Dashboard To Track Viral Keywords Organizing Buzzworthy Social Themes Pdf is a compilation of the most recent design trends as a series of slides. It is suitable for any subject or industry presentation, containing attractive visuals and photo spots for businesses to clearly express their messages. This template contains a variety of slides for the user to input data, such as structures to contrast two elements, bullet points, and slides for written information. Slidegeeks is prepared to create an impression. This slides showcases social media analytics dashboard to track viral keywords. It provides details about daily volume, keyword searches, keyword volume, etc. which can effectively guide digital marketers to craft potential campaigns.
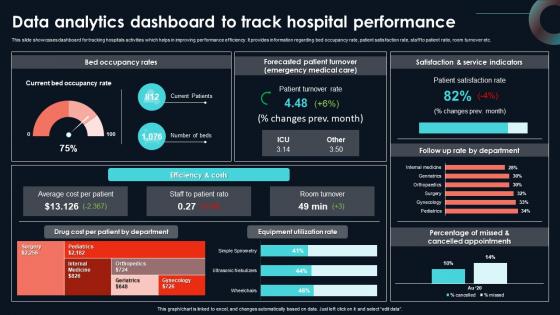
Data Analytics Dashboard To Track Hospital Developing Strategic Insights Using Big Data Analytics SS V
This slide showcases dashboard for tracking hospitals activities which helps in improving performance efficiency. It provides information regarding bed occupancy rate, patient satisfaction rate, staff to patient ratio, room turnover etc. The best PPT templates are a great way to save time, energy, and resources. Slidegeeks have 100 percent editable powerpoint slides making them incredibly versatile. With these quality presentation templates, you can create a captivating and memorable presentation by combining visually appealing slides and effectively communicating your message. Download Data Analytics Dashboard To Track Hospital Developing Strategic Insights Using Big Data Analytics SS V from Slidegeeks and deliver a wonderful presentation. This slide showcases dashboard for tracking hospitals activities which helps in improving performance efficiency. It provides information regarding bed occupancy rate, patient satisfaction rate, staff to patient ratio, room turnover etc.
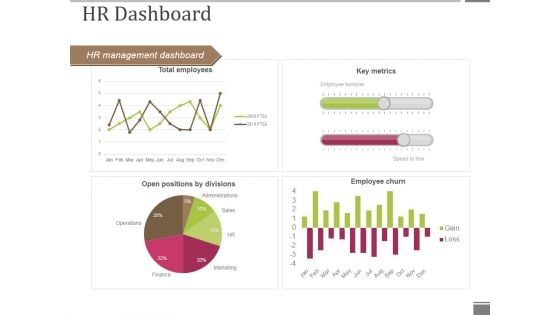
Hr Dashboard Template 1 Ppt PowerPoint Presentation Infographic Template Format Ideas
This is a hr dashboard template 1 ppt powerpoint presentation infographic template format ideas. This is a four stage process. The stages in this process are hr management dashboard, key metrics, employee churn, open positions by divisions, total employees.
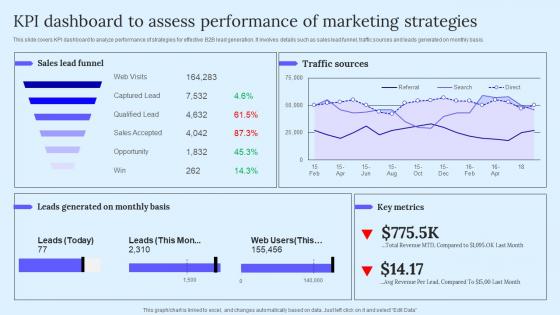
KPI Dashboard To Assess Performance B2B Marketing Techniques To Attract Potential Infographics Pdf
This slide covers KPI dashboard to analyze performance of strategies for effective B2B lead generation. It involves details such as sales lead funnel, traffic sources and leads generated on monthly basis. Slidegeeks has constructed KPI Dashboard To Assess Performance B2B Marketing Techniques To Attract Potential Infographics Pdf after conducting extensive research and examination. These presentation templates are constantly being generated and modified based on user preferences and critiques from editors. Here, you will find the most attractive templates for a range of purposes while taking into account ratings and remarks from users regarding the content. This is an excellent jumping off point to explore our content and will give new users an insight into our top notch PowerPoint Templates. This slide covers KPI dashboard to analyze performance of strategies for effective B2B lead generation. It involves details such as sales lead funnel, traffic sources and leads generated on monthly basis.
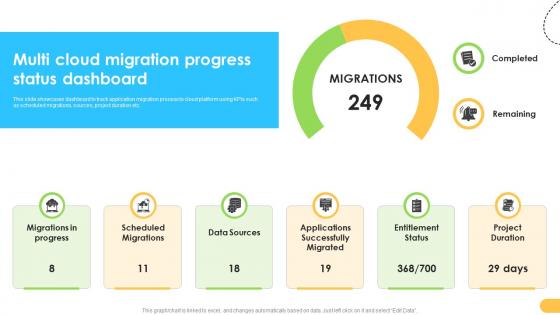
Multi Cloud Migration Progress Status Dashboard Data Migration From On Premises
This slide showcases dashboard to track application migration process to cloud platform using KPIs such as scheduled migrations, sources, project duration etc. Take your projects to the next level with our ultimate collection of Multi Cloud Migration Progress Status Dashboard Data Migration From On Premises. Slidegeeks has designed a range of layouts that are perfect for representing task or activity duration, keeping track of all your deadlines at a glance. Tailor these designs to your exact needs and give them a truly corporate look with your own brand colors they will make your projects stand out from the rest This slide showcases dashboard to track application migration process to cloud platform using KPIs such as scheduled migrations, sources, project duration etc.

Mastering Blockchain Wallets Dashboard To Track Users Wallet Transactions BCT SS V
This slide covers dashboard to evaluate users transactions using crypto wallets. The purpose of this template is to provide an overview on crypto balance, market scenario, latest transactions, trends, etc. Welcome to our selection of the Mastering Blockchain Wallets Dashboard To Track Users Wallet Transactions BCT SS V. These are designed to help you showcase your creativity and bring your sphere to life. Planning and Innovation are essential for any business that is just starting out. This collection contains the designs that you need for your everyday presentations. All of our PowerPoints are 100Percent editable, so you can customize them to suit your needs. This multi-purpose template can be used in various situations. Grab these presentation templates today. This slide covers dashboard to evaluate users transactions using crypto wallets. The purpose of this template is to provide an overview on crypto balance, market scenario, latest transactions, trends, etc.
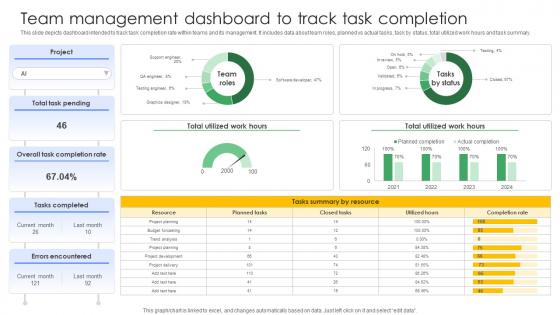
Driving Results Designing A Team Management Dashboard To Track Task Completion
This slide depicts dashboard intended to track task completion rate within teams and its management. It includes data about team roles, planned vs actual tasks, task by status, total utilized work hours and task summary. This modern and well-arranged Driving Results Designing A Team Management Dashboard To Track Task Completion provides lots of creative possibilities. It is very simple to customize and edit with the Powerpoint Software. Just drag and drop your pictures into the shapes. All facets of this template can be edited with Powerpoint, no extra software is necessary. Add your own material, put your images in the places assigned for them, adjust the colors, and then you can show your slides to the world, with an animated slide included. This slide depicts dashboard intended to track task completion rate within teams and its management. It includes data about team roles, planned vs actual tasks, task by status, total utilized work hours and task summary.
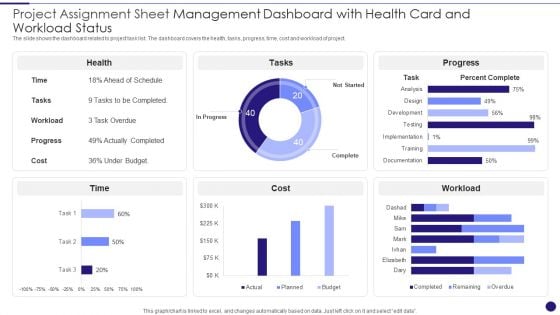
Project Assignment Sheet Management Dashboard With Health Card And Workload Status Sample PDF
The slide shows the dashboard related to project task list. The dashboard covers the health, tasks, progress, time, cost and workload of project. Showcasing this set of slides titled Project Assignment Sheet Management Dashboard With Health Card And Workload Status Sample PDF. The topics addressed in these templates are Management Dashboard, Cost, Project Assignment. All the content presented in this PPT design is completely editable. Download it and make adjustments in color, background, font etc. as per your unique business setting.
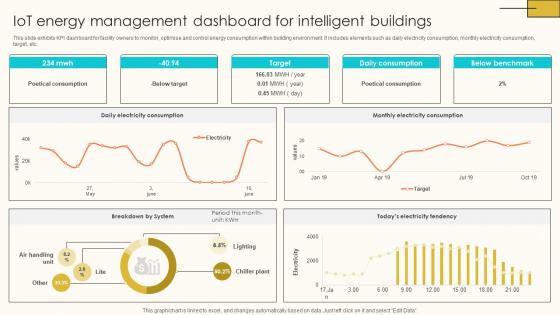
IoT Energy Management Dashboard For Internet Of Things Solutions To Enhance Energy IoT SS V
This slide exhibits KPI dashboard for facility owners to monitor, optimise and control energy consumption within building environment. It includes elements such as daily electricity consumption, monthly electricity consumption, target, etc. This modern and well-arranged IoT Energy Management Dashboard For Internet Of Things Solutions To Enhance Energy IoT SS V provides lots of creative possibilities. It is very simple to customize and edit with the Powerpoint Software. Just drag and drop your pictures into the shapes. All facets of this template can be edited with Powerpoint, no extra software is necessary. Add your own material, put your images in the places assigned for them, adjust the colors, and then you can show your slides to the world, with an animated slide included. This slide exhibits KPI dashboard for facility owners to monitor, optimise and control energy consumption within building environment. It includes elements such as daily electricity consumption, monthly electricity consumption, target, etc.
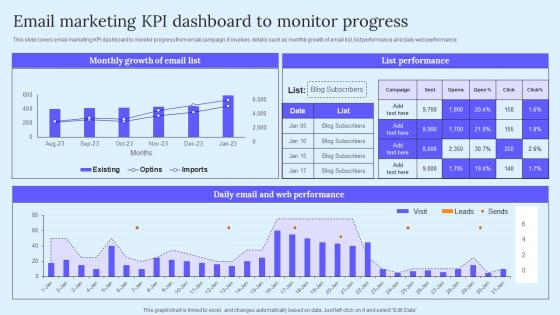
Email Marketing KPI Dashboard B2B Marketing Techniques To Attract Potential Professional Pdf
This slide covers email marketing KPI dashboard to monitor progress from email campaign. It involves details such as monthly growth of email list, list performance and daily web performance. Coming up with a presentation necessitates that the majority of the effort goes into the content and the message you intend to convey. The visuals of a PowerPoint presentation can only be effective if it supplements and supports the story that is being told. Keeping this in mind our experts created Email Marketing KPI Dashboard B2B Marketing Techniques To Attract Potential Professional Pdf to reduce the time that goes into designing the presentation. This way, you can concentrate on the message while our designers take care of providing you with the right template for the situation. This slide covers email marketing KPI dashboard to monitor progress from email campaign. It involves details such as monthly growth of email list, list performance and daily web performance.
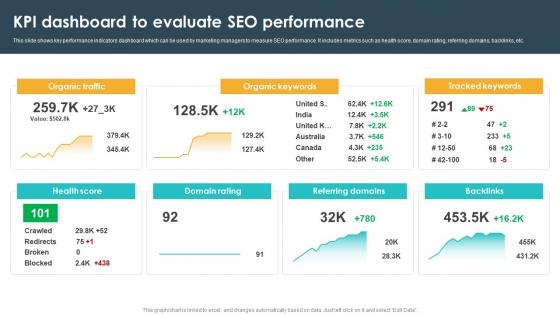
Kpi Dashboard To Evaluate Seo Performance Seo Content Plan To Drive Strategy SS V
This slide shows key performance indicators dashboard which can be used by marketing managers to measure SEO performance. It includes metrics such as health score, domain rating, referring domains, backlinks, etc. Welcome to our selection of the Kpi Dashboard To Evaluate Seo Performance Seo Content Plan To Drive Strategy SS V These are designed to help you showcase your creativity and bring your sphere to life. Planning and Innovation are essential for any business that is just starting out. This collection contains the designs that you need for your everyday presentations. All of our PowerPoints are 100Percent editable, so you can customize them to suit your needs. This multi-purpose template can be used in various situations. Grab these presentation templates today. This slide shows key performance indicators dashboard which can be used by marketing managers to measure SEO performance. It includes metrics such as health score, domain rating, referring domains, backlinks, etc.

Email Newsletter Dashboard Digital Marketing Strategies Improve Enterprise Sales Infographics Pdf
The following slide showcases a key performance indicator KPI dashboard through which managers can measure the impact of email marketing strategy on business performance. The metrics covered in the slide are total conversions, new subscribers, etc. The Email Newsletter Dashboard Digital Marketing Strategies Improve Enterprise Sales Infographics Pdf is a compilation of the most recent design trends as a series of slides. It is suitable for any subject or industry presentation, containing attractive visuals and photo spots for businesses to clearly express their messages. This template contains a variety of slides for the user to input data, such as structures to contrast two elements, bullet points, and slides for written information. Slidegeeks is prepared to create an impression. The following slide showcases a key performance indicator KPI dashboard through which managers can measure the impact of email marketing strategy on business performance. The metrics covered in the slide are total conversions, new subscribers, etc.
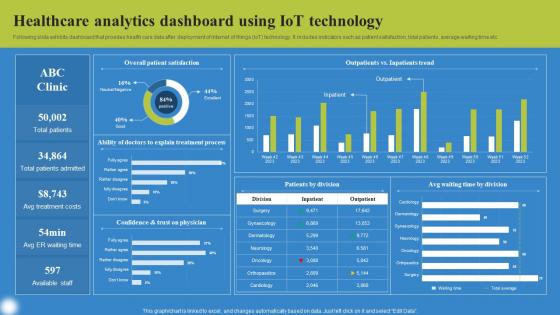
Healthcare Analytics Dashboard Using Deploying IoT Solutions For Enhanced Healthcare Background Pdf
Following slide exhibits dashboard that provides health care data after deployment of internet of things IoT technology. It includes indicators such as patient satisfaction, total patients, average waiting time etc. Do you know about Slidesgeeks Healthcare Analytics Dashboard Using Deploying IoT Solutions For Enhanced Healthcare Background Pdf These are perfect for delivering any kind od presentation. Using it, create PowerPoint presentations that communicate your ideas and engage audiences. Save time and effort by using our pre designed presentation templates that are perfect for a wide range of topic. Our vast selection of designs covers a range of styles, from creative to business, and are all highly customizable and easy to edit. Download as a PowerPoint template or use them as Google Slides themes. Following slide exhibits dashboard that provides health care data after deployment of internet of things IoT technology. It includes indicators such as patient satisfaction, total patients, average waiting time etc.
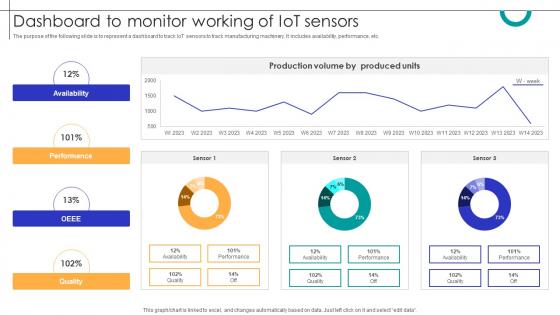
Dashboard To Monitor Working Of IOT Sensors Streamlining Production Ppt Powerpoint
The purpose of the following slide is to represent a dashboard to track IoT sensors to track manufacturing machinery. It includes availability, performance, etc. Coming up with a presentation necessitates that the majority of the effort goes into the content and the message you intend to convey. The visuals of a PowerPoint presentation can only be effective if it supplements and supports the story that is being told. Keeping this in mind our experts created Dashboard To Monitor Working Of IOT Sensors Streamlining Production Ppt Powerpoint to reduce the time that goes into designing the presentation. This way, you can concentrate on the message while our designers take care of providing you with the right template for the situation. The purpose of the following slide is to represent a dashboard to track IoT sensors to track manufacturing machinery. It includes availability, performance, etc.

Product Analytics Dashboard To Track Engagement Product Analytics Implementation Data Analytics V
This slide illustrates a dashboard to monitor customer engagement on company website by leveraging product analytics tools aimed at making necessary improvements. It covers insights regarding active monthly users, new users, total completed purchases, screen views, average duration of session, etc Want to ace your presentation in front of a live audience Our Product Analytics Dashboard To Track Engagement Product Analytics Implementation Data Analytics V can help you do that by engaging all the users towards you. Slidegeeks experts have put their efforts and expertise into creating these impeccable powerpoint presentations so that you can communicate your ideas clearly. Moreover, all the templates are customizable, and easy-to-edit and downloadable. Use these for both personal and commercial use. This slide illustrates a dashboard to monitor customer engagement on company website by leveraging product analytics tools aimed at making necessary improvements. It covers insights regarding active monthly users, new users, total completed purchases, screen views, average duration of session, etc
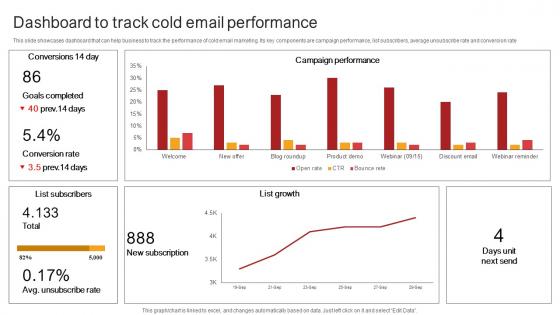
Remote Sales Plan For Dashboard To Track Cold Email Performance Strategy SS V
This slide showcases dashboard that can help business to track the performance of cold email marketing. Its key components are campaign performance, list subscribers, average unsubscribe rate and conversion rate. Slidegeeks is here to make your presentations a breeze with Remote Sales Plan For Dashboard To Track Cold Email Performance Strategy SS V With our easy-to-use and customizable templates, you can focus on delivering your ideas rather than worrying about formatting. With a variety of designs to choose from, you are sure to find one that suits your needs. And with animations and unique photos, illustrations, and fonts, you can make your presentation pop. So whether you are giving a sales pitch or presenting to the board, make sure to check out Slidegeeks first This slide showcases dashboard that can help business to track the performance of cold email marketing. Its key components are campaign performance, list subscribers, average unsubscribe rate and conversion rate.
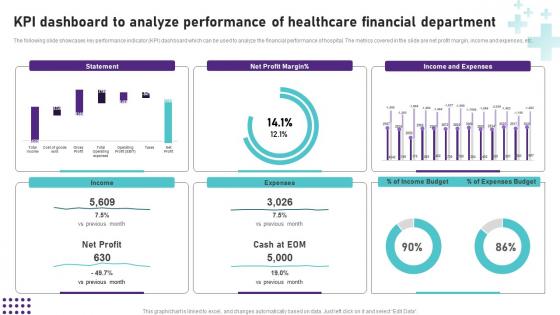
KPI Dashboard To Analyze Performance Of Healthcare Operational Areas Healthcare Clipart PDF
Are you searching for a KPI Dashboard To Analyze Performance Of Healthcare Operational Areas Healthcare Clipart PDF that is uncluttered, straightforward, and original Its easy to edit, and you can change the colors to suit your personal or business branding. For a presentation that expresses how much effort you have put in, this template is ideal With all of its features, including tables, diagrams, statistics, and lists, its perfect for a business plan presentation. Make your ideas more appealing with these professional slides. Download Kpi Dashboard To Analyze Performance Of Healthcare Operational Areas Healthcare Clipart PDF from Slidegeeks today. The following slide showcases key performance indicator KPI dashboard which can be used to analyze the financial performance of hospital. The metrics covered in the slide are net profit margin, income and expenses, etc.

Equity Asset Allocation Dashboard Analytics Strategic Investment Plan For Optimizing Risk SS V
This slide represents an equity asset allocation dashboard to measure and manage the performance of equity overtime. It tracks KPIs such as, average position size, market cap distribution, average PE distribution, ratio and yield, by geography, industry, currency and holding lists.If your project calls for a presentation, then Slidegeeks is your go-to partner because we have professionally designed, easy-to-edit templates that are perfect for any presentation. After downloading, you can easily edit Equity Asset Allocation Dashboard Analytics Strategic Investment Plan For Optimizing Risk SS V and make the changes accordingly. You can rearrange slides or fill them with different images. Check out all the handy templates This slide represents an equity asset allocation dashboard to measure and manage the performance of equity overtime. It tracks KPIs such as, average position size, market cap distribution, average PE distribution, ratio and yield, by geography, industry, currency and holding lists.
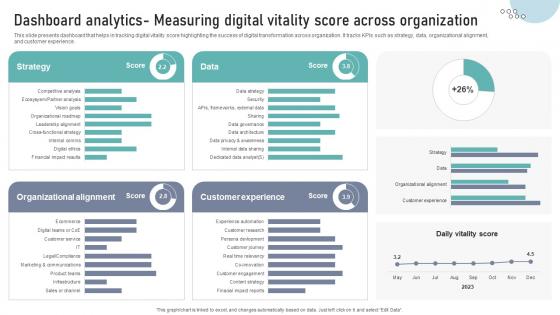
Dashboard Analytics Measuring Digital Vitality Score Across Organization DT SS V
This slide presents dashboard that helps in tracking digital vitality score highlighting the success of digital transformation across organization. It tracks KPIs such as strategy, data, organizational alignment,and customer experience.Make sure to capture your audiences attention in your business displays with our gratis customizable Dashboard Analytics Measuring Digital Vitality Score Across Organization DT SS V. These are great for business strategies, office conferences, capital raising or task suggestions. If you desire to acquire more customers for your tech business and ensure they stay satisfied, create your own sales presentation with these plain slides. This slide presents dashboard that helps in tracking digital vitality score highlighting the success of digital transformation across organization. It tracks KPIs such as strategy, data, organizational alignment,and customer experience.
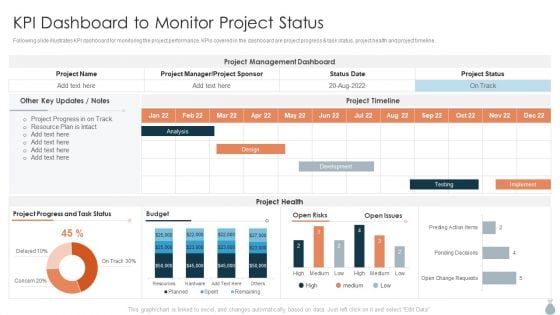
Real Estate Development Project Financing KPI Dashboard To Monitor Project Status Themes PDF
Following slide illustrates KPI dashboard for monitoring the project performance. KPIs covered in the dashboard are project progress task status, project health and project timeline.Deliver and pitch your topic in the best possible manner with this Real Estate Development Project Financing KPI Dashboard To Monitor Project Status Themes PDF. Use them to share invaluable insights on Management Dashboard, Project Progress, Resource Plan and impress your audience. This template can be altered and modified as per your expectations. So, grab it now.
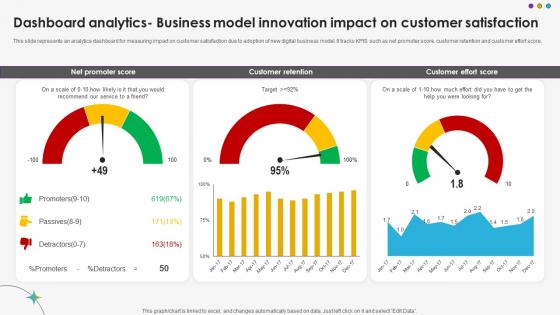
Dashboard Analytics Business Model Innovation Impact On Customer Satisfaction DT SS V
This slide represents an analytics dashboard for measuring impact on customer satisfaction due to adoption of new digital business model. It tracks KPIS such as net promoter score, customer retention and customer effort score.The Dashboard Analytics Business Model Innovation Impact On Customer Satisfaction DT SS V is a compilation of the most recent design trends as a series of slides. It is suitable for any subject or industry presentation, containing attractive visuals and photo spots for businesses to clearly express their messages. This template contains a variety of slides for the user to input data, such as structures to contrast two elements, bullet points, and slides for written information. Slidegeeks is prepared to create an impression. This slide represents an analytics dashboard for measuring impact on customer satisfaction due to adoption of new digital business model. It tracks KPIS such as net promoter score, customer retention and customer effort score.
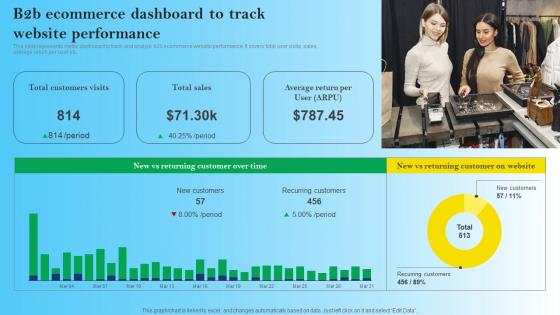
B2B Ecommerce Dashboard To Track Website Performance B2B Digital Commerce Infographics Pdf
This slide represents metric dashboard to track and analyze b2b ecommerce website performance. It covers total user visits, sales, average return per user etc. The B2B Ecommerce Dashboard To Track Website Performance B2B Digital Commerce Infographics Pdf is a compilation of the most recent design trends as a series of slides. It is suitable for any subject or industry presentation, containing attractive visuals and photo spots for businesses to clearly express their messages. This template contains a variety of slides for the user to input data, such as structures to contrast two elements, bullet points, and slides for written information. Slidegeeks is prepared to create an impression. This slide represents metric dashboard to track and analyze b2b ecommerce website performance. It covers total user visits, sales, average return per user etc.
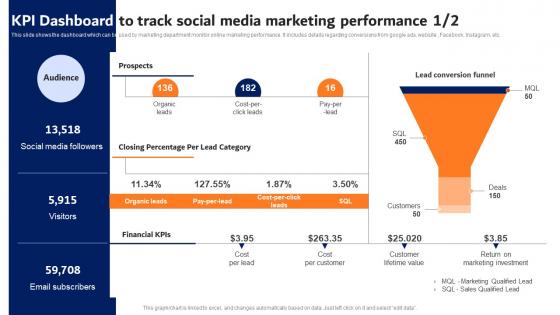
Digital Advertising Strategies KPI Dashboard To Track Social Media Infographics Pdf
This slide shows the dashboard which can be used by marketing department monitor online marketing performance. It includes details regarding conversions from google ads, website , Facebook, Instagram, etc. Make sure to capture your audiences attention in your business displays with our gratis customizable Digital Advertising Strategies KPI Dashboard To Track Social Media Infographics Pdf. These are great for business strategies, office conferences, capital raising or task suggestions. If you desire to acquire more customers for your tech business and ensure they stay satisfied, create your own sales presentation with these plain slides. This slide shows the dashboard which can be used by marketing department monitor online marketing performance. It includes details regarding conversions from google ads, website , Facebook, Instagram, etc.
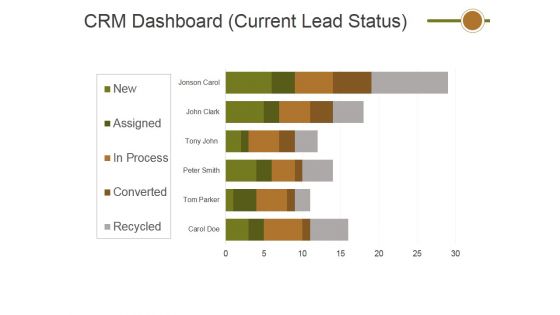
Crm Dashboard Current Lead Status Ppt PowerPoint Presentation Show Slide Portrait
This is a crm dashboard current lead status ppt powerpoint presentation show slide portrait. This is a six stage process. The stages in this process are crm dashboard, current lead status, business, marketing.
Smart Attendance Tracking Systems Dashboard Impact Of IoT Technology On Education IoT SS V
Following slide highlights dashboard to monitor and track student attendance by using Io enabled asset tracking devices. It includes indicators such as overtime, statistics, source, exceptions, pending requests, etc. Want to ace your presentation in front of a live audience Our Smart Attendance Tracking Systems Dashboard Impact Of IoT Technology On Education IoT SS V can help you do that by engaging all the users towards you. Slidegeeks experts have put their efforts and expertise into creating these impeccable powerpoint presentations so that you can communicate your ideas clearly. Moreover, all the templates are customizable, and easy-to-edit and downloadable. Use these for both personal and commercial use. Following slide highlights dashboard to monitor and track student attendance by using Io enabled asset tracking devices. It includes indicators such as overtime, statistics, source, exceptions, pending requests, etc.
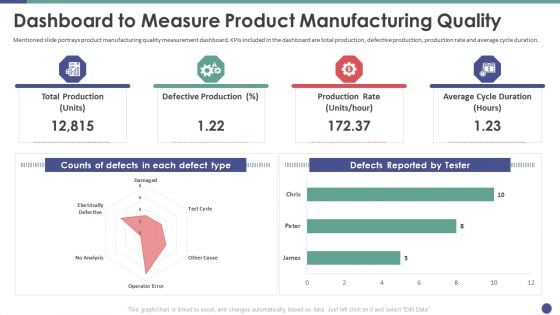
QC Engineering Dashboard To Measure Product Manufacturing Quality Ppt Gallery Inspiration PDF
Mentioned slide portrays product manufacturing quality measurement dashboard. KPIs included in the dashboard are total production, defective production, production rate and average cycle duration. Deliver and pitch your topic in the best possible manner with this qc engineering dashboard to measure product manufacturing quality ppt gallery inspiration pdf. Use them to share invaluable insights on dashboard to measure product manufacturing quality and impress your audience. This template can be altered and modified as per your expectations. So, grab it now.
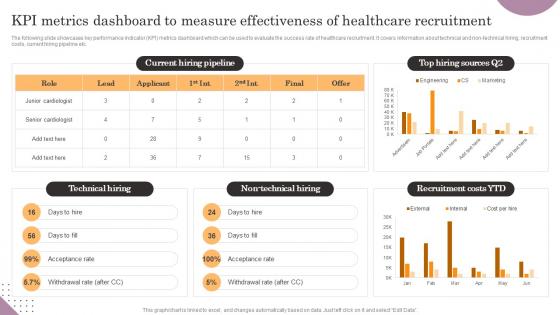
KPI Metrics Dashboard To Measure Effectiveness Of General Management Information Pdf
The following slide showcases key performance indicator KPI metrics dashboard which can be used to evaluate the success rate of healthcare recruitment. It covers information about technical and non-technical hiring, recruitment costs, current hiring pipeline etc. Presenting this PowerPoint presentation, titled KPI Metrics Dashboard To Measure Effectiveness Of General Management Information Pdf, with topics curated by our researchers after extensive research. This editable presentation is available for immediate download and provides attractive features when used. Download now and captivate your audience. Presenting this KPI Metrics Dashboard To Measure Effectiveness Of General Management Information Pdf. Our researchers have carefully researched and created these slides with all aspects taken into consideration. This is a completely customizable KPI Metrics Dashboard To Measure Effectiveness Of General Management Information Pdf that is available for immediate downloading. Download now and make an impact on your audience. Highlight the attractive features available with our PPTs. The following slide showcases key performance indicator KPI metrics dashboard which can be used to evaluate the success rate of healthcare recruitment. It covers information about technical and non-technical hiring, recruitment costs, current hiring pipeline etc.

KPI Dashboard For Monitoring Warehouse Operations Strategic Plan For Enhancing Inspiration Pdf
Mentioned slide illustrates warehouse operations dashboard with key performance indicators KPIs. KPIs included are operating cost, order rate, total shipment by country and on-time shipment. Retrieve professionally designed KPI Dashboard For Monitoring Warehouse Operations Strategic Plan For Enhancing Inspiration Pdf to effectively convey your message and captivate your listeners. Save time by selecting pre-made slideshows that are appropriate for various topics, from business to educational purposes. These themes come in many different styles, from creative to corporate, and all of them are easily adjustable and can be edited quickly. Access them as PowerPoint templates or as Google Slides themes. You do not have to go on a hunt for the perfect presentation because Slidegeeks got you covered from everywhere. Mentioned slide illustrates warehouse operations dashboard with key performance indicators KPIs. KPIs included are operating cost, order rate, total shipment by country and on-time shipment.
Cyber Security Administration In Organization Financial Performance Tracking Dashboard Microsoft PDF
This slide presents the dashboard which will help firm in tracking the fiscal performance. This dashboard displays revenues and expenses trends and payment received analysis. Deliver and pitch your topic in the best possible manner with this cyber security administration in organization financial performance tracking dashboard microsoft pdf. Use them to share invaluable insights on financial performance tracking dashboard and impress your audience. This template can be altered and modified as per your expectations. So, grab it now.
KPI Dashboard To Monitor Project Status Real Estate Project Funding Icons PDF
Following slide illustrates KPI dashboard for monitoring the project performance. Kips covered in the dashboard are project progress and task status, project health and project timeline.Deliver and pitch your topic in the best possible manner with this KPI Dashboard To Monitor Project Status Real Estate Project Funding Icons PDF. Use them to share invaluable insights on Project Management, Dashboard, Project Progress and impress your audience. This template can be altered and modified as per your expectations. So, grab it now.
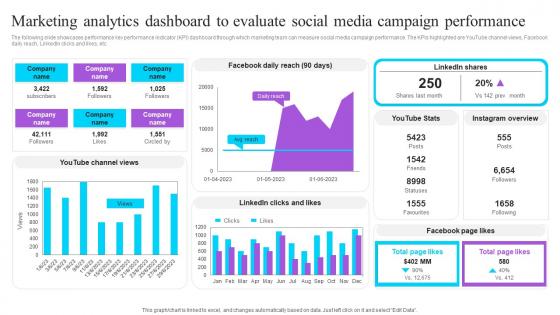
Marketing Analytics Dashboard To Evaluate Social Effective GTM Techniques Structure PDF
The following slide showcases performance key performance indicator KPI dashboard through which marketing team can measure social media campaign performance. The KPIs highlighted are YouTube channel views, Facebook daily reach, LinkedIn clicks and likes, etc. The best PPT templates are a great way to save time, energy, and resources. Slidegeeks have 100 percent editable powerpoint slides making them incredibly versatile. With these quality presentation templates, you can create a captivating and memorable presentation by combining visually appealing slides and effectively communicating your message. Download Marketing Analytics Dashboard To Evaluate Social Effective GTM Techniques For Startup Business Elements PDF from Slidegeeks and deliver a wonderful presentation. The following slide showcases performance key performance indicator KPI dashboard through which marketing team can measure social media campaign performance. The KPIs highlighted are YouTube channel views, Facebook daily reach, LinkedIn clicks and likes, etc.
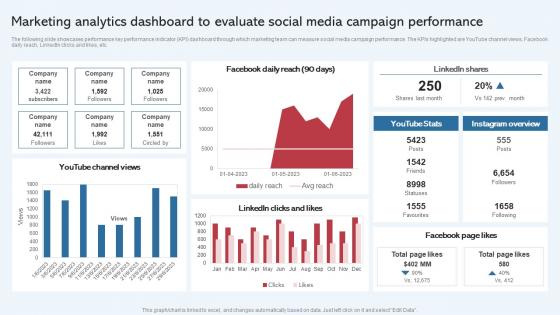
Marketing Analytics Dashboard To Evaluate Social Effective Startup Promotion Structure Rules Pdf
The following slide showcases performance key performance indicator KPI dashboard through which marketing team can measure social media campaign performance. The KPIs highlighted are YouTube channel views, Facebook daily reach, LinkedIn clicks and likes, etc. The best PPT templates are a great way to save time, energy, and resources. Slidegeeks have 100 percent editable powerpoint slides making them incredibly versatile. With these quality presentation templates, you can create a captivating and memorable presentation by combining visually appealing slides and effectively communicating your message. Download Marketing Analytics Dashboard To Evaluate Social Effective Startup Promotion Structure Rules Pdf from Slidegeeks and deliver a wonderful presentation. The following slide showcases performance key performance indicator KPI dashboard through which marketing team can measure social media campaign performance. The KPIs highlighted are YouTube channel views, Facebook daily reach, LinkedIn clicks and likes, etc.
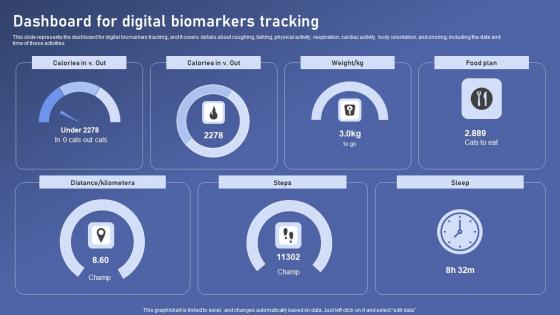
Dashboard For Digital Biomarkers Biomedical Data Science And Health Informatics Slides Pdf
This slide represents the dashboard for digital biomarkers tracking, and it covers details about coughing, talking, physical activity, respiration, cardiac activity, body orientation, and snoring, including the date and time of these activities Make sure to capture your audiences attention in your business displays with our gratis customizable Dashboard For Digital Biomarkers Biomedical Data Science And Health Informatics Slides Pdf. These are great for business strategies, office conferences, capital raising or task suggestions. If you desire to acquire more customers for your tech business and ensure they stay satisfied, create your own sales presentation with these plain slides. This slide represents the dashboard for digital biomarkers tracking, and it covers details about coughing, talking, physical activity, respiration, cardiac activity, body orientation, and snoring, including the date and time of these activities
Key Indicator Dashboard Of Vertical Channel Marketing Software Ppt Icon Templates Pdf
This slide showcases the key indicators for vertical channel marketing software. This further includes reach, engagement and conversion data along with geography and industry. Showcasing this set of slides titled Key Indicator Dashboard Of Vertical Channel Marketing Software Ppt Icon Templates Pdf. The topics addressed in these templates are Reach, Engagement, Conversion. All the content presented in this PPT design is completely editable. Download it and make adjustments in color, background, font etc. as per your unique business setting. This slide showcases the key indicators for vertical channel marketing software. This further includes reach, engagement and conversion data along with geography and industry.
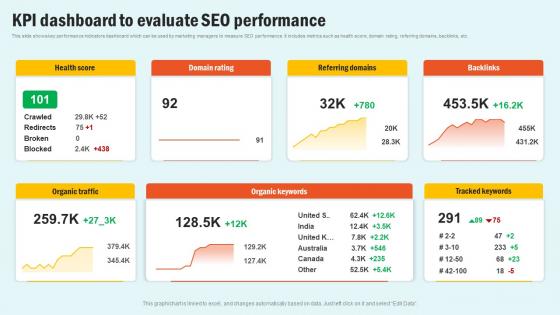
KPI Dashboard To Evaluate SEO Enhancing Website Performance With Search Engine Content Structure Pdf
This slide shows key performance indicators dashboard which can be used by marketing managers to measure SEO performance. It includes metrics such as health score, domain rating, referring domains, backlinks, etc. Welcome to our selection of the KPI Dashboard To Evaluate SEO Enhancing Website Performance With Search Engine Content Structure Pdf. These are designed to help you showcase your creativity and bring your sphere to life. Planning and Innovation are essential for any business that is just starting out. This collection contains the designs that you need for your everyday presentations. All of our PowerPoints are 100 percent editable, so you can customize them to suit your needs. This multi purpose template can be used in various situations. Grab these presentation templates today This slide shows key performance indicators dashboard which can be used by marketing managers to measure SEO performance. It includes metrics such as health score, domain rating, referring domains, backlinks, etc.
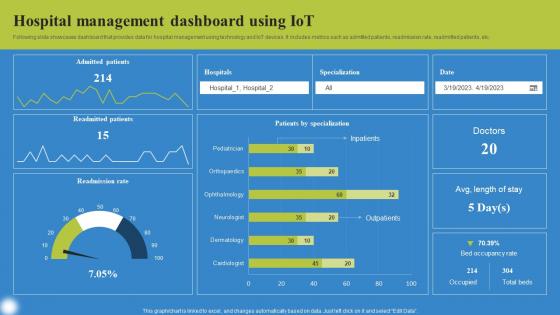
Hospital Management Dashboard Deploying IoT Solutions For Enhanced Healthcare Pictures Pdf
Following slide showcases dashboard that provides data for hospital management using technology and IoT devices. It includes metrics such as admitted patients, readmission rate, readmitted patients, etc. Find a pre designed and impeccable Hospital Management Dashboard Deploying IoT Solutions For Enhanced Healthcare Pictures Pdf. The templates can ace your presentation without additional effort. You can download these easy to edit presentation templates to make your presentation stand out from others. So, what are you waiting for Download the template from Slidegeeks today and give a unique touch to your presentation. Following slide showcases dashboard that provides data for hospital management using technology and IoT devices. It includes metrics such as admitted patients, readmission rate, readmitted patients, etc.


 Continue with Email

 Home
Home


