Program Highlights
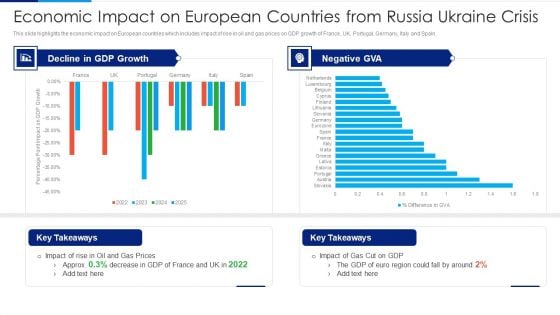
Russia Ukraine Conflict Effect Economic Impact On European Countries From Russia Microsoft PDF
This slide highlights the economic impact on European countries which includes impact of rise in oil and gas prices on GDP growth of France, UK, Portugal, Germany, Italy and Spain. Deliver an awe inspiring pitch with this creative Russia Ukraine Conflict Effect Economic Impact On European Countries From Russia Microsoft PDF bundle. Topics like Decline In GDP Growth, Negative GVA, 2022 To 2025 can be discussed with this completely editable template. It is available for immediate download depending on the needs and requirements of the user.
Russia Ukraine Conflict Effect Economic Impact On India From Russia Ukraine Crisis Icons PDF
This slide highlights the economic impact on India from Russia Ukraine War which includes inflation risks, impact on major commodity prices which includes gold, copper, base metals, zinc, and edible oil. Deliver an awe inspiring pitch with this creative Russia Ukraine Conflict Effect Economic Impact On India From Russia Ukraine Crisis Icons PDF bundle. Topics like Impact On Major Commodity Prices, Inflation Risks, Price Increase, Inflation Index can be discussed with this completely editable template. It is available for immediate download depending on the needs and requirements of the user.
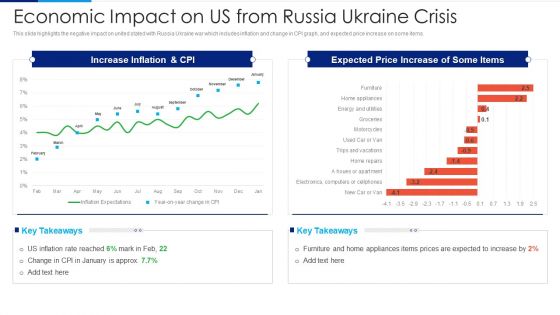
Russia Ukraine Conflict Effect Economic Impact On US From Russia Ukraine Crisis Download PDF
This slide highlights the negative impact on united stated with Russia Ukraine war which includes inflation and change in CPI graph, and expected price increase on some items. Deliver and pitch your topic in the best possible manner with this Russia Ukraine Conflict Effect Economic Impact On US From Russia Ukraine Crisis Download PDF. Use them to share invaluable insights on Increase Inflation And CPI, Expected Price, Increase Of Some Items and impress your audience. This template can be altered and modified as per your expectations. So, grab it now.
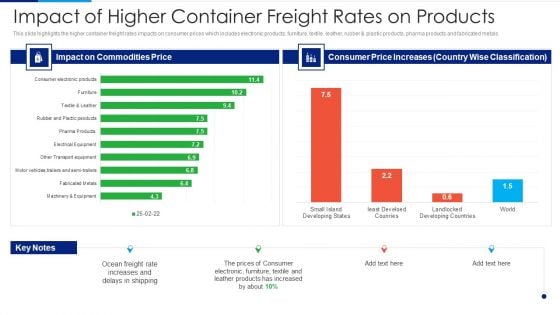
Russia Ukraine Conflict Effect Impact Of Higher Container Freight Rates On Products Diagrams PDF
This slide highlights the higher container freight rates impacts on consumer prices which includes electronic products, furniture, textile, leather, rubber and plastic products, pharma products and fabricated metals. Deliver an awe inspiring pitch with this creative Russia Ukraine Conflict Effect Impact Of Higher Container Freight Rates On Products Diagrams PDF bundle. Topics like Impact On Commodities Price, Consumer Price Increases, Ocean Freight Rate, Prices Of Consumer can be discussed with this completely editable template. It is available for immediate download depending on the needs and requirements of the user.
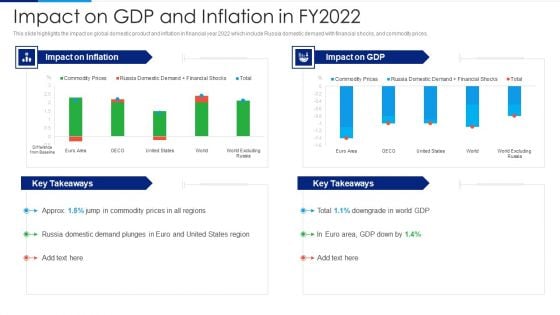
Russia Ukraine Conflict Effect Impact On GDP And Inflation In Fy2022 Introduction PDF
This slide highlights the impact on global domestic product and inflation in financial year 2022 which include Russia domestic demand with financial shocks, and commodity prices. Deliver an awe inspiring pitch with this creative Russia Ukraine Conflict Effect Impact On GDP And Inflation In Fy2022 Introduction PDF bundle. Topics like Impact On Inflation, Impact On GDP, Commodity Prices, Russia Domestic Demand, Financial Shocks can be discussed with this completely editable template. It is available for immediate download depending on the needs and requirements of the user.
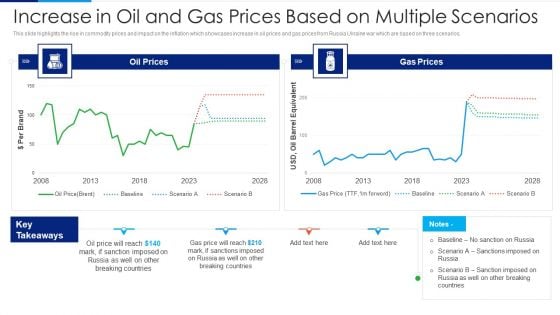
Russia Ukraine Conflict Effect Increase In Oil And Gas Prices Based On Multiple Scenarios Background PDF
This slide highlights the rise in commodity prices and impact on the inflation which showcases increase in oil prices and gas prices from Russia Ukraine war which are based on three scenarios. Deliver an awe inspiring pitch with this creative Russia Ukraine Conflict Effect Increase In Oil And Gas Prices Based On Multiple Scenarios Background PDF bundle. Topics like Oil Prices, Gas Prices, 2008 To 2028 can be discussed with this completely editable template. It is available for immediate download depending on the needs and requirements of the user.
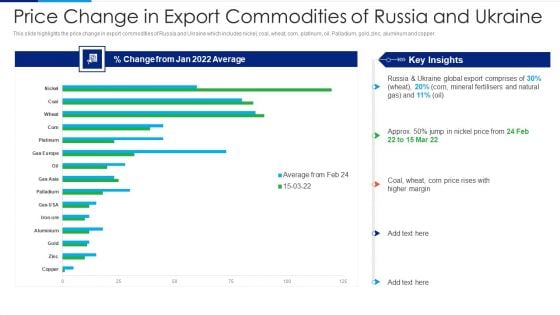
Russia Ukraine Conflict Effect Price Change In Export Commodities Of Russia Guidelines PDF
This slide highlights the price change in export commodities of Russia and Ukraine which includes nickel, coal, wheat, corn, platinum, oil. Palladium, gold, zinc, aluminum and copper. Deliver an awe inspiring pitch with this creative Russia Ukraine Conflict Effect Price Change In Export Commodities Of Russia Guidelines PDF bundle. Topics like Change From Jan 2022 Average, Global Export Comprises, Mineral Fertilisers And Natural Gas can be discussed with this completely editable template. It is available for immediate download depending on the needs and requirements of the user.
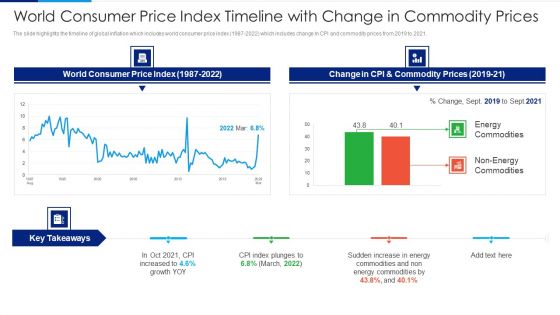
Russia Ukraine Conflict Effect World Consumer Price Index Timeline With Change Topics PDF
The slide highlights the timeline of global inflation which includes world consumer price index 1987 to 2022 which includes change In CPI and commodity prices from 2019 to 2021. Deliver and pitch your topic in the best possible manner with this Russia Ukraine Conflict Effect World Consumer Price Index Timeline With Change Topics PDF. Use them to share invaluable insights on World Consumer Price Index, Change CPI And Commodity Prices, 2019 To 2021 and impress your audience. This template can be altered and modified as per your expectations. So, grab it now.
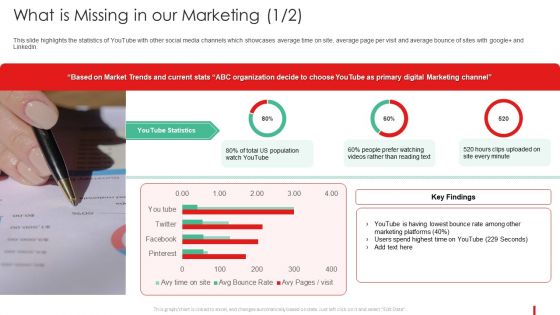
What Is Missing In Our Marketing Promotion Guide To Advertise Brand On Youtube Structure PDF
This slide highlights the statistics of YouTube with other social media channels which showcases average time on site, average page per visit and average bounce of sites with google plas and LinkedIn.Deliver an awe inspiring pitch with this creative What Is Missing In Our Marketing Promotion Guide To Advertise Brand On Youtube Structure PDF bundle. Topics like What Is Missing In Our Marketing can be discussed with this completely editable template. It is available for immediate download depending on the needs and requirements of the user.
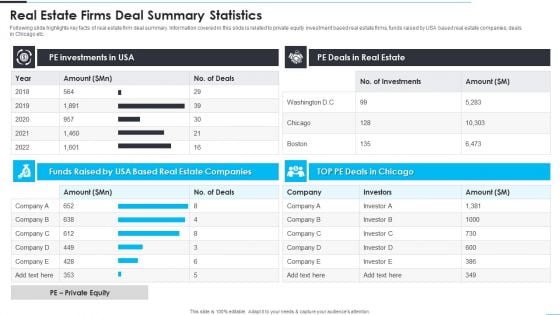
Real Estate Firms Deal Summary Statistics Demonstration PDF
Following slide highlights key facts of real estate firm deal summary. Information covered in this slide is related to private equity investment based real estate firms, funds raised by USA based real estate companies, deals in Chicago etc. Pitch your topic with ease and precision using this Real Estate Firms Deal Summary Statistics Demonstration PDF. This layout presents information on Real Estate Firms Deal Summary Statistics. It is also available for immediate download and adjustment. So, changes can be made in the color, design, graphics or any other component to create a unique layout.
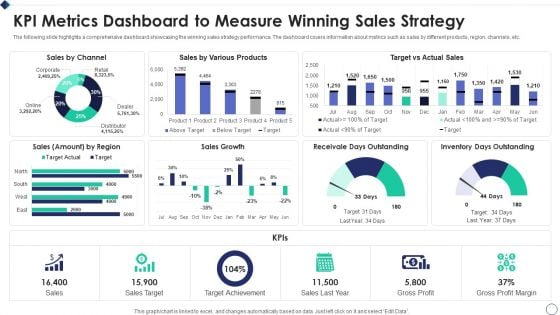
KPI Metrics Dashboard To Measure Winning Sales Strategy Ideas PDF
The following slide highlights a comprehensive dashboard showcasing the winning sales strategy performance. The dashboard covers information about metrics such as sales by different products, region, channels, etc.Showcasing this set of slides titled KPI Metrics Dashboard To Measure Winning Sales Strategy Ideas PDF The topics addressed in these templates are Sales By Channel, Various Products, Inventory Outstanding All the content presented in this PPT design is completely editable. Download it and make adjustments in color, background, font etc. as per your unique business setting.
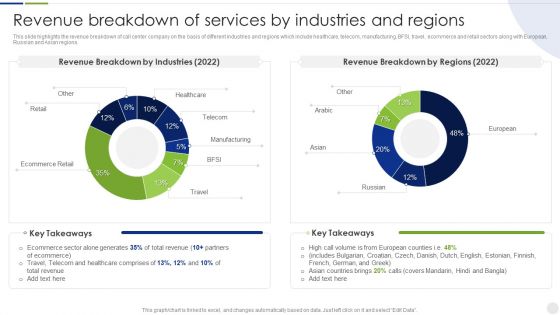
Business Process Outsourcing Company Profile Revenue Breakdown Of Services Elements PDF
This slide highlights the revenue breakdown of call center company on the basis of different industries and regions which include healthcare, telecom, manufacturing, BFSI, travel, ecommerce and retail sectors along with European, Russian and Asian regions. Deliver an awe inspiring pitch with this creative Business Process Outsourcing Company Profile Revenue Breakdown Of Services Elements PDF bundle. Topics like Revenue Breakdown, Ecommerce Retail, Healthcare can be discussed with this completely editable template. It is available for immediate download depending on the needs and requirements of the user.
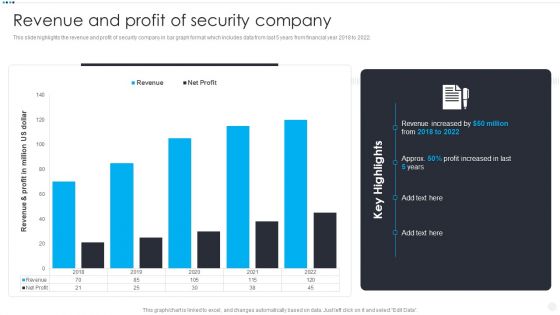
Smart Home Security Solutions Company Profile Revenue And Profit Of Security Company Elements PDF
This slide highlights the revenue and profit of security company in bar graph format which includes data from last 5 years from financial year 2018 to 2022. Deliver and pitch your topic in the best possible manner with this Smart Home Security Solutions Company Profile Revenue And Profit Of Security Company Elements PDF. Use them to share invaluable insights on Revenue And Profit, Million US Dollar, Revenue Increased Profit and impress your audience. This template can be altered and modified as per your expectations. So, grab it now.
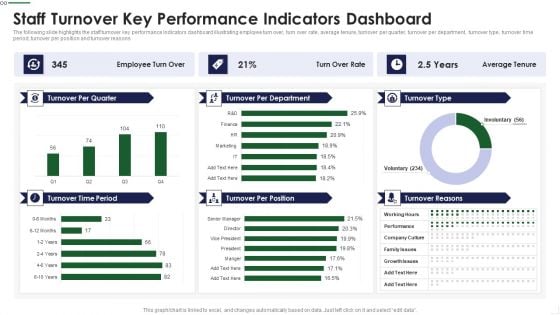
Staff Turnover Key Performance Indicators Dashboard Sample PDF
The following slide highlights the staff turnover key performance Indicators dashboard illustrating employee turn over, turn over rate, average tenure, turnover per quarter, turnover per department, turnover type, turnover time period, turnover per position and turnover reasons Deliver and pitch your topic in the best possible manner with this Staff Turnover Key Performance Indicators Dashboard Sample PDF Use them to share invaluable insights on Management Goals, Subjective Appraisal, Product Defects and impress your audience. This template can be altered and modified as per your expectations. So, grab it now.
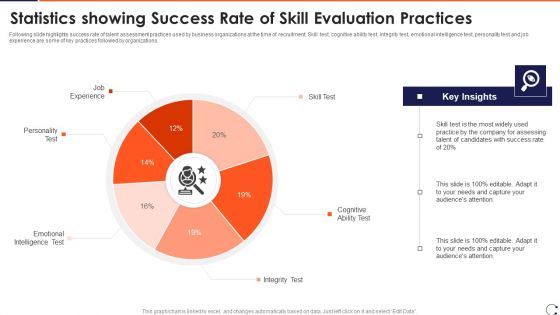
Statistics Showing Success Rate Of Skill Evaluation Practices Topics PDF
Following slide highlights success rate of talent assessment practices used by business organizations at the time of recruitment. Skill test, cognitive ability test, integrity test, emotional intelligence test, personality test and job experience are some of key practices followed by organizations.Pitch your topic with ease and precision using this Statistics Showing Success Rate Of Skill Evaluation Practices Topics PDF This layout presents information on Emotional Intelligence, Test Cognitive, Personality Test It is also available for immediate download and adjustment. So, changes can be made in the color, design, graphics or any other component to create a unique layout.
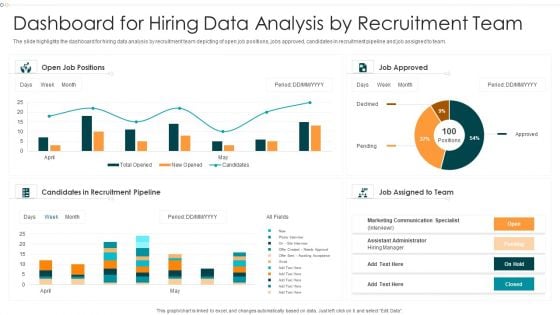
Dashboard For Hiring Data Analysis By Recruitment Team Formats PDF
The slide highlights the dashboard for hiring data analysis by recruitment team depicting of open job positions, jobs approved, candidates in recruitment pipeline and job assigned to team.Pitch your topic with ease and precision using this Dashboard For Hiring Data Analysis By Recruitment Team Formats PDF This layout presents information on Candidates Recruitment, Marketing Communication, Approved It is also available for immediate download and adjustment. So, changes can be made in the color, design, graphics or any other component to create a unique layout.
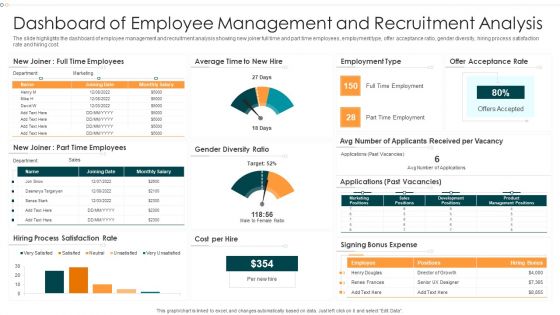
Dashboard Of Employee Management And Recruitment Analysis Infographics PDF
The slide highlights the dashboard of employee management and recruitment analysis showing new joiner full time and part time employees, employment type, offer acceptance ratio, gender diversity, hiring process satisfaction rate and hiring cost.Pitch your topic with ease and precision using this Dashboard Of Employee Management And Recruitment Analysis Infographics PDF This layout presents information on Dashboard Employee, Management, Recruitment Analysis It is also available for immediate download and adjustment. So, changes can be made in the color, design, graphics or any other component to create a unique layout.
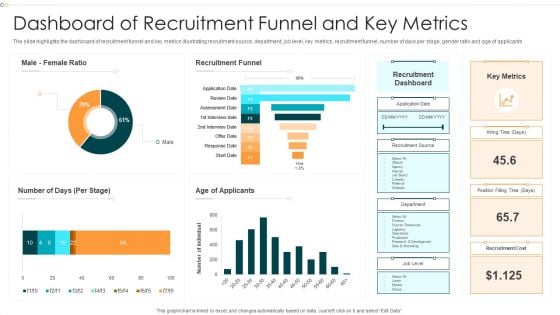
Dashboard Of Recruitment Funnel And Key Metrics Information PDF
The slide highlights the dashboard of recruitment funnel and key metrics illustrating recruitment source, department, job level, key metrics, recruitment funnel, number of days per stage, gender ratio and age of applicants.Pitch your topic with ease and precision using this Dashboard Of Recruitment Funnel And Key Metrics Information PDF This layout presents information on Recruitment Funnel, Recruitment Dashboard, Recruitment Cost It is also available for immediate download and adjustment. So, changes can be made in the color, design, graphics or any other component to create a unique layout.
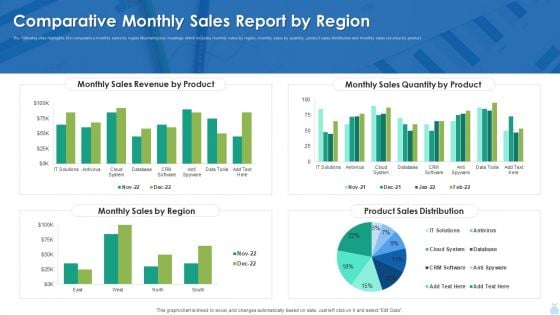
Comparative Monthly Sales Report By Region Graphics PDF
The following slide highlights the comparative monthly sales by region illustrating key headings which includes monthly sales by region, monthly sales by quantity, product sales distribution and monthly sales revenue by product. Showcasing this set of slides titled Comparative Monthly Sales Report By Region Graphics PDF. The topics addressed in these templates are Sales Revenue, Monthly Sales Quantity, Product Sales Distribution. All the content presented in this PPT design is completely editable. Download it and make adjustments in color, background, font etc. as per your unique business setting.
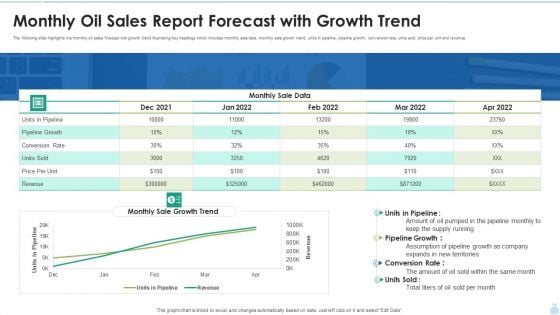
Monthly Oil Sales Report Forecast With Growth Trend Graphics PDF
The following slide highlights the monthly oil sales forecast with growth trend illustrating key headings which includes monthly sale data, monthly sale growth trend, units in pipeline, pipeline growth, conversion rate, units sold, price per unit and revenue. Showcasing this set of slides titled Monthly Oil Sales Report Forecast With Growth Trend Graphics PDF. The topics addressed in these templates are Pipeline Growth, Monthly Sale Data, Conversion Rate. All the content presented in this PPT design is completely editable. Download it and make adjustments in color, background, font etc. as per your unique business setting.
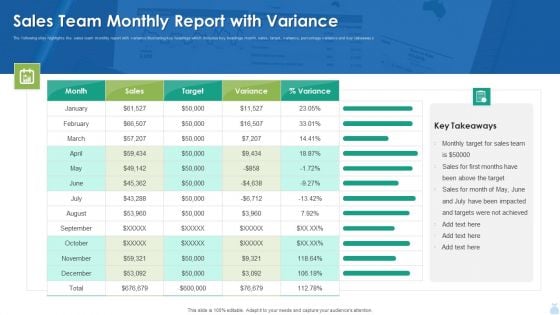
Sales Team Monthly Report With Variance Background PDF
The following slide highlights the sales team monthly report with variance illustrating key headings which includes key headings month, sales, target, variance, percentage variance and key takeaways. Pitch your topic with ease and precision using this Sales Team Monthly Report With Variance Background PDF. This layout presents information on Sales Team Monthly Report With Variance Background PDF. It is also available for immediate download and adjustment. So, changes can be made in the color, design, graphics or any other component to create a unique layout.
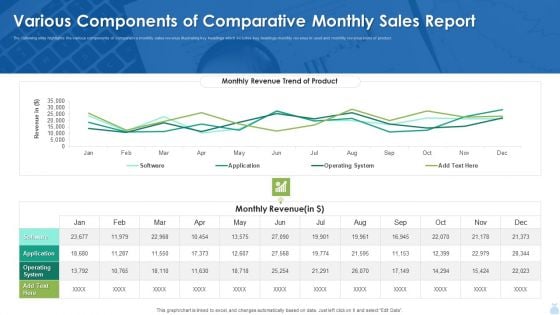
Various Components Of Comparative Monthly Sales Report Inspiration PDF
The following slide highlights the various components of comparative monthly sales revenue illustrating key headings which includes key headings monthly revenue in used and monthly revenue trend of product. Showcasing this set of slides titled Various Components Of Comparative Monthly Sales Report Inspiration PDF. The topics addressed in these templates are Various Components Of Comparative Monthly Sales Report Inspiration PDF. All the content presented in this PPT design is completely editable. Download it and make adjustments in color, background, font etc. as per your unique business setting.

Makeup And Beauty Care Products Company Profile Annual Revenue 2018 To 2022 Sample PDF
This slide highlights the annual revenue of our company in last five years with CAGR from 2018 to 2022 which shows increasing trend due to improved product sales.Deliver and pitch your topic in the best possible manner with this Makeup And Beauty Care Products Company Profile Annual Revenue 2018 To 2022 Sample PDF Use them to share invaluable insights on Revenue Increased, Company Reported, Annual Revenue and impress your audience. This template can be altered and modified as per your expectations. So, grab it now.
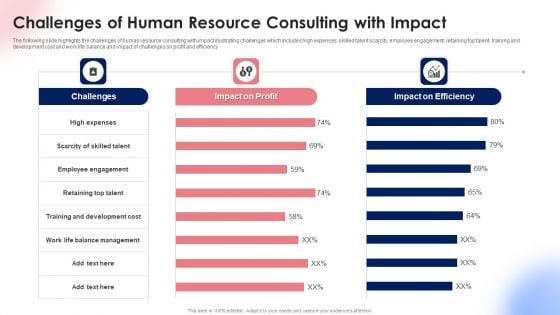
Challenges Of Human Resource Consulting With Impact Ppt Styles Layout PDF
The following slide highlights the challenges of human resource consulting with impact illustrating challenges which includes high expenses, skilled talent scarcity, employee engagement, retaining top talent, training and development cost and work life balance and impact of challenges on profit and efficiency. Showcasing this set of slides titled Challenges Of Human Resource Consulting With Impact Ppt Styles Layout PDF. The topics addressed in these templates are Challenges, Impact On Profit, Impact On Efficiency. All the content presented in this PPT design is completely editable. Download it and make adjustments in color, background, font etc. as per your unique business setting.
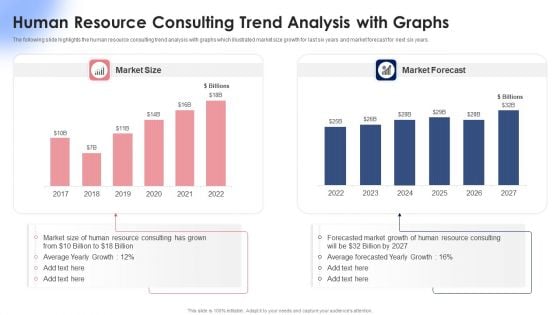
Human Resource Consulting Trend Analysis With Graphs Ppt Summary Clipart Images PDF
The following slide highlights the human resource consulting trend analysis with graphs which illustrated market size growth for last six years and market forecast for next six years. Pitch your topic with ease and precision using this Human Resource Consulting Trend Analysis With Graphs Ppt Summary Clipart Images PDF. This layout presents information on Market Size, Market Forecast, 2017 To 2022. It is also available for immediate download and adjustment. So, changes can be made in the color, design, graphics or any other component to create a unique layout.
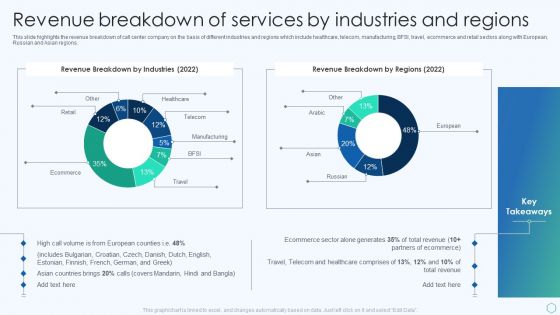
Inbound And Outbound Services Business Profile Revenue Breakdown Of Services Professional PDF
This slide highlights the revenue breakdown of call center company on the basis of different industries and regions which include healthcare, telecom, manufacturing, BFSI, travel, ecommerce and retail sectors along with European, Russian and Asian regions. Deliver and pitch your topic in the best possible manner with this Inbound And Outbound Services Business Profile Revenue Breakdown Of Services Professional PDF. Use them to share invaluable insights on Revenue Breakdown, Manufacturing, Healthcare Comprises and impress your audience. This template can be altered and modified as per your expectations. So, grab it now.
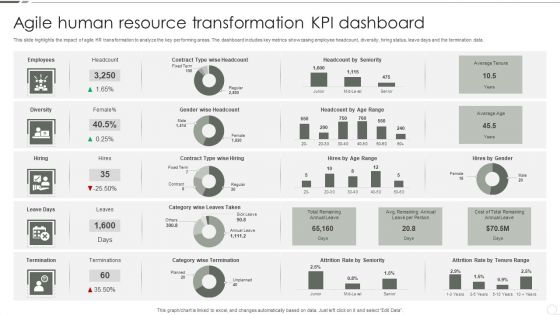
Agile Human Resource Transformation KPI Dashboard Microsoft PDF
This slide highlights the impact of agile HR transformation to analyze the key performing areas. The dashboard includes key metrics showcasing employee headcount, diversity, hiring status, leave days and the termination data. Showcasing this set of slides titled Agile Human Resource Transformation KPI Dashboard Microsoft PDF. The topics addressed in these templates are Employees, Diversity, Hiring, Leave Days, Termination. All the content presented in this PPT design is completely editable. Download it and make adjustments in color, background, font etc. as per your unique business setting.
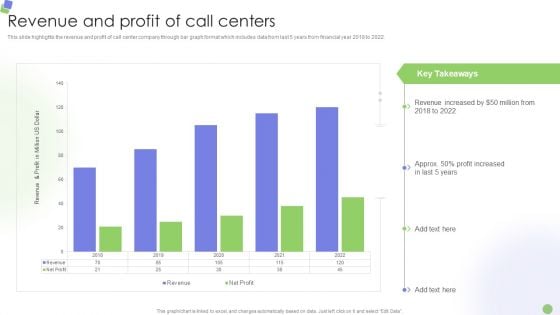
Knowledge Process Outsourcing Company Profile Revenue And Profit Of Call Centers Diagrams PDF
This slide highlights the revenue and profit of call center company through bar graph format which includes data from last 5 years from financial year 2018 to 2022.Deliver and pitch your topic in the best possible manner with this Knowledge Process Outsourcing Company Profile Revenue And Profit Of Call Centers Diagrams PDF. Use them to share invaluable insights on Revenue Increased, Profit Increased, Key Takeaways and impress your audience. This template can be altered and modified as per your expectations. So, grab it now.
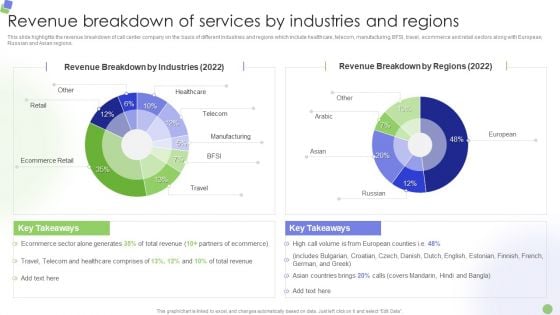
Knowledge Process Outsourcing Company Profile Revenue Breakdown Of Services By Industries And Regions Infographics PDF
This slide highlights the revenue breakdown of call center company on the basis of different industries and regions which include healthcare, telecom, manufacturing, BFSI, travel, ecommerce and retail sectors along with European, Russian and Asian regions. Deliver an awe inspiring pitch with this creative Knowledge Process Outsourcing Company Profile Revenue Breakdown Of Services By Industries And Regions Infographics PDF bundle. Topics like Manufacturing, Ecommerce Retail, Revenue Breakdown can be discussed with this completely editable template. It is available for immediate download depending on the needs and requirements of the user.
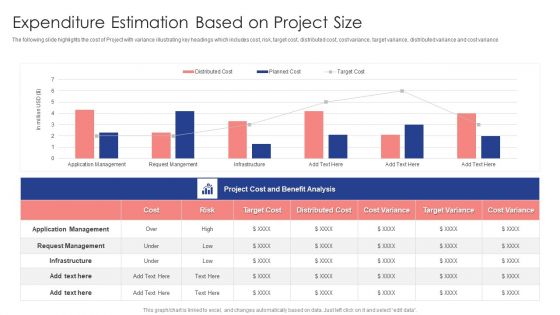
Expenditure Estimation Based On Project Size Ppt Styles Example Introduction PDF
The following slide highlights the cost of Project with variance illustrating key headings which includes cost, risk, target cost, distributed cost, cost variance, target variance, distributed variance and cost variance Showcasing this set of slides titled Expenditure Estimation Based On Project Size Ppt Styles Example Introduction PDF. The topics addressed in these templates are Cost, Risk, Target Cost, Target Variance. All the content presented in this PPT design is completely editable. Download it and make adjustments in color, background, font etc. as per your unique business setting.
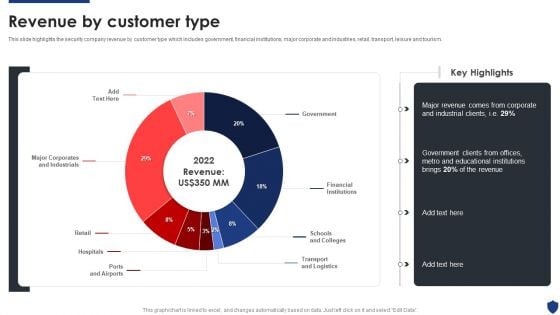
Security Officer Service Company Profile Revenue By Customer Type Ppt PowerPoint Presentation File Themes PDF
This slide highlights the security company revenue by customer type which includes government, financial institutions, major corporate and industries, retail, transport, leisure and tourism. Deliver and pitch your topic in the best possible manner with this Security Officer Service Company Profile Revenue By Customer Type Ppt PowerPoint Presentation File Themes PDF. Use them to share invaluable insights on Government, Financial Institutions, Schools And Colleges, Transport And Logistics and impress your audience. This template can be altered and modified as per your expectations. So, grab it now.
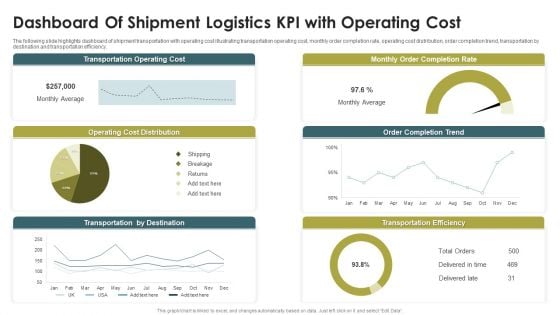
Dashboard Of Shipment Logistics KPI With Operating Cost Ppt Styles Example Topics PDF
The following slide highlights dashboard of shipment transportation with operating cost illustrating transportation operating cost, monthly order completion rate, operating cost distribution, order completion trend, transportation by destination and transportation efficiency. Showcasing this set of slides titled Dashboard Of Shipment Logistics KPI With Operating Cost Ppt Styles Example Topics PDF. The topics addressed in these templates are Transportation Operating Cost, Monthly Order, Completion Rate, Operating Cost Distribution. All the content presented in this PPT design is completely editable. Download it and make adjustments in color, background, font etc. as per your unique business setting.
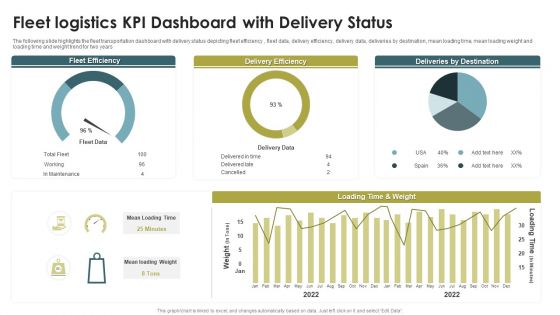
Fleet Logistics KPI Dashboard With Delivery Status Ppt Model Guide PDF
The following slide highlights the fleet transportation dashboard with delivery status depicting fleet efficiency , fleet data, delivery efficiency, delivery data, deliveries by destination, mean loading time, mean loading weight and loading time and weight trend for two years. Pitch your topic with ease and precision using this Fleet Logistics KPI Dashboard With Delivery Status Ppt Model Guide PDF. This layout presents information on Fleet Efficiency, Delivery Efficiency, Deliveries By Destination. It is also available for immediate download and adjustment. So, changes can be made in the color, design, graphics or any other component to create a unique layout.
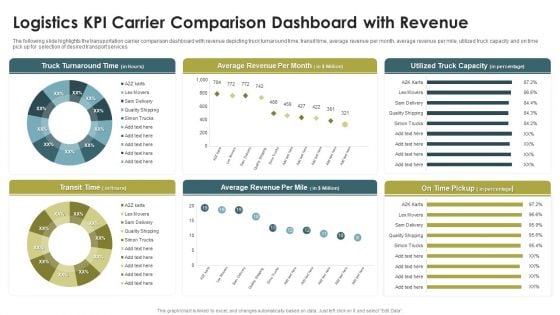
Logistics KPI Carrier Comparison Dashboard With Revenue Ppt Infographics Portfolio PDF
The following slide highlights the transportation carrier comparison dashboard with revenue depicting truck turnaround time, transit time, average revenue per month, average revenue per mile, utilized truck capacity and on time pick up for selection of desired transport services. Pitch your topic with ease and precision using this Logistics KPI Carrier Comparison Dashboard With Revenue Ppt Infographics Portfolio PDF. This layout presents information on Truck Turnaround Time, Average Revenue, Per Month, Transit Time. It is also available for immediate download and adjustment. So, changes can be made in the color, design, graphics or any other component to create a unique layout.
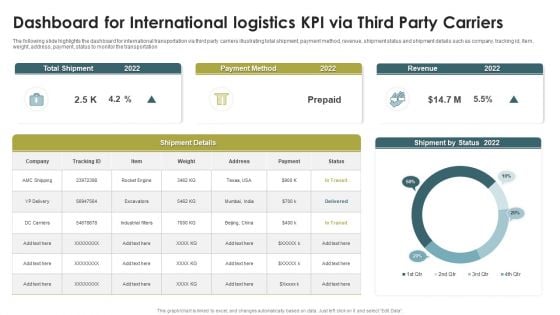
Dashboard For International Logistics KPI Via Third Party Carriers Rules PDF
The following slide highlights the dashboard for international transportation via third party carriers illustrating total shipment, payment method, revenue, shipment status and shipment details such as company, tracking id, Item, weight, address, payment, status to monitor the transportation. Showcasing this set of slides titled Dashboard For International Logistics KPI Via Third Party Carriers Rules PDF. The topics addressed in these templates are Total Shipment, Payment Method, Revenue, 20. All the content presented in this PPT design is completely editable. Download it and make adjustments in color, background, font etc. as per your unique business setting.
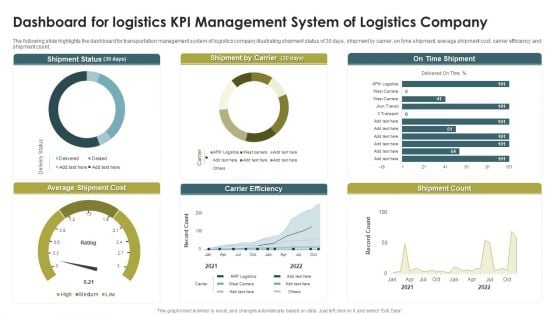
Dashboard For Logistics KPI Management System Of Logistics Company Infographics PDF
The following slide highlights the dashboard for transportation management system of logistics company illustrating shipment status of 30 days, shipment by carrier, on time shipment, average shipment cost, carrier efficiency and shipment count. Pitch your topic with ease and precision using this Dashboard For Logistics KPI Management System Of Logistics Company Infographics PDF. This layout presents information on Shipment Status, Shipment By Carrier, On Time Shipment. It is also available for immediate download and adjustment. So, changes can be made in the color, design, graphics or any other component to create a unique layout.
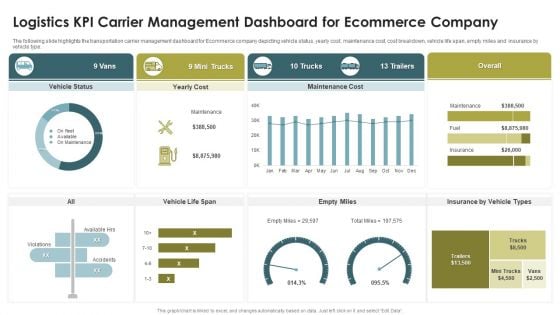
Logistics KPI Carrier Management Dashboard For Ecommerce Company Microsoft PDF
The following slide highlights the transportation carrier management dashboard for Ecommerce company depicting vehicle status, yearly cost, maintenance cost, cost breakdown, vehicle life span, empty miles and insurance by vehicle type. Pitch your topic with ease and precision using this Logistics KPI Carrier Management Dashboard For Ecommerce Company Microsoft PDF. This layout presents information on Mini Trucks, 13 Trailers, Empty Miles, Vehicle Life Span. It is also available for immediate download and adjustment. So, changes can be made in the color, design, graphics or any other component to create a unique layout.
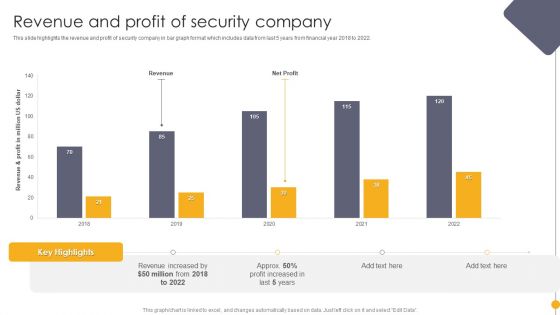
Portable Home Safety Systems Company Profile Revenue And Profit Of Security Company Ideas PDF
This slide highlights the revenue and profit of security company in bar graph format which includes data from last 5 years from financial year 2018 to 2022. Deliver and pitch your topic in the best possible manner with this Portable Home Safety Systems Company Profile Revenue And Profit Of Security Company Ideas PDF. Use them to share invaluable insights on Revenue Increased, 2018 To 2022, Profit Increased and impress your audience. This template can be altered and modified as per your expectations. So, grab it now.
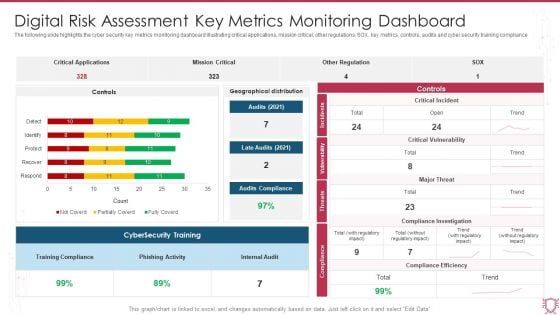
Digital Risk Assessment Key Metrics Monitoring Dashboard Ppt Ideas Diagrams PDF
The following slide highlights the cyber security key metrics monitoring dashboard illustrating critical applications, mission critical, other regulations, SOX, key metrics, controls, audits and cyber security training compliance. Showcasing this set of slides titled Digital Risk Assessment Key Metrics Monitoring Dashboard Ppt Ideas Diagrams PDF. The topics addressed in these templates are Critical Applications, Mission Critical, Other Regulation. All the content presented in this PPT design is completely editable. Download it and make adjustments in color, background, font etc. as per your unique business setting.
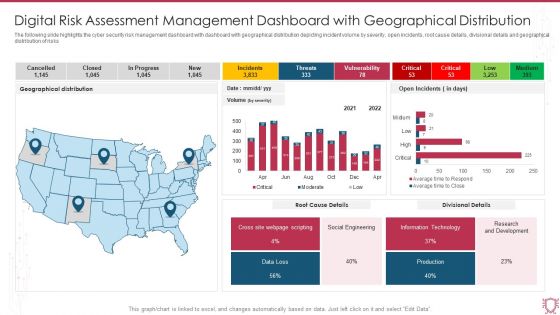
Digital Risk Assessment Management Dashboard With Geographical Distribution Clipart PDF
The following slide highlights the cyber security risk management dashboard with dashboard with geographical distribution depicting incident volume by severity, open incidents, root cause details, divisional details and geographical distribution of risks. Pitch your topic with ease and precision using this Digital Risk Assessment Management Dashboard With Geographical Distribution Clipart PDF. This layout presents information on Geographical Distribution, Root Cause Details, Divisional Details, Social Engineering. It is also available for immediate download and adjustment. So, changes can be made in the color, design, graphics or any other component to create a unique layout.
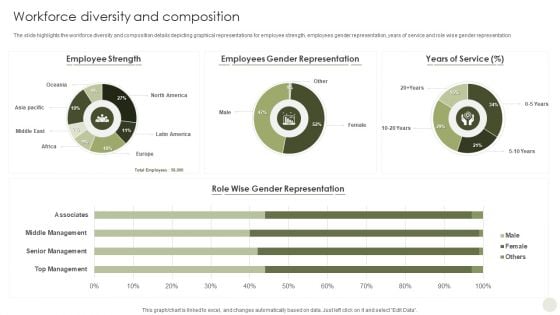
Commercial Bank Financial Services Company Profile Workforce Diversity And Composition Demonstration PDF
The slide highlights the workforce diversity and composition details depicting graphical representations for employee strength, employees gender representation, years of service and role wise gender representation. Deliver and pitch your topic in the best possible manner with this Commercial Bank Financial Services Company Profile Workforce Diversity And Composition Demonstration PDF. Use them to share invaluable insights on Employee Strength, Employees Gender Representation, Years Of Service and impress your audience. This template can be altered and modified as per your expectations. So, grab it now.

Personal Care Company Profile Annual Revenue 2018 To 2022 Graphics PDF
This slide highlights the annual revenue of our company in last five years with CAGR from 2018 to 2022 which shows increasing trend due to improved product sales. Deliver and pitch your topic in the best possible manner with this Personal Care Company Profile Annual Revenue 2018 To 2022 Graphics PDF. Use them to share invaluable insights on Annual Revenue, Key Insights, Annual Revenue, 2018 To 2022 and impress your audience. This template can be altered and modified as per your expectations. So, grab it now.
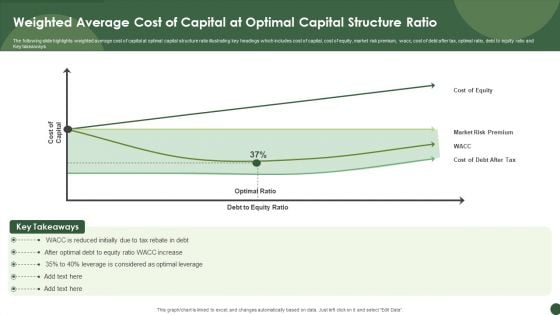
Weighted Average Cost Of Capital At Optimal Capital Structure Ratio Sample PDF
The following slide highlights weighted average cost of capital at optimal capital structure ratio illustrating key headings which includes cost of capital, cost of equity, market risk premium, wacc, cost of debt after tax, optimal ratio, debt to equity ratio and Key takeaways.Pitch your topic with ease and precision using this Weighted Average Cost Of Capital At Optimal Capital Structure Ratio Sample PDF. This layout presents information on Reduced Initially, Leverage Considered, Optimal Leverage. It is also available for immediate download and adjustment. So, changes can be made in the color, design, graphics or any other component to create a unique layout.
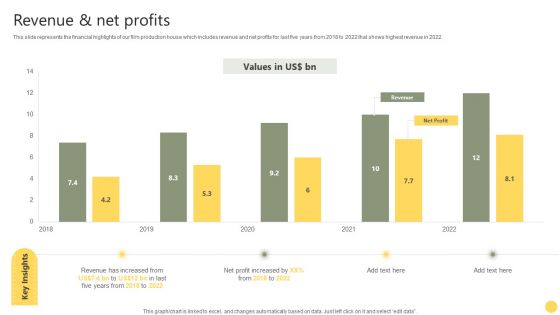
Film Making Firm Profile Revenue And Net Profits Ppt PowerPoint Presentation Gallery Template PDF
This slide represents the financial highlights of our film production house which includes revenue and net profits for last five years from 2018 to 2022 that shows highest revenue in 2022. Deliver an awe inspiring pitch with this creative Film Making Firm Profile Revenue And Net Profits Ppt PowerPoint Presentation Gallery Template PDF bundle. Topics like 2018 To 2022, Net Profit Increased, Revenue can be discussed with this completely editable template. It is available for immediate download depending on the needs and requirements of the user.

Customized Marketing Impact On Conversion Rates Ppt PowerPoint Presentation Gallery Slideshow PDF
This slide highlights the comparative analysis on conversion rates from the use customized marketing. The platform includes search engine marketing, website, email and social media. Pitch your topic with ease and precision using this Customized Marketing Impact On Conversion Rates Ppt PowerPoint Presentation Gallery Slideshow PDF. This layout presents information on Search Engine Marketing, Social Media, Mobile Apps. It is also available for immediate download and adjustment. So, changes can be made in the color, design, graphics or any other component to create a unique layout.

Business Performance Review Dashboard To Measure Overall Business Performance Formats PDF
The following slide highlights a comprehensive quarterly business review QBR dashboard which can be used by the organization to evaluate business performance. The metrics used for review are total revenue, new customers, gross profit, overall costs, sales comparison, sales by different products and top performing channels. Showcasing this set of slides titled Business Performance Review Dashboard To Measure Overall Business Performance Formats PDF. The topics addressed in these templates are Sales Comparison, Sales Product, High Performing. All the content presented in this PPT design is completely editable. Download it and make adjustments in color, background, font etc. as per your unique business setting.
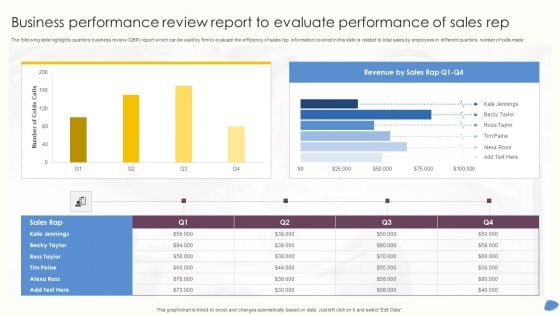
Business Performance Review Report To Evaluate Performance Of Sales Rep Infographics PDF
The following slide highlights quarterly business review QBR report which can be used by firm to evaluate the efficiency of sales rep. information covered in this slide is related to total sales by employees in different quarters, number of calls made. Pitch your topic with ease and precision using this Business Performance Review Report To Evaluate Performance Of Sales Rep Infographics PDF. This layout presents information on Revenue Sales, Tim Paine, Number Colds Calls. It is also available for immediate download and adjustment. So, changes can be made in the color, design, graphics or any other component to create a unique layout.
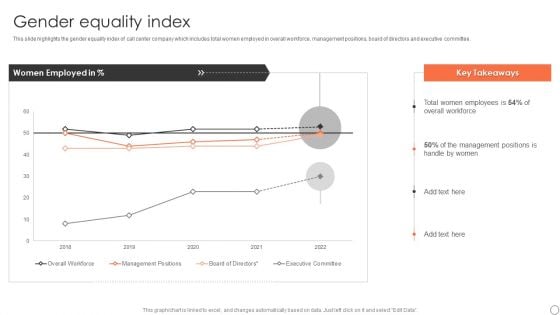
Customer Support Services Company Profile Gender Equality Index Ppt File Outline PDF
This slide highlights the gender equality index of call center company which includes total women employed in overall workforce, management positions, board of directors and executive committee. Deliver and pitch your topic in the best possible manner with this Customer Support Services Company Profile Gender Equality Index Ppt File Outline PDF. Use them to share invaluable insights on Women Employed, Overall Workforce, Management Positions, 2018 To 2022 and impress your audience. This template can be altered and modified as per your expectations. So, grab it now.
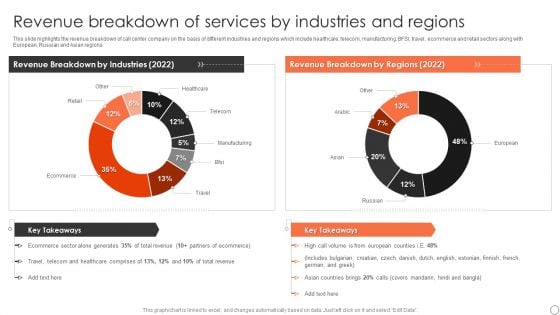
Customer Support Services Company Profile Revenue Breakdown Of Services By Industries Elements PDF
This slide highlights the revenue breakdown of call center company on the basis of different industries and regions which include healthcare, telecom, manufacturing, BFSI, travel, ecommerce and retail sectors along with European, Russian and Asian regions. Deliver and pitch your topic in the best possible manner with this Customer Support Services Company Profile Revenue Breakdown Of Services By Industries Elements PDF. Use them to share invaluable insights on Revenue Breakdown Industries, Revenue Breakdown Regions, Healthcare and impress your audience. This template can be altered and modified as per your expectations. So, grab it now.
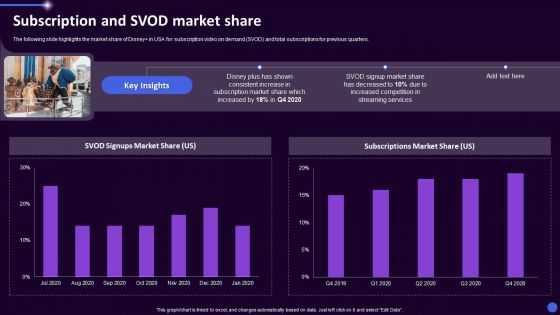
Disney Plus OTT Platform Company Summary Subscription And Svod Market Share Portrait PDF
The following slide highlights the market share of Disney in USA for subscription video on demand SVOD and total subscriptions for previous quarters. Deliver and pitch your topic in the best possible manner with this Disney Plus OTT Platform Company Summary Subscription And Svod Market Share Portrait PDF. Use them to share invaluable insights on SVOD Signups Market Share, Subscriptions Market Share, 2019 To 2022 and impress your audience. This template can be altered and modified as per your expectations. So, grab it now.
Disney Plus OTT Platform Company Summary Subscription Video On Demand Market Share Icons PDF
The following slide highlights the global market share of top OTT platforms along with global subscribers in FY2021. The major OTT platforms includes Netflix, Amazon, Disney and HBO Max. Deliver an awe inspiring pitch with this creative Disney Plus OTT Platform Company Summary Subscription Video On Demand Market Share Icons PDF bundle. Topics like Global Subscribers, Global SVOD, Market Share, 2021 can be discussed with this completely editable template. It is available for immediate download depending on the needs and requirements of the user.
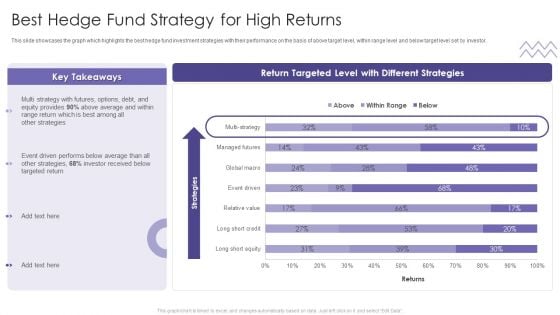
Evaluating Hedge Funds For Greater ROI Best Hedge Fund Strategy For High Returns Brochure PDF
This slide showcases the graph which highlights the best hedge fund investment strategies with their performance on the basis of above target level, within range level and below target level set by investor. Deliver an awe inspiring pitch with this creative Evaluating Hedge Funds For Greater ROI Best Hedge Fund Strategy For High Returns Brochure PDF bundle. Topics like Multi Strategy, Range Return, Strategies, Targeted Return can be discussed with this completely editable template. It is available for immediate download depending on the needs and requirements of the user.
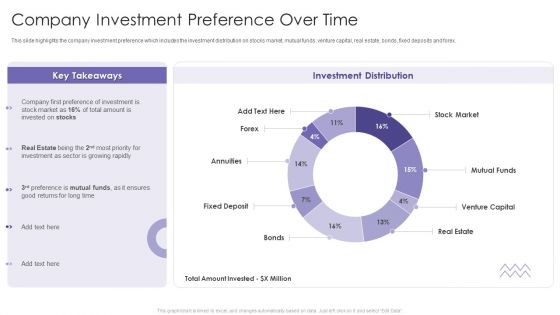
Evaluating Hedge Funds For Greater ROI Company Investment Preference Over Time Diagrams PDF
This slide highlights the company investment preference which includes the investment distribution on stocks market, mutual funds, venture capital, real estate, bonds, fixed deposits and forex. Deliver and pitch your topic in the best possible manner with this Evaluating Hedge Funds For Greater ROI Company Investment Preference Over Time Diagrams PDF. Use them to share invaluable insights on Investment Distribution, Stock Market, Mutual Funds, Venture Capital and impress your audience. This template can be altered and modified as per your expectations. So, grab it now.
Evaluating Hedge Funds For Greater ROI Hedge Fund Performance Over Time Icons PDF
This slide highlights the hedge fund performance which includes the HFRI equity hedge, event driven hedge, relative value hedge, HFRI macro and US crop fixed income with return rate. Deliver and pitch your topic in the best possible manner with this Evaluating Hedge Funds For Greater ROI Hedge Fund Performance Over Time Icons PDF. Use them to share invaluable insights on Different Funds Performance, Hedge Funds, Goals, Organization and impress your audience. This template can be altered and modified as per your expectations. So, grab it now.

Personal Job Assignment Distribution Dashboard With Work Patterns Diagrams PDF
The following slide highlights the employee workload distribution dashboard with work patterns illustrating key headings which includes work patterns, work time summary, workload distribution by location and workload summary by time spent. Showcasing this set of slides titled Personal Job Assignment Distribution Dashboard With Work Patterns Diagrams PDF. The topics addressed in these templates are Work Patterns, Workload Distribution, Work Location. All the content presented in this PPT design is completely editable. Download it and make adjustments in color, background, font etc. as per your unique business setting.
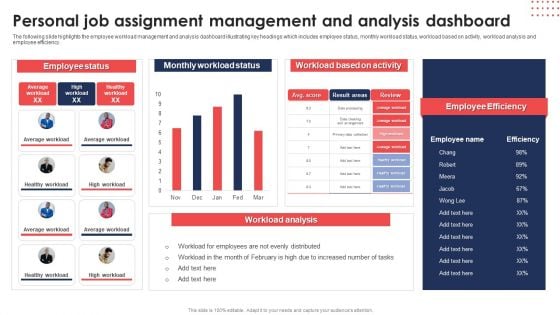
Personal Job Assignment Management And Analysis Dashboard Diagrams PDF
The following slide highlights the employee workload management and analysis dashboard illustrating key headings which includes employee status, monthly workload status, workload based on activity, workload analysis and employee efficiency. Pitch your topic with ease and precision using thisPersonal Job Assignment Management And Analysis Dashboard Diagrams PDF. This layout presents information on Employee Status, Monthly Workload Status, Workload Based Activity. It is also available for immediate download and adjustment. So, changes can be made in the color, design, graphics or any other component to create a unique layout.
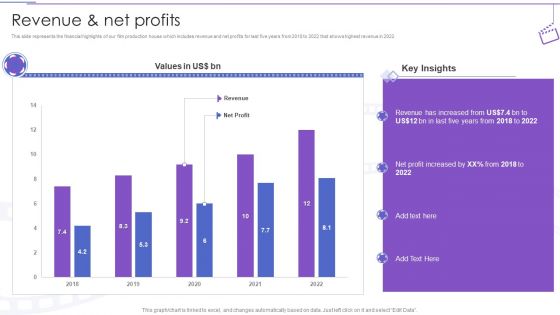
Film Making Company Outline Revenue And Net Profits Ppt PowerPoint Presentation Ideas Slide Portrait PDF
This slide represents the financial highlights of our film production house which includes revenue and net profits for last five years from 2018 to 2022 that shows highest revenue in 2022.Deliver an awe inspiring pitch with this creative Film Making Company Outline Revenue And Net Profits Ppt PowerPoint Presentation Ideas Slide Portrait PDF bundle. Topics like Revenue Increased, Five Years, Profit Increased can be discussed with this completely editable template. It is available for immediate download depending on the needs and requirements of the user.
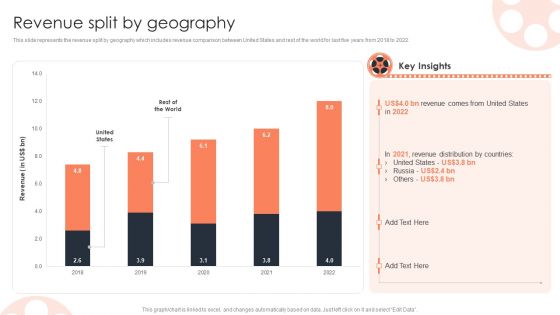
Revenue Split By Geography Film Media Company Profile Ppt PowerPoint Presentation Infographics Infographics PDF
This slide represents the financial highlights of our film production house which includes revenue and net profits for last five years from 2018 to 2022 that shows highest revenue in 2022.Deliver and pitch your topic in the best possible manner with this Revenue Split By Geography Film Media Company Profile Ppt PowerPoint Presentation Infographics Infographics PDF. Use them to share invaluable insights on United States, Revenue Distribution, Key Insights and impress your audience. This template can be altered and modified as per your expectations. So, grab it now.
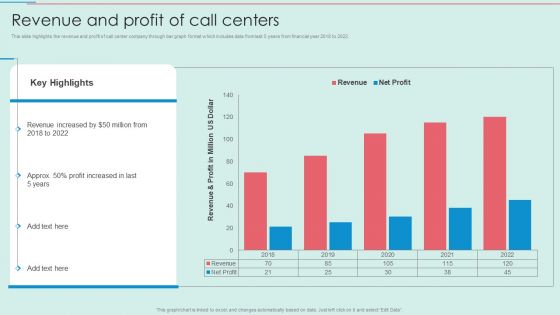
BPO Call Center Company Profile Revenue And Profit Of Call Centers Template PDF
This slide highlights the revenue and profit of call center company through bar graph format which includes data from last 5 years from financial year 2018 to 2022.Deliver and pitch your topic in the best possible manner with this BPO Call Center Company Profile Revenue And Profit Of Call Centers Template PDF. Use them to share invaluable insights on Revenue Increased, Profit Increased, Profit Million and impress your audience. This template can be altered and modified as per your expectations. So, grab it now.
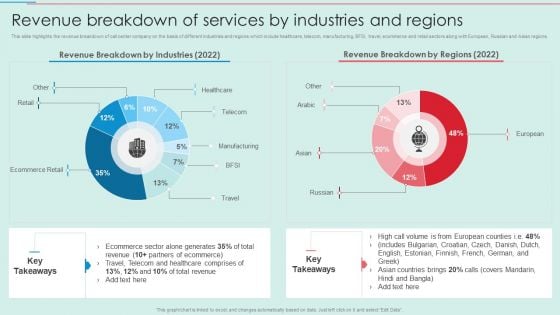
BPO Call Center Company Profile Revenue Breakdown Of Services By Industries And Regions Professional PDF
This slide highlights the revenue breakdown of call center company on the basis of different industries and regions which include healthcare, telecom, manufacturing, BFSI, travel, ecommerce and retail sectors along with European, Russian and Asian regions. Deliver an awe inspiring pitch with this creative BPO Call Center Company Profile Revenue Breakdown Of Services By Industries And Regions Professional PDF bundle. Topics like Ecommerce Retail, Ecommerce Generates, Healthcare Comprises can be discussed with this completely editable template. It is available for immediate download depending on the needs and requirements of the user.


 Continue with Email

 Home
Home


