Program Management Dashboard
Sales Order Processing Performance Tracking Indicators Graphics PDF
The following slide showcases key performance indicators for sales order fulfilment to meet customer expectations, specifications, deliver goods on time, compare order fulfilment against past orders. It includes elements such as category, key performance indicators, expected rate and actual rate. Showcasing this set of slides titled Sales Order Processing Performance Tracking Indicators Graphics PDF. The topics addressed in these templates are Customer Metrics, Inbound Metrics, Financial Metrics. All the content presented in this PPT design is completely editable. Download it and make adjustments in color, background, font etc. as per your unique business setting.
Internal And External Data Sources In Organization Icon Icons PDF
Pitch your topic with ease and precision using this Internal And External Data Sources In Organization Icon Icons PDF. This layout presents information on Internal And External Data, Sources In Organization. It is also available for immediate download and adjustment. So, changes can be made in the color, design, graphics or any other component to create a unique layout.
Organization Data Breach Incident Communication Strategy Icon Infographics PDF
Pitch your topic with ease and precision using this Organization Data Breach Incident Communication Strategy Icon Infographics PDF. This layout presents information on Organization Data, Breach Incident, Communication Strategy. It is also available for immediate download and adjustment. So, changes can be made in the color, design, graphics or any other component to create a unique layout.
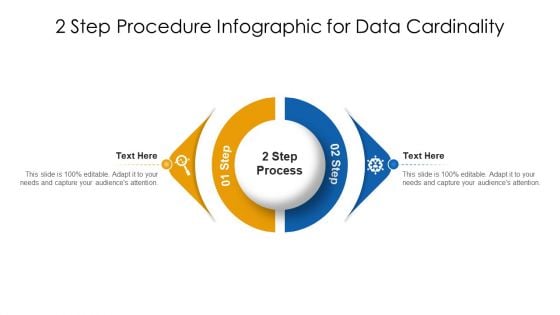
2 Step Procedure Infographic For Data Cardinality Ppt PowerPoint Presentation Gallery Designs Download PDF
Persuade your audience using this 2 step procedure infographic for data cardinality ppt powerpoint presentation gallery designs download pdf. This PPT design covers two stages, thus making it a great tool to use. It also caters to a variety of topics including 2 step procedure infographic for data cardinality. Download this PPT design now to present a convincing pitch that not only emphasizes the topic but also showcases your presentation skills.

Diagram Business Data Analysis 8 Stages Ppt Annual Plan Template PowerPoint Slides
We present our diagram business data analysis 8 stages ppt annual plan template PowerPoint Slides.Download and present our Process and Flows PowerPoint Templates because Our PowerPoint Templates and Slides will weave a web of your great ideas. They are gauranteed to attract even the most critical of your colleagues. Download and present our Circle Charts PowerPoint Templates because Our PowerPoint Templates and Slides will let you Leave a lasting impression to your audiences. They possess an inherent longstanding recall factor. Use our Business PowerPoint Templates because our bewitching PowerPoint Templates and Slides will delight your audience with the magic of your words. Download and present our Marketing PowerPoint Templates because Our PowerPoint Templates and Slides will weave a web of your great ideas. They are gauranteed to attract even the most critical of your colleagues. Download our Shapes PowerPoint Templates because You can Be the star of the show with our PowerPoint Templates and Slides. Rock the stage with your ideas.Use these PowerPoint slides for presentations relating to Provider, plan, vector, diagram, circle, insurance, graphic, service, graph, wheel, illustration, chart, round, primary, specialist, clipart, care, choosing, clip, blue, text, physician, maintenance, , organization, art, preferred, point, deductible, business. The prominent colors used in the PowerPoint template are Blue, Gray, Black. Fight back gamely with our Diagram Business Data Analysis 8 Stages Ppt Annual Plan Template PowerPoint Slides. Make adversity back off with your thoughts.
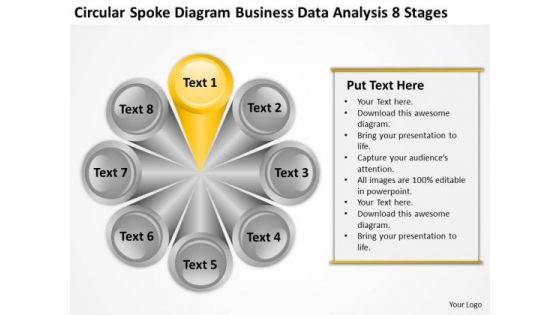
Diagram Business Data Analysis 8 Stages Ppt For Plan PowerPoint Templates
We present our diagram business data analysis 8 stages ppt for plan PowerPoint templates.Download our Process and Flows PowerPoint Templates because Our PowerPoint Templates and Slides will give you great value for your money. Be assured of finding the best projection to highlight your words. Present our Circle Charts PowerPoint Templates because Our PowerPoint Templates and Slides will let you Leave a lasting impression to your audiences. They possess an inherent longstanding recall factor. Use our Business PowerPoint Templates because Our PowerPoint Templates and Slides are like the strings of a tennis racquet. Well strung to help you serve aces. Present our Marketing PowerPoint Templates because You should Press the right buttons with our PowerPoint Templates and Slides. They will take your ideas down the perfect channel. Download our Shapes PowerPoint Templates because Our PowerPoint Templates and Slides help you pinpoint your timelines. Highlight the reasons for your deadlines with their use.Use these PowerPoint slides for presentations relating to Provider, plan, vector, diagram, circle, insurance, graphic, service, graph, wheel, illustration, chart, round, primary, specialist, clipart, care, choosing, clip, blue, text, physician, maintenance, , organization, art, preferred, point, deductible, business. The prominent colors used in the PowerPoint template are Orange, Gray, Black. Get familiar with our Diagram Business Data Analysis 8 Stages Ppt For Plan PowerPoint Templates. They will prove an excellent ally.

Quarterly Recruitment Report Sheet Status For Various Departments Portrait PDF
Following slide demonstrates quarterly hiring status which assist organizations to assess overall success of recruitment campaign and identify areas for improvement. This slide provides data regarding various organizational departments, job position and four quarters. Pitch your topic with ease and precision using this Quarterly Recruitment Report Sheet Status For Various Departments Portrait PDF. This layout presents information on Sales And Marketing, Human Resource, Research And Development, Production, Finance, Engineering. It is also available for immediate download and adjustment. So, changes can be made in the color, design, graphics or any other component to create a unique layout.
Magnifying Glass Ppt PowerPoint Presentation Icon Slide Download
This is a magnifying glass ppt powerpoint presentation icon slide download. This is a four stage process. The stages in this process are business, marketing, technology, magnifier, strategy.
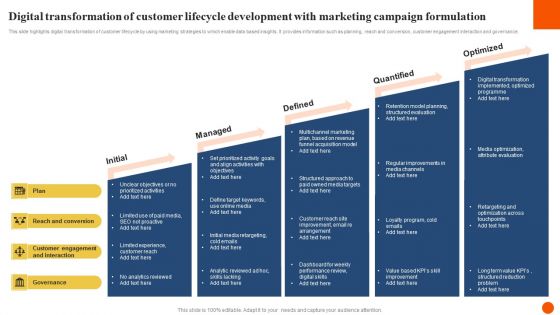
Digital Transformation Of Customer Lifecycle Development With Marketing Campaign Formulation Structure PDF
This slide highlights digital transformation of customer lifecycle by using marketing strategies to which enable data based insights. It provides information such as planning, reach and conversion, customer engagement interaction and governance. Presenting Digital Transformation Of Customer Lifecycle Development With Marketing Campaign Formulation Structure PDF to dispense important information. This template comprises five stages. It also presents valuable insights into the topics including Initial, Managed, Defined, Quantified, Optimized. This is a completely customizable PowerPoint theme that can be put to use immediately. So, download it and address the topic impactfully.
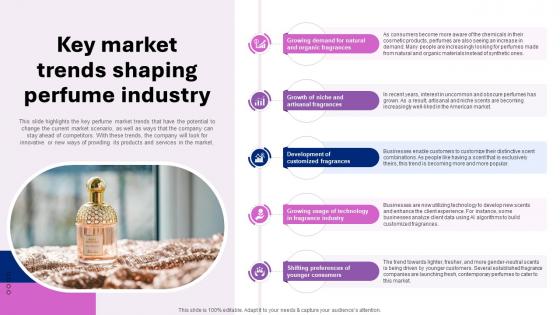
Perfume Manufacturing Business Plan Key Market Trends Shaping Perfume Industry BP SS V
This slide highlights the key perfume market trends that have the potential to change the current market scenario, as well as ways that the company can stay ahead of competitors. With these trends, the company will look for innovative or new ways of providing its products and services in the market. Make sure to capture your audiences attention in your business displays with our gratis customizable Perfume Manufacturing Business Plan Key Market Trends Shaping Perfume Industry BP SS V. These are great for business strategies, office conferences, capital raising or task suggestions. If you desire to acquire more customers for your tech business and ensure they stay satisfied, create your own sales presentation with these plain slides. This slide highlights the key perfume market trends that have the potential to change the current market scenario, as well as ways that the company can stay ahead of competitors. With these trends, the company will look for innovative or new ways of providing its products and services in the market.
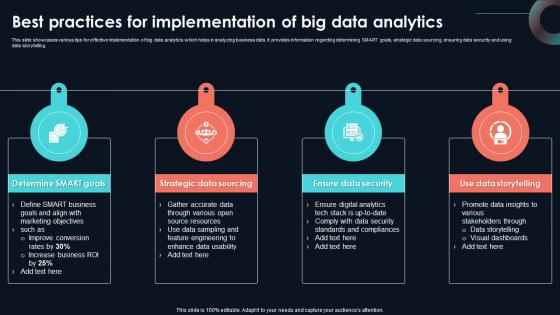
Best Practices For Implementation Of Developing Strategic Insights Using Big Data Analytics SS V
This slide showcases various tips for effective implementation of big data analytics which helps in analyzing business data. It provides information regarding determining SMART goals, strategic data sourcing, ensuring data security and using data storytelling. Present like a pro with Best Practices For Implementation Of Developing Strategic Insights Using Big Data Analytics SS V. Create beautiful presentations together with your team, using our easy-to-use presentation slides. Share your ideas in real-time and make changes on the fly by downloading our templates. So whether you are in the office, on the go, or in a remote location, you can stay in sync with your team and present your ideas with confidence. With Slidegeeks presentation got a whole lot easier. Grab these presentations today. This slide showcases various tips for effective implementation of big data analytics which helps in analyzing business data. It provides information regarding determining SMART goals, strategic data sourcing, ensuring data security and using data storytelling.
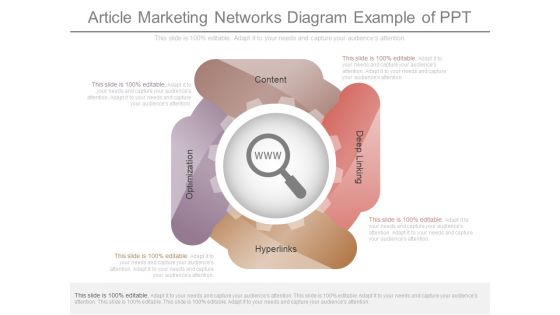
Article Marketing Networks Diagram Example Of Ppt
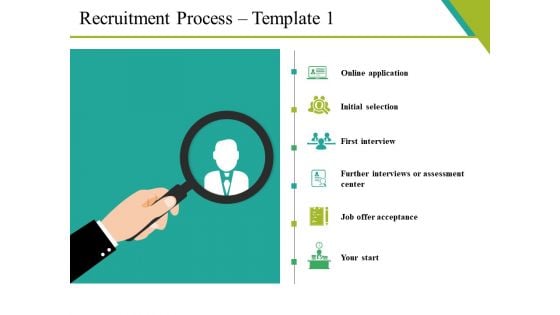
Recruitment Process Template 1 Ppt PowerPoint Presentation Inspiration File Formats
This is a recruitment process template 1 ppt powerpoint presentation inspiration file formats. This is a six stage process. The stages in this process are online application, initial selection, first interview, job offer acceptance, your start.
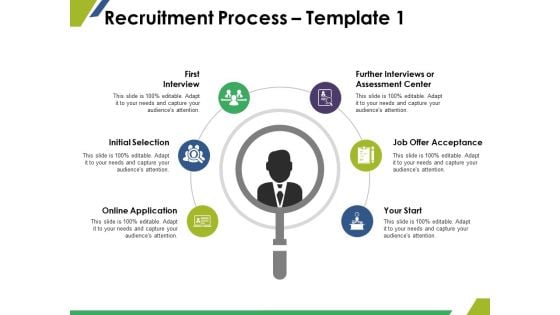
Recruitment Process Template 1 Ppt PowerPoint Presentation Gallery Professional
This is a recruitment process template 1 ppt powerpoint presentation gallery professional. This is a six stage process. The stages in this process are first interview, initial selection, online application, further interviews or assessment center, job offer acceptance.
List Business Key Performance Indicators Ppt PowerPoint Presentation Icon Designs Download
Presenting this set of slides with name list business key performance indicators ppt powerpoint presentation icon designs download. This is an editable Powerpoint four stages graphic that deals with topics like list business key performance indicators to help convey your message better graphically. This product is a premium product available for immediate download and is 100 percent editable in Powerpoint. Download this now and use it in your presentations to impress your audience.
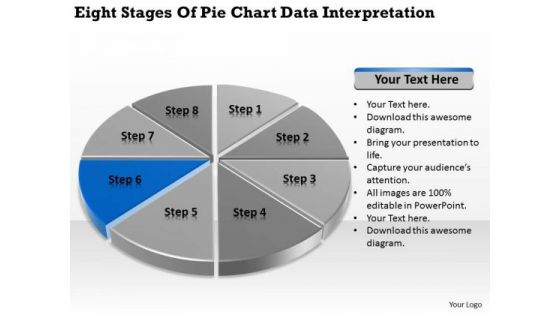
Stages Of Pie Chart Data Interpretation Example Business Plan PowerPoint Slides
We present our stages of pie chart data interpretation example business plan PowerPoint Slides.Download and present our Circle Charts PowerPoint Templates because It will let you Set new benchmarks with our PowerPoint Templates and Slides. They will keep your prospects well above par. Download our Marketing PowerPoint Templates because Our PowerPoint Templates and Slides will weave a web of your great ideas. They are gauranteed to attract even the most critical of your colleagues. Use our Business PowerPoint Templates because It will Strengthen your hand with your thoughts. They have all the aces you need to win the day. Present our Shapes PowerPoint Templates because It will get your audience in sync. Present our Process and Flows PowerPoint Templates because Our PowerPoint Templates and Slides will generate and maintain the level of interest you desire. They will create the impression you want to imprint on your audience.Use these PowerPoint slides for presentations relating to achievement, analysis, background, bank, banking, business, calculation, chart, circle, commerce, commercial, commission, concept, credit, crisis, debt, deposit, design, detail, diagram, earnings, economics, economy, element, finance, goal, gold, golden, graph, graphic, growth, icon, idea, illustration, income, increase, invest, isolated, level, loss, market, marketing, metal, modern, money, new, object, part, percent, percentage, pie, plot, politics, profit, progress, ratio, reflection, reflective. The prominent colors used in the PowerPoint template are Blue navy, Gray, Black. Add emphasis to your ideas with our Stages Of Pie Chart Data Interpretation Example Business Plan PowerPoint Slides. Lend greater credence to your expression.

Magnifying Glass Ppt PowerPoint Presentation Styles Smartart
This is a magnifying glass ppt powerpoint presentation styles smartart. This is a three stage process. The stages in this process are technology, marketing, business, marketing, planning.
Professional Candidate Hiring Process Upgrading Icon Clipart PDF
Persuade your audience using this Professional Candidate Hiring Process Upgrading Icon Clipart PDF. This PPT design covers Three stages, thus making it a great tool to use. It also caters to a variety of topics including Professional Candidate, Hiring Process Upgrading. Download this PPT design now to present a convincing pitch that not only emphasizes the topic but also showcases your presentation skills.

Fingerprint Recognition Image Processing Ppt PowerPoint Presentation Ideas Summary
Presenting this set of slides with name fingerprint recognition image processing ppt powerpoint presentation ideas summary. This is a one stage process. The stages in this process are fingerprints, biometrics for identity security, fingerprint recognition. This is a completely editable PowerPoint presentation and is available for immediate download. Download now and impress your audience.
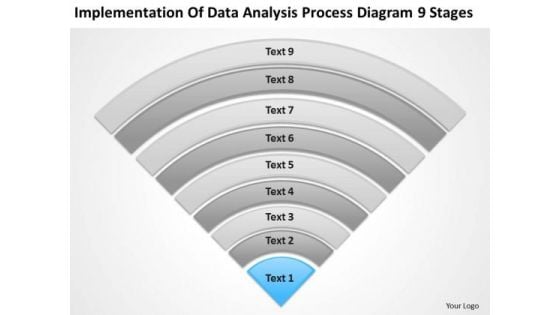
Data Analysis Process Diagram 9 Stages Ppt Business Plan PowerPoint Slides
We present our data analysis process diagram 9 stages ppt business plan PowerPoint Slides.Download our Flow Charts PowerPoint Templates because our PowerPoint Templates and Slides will give your ideas the shape. Present our Business PowerPoint Templates because Our PowerPoint Templates and Slides are created with admirable insight. Use them and give your group a sense of your logical mind. Use our Process and Flows PowerPoint Templates because Our PowerPoint Templates and Slides come in all colours, shades and hues. They help highlight every nuance of your views. Present our Marketing PowerPoint Templates because You have the co-ordinates for your destination of success. Let our PowerPoint Templates and Slides map out your journey. Download our Triangles PowerPoint Templates because Our PowerPoint Templates and Slides will effectively help you save your valuable time. They are readymade to fit into any presentation structure. Use these PowerPoint slides for presentations relating to Saturation, strip, saturated, line, spectrum, pantone, bright, diagram, circle, sampler, guide, element, paint, scale,shape, ten, multicolored, palette, illustration, spectral, guidance, chart, collection, abstraction, selection, choice, visible, variation, painter, contrast, ,gradient, pattern, chooser, analyzer. The prominent colors used in the PowerPoint template are Blue light, Gray, White. Attain your aim with our Data Analysis Process Diagram 9 Stages Ppt Business Plan PowerPoint Slides. No achievement is too far away for them.

Employee Performing Daily Tasks During Remote Working Ppt PowerPoint Presentation Infographics Picture PDF
Presenting employee performing daily tasks during remote working ppt powerpoint presentation infographics picture pdf to dispense important information. This template comprises three stages. It also presents valuable insights into the topics including employee performing daily tasks during remote working. This is a completely customizable PowerPoint theme that can be put to use immediately. So, download it and address the topic impactfully.
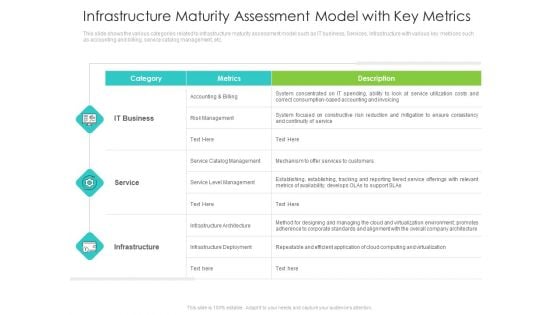
Infrastructure Administration Procedure Maturity Model Infrastructure Maturity Assessment Model With Key Metrics Rules PDF
Deliver an awe inspiring pitch with this creative infrastructure administration procedure maturity model infrastructure maturity assessment model with key metrics rules pdf bundle. Topics like category, metrics, description can be discussed with this completely editable template. It is available for immediate download depending on the needs and requirements of the user.
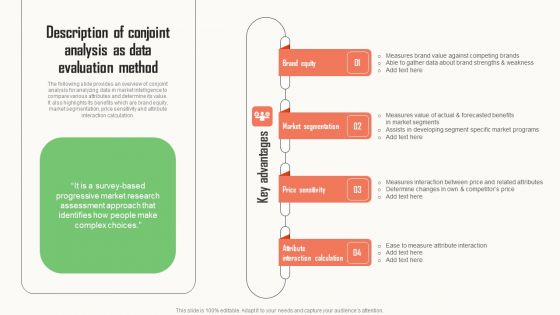
Strategic Market Insight Implementation Guide Description Of Conjoint Analysis As Data Evaluation Method Graphics PDF
The following slide provides an overview of conjoint analysis for analyzing data in market intelligence to compare various attributes and determine its value. It also highlights its benefits which are brand equity, market segmentation, price sensitivity and attribute interaction calculation. Whether you have daily or monthly meetings, a brilliant presentation is necessary. Strategic Market Insight Implementation Guide Description Of Conjoint Analysis As Data Evaluation Method Graphics PDF can be your best option for delivering a presentation. Represent everything in detail using Strategic Market Insight Implementation Guide Description Of Conjoint Analysis As Data Evaluation Method Graphics PDF and make yourself stand out in meetings. The template is versatile and follows a structure that will cater to your requirements. All the templates prepared by Slidegeeks are easy to download and edit. Our research experts have taken care of the corporate themes as well. So, give it a try and see the results.
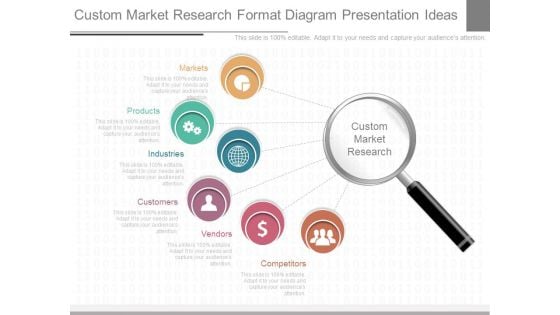
Custom Market Research Format Diagram Presentation Ideas
This is a custom market research format diagram presentation ideas. This is a six stage process. The stages in this process are markets, products, industries, customers, vendors, competitors, custom market research.
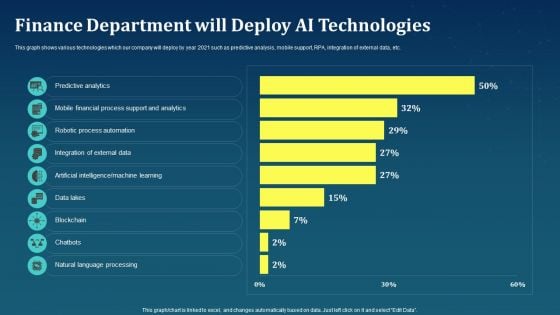
Finance Department Will Deploy AI Technologies AI For Brand Administration Graphics PDF
This graph shows various technologies which our company will deploy by year 2021 such as predictive analysis, mobile support, RPA, integration of external data, etc.Present like a pro with Finance Department Will Deploy AI Technologies AI For Brand Administration Graphics PDF Create beautiful presentations together with your team, using our easy-to-use presentation slides. Share your ideas in real-time and make changes on the fly by downloading our templates. So whether you are in the office, on the go, or in a remote location, you can stay in sync with your team and present your ideas with confidence. With Slidegeeks presentation got a whole lot easier. Grab these presentations today.

Stages Of Pie Chart Data Interpretation Business Plan Template PowerPoint Templates
We present our stages of pie chart data interpretation business plan template PowerPoint templates.Download and present our Circle Charts PowerPoint Templates because You can Stir your ideas in the cauldron of our PowerPoint Templates and Slides. Cast a magic spell on your audience. Download our Marketing PowerPoint Templates because Our PowerPoint Templates and Slides will let you Hit the target. Go the full distance with ease and elan. Use our Business PowerPoint Templates because Our PowerPoint Templates and Slides are truly out of this world. Even the MIB duo has been keeping tabs on our team. Download our Shapes PowerPoint Templates because Watching this your Audience will Grab their eyeballs, they wont even blink. Download our Process and Flows PowerPoint Templates because It will Give impetus to the hopes of your colleagues. Our PowerPoint Templates and Slides will aid you in winning their trust.Use these PowerPoint slides for presentations relating to achievement, analysis, background, bank, banking, business, calculation, chart, circle, commerce, commercial, commission, concept, credit, crisis, debt, deposit, design, detail, diagram, earnings, economics, economy, element, finance, goal, gold, golden, graph, graphic, growth, icon, idea, illustration, income, increase, invest, isolated, level, loss, market, marketing, metal, modern, money, new, object, part, percent, percentage, pie, plot, politics, profit, progress, ratio, reflection, reflective. The prominent colors used in the PowerPoint template are Blue, Gray, Black. Feed their curiosity with our Stages Of Pie Chart Data Interpretation Business Plan Template PowerPoint Templates. Arouse expectations with your thoughts.
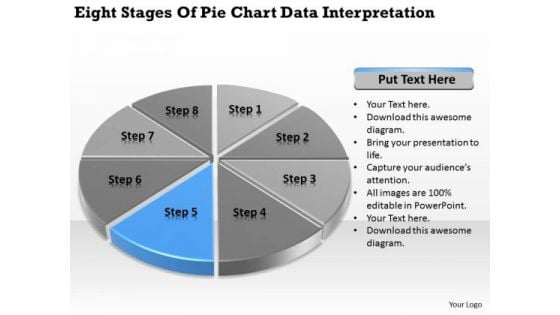
Stages Of Pie Chart Data Interpretation How To Write Business Plan PowerPoint Templates
We present our stages of pie chart data interpretation how to write business plan PowerPoint templates.Present our Circle Charts PowerPoint Templates because Our PowerPoint Templates and Slides will provide you a launch platform. Give a lift off to your ideas and send them into orbit. Present our Marketing PowerPoint Templates because Our PowerPoint Templates and Slides will let you Hit the right notes. Watch your audience start singing to your tune. Use our Business PowerPoint Templates because Our PowerPoint Templates and Slides come in all colours, shades and hues. They help highlight every nuance of your views. Download our Shapes PowerPoint Templates because It can Leverage your style with our PowerPoint Templates and Slides. Charm your audience with your ability. Use our Process and Flows PowerPoint Templates because You can Connect the dots. Fan expectations as the whole picture emerges.Use these PowerPoint slides for presentations relating to achievement, analysis, background, bank, banking, business, calculation, chart, circle, commerce, commercial, commission, concept, credit, crisis, debt, deposit, design, detail, diagram, earnings, economics, economy, element, finance, goal, gold, golden, graph, graphic, growth, icon, idea, illustration, income, increase, invest, isolated, level, loss, market, marketing, metal, modern, money, new, object, part, percent, percentage, pie, plot, politics, profit, progress, ratio, reflection, reflective. The prominent colors used in the PowerPoint template are Blue, Gray, Black. Our Stages Of Pie Chart Data Interpretation How To Write Business Plan PowerPoint Templates avoid exaggerations. They keep you away from any farce.
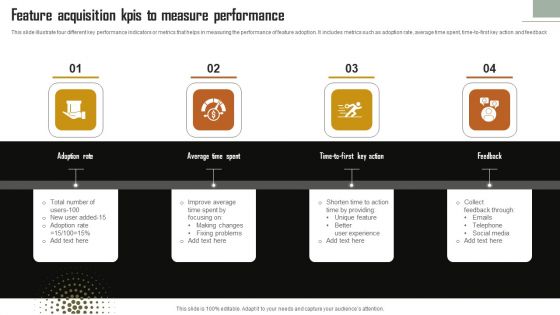
Feature Acquisition Kpis To Measure Performance Themes PDF
This slide illustrate four different key performance indicators or metrics that helps in measuring the performance of feature adoption. It includes metrics such as adoption rate, average time spent, time-to-first key action and feedback. Persuade your audience using this Feature Acquisition Kpis To Measure Performance Themes PDF. This PPT design covers four stages, thus making it a great tool to use. It also caters to a variety of topics including Adoption Rate, Average Time Spent, Feedback. Download this PPT design now to present a convincing pitch that not only emphasizes the topic but also showcases your presentation skills.
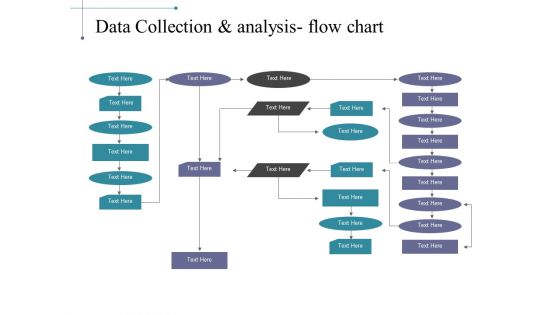
Data Collection And Analysis Flow Chart Ppt PowerPoint Presentation Ideas Images
This is a data collection and analysis flow chart ppt powerpoint presentation ideas images. This is a five stage process. The stages in this process are flow, marketing, strategy, process, arrows.
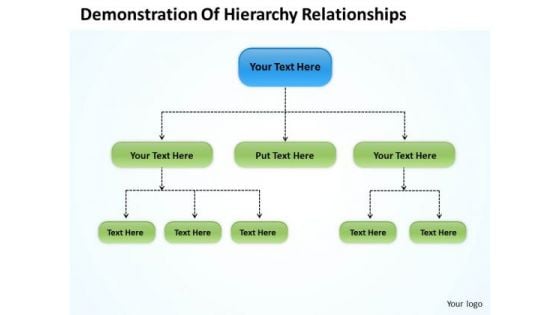
Organization Chart Template Demonstration Of Hierarchy Relationships PowerPoint Templates
We present our organization chart template demonstration of hierarchy relationships powerpoint templates.Download our Advertising PowerPoint Templates because Our PowerPoint Templates and Slides have the Brilliant backdrops. Guaranteed to illuminate the minds of your audience. Download and present our Leadership PowerPoint Templates because Our PowerPoint Templates and Slides are created by a hardworking bunch of busybees. Always flitting around with solutions gauranteed to please. Download and present our Arrows PowerPoint Templates because It can be used to Set your controls for the heart of the sun. Our PowerPoint Templates and Slides will be the propellant to get you there. Use our Org Charts PowerPoint Templates because Our PowerPoint Templates and Slides are endowed to endure. Ideas conveyed through them will pass the test of time. Download our Business PowerPoint Templates because Our PowerPoint Templates and Slides offer you the needful to organise your thoughts. Use them to list out your views in a logical sequence.Use these PowerPoint slides for presentations relating to Chart, flow, organization, flowchart, diagram, sitemap, process, box, arrow, graph, business, graphical, data, design, important, rectangle, corporate, plan, president, concept, hierarchy, glossy, teamwork, tier, chain, supervisor, relation, steps, glassy, connection, ladder, administration, group, connect, organize, connectivity, site-map, office, financial, structure, officer, glass. The prominent colors used in the PowerPoint template are Green, Blue, Black. Concentrate on the assignment with our Organization Chart Template Demonstration Of Hierarchy Relationships PowerPoint Templates. Don't give a fig about other issues.
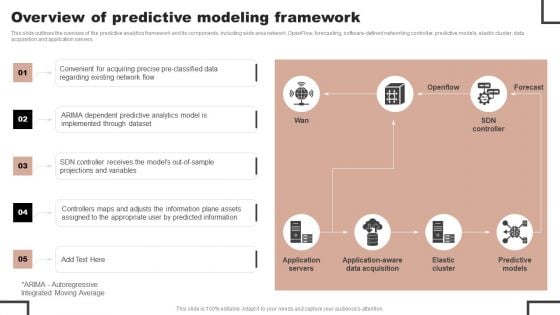
Forecast Analysis Technique IT Overview Of Predictive Modeling Framework Portrait PDF
This slide outlines the overview of the predictive analytics framework and its components, including wide area network, OpenFlow, forecasting, software-defined networking controller, predictive models, elastic cluster, data acquisition and application servers. Take your projects to the next level with our ultimate collection of Forecast Analysis Technique IT Overview Of Predictive Modeling Framework Portrait PDF. Slidegeeks has designed a range of layouts that are perfect for representing task or activity duration, keeping track of all your deadlines at a glance. Tailor these designs to your exact needs and give them a truly corporate look with your own brand colors they will make your projects stand out from the rest.
Magnifying Glass Big Data Ppt PowerPoint Presentation Icon Background
Presenting this set of slides with name magnifying glass big data ppt powerpoint presentation icon background. This is a one stage process. The stages in this process are magnifying glass, research, marketing, strategy, business. This is a completely editable PowerPoint presentation and is available for immediate download. Download now and impress your audience.

And Diverging 8 Step Circular Process Relative Cycle Arrow PowerPoint Templates
We present our and diverging 8 step circular process Relative Cycle Arrow PowerPoint templates.Download and present our Process and flows PowerPoint Templates because you require care and diligence to function well. Download and present our Flow charts PowerPoint Templates because it helps to prove the viability of your ideas to help your organisation to achieve the quality and success required. Present our Arrows PowerPoint Templates because you will be able to Highlight the various ways in which we can maintain its efficiency. Download and present our Circle charts PowerPoint Templates because you are aware of some pitfalls ahead where you need to be cautious not to overrun and avoid a stall. Download our Ring charts PowerPoint Templates because you can Show them the way, be Captain of the ship and lead them to new shores.Use these PowerPoint slides for presentations relating to Business, chart, circle, colors, concept, corporate, cycle, data, design, detail, development, diagram, engineering, graphic, ideas, illustration, image, implement, implementation, life, lifecycle, management, model, objects, organization, plan, process, product, professional, project, quality, schema, shape, stack, stage, steps, strategy, structure, success, symbol. The prominent colors used in the PowerPoint template are Gray, Black, White. You can be sure our and diverging 8 step circular process Relative Cycle Arrow PowerPoint templates are Pleasant. Presenters tell us our concept PowerPoint templates and PPT Slides provide you with a vast range of viable options. Select the appropriate ones and just fill in your text. We assure you our and diverging 8 step circular process Relative Cycle Arrow PowerPoint templates are Nice. Customers tell us our design PowerPoint templates and PPT Slides are Clever. Presenters tell us our and diverging 8 step circular process Relative Cycle Arrow PowerPoint templates are Versatile. You can be sure our data PowerPoint templates and PPT Slides are Whimsical. Feast your eyes on our And Diverging 8 Step Circular Process Relative Cycle Arrow PowerPoint Templates. Their colourful display will keep you enthralled.
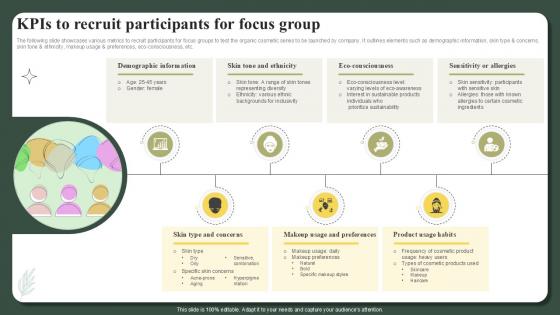
KPIS To Recruit Participants For Focus Group Successful Launch Ppt Slide
The following slide showcases various metrics to recruit participants for focus groups to test the organic cosmetic series to be launched by company. It outlines elements such as demographic information, skin type and concerns, skin tone and ethnicity, makeup usage and preferences, eco-consciousness, etc. Here you can discover an assortment of the finest PowerPoint and Google Slides templates. With these templates, you can create presentations for a variety of purposes while simultaneously providing your audience with an eye-catching visual experience. Download KPIS To Recruit Participants For Focus Group Successful Launch Ppt Slide to deliver an impeccable presentation. These templates will make your job of preparing presentations much quicker, yet still, maintain a high level of quality. Slidegeeks has experienced researchers who prepare these templates and write high-quality content for you. Later on, you can personalize the content by editing the KPIS To Recruit Participants For Focus Group Successful Launch Ppt Slide The following slide showcases various metrics to recruit participants for focus groups to test the organic cosmetic series to be launched by company. It outlines elements such as demographic information, skin type and concerns, skin tone and ethnicity, makeup usage and preferences, eco-consciousness, etc.
Magnifying Glass Comprehensive Guide To Acquire Customers For Startups Professional PDF
This Magnifying Glass Comprehensive Guide To Acquire Customers For Startups Professional PDF is perfect for any presentation, be it in front of clients or colleagues. It is a versatile and stylish solution for organizing your meetings. The Magnifying Glass Comprehensive Guide To Acquire Customers For Startups Professional PDF features a modern design for your presentation meetings. The adjustable and customizable slides provide unlimited possibilities for acing up your presentation. Slidegeeks has done all the homework before launching the product for you. So, do not wait, grab the presentation templates today.
Cloud Hosting Server Icon To Perform Information Processing And Storage Ppt Icon Portrait PDF
Presenting Cloud Hosting Server Icon To Perform Information Processing And Storage Ppt Icon Portrait PDF to dispense important information. This template comprises four stages. It also presents valuable insights into the topics including Cloud Hosting Server, Icon To Perform, Information Processing Storage. This is a completely customizable PowerPoint theme that can be put to use immediately. So, download it and address the topic impactfully.
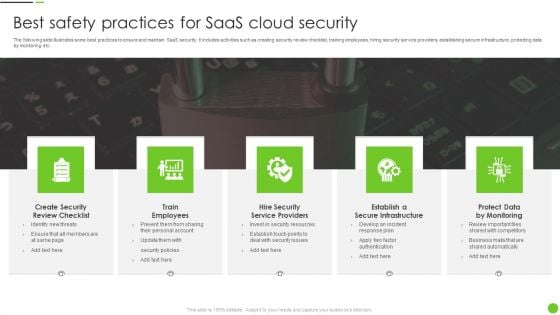
Best Safety Practices For Saas Cloud Security Ppt PowerPoint Presentation Gallery Sample PDF
The following slide illustrates some best practices to ensure and maintain SaaS security. It includes activities such as creating security review checklist, training employees, hiring security service providers, establishing secure infrastructure, protecting data by monitoring etc. Presenting Best Safety Practices For Saas Cloud Security Ppt PowerPoint Presentation Gallery Sample PDF to dispense important information. This template comprises five stages. It also presents valuable insights into the topics including Create Security Review Checklist, Train Employees, Establish Secure Infrastructure. This is a completely customizable PowerPoint theme that can be put to use immediately. So, download it and address the topic impactfully.
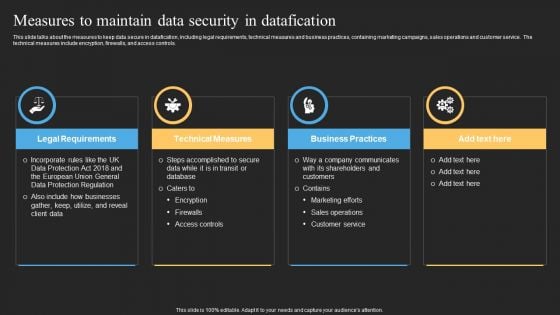
Datafy Measures To Maintain Data Security In Datafication Diagrams PDF
This slide talks about the measures to keep data secure in datafication, including legal requirements, technical measures and business practices, containing marketing campaigns, sales operations and customer service. The technical measures include encryption, firewalls, and access controls. Welcome to our selection of the Datafy Measures To Maintain Data Security In Datafication Diagrams PDF. These are designed to help you showcase your creativity and bring your sphere to life. Planning and Innovation are essential for any business that is just starting out. This collection contains the designs that you need for your everyday presentations. All of our PowerPoints are 100 percent editable, so you can customize them to suit your needs. This multi-purpose template can be used in various situations. Grab these presentation templates today.

Comparing Current Digital Standards With Industry Overview Of Customer Adoption Process Inspiration Pdf
This slide provides glimpse about comparative assessment of customer adoption KPIs with industry standards that help our business in increasing our customer base. It includes parameters such as conversion rate, adoption rate, etc. Want to ace your presentation in front of a live audience Our Comparing Current Digital Standards With Industry Overview Of Customer Adoption Process Inspiration Pdf can help you do that by engaging all the users towards you. Slidegeeks experts have put their efforts and expertise into creating these impeccable powerpoint presentations so that you can communicate your ideas clearly. Moreover, all the templates are customizable, and easy to edit and downloadable. Use these for both personal and commercial use. This slide provides glimpse about comparative assessment of customer adoption KPIs with industry standards that help our business in increasing our customer base. It includes parameters such as conversion rate, adoption rate, etc.

Influence Of Inflation On Interest Rates Comprehensive Guide On Inflation Control CM SS V
This slide shows detailed information regarding the impact of interest and monetary policy on inflation in an economy. It includes various points such as high inflation high rates, return maintenance, etc. The Influence Of Inflation On Interest Rates Comprehensive Guide On Inflation Control CM SS V is a compilation of the most recent design trends as a series of slides. It is suitable for any subject or industry presentation, containing attractive visuals and photo spots for businesses to clearly express their messages. This template contains a variety of slides for the user to input data, such as structures to contrast two elements, bullet points, and slides for written information. Slidegeeks is prepared to create an impression. This slide shows detailed information regarding the impact of interest and monetary policy on inflation in an economy. It includes various points such as high inflation high rates, return maintenance, etc.
Maginifier Glass Ppt PowerPoint Presentation Design Templates
This is a maginifier glass ppt powerpoint presentation design templates. This is a five stage process. The stages in this process are icon, marketing, business, magnify, search.
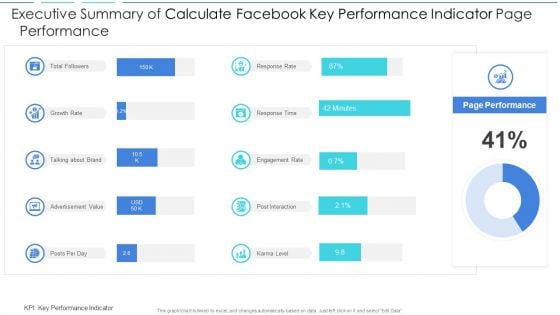
Executive Summary Of Calculate Facebook Key Performance Indicator Page Performance Download PDF
Showcasing this set of slides titled executive summary of calculate facebook key performance indicator page performance download pdf. The topics addressed in these templates are executive summary of calculate facebook key performance indicator page performance. All the content presented in this PPT design is completely editable. Download it and make adjustments in color, background, font etc. as per your unique business setting.
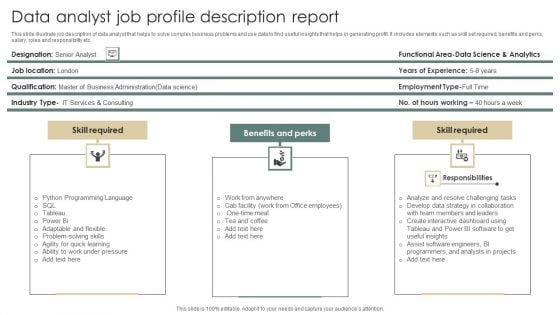
Data Analyst Job Profile Description Report Infographics PDF
This slide illustrate job description of data analyst that helps to solve complex business problems and use data to find useful insights that helps in generating profit. It includes elements such as skill set required, benefits and perks, salary, roles and responsibility etc. Presenting Data Analyst Job Profile Description Report Infographics PDF to dispense important information. This template comprises three stages. It also presents valuable insights into the topics including Skill Required, Benefits Perks, Skill Required. This is a completely customizable PowerPoint theme that can be put to use immediately. So, download it and address the topic impactfully.
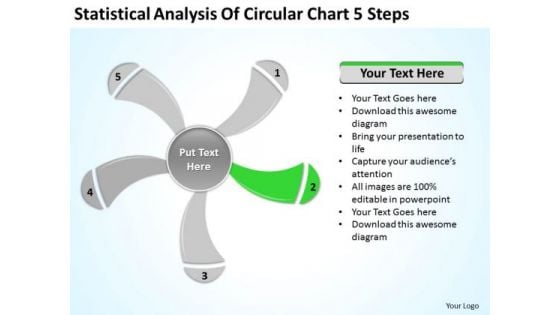
Statistical Analysis Of Circular Chart 5 Steps Ppt Business Plan PowerPoint Slide
We present our statistical analysis of circular chart 5 steps ppt business plan PowerPoint Slide.Download and present our Business PowerPoint Templates because Our PowerPoint Templates and Slides will definately Enhance the stature of your presentation. Adorn the beauty of your thoughts with their colourful backgrounds. Use our Signs PowerPoint Templates because Our PowerPoint Templates and Slides will give good value for money. They also have respect for the value of your time. Download our Shapes PowerPoint Templates because Our PowerPoint Templates and Slides team portray an attitude of elegance. Personify this quality by using them regularly. Use our Metaphors-Visual Concepts PowerPoint Templates because Our PowerPoint Templates and Slides will effectively help you save your valuable time. They are readymade to fit into any presentation structure. Use our Process and Flows PowerPoint Templates because our PowerPoint Templates and Slides are the string of your bow. Fire of your ideas and conquer the podium.Use these PowerPoint slides for presentations relating to graphically, graphic, vector, layout, business, computation, sign, infochart, visual, symbol, template, diagram, calculations, sector, data, revenue, schedule, element, analysis, drawing, report, technology, contour, classification, graph, modern, illustration, icon, comparison, object, chart, collection, science, color, growth, composition, professional, set, education, math, profits, information, symmetry, statistic, structure, infographics, button. The prominent colors used in the PowerPoint template are Green, Gray, White. Get a blue-chip client list with your ideas. Attract the best customers with our Statistical Analysis Of Circular Chart 5 Steps Ppt Business Plan PowerPoint Slide.
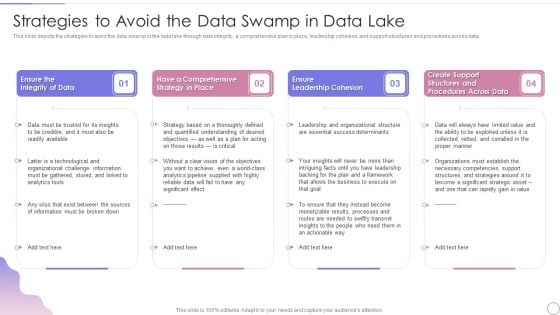
Data Lake Architecture Future Of Data Analysis Strategies To Avoid The Data Swamp In Data Lake Themes PDF
This slide depicts the strategies to avoid the data swamp in the data lake through data integrity, a comprehensive plan in place, leadership cohesion, and support structures and procedures across data.Deliver and pitch your topic in the best possible manner with this Data Lake Architecture Future Of Data Analysis Strategies To Avoid The Data Swamp In Data Lake Themes PDF. Use them to share invaluable insights on Leadership Cohesion, Procedures Across, Success Determinants and impress your audience. This template can be altered and modified as per your expectations. So, grab it now.
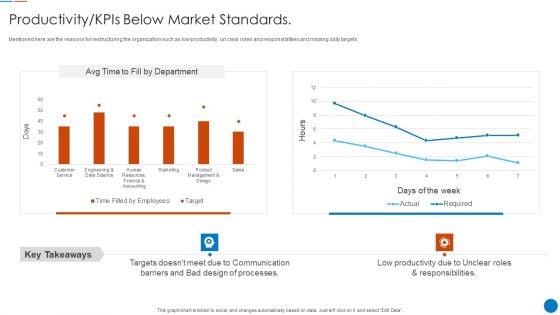
Organizational Restructuring Process Productivity Kpis Below Market Standards Information PDF
Mentioned here are the reasons for restructuring the organization such as low productivity, un clear roles and responsibilities and missing daily targets Deliver an awe inspiring pitch with this creative Organizational Restructuring Process Productivity Kpis Below Market Standards Information PDF bundle. Topics like Low Productivity, Roles And Responsibilities, Barriers And Bad Design can be discussed with this completely editable template. It is available for immediate download depending on the needs and requirements of the user.

Vendor Performance Analysis And Administration Key Steps Of Supplier Evaluation Process Structure PDF
The following slide showcases various steps for evaluating vendor performance to streamline business operations and optimize costs. It includes steps such as identify performance indicators, develop an evaluation ranking, identify appropriate methods, determine deficiencies, optimize weak links and conduct routine evaluation. There are so many reasons you need a Vendor Performance Analysis And Administration Key Steps Of Supplier Evaluation Process Structure PDF. The first reason is you cannot spend time making everything from scratch, Thus, Slidegeeks has made presentation templates for you too. You can easily download these templates from our website easily.

Roadmap Of Social Media Analytics Marketing Plan Cracking The Code Of Social Media
This slide represents the roadmap to implement Social Media Analytics. The key steps include your objective and goal, selecting the right tools, data analytics and interpretation, data driven decision making, etc. Boost your pitch with our creative Roadmap Of Social Media Analytics Marketing Plan Cracking The Code Of Social Media. Deliver an awe-inspiring pitch that will mesmerize everyone. Using these presentation templates you will surely catch everyones attention. You can browse the ppts collection on our website. We have researchers who are experts at creating the right content for the templates. So you do not have to invest time in any additional work. Just grab the template now and use them. This slide represents the roadmap to implement Social Media Analytics. The key steps include your objective and goal, selecting the right tools, data analytics and interpretation, data driven decision making, etc.
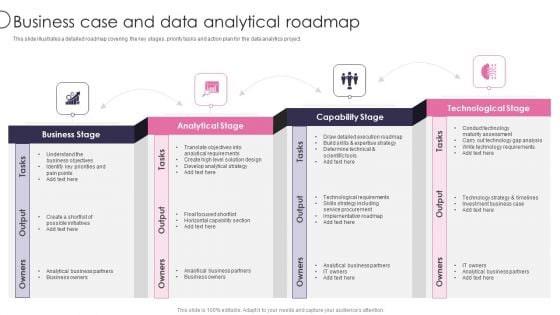
Information Transformation Process Toolkit Business Case And Data Analytical Roadmap Microsoft PDF
This slide illustrates a detailed roadmap covering the key stages, priority tasks and action plan for the data analytics project. Presenting Information Transformation Process Toolkit Business Case And Data Analytical Roadmap Microsoft PDF to provide visual cues and insights. Share and navigate important information on four stages that need your due attention. This template can be used to pitch topics like Capability Stage, Analytical Stage, Business Stage, Technological Stage. In addtion, this PPT design contains high resolution images, graphics, etc, that are easily editable and available for immediate download.
Product Launch Process Optimization Vector Icon Ppt PowerPoint Presentation Model Icons PDF
Persuade your audience using this product launch process optimization vector icon ppt powerpoint presentation model icons pdf. This PPT design covers one stages, thus making it a great tool to use. It also caters to a variety of topics including product launch process optimization vector icon. Download this PPT design now to present a convincing pitch that not only emphasizes the topic but also showcases your presentation skills.
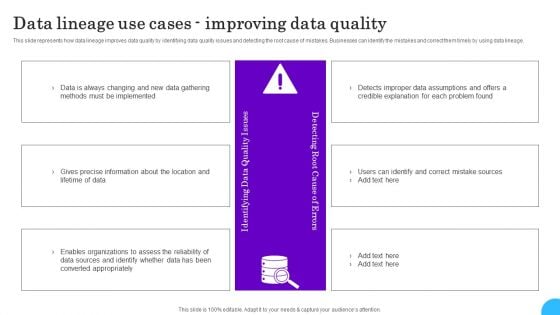
Comprehensive Analysis Of Different Data Lineage Classification Data Lineage Use Cases Improving Data Mockup PDF
This slide represents how data lineage improves data quality by identifying data quality issues and detecting the root cause of mistakes. Businesses can identify the mistakes and correct them timely by using data lineage. This Comprehensive Analysis Of Different Data Lineage Classification Data Lineage Use Cases Improving Data Mockup PDF is perfect for any presentation, be it in front of clients or colleagues. It is a versatile and stylish solution for organizing your meetings. The Comprehensive Analysis Of Different Data Lineage Classification Data Lineage Use Cases Improving Data Mockup PDF features a modern design for your presentation meetings. The adjustable and customizable slides provide unlimited possibilities for acing up your presentation. Slidegeeks has done all the homework before launching the product for you. So, do not wait, grab the presentation templates today
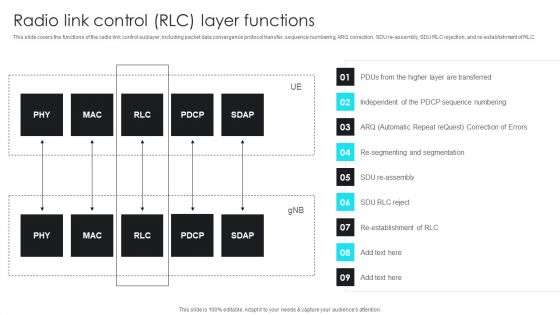
5G Network Operations Radio Link Control RLC Layer Functions Graphics PDF
This slide covers the functions of the radio link control sublayer, including packet data convergence protocol transfer, sequence numbering, ARQ correction, SDU re-assembly, SDU RLC rejection, and re-establishment of RLC. Retrieve professionally designed 5G Network Operations Radio Link Control RLC Layer Functions Graphics PDF to effectively convey your message and captivate your listeners. Save time by selecting pre-made slideshows that are appropriate for various topics, from business to educational purposes. These themes come in many different styles, from creative to corporate, and all of them are easily adjustable and can be edited quickly. Access them as PowerPoint templates or as Google Slides themes. You dont have to go on a hunt for the perfect presentation because Slidegeeks got you covered from everywhere.
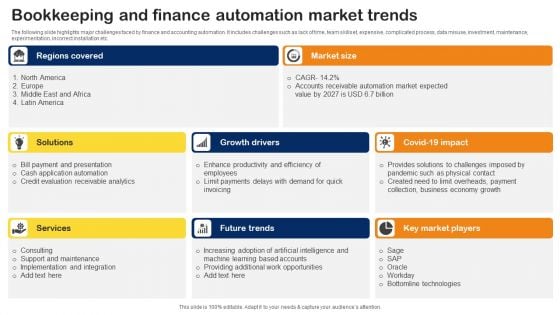
Bookkeeping And Finance Automation Market Trends Pictures PDF
The following slide highlights major challenges faced by finance and accounting automation. It includes challenges such as lack of time, team skillset, expensive, complicated process, data misuse, investment, maintenance, experimentation, incorrect installation etc. Pitch your topic with ease and precision using this Bookkeeping And Finance Automation Market Trends Pictures PDF. This layout presents information on Growth Drivers, Key Market Players, Services. It is also available for immediate download and adjustment. So, changes can be made in the color, design, graphics or any other component to create a unique layout.
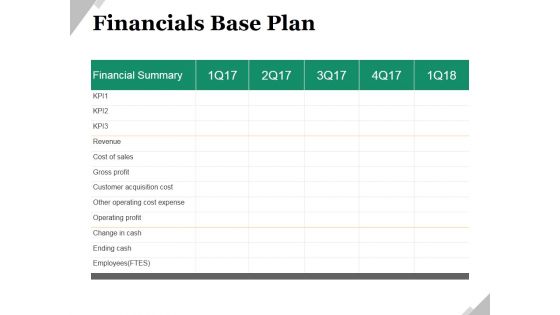
Financials Base Plan Ppt PowerPoint Presentation Model Shapes
This is a financials base plan ppt powerpoint presentation model shapes. This is a five stage process. The stages in this process are financial summary, business, marketing, revenue, cost of sales, gross profit.

Benefits Of Automated Data Handling For Organization Demonstration PDF
Persuade your audience using this Benefits Of Automated Data Handling For Organization Demonstration PDF. This PPT design covers three stages, thus making it a great tool to use. It also caters to a variety of topics including Business Operation Efficiency, Reduce Manpower, Eliminate Data Entry. Download this PPT design now to present a convincing pitch that not only emphasizes the topic but also showcases your presentation skills.

Pmi Best Practices Ppt Powerpoint Presentation Examples
This is a pmi best practices ppt powerpoint presentation examples. This is a three stage process. The stages in this process are plan, scope, schedule, cost, execute, work, record, control, measure, analyze, report.
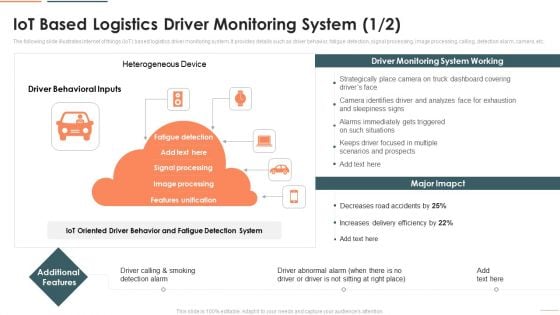
Deploying Iot In Logistics And Supply Chain Iot Based Logistics Driver Monitoring System Designs PDF
The following slide illustrates internet of things IoT based logistics driver monitoring system. It provides details such as driver behavior, fatigue detection, signal processing, image processing, calling, detection alarm, camera, etc. Presenting Deploying Iot In Logistics And Supply Chain Iot Based Logistics Driver Monitoring System Designs PDF to provide visual cues and insights. Share and navigate important information on one stages that need your due attention. This template can be used to pitch topics like Driver Behavioral Inputs, Heterogeneous Device, Additional Features. In addtion, this PPT design contains high resolution images, graphics, etc, that are easily editable and available for immediate download.
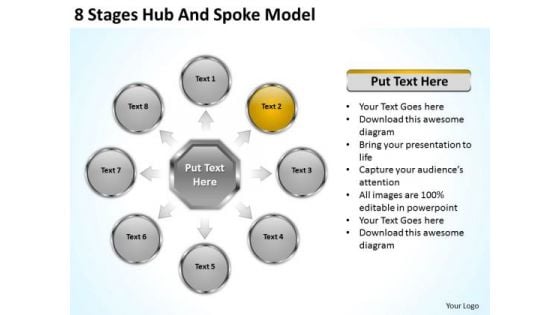
8 Stages Hub And Spoke Model Executive Summary Business Plan PowerPoint Templates
We present our 8 stages hub and spoke model executive summary business plan PowerPoint templates.Download our Circle Charts PowerPoint Templates because You can Connect the dots. Fan expectations as the whole picture emerges. Use our Business PowerPoint Templates because It will get your audience in sync. Use our Arrows PowerPoint Templates because It can be used to Set your controls for the heart of the sun. Our PowerPoint Templates and Slides will be the propellant to get you there. Download our Process and Flows PowerPoint Templates because Our PowerPoint Templates and Slides help you pinpoint your timelines. Highlight the reasons for your deadlines with their use. Present our Shapes PowerPoint Templates because You are an avid believer in ethical practices. Highlight the benefits that accrue with our PowerPoint Templates and Slides.Use these PowerPoint slides for presentations relating to Diagram, flowchart, flow, arrow, process, connection, chart, connect, connectivity, corporate, business, plan, president, concept, teamwork, graphical, data, important, supervisor, relation, graph, box, steps, glassy, administration, design, group, color, highlight, organization,organize, global, manager, office, financial, ceo, structure, officer. The prominent colors used in the PowerPoint template are Yellow, Gray, Black. Taste success with our 8 Stages Hub And Spoke Model Executive Summary Business Plan PowerPoint Templates. You will come out on top.

Business Flowchart Examples Diagram 10 Stages PowerPoint Templates Ppt Backgrounds For Slides
We present our business flowchart examples diagram 10 stages PowerPoint templates PPT backgrounds for slides.Download our Arrows PowerPoint Templates because You canTake a leap off the starting blocks with our PowerPoint Templates and Slides. They will put you ahead of the competition in quick time. Present our Boxes PowerPoint Templates because You should Kick up a storm with our PowerPoint Templates and Slides. The heads of your listeners will swirl with your ideas. Download our Business PowerPoint Templates because Our PowerPoint Templates and Slides will let you Clearly mark the path for others to follow. Download and present our Shapes PowerPoint Templates because Our PowerPoint Templates and Slides will give you great value for your money. Be assured of finding the best projection to highlight your words. Download our Process and Flows PowerPoint Templates because Our PowerPoint Templates and Slides ensures Effective communication. They help you put across your views with precision and clarity.Use these PowerPoint slides for presentations relating to Abstract, Achievement, Administration, Analyze, Aqua, Blue, Box, Business, Chart, Company, Connected, Connection, Data, Database, Development, Diagram, Document, Economic, Finance, Flowchart, Glossy, Green, Hierarchy, Illustration, Levels, Management, Map, Marketing, Orange, Plan, Positions, Presentation, Progress, Rectangle, Red, Result, Site, Statistics, Structure, Technical, Trade, Vector, Yellow. The prominent colors used in the PowerPoint template are Blue, White, Gray. Dazzle the audience with your thoughts. Our Business Flowchart Examples Diagram 10 Stages PowerPoint Templates Ppt Backgrounds For Slides will leave them wide-eyed.

Project Administration Kpis Ppt PowerPoint Presentation Complete With Slides
Induce strategic thinking by presenting this complete deck. Enthrall your audience by deploying this thought provoking PPT deck. It can be downloaded in both standard and widescreen aspect ratios, thus making it a complete package to use and deploy. Convey your thoughts and actions using the ninteen slides presented in this complete deck. Additionally, feel free to alter its components like color, graphics, design, etc, to create a great first impression. Grab it now by clicking on the download button below.


 Continue with Email

 Home
Home


