Program Management Plan
Column Chart Ppt PowerPoint Presentation Infographic Template Icon
This is a column chart ppt powerpoint presentation infographic template icon. This is a two stage process. The stages in this process are business, marketing, sales in percentage, financial year, graph.
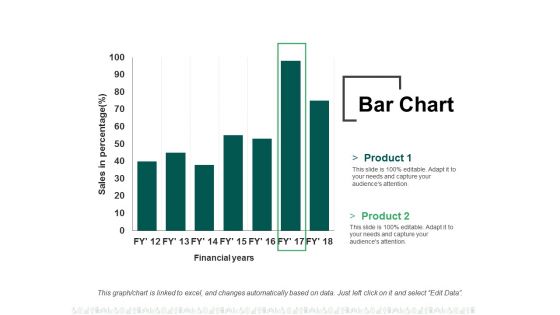
Bar Chart Ppt PowerPoint Presentation Summary File Formats
This is a bar chart ppt powerpoint presentation summary file formats. This is a two stage process. The stages in this process are business, finance, financial years, sales in percentage, graph.

Column Chart Ppt PowerPoint Presentation Layouts Graphic Images
This is a column chart ppt powerpoint presentation layouts graphic images. This is a two stage process. The stages in this process are business, finance, years, graph, expenditure in, marketing.
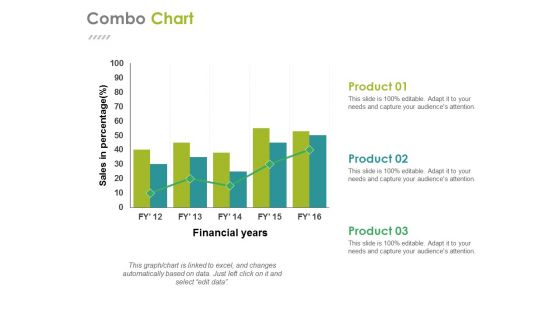
Combo Chart Ppt PowerPoint Presentation Gallery Design Ideas
This is a combo chart ppt powerpoint presentation gallery design ideas. This is a three stage process. The stages in this process are business, financial years, sales in percentage, finance, graph.
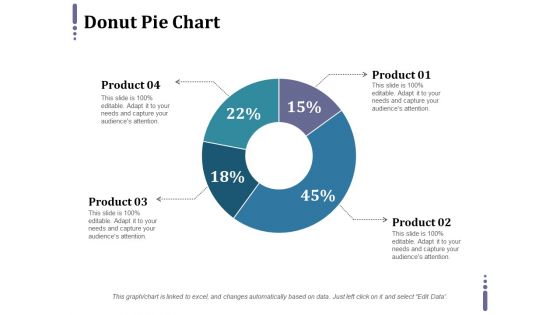
Donut Pie Chart Ppt PowerPoint Presentation Pictures Layout Ideas
This is a donut pie chart ppt powerpoint presentation pictures layout ideas. This is a four stage process. The stages in this process are percentage, finance, donut, business, product.
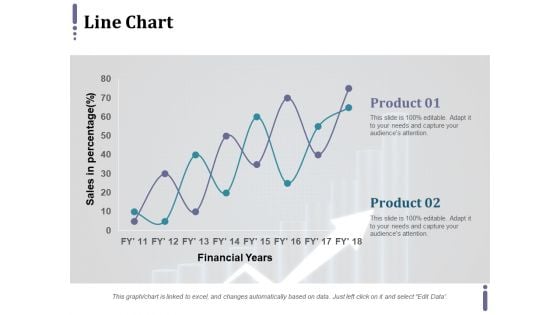
Line Chart Ppt PowerPoint Presentation Infographic Template Master Slide
This is a line chart ppt powerpoint presentation infographic template master slide. This is a two stage process. The stages in this process are product, financial years, sales in percentage.
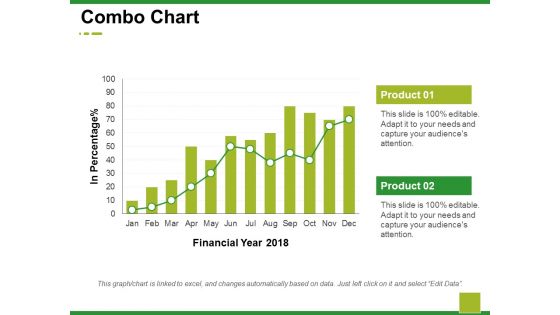
Combo Chart Ppt PowerPoint Presentation Summary Background Images
This is a combo chart ppt powerpoint presentation summary background images. This is a two stage process. The stages in this process are business, marketing, financial year, in percentage, graph.
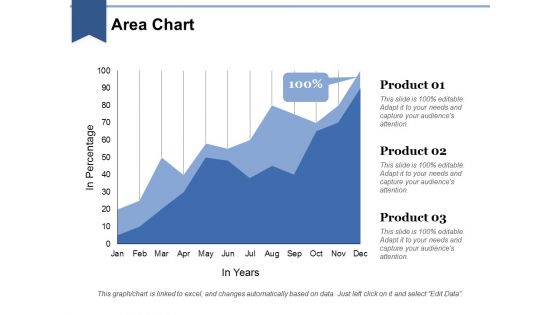
Area Chart Ppt PowerPoint Presentation Layouts Graphic Images
This is a area chart ppt powerpoint presentation layouts graphic images. This is a three stage process. The stages in this process are business, in years, marketing, in percentage, finance, graph.

Regression Line Chart Ppt PowerPoint Presentation Visual Aids Summary
This is a regression line chart ppt powerpoint presentation visual aids summary. This is a two stage process. The stages in this process are linear periodization, linear growth, linear progression.
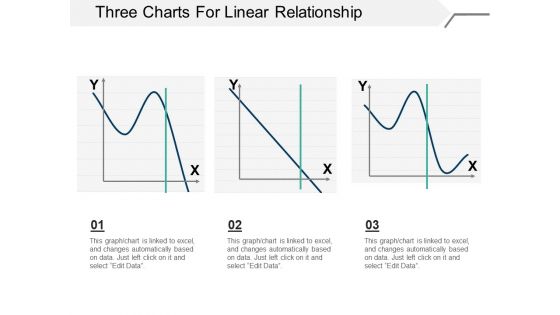
Three Charts For Linear Relationship Ppt PowerPoint Presentation Model Example
This is a three charts for linear relationship ppt powerpoint presentation model example. This is a three stage process. The stages in this process are linear periodization, linear growth, linear progression.
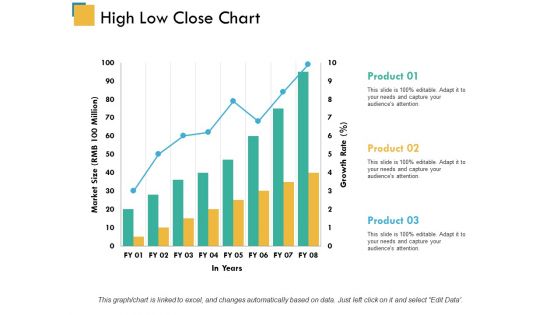
High Low Close Chart Ppt PowerPoint Presentation Model Inspiration
This is a high low close chart ppt powerpoint presentation model inspiration. This is a three stage process. The stages in this process are product, market size, in years.
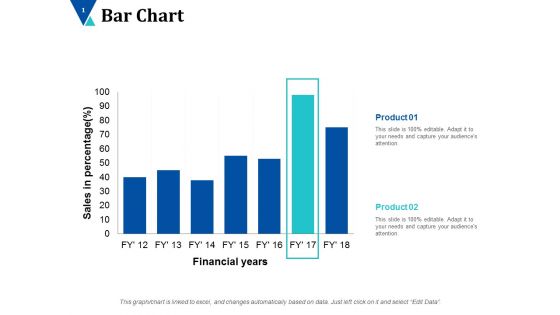
Bar Chart Finance Ppt PowerPoint Presentation Infographics Background Images
This is a bar chart finance ppt powerpoint presentation infographics background images. This is a seven stages process. The stages in this process are alpha testing, beta testing, full scale show.
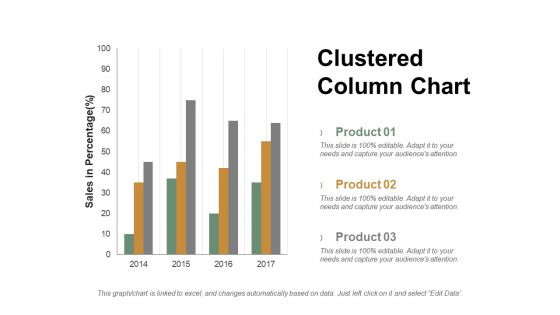
Clustered Column Chart Ppt PowerPoint Presentation Professional Ideas
This is a clustered column chart ppt powerpoint presentation professional ideas. This is a three stage process. The stages in this process are product, sales in percentage, column, years.
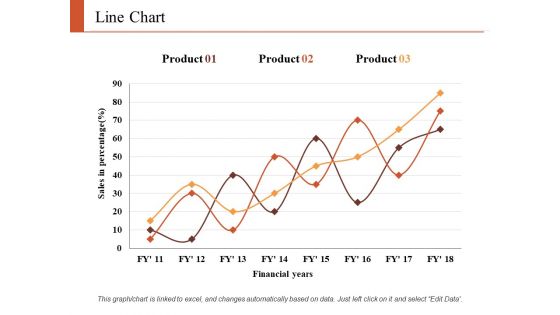
Line Chart Finance Ppt PowerPoint Presentation Infographic Template Graphics Tutorials
This is a line chart finance ppt powerpoint presentation infographic template graphics tutorials. This is a three stage process. The stages in this process are finance, marketing, analysis, business, investment.
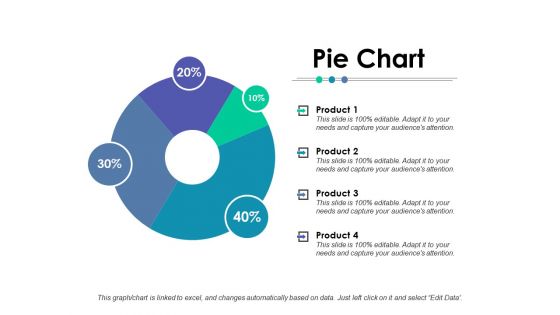
Pie Chart Finance Ppt PowerPoint Presentation Styles File Formats
This is a pie chart finance ppt powerpoint presentation styles file formats. This is a four stage process. The stages in this process are finance, analysis, business, investment, marketing.
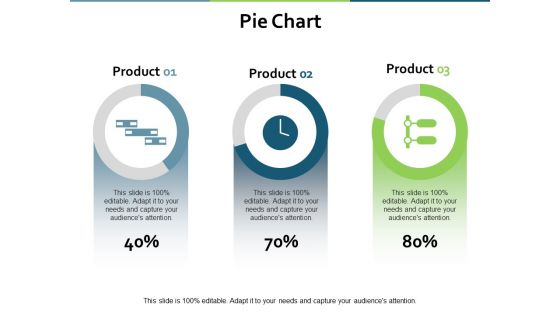
Pie Chart Marketing Finance Ppt PowerPoint Presentation Gallery Good
This is a pie chart marketing finance ppt powerpoint presentation gallery good. This is a three stage process. The stages in this process are finance, analysis, business, investment, marketing.
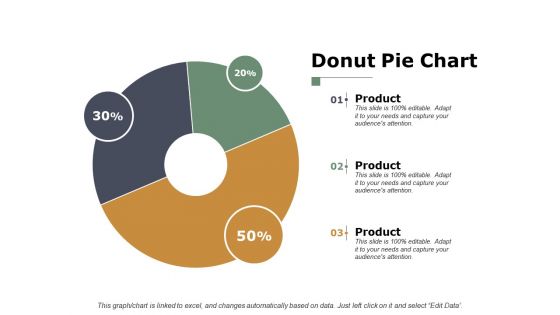
Donut Pie Chart Finance Ppt PowerPoint Presentation Inspiration Graphics
This is a donut pie chart finance ppt powerpoint presentation inspiration graphics. This is a three stage process. The stages in this process are finance, analysis, business, investment, marketing.
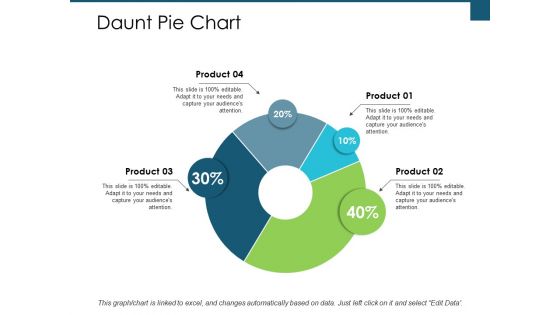
Daunt Pie Chart Investment Ppt PowerPoint Presentation Infographic Template Aids
This is a daunt pie chart investment ppt powerpoint presentation infographic template aids. This is a four stage process. The stages in this process are finance, analysis, business, investment, marketing.
Clustered Bar Chart Marketing Ppt PowerPoint Presentation Layouts Icon
This is a clustered bar chart marketing ppt powerpoint presentation layouts icon. This is a four stage process. The stages in this process are finance, marketing, analysis, business, investment.
Donut Pie Chart Marketing Ppt PowerPoint Presentation Infographic Template Icon
This is a donut pie chart marketing ppt powerpoint presentation infographic template icon. This is a five stage process. The stages in this process are finance, marketing, analysis, business, investment.
Bar Chart Finance Marketing Ppt PowerPoint Presentation Icon Display
This is a bar chart finance marketing ppt powerpoint presentation icon display. This is a three stage process. The stages in this process are finance, analysis, business, investment, marketing.
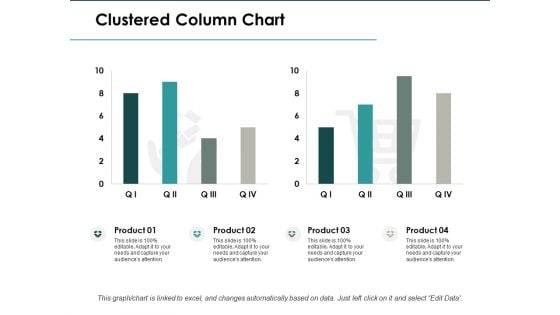
Clustered Column Chart Investment Ppt PowerPoint Presentation Infographic Template Clipart
This is a clustered column chart investment ppt powerpoint presentation infographic template clipart. This is a four stage process. The stages in this process are finance, analysis, business, investment, marketing.
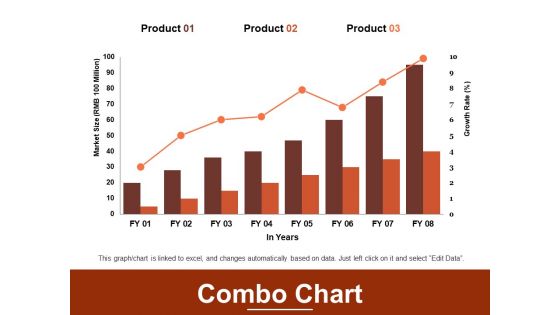
Combo Chart Finance Marketing Ppt PowerPoint Presentation File Guidelines
This is a combo chart finance marketing ppt powerpoint presentation file guidelines. This is a three stage process. The stages in this process are finance, analysis, business, investment, marketing.
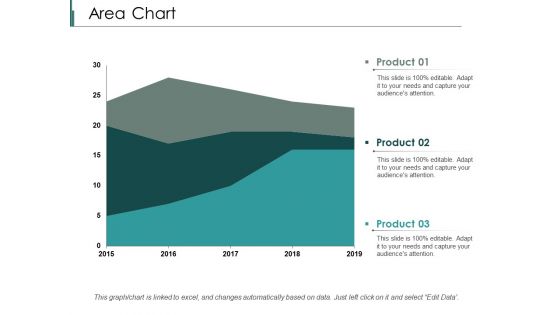
Area Chart Finance Ppt PowerPoint Presentation Styles Designs Download
This is a area chart finance ppt powerpoint presentation styles designs download. This is a three stage process. The stages in this process are finance, analysis, business, investment, marketing.
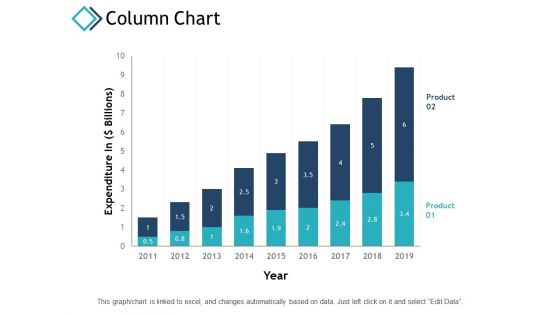
Column Chart Finance Investment Ppt PowerPoint Presentation Inspiration Template
This is a column chart finance investment ppt powerpoint presentation inspiration template. This is a two stage process. The stages in this process are finance, analysis, business, investment, marketing.
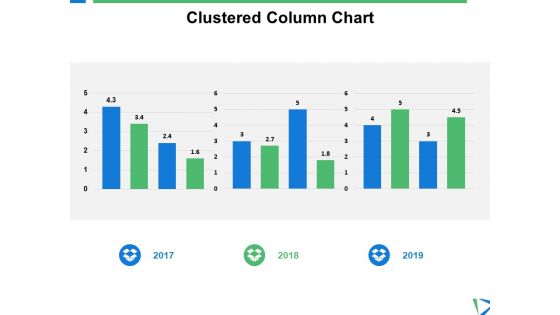
Clustered Column Chart Finance Ppt PowerPoint Presentation Gallery Styles
This is a clustered column chart finance ppt powerpoint presentation gallery styles. This is a three stage process. The stages in this process are finance, analysis, business, investment, marketing.
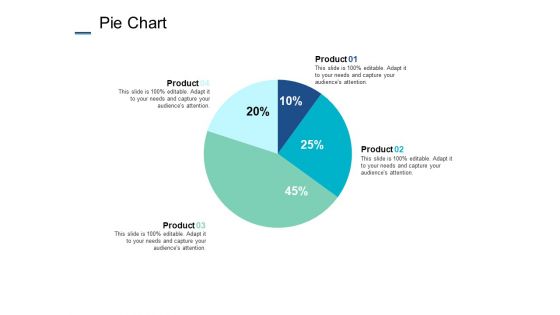
Pie Chart Finance Marketing Ppt PowerPoint Presentation Styles Outfit
This is a pie chart finance marketing ppt powerpoint presentation styles outfit. This is a four stage process. The stages in this process are finance, analysis, business, investment, marketing.
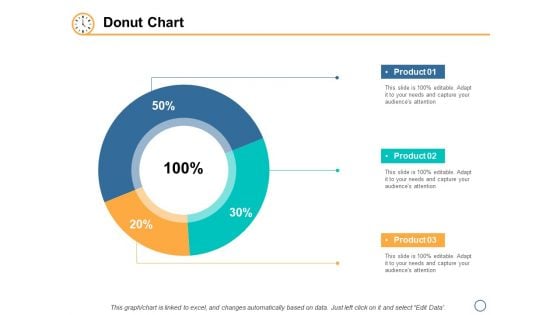
Pie Chart Marketing Finance Ppt PowerPoint Presentation File Guidelines
This is a pie chart marketing finance ppt powerpoint presentation file guidelines. This is a three stage process. The stages in this process are finance, analysis, business, investment, marketing.
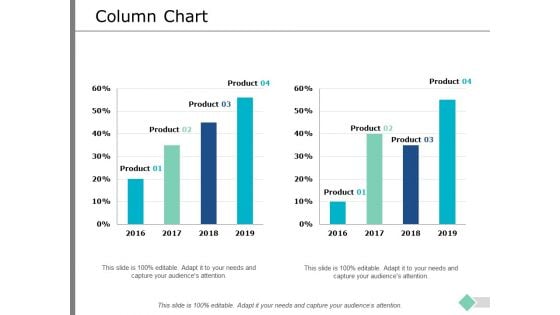
Column Chart Marketing Finance Ppt PowerPoint Presentation Infographic Template Rules
This is a column chart marketing finance ppt powerpoint presentation infographic template rules. This is a two stage process. The stages in this process are finance, analysis, business, investment, marketing.
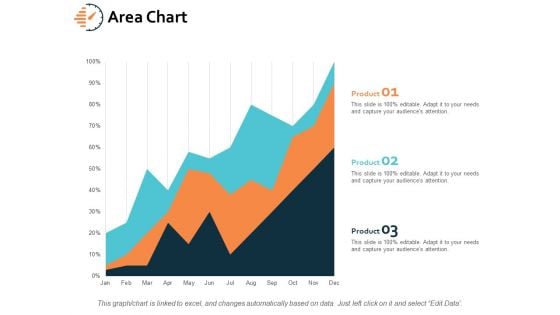
Area Chart Finance Marketing Ppt PowerPoint Presentation Gallery Graphics Design
This is a area chart finance marketing ppt powerpoint presentation gallery graphics design. This is a three stage process. The stages in this process are finance, analysis, business, investment, marketing.
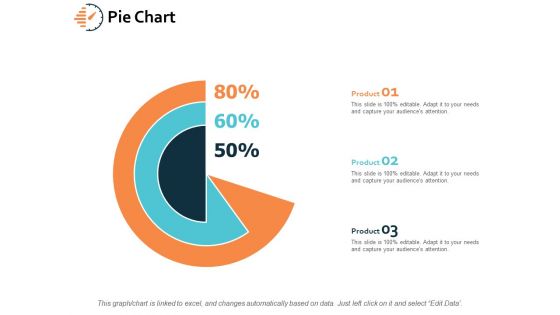
Pie Chart Investment Finance Ppt PowerPoint Presentation File Influencers
This is a pie chart investment finance ppt powerpoint presentation file influencers. This is a three stage process. The stages in this process are finance, analysis, business, investment, marketing.
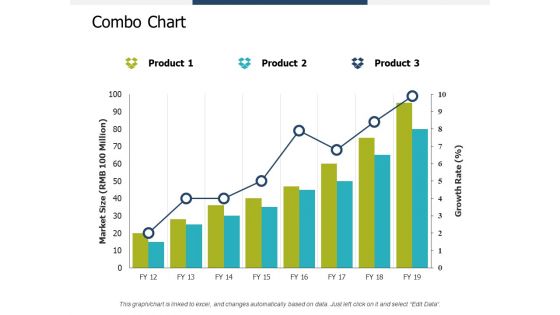
Combo Chart Investment Ppt PowerPoint Presentation Summary Infographic Template
This is a combo chart investment ppt powerpoint presentation summary infographic template. This is a three stage process. The stages in this process are finance, analysis, business, investment, marketing.
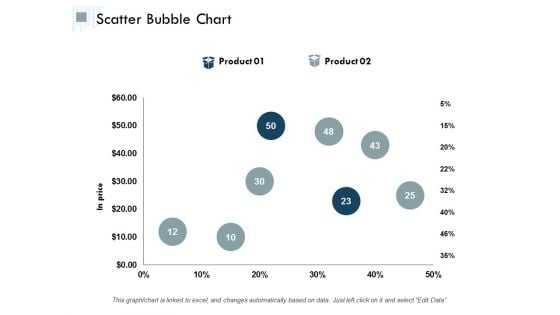
Scatter Bubble Chart Ppt PowerPoint Presentation Infographic Template Graphics Design
This is a scatter bubble chart ppt powerpoint presentation infographic template graphics design. This is a two stage process. The stages in this process are finance, analysis, business, investment, marketing.
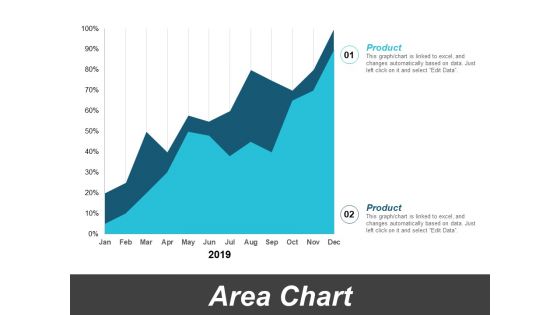
Area Chart Marketing Finance Ppt PowerPoint Presentation Ideas Elements
This is a area chart marketing finance ppt powerpoint presentation ideas elements. This is a two stage process. The stages in this process are finance, analysis, business, investment, marketing.
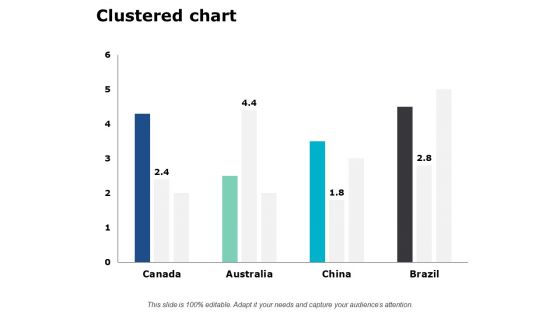
Clustered Chart Finance Marketing Ppt PowerPoint Presentation Layouts Outfit
This is a clustered chart finance marketing ppt powerpoint presentation layouts outfit. This is a four stage process. The stages in this process are finance, analysis, business, investment, marketing.
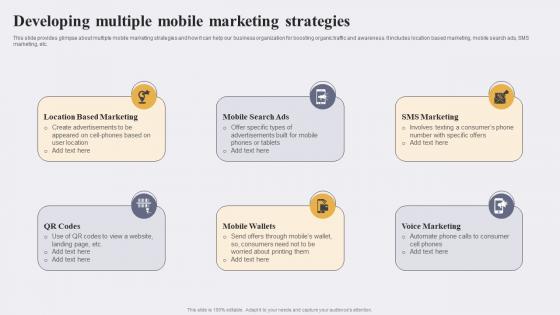
Developing Multiple Mobile Marketing Enhancing Conversion Rate By Leveraging Elements Pdf
This slide provides glimpse about multiple mobile marketing strategies and how it can help our business organization for boosting organic traffic and awareness. It includes location based marketing, mobile search ads, SMS marketing, etc.Present like a pro with Developing Multiple Mobile Marketing Enhancing Conversion Rate By Leveraging Elements Pdf Create beautiful presentations together with your team, using our easy-to-use presentation slides. Share your ideas in real-time and make changes on the fly by downloading our templates. So whether you are in the office, on the go, or in a remote location, you can stay in sync with your team and present your ideas with confidence. With Slidegeeks presentation got a whole lot easier. Grab these presentations today. This slide provides glimpse about multiple mobile marketing strategies and how it can help our business organization for boosting organic traffic and awareness. It includes location based marketing, mobile search ads, SMS marketing, etc.
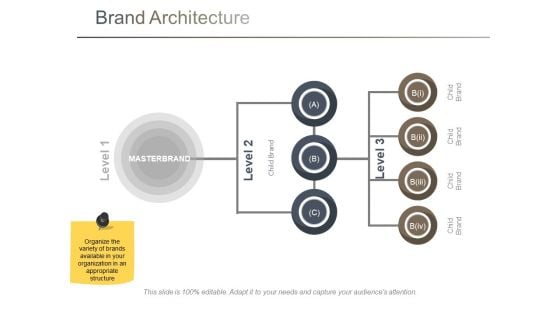
Brand Architecture Ppt PowerPoint Presentation Show Pictures
This is a brand architecture ppt powerpoint presentation show pictures. This is a three stage process. The stages in this process are child brand, chart, business, marketing, strategy.
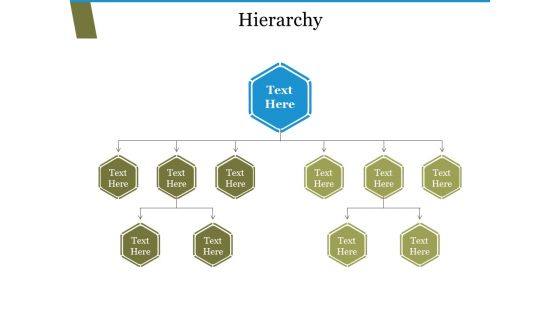
Hierarchy Ppt PowerPoint Presentation Model Rules
This is a hierarchy ppt powerpoint presentation model rules. This is a three stage process. The stages in this process are hierarchy, chart, business, marketing, strategy.
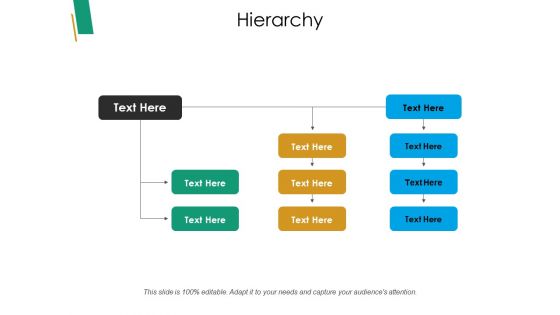
Hierarchy Ppt PowerPoint Presentation Summary Samples
This is a hierarchy ppt powerpoint presentation summary samples. This is a three stage process. The stages in this process are hierarchy, chart, business, marketing, strategy.
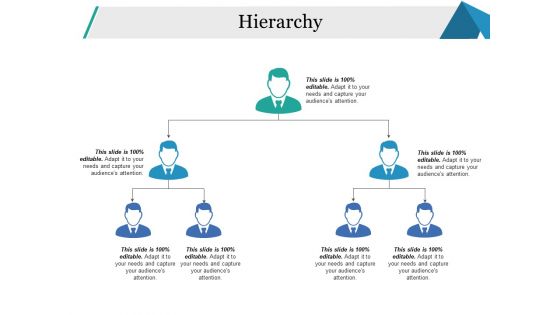
Hierarchy Ppt PowerPoint Presentation Gallery Example
This is a hierarchy ppt powerpoint presentation gallery example. This is a three stage process. The stages in this process are hierarchy, business, marketing, strategy, chart.
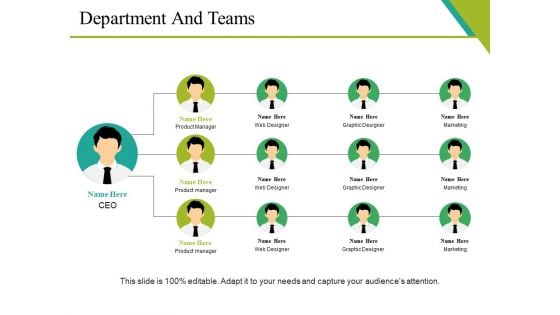
Department And Teams Ppt PowerPoint Presentation Gallery Clipart
This is a department and teams ppt powerpoint presentation gallery clipart. This is a three stage process. The stages in this process are teams, business, marketing, strategy, chart.
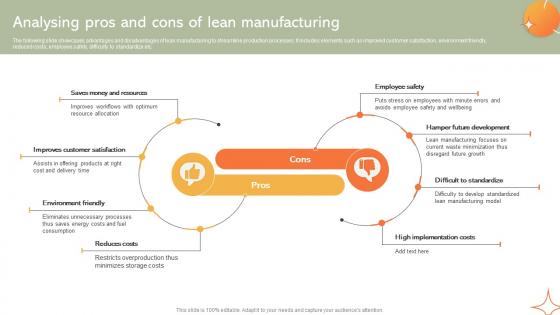
Analysing Pros And Cons Of Lean Manufacturing Implementing Manufacturing Strategy SS V
The following slide showcases advantages and disadvantages of lean manufacturing to streamline production processes. It includes elements such as improved customer satisfaction, environment friendly, reduced costs, employee safety, difficulty to standardize etc. Slidegeeks is one of the best resources for PowerPoint templates. You can download easily and regulate Analysing Pros And Cons Of Lean Manufacturing Implementing Manufacturing Strategy SS V for your personal presentations from our wonderful collection. A few clicks is all it takes to discover and get the most relevant and appropriate templates. Use our Templates to add a unique zing and appeal to your presentation and meetings. All the slides are easy to edit and you can use them even for advertisement purposes. The following slide showcases advantages and disadvantages of lean manufacturing to streamline production processes. It includes elements such as improved customer satisfaction, environment friendly, reduced costs, employee safety, difficulty to standardize etc.
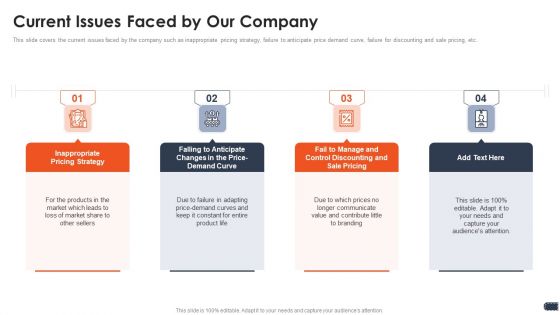
Business Pricing Model Current Issues Faced By Our Company Ppt Pictures Graphics Example PDF
This slide covers the current issues faced by the company such as inappropriate pricing strategy, failure to anticipate price demand curve, failure for discounting and sale pricing, etc. This is a business pricing model current issues faced by our company ppt pictures graphics example pdf template with various stages. Focus and dispense information on four stages using this creative set, that comes with editable features. It contains large content boxes to add your information on topics like inappropriate pricing strategy, price demand curve, control discounting and sale pricing. You can also showcase facts, figures, and other relevant content using this PPT layout. Grab it now.
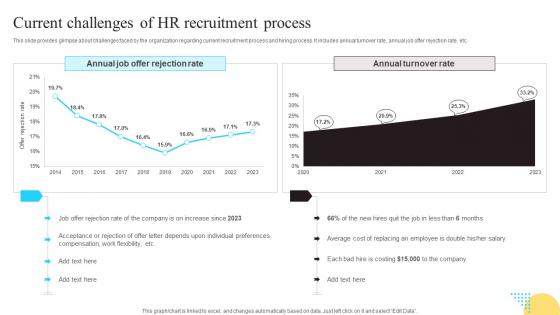
Current Challenges Of HR Recruitment Process Enhancing Workforce Productivity Using HR Topics Pdf
This slide provides glimpse about challenges faced by the organization regarding current recruitment process and hiring process. It includes annual turnover rate,annual job offer rejection rate,etc.There are so many reasons you need a Current Challenges Of HR Recruitment Process Enhancing Workforce Productivity Using HR Topics Pdf The first reason is you can not spend time making everything from scratch,Thus,Slidegeeks has made presentation templates for you too. You can easily download these templates from our website easily. This slide provides glimpse about challenges faced by the organization regarding current recruitment process and hiring process. It includes annual turnover rate, annual job offer rejection rate, etc.
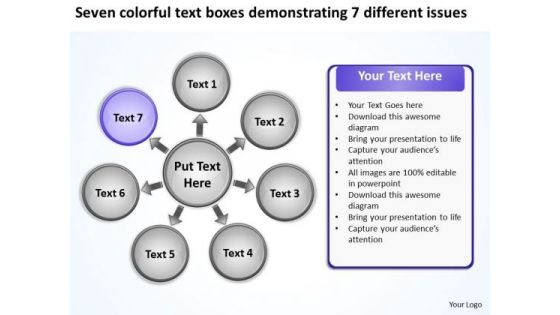
Text Boxes Demonstrating 7 Different Issues Circular Flow Diagram PowerPoint Templates
We present our text boxes demonstrating 7 different issues Circular Flow Diagram PowerPoint templates.Present our Success PowerPoint Templates because iT outlines the entire thought process for the benefit of others. Tell it to the world with your characteristic aplomb. Use our Ring Charts PowerPoint Templates because you can Break it all down to Key Result Areas. Download our Business PowerPoint Templates because The foundation of the structure of your business is resilient and dependable. Convey this confidence to your colleagues and assure them of a great and enduring future. Use our Shapes PowerPoint Templates because this template with an image of helps you chart the course of your presentation. Use our Process and Flows PowerPoint Templates because there is a very good saying that prevention is better than cure, either way you have a store of knowledge for sure.Use these PowerPoint slides for presentations relating to Account, Arrow, Blog, Business, Chart, Description, Diagram, Illustration, Marketing, Process, Profit, Resource, Strategy, Success, Template, Trend. The prominent colors used in the PowerPoint template are Purple, Gray, White. Professionals tell us our text boxes demonstrating 7 different issues Circular Flow Diagram PowerPoint templates have awesome images to get your point across. Customers tell us our Description PowerPoint templates and PPT Slides are Efficient. Use our text boxes demonstrating 7 different issues Circular Flow Diagram PowerPoint templates will get their audience's attention. The feedback we get is that our Illustration PowerPoint templates and PPT Slides are Ritzy. Professionals tell us our text boxes demonstrating 7 different issues Circular Flow Diagram PowerPoint templates are Ultra. Presenters tell us our Diagram PowerPoint templates and PPT Slides are aesthetically designed to attract attention. We guarantee that they will grab all the eyeballs you need. Entertain your audience with our Text Boxes Demonstrating 7 Different Issues Circular Flow Diagram PowerPoint Templates. You will come out on top.

3d Man With Climbing The Success Bar PowerPoint Templates Ppt Backgrounds For Slides 0613
Document the process on our 3d Man With Climbing The Success Bar PowerPoint Templates PPT Backgrounds For Slides. Make a record of every detail. Satiate desires with our marketing PowerPoint Templates. Give them all they want and more. Be the doer with our success PowerPoint Templates. Put your thoughts into practice. Do not let fatalism takeover. Chart your destiny with our 3d Man With Climbing The Success Bar PowerPoint Templates Ppt Backgrounds For Slides 0613.
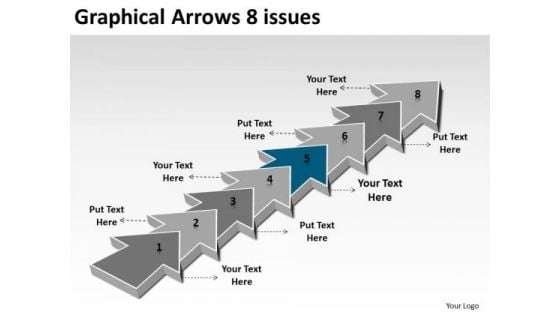
Graphical Arrows 8 Issues Ppt 6 Engineering Process Flow Chart PowerPoint Slides
We present our graphical arrows 8 issues ppt 6 engineering process flow chart PowerPoint Slides. Use our Marketing PowerPoint Templates because, the basic stages are in place, you need to build upon them with our PowerPoint templates. Use our Arrows PowerPoint Templates because, and keep you group steady in the top bracket. Use our Business PowerPoint Templates because, determine your targets and sequence them as per your priorities. Use our Process and Flows PowerPoint Templates because, Leadership Template:- Show them the way, be Captain of the ship and lead them to new shores. Use our Leadership PowerPoint Templates because, discuss each one and slowly but surely move up the pyramid narrowing down to the best and most success oriented project. Use these PowerPoint slides for presentations relating to Advertising, arrow, background, banner, bookmark, card, choice, concept, creative, design, direction, flow, idea, illustration, info graphic, instruction, label, layout, marketing, modern, next, options, process, product, promotion, sequence, simple, step, symbol, template, triangle. The prominent colors used in the PowerPoint template are Blue, Gray, and White Go far and further with our Graphical Arrows 8 Issues Ppt 6 Engineering Process Flow Chart PowerPoint Slides. Add to the distance your thoughts can cover.
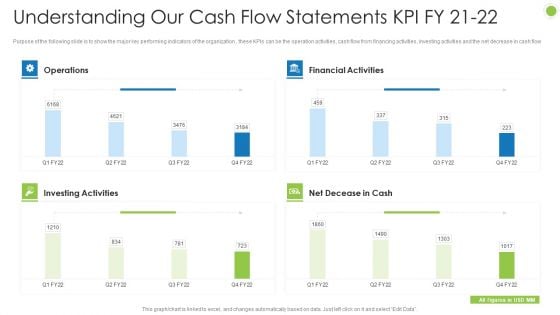
Debt Retrieval Techniques Understanding Our Cash Flow Statements Kpi Fy 21 22 Ppt Inspiration Deck PDF
Purpose of the following slide is to show the major key performing indicators of the organization , these KPIs can be the operation activities, cash flow from financing activities, investing activities and the net decrease in cash flow Deliver an awe inspiring pitch with this creative debt retrieval techniques understanding our cash flow statements kpi fy 21 22 ppt inspiration deck pdf bundle. Topics like operations, investing activities, net decease in cash, financial activities can be discussed with this completely editable template. It is available for immediate download depending on the needs and requirements of the user.
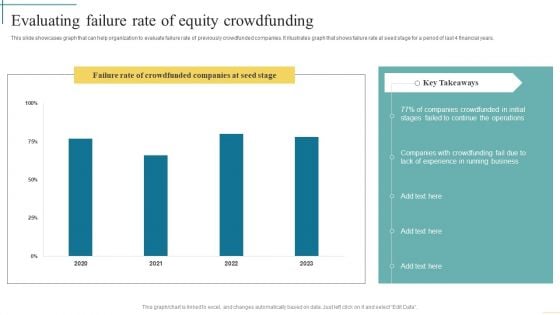
Evaluating Failure Rate Of Equity Crowdfunding Developing Fundraising Techniques Pictures PDF
This slide showcases capital structure of organization that is used to finance the companys assets and operations. It showcases amount of money raised from different sources such as debt, equity capital and various other sources.Take your projects to the next level with our ultimate collection of Evaluating Failure Rate Of Equity Crowdfunding Developing Fundraising Techniques Pictures PDF. Slidegeeks has designed a range of layouts that are perfect for representing task or activity duration, keeping track of all your deadlines at a glance. Tailor these designs to your exact needs and give them a truly corporate look with your own brand colors they all make your projects stand out from the rest.
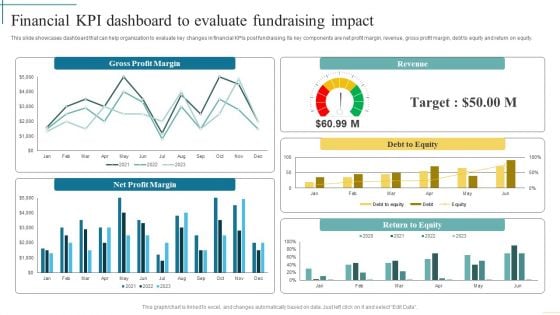
Financial Kpi Dashboard To Evaluate Fundraising Impact Developing Fundraising Techniques Diagrams PDF
This slide showcases dashboard that can help organization to evaluate key changes in financial KPIs post fundraising. Its key components are net profit margin, revenue, gross profit margin, debt to equity and return on equity. From laying roadmaps to briefing everything in detail, our templates are perfect for you. You can set the stage with your presentation slides. All you have to do is download these easy-to-edit and customizable templates. Financial Kpi Dashboard To Evaluate Fundraising Impact Developing Fundraising Techniques Diagrams PDF will help you deliver an outstanding performance that everyone would remember and praise you for. Do download this presentation today.
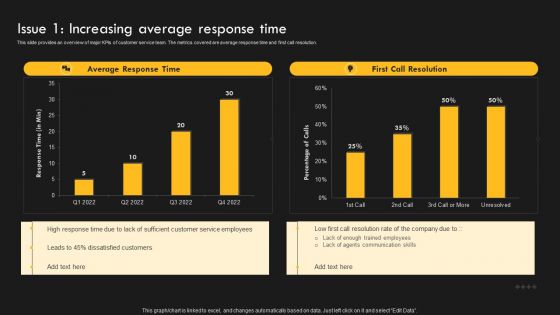
Service Improvement Techniques For Client Retention Issue 1 Increasing Average Response Time Template PDF
This slide provides an overview of major KPIs of customer service team that impact the organization. The metrics covered are ticket backlog and support cost. The Service Improvement Techniques For Client Retention Issue 1 Increasing Average Response Time Template PDF is a compilation of the most recent design trends as a series of slides. It is suitable for any subject or industry presentation, containing attractive visuals and photo spots for businesses to clearly express their messages. This template contains a variety of slides for the user to input data, such as structures to contrast two elements, bullet points, and slides for written information. Slidegeeks is prepared to create an impression.
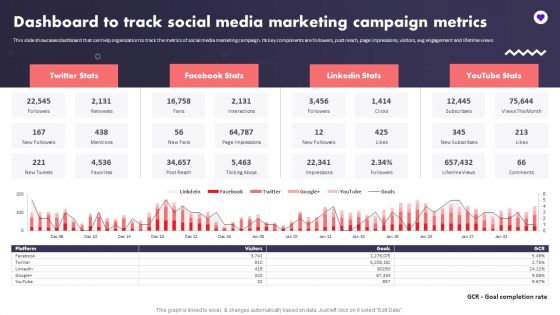
Social Media Promotional Technique Dashboard To Track Social Media Marketing Inspiration PDF
This slide showcases dashboard that can help organization to track the metrics of social media marketing campaign. Its key components are followers, post reach, page impressions, visitors, avg engagement and lifetime views. Want to ace your presentation in front of a live audience Our Social Media Promotional Technique Dashboard To Track Social Media Marketing Inspiration PDF can help you do that by engaging all the users towards you.. Slidegeeks experts have put their efforts and expertise into creating these impeccable powerpoint presentations so that you can communicate your ideas clearly. Moreover, all the templates are customizable, and easy-to-edit and downloadable. Use these for both personal and commercial use.
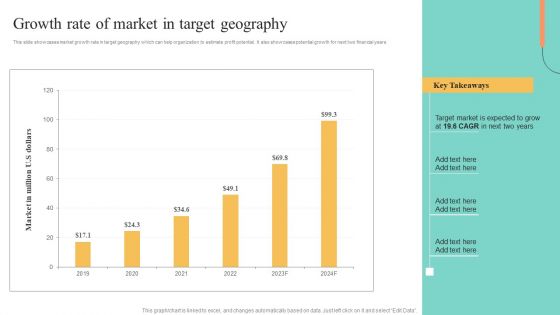
Price Leadership Technique Growth Rate Of Market In Target Geography Information PDF
This slide showcases market growth rate in target geography which can help organization to estimate profit potential. It also showcases potential growth for next two financial years. Take your projects to the next level with our ultimate collection of Price Leadership Technique Growth Rate Of Market In Target Geography Information PDF. Slidegeeks has designed a range of layouts that are perfect for representing task or activity duration, keeping track of all your deadlines at a glance. Tailor these designs to your exact needs and give them a truly corporate look with your own brand colors they will make your projects stand out from the rest.
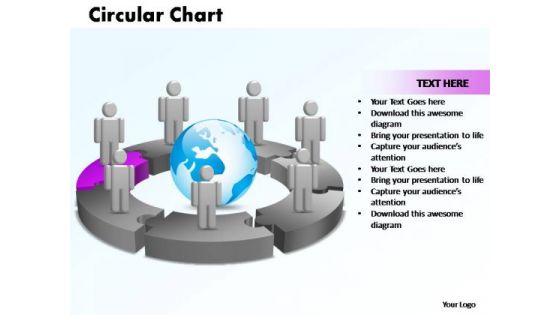
PowerPoint Themes Circular Chart With Globe Ppt Design Slides
PowerPoint Themes Circular Chart With Globe PPT Design Slides-The Circle of Life - a concept emmbedded in our minds and hence easy to comprehend. Life and Business is made up of processes comprising stages that flow from one to another. An excellent graphic to attract the attention of and understanding by your audience to improve earnings.-PowerPoint Themes Circular Chart With Globe PPT Design Slides Cash in on a bargain with our PowerPoint Themes Circular Chart With Globe Ppt Design Slides. Dont pass up this opportunity to shine.
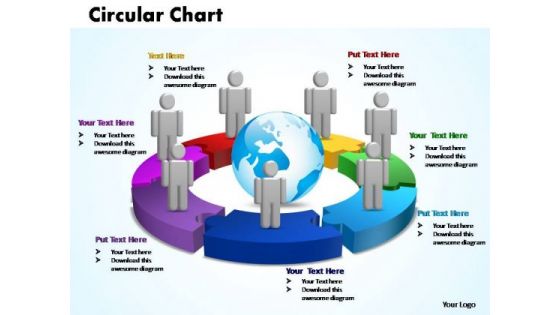
PowerPoint Themes Circular Chart With Globe Ppt Layouts
PowerPoint Themes Circular Chart With Globe PPT Layouts-The Circle of Life - a concept emmbedded in our minds and hence easy to comprehend. Life and Business is made up of processes comprising stages that flow from one to another. An excellent graphic to attract the attention of and understanding by your audience to improve earnings.-PowerPoint Themes Circular Chart With Globe PPT Layouts Be the early bird with our PowerPoint Themes Circular Chart With Globe Ppt Layouts. Be the first on the block with your thoughts.
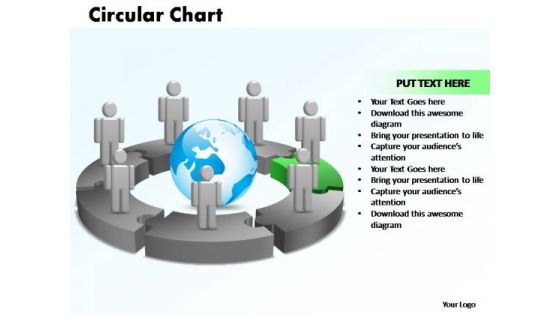
PowerPoint Themes Circular Chart With Globe Ppt Slide Designs
PowerPoint Themes Circular Chart With Globe PPT Slide Designs-The Circle of Life - a concept emmbedded in our minds and hence easy to comprehend. Life and Business is made up of processes comprising stages that flow from one to another. An excellent graphic to attract the attention of and understanding by your audience to improve earnings.-PowerPoint Themes Circular Chart With Globe PPT Slide Designs Show your dreams with our PowerPoint Themes Circular Chart With Globe Ppt Slide Designs. You will come out on top.
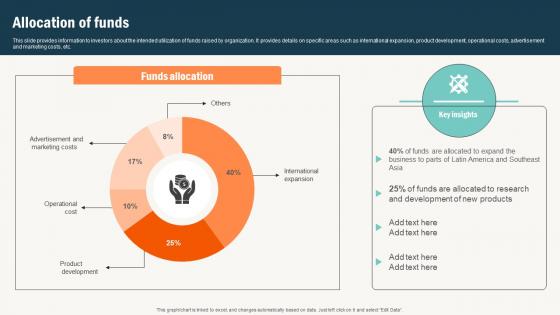
Allocation Of Funds Conversational Commerce Platform Investor
This slide provides information to investors about the intended utilization of funds raised by organization. It provides details on specific areas such as international expansion, product development, operational costs, advertisement and marketing costs, etc. Find a pre designed and impeccable Allocation Of Funds Conversational Commerce Platform Investor The templates can ace your presentation without additional effort. You can download these easy to edit presentation templates to make your presentation stand out from others. So, what are you waiting for Download the template from Slidegeeks today and give a unique touch to your presentation. This slide provides information to investors about the intended utilization of funds raised by organization. It provides details on specific areas such as international expansion, product development, operational costs, advertisement and marketing costs, etc.
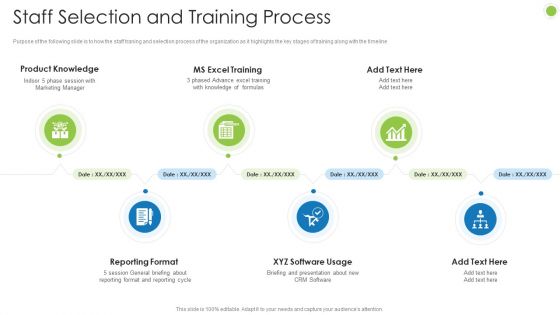
Debt Retrieval Techniques Staff Selection And Training Process Ppt Portfolio Layout PDF
Purpose of the following slide is to how the staff traning and selection process of the organization as it highlights the key stages of training along with the timeline This is a debt retrieval techniques staff selection and training process ppt portfolio layout pdf template with various stages. Focus and dispense information on six stages using this creative set, that comes with editable features. It contains large content boxes to add your information on topics like reporting format, ms excel training, product knowledge, xyz software usage. You can also showcase facts, figures, and other relevant content using this PPT layout. Grab it now.
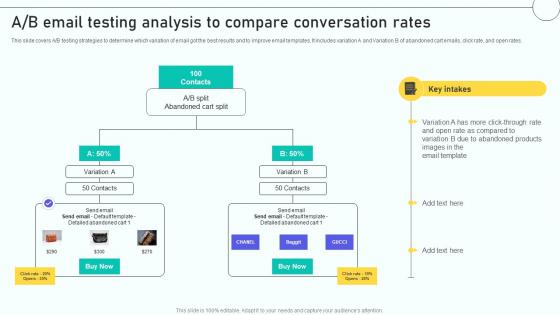
Email Marketing Automation Process A B Email Testing Analysis To Compare Conversation
This slide covers A or B testing strategies to determine which variation of email got the best results and to improve email templates. It includes variation A and Variation B of abandoned cart emails, click rate, and open rates. Get a simple yet stunning designed Email Marketing Automation Process A B Email Testing Analysis To Compare Conversation. It is the best one to establish the tone in your meetings. It is an excellent way to make your presentations highly effective. So, download this PPT today from Slidegeeks and see the positive impacts. Our easy-to-edit Email Marketing Automation Process A B Email Testing Analysis To Compare Conversation can be your go-to option for all upcoming conferences and meetings. So, what are you waiting for Grab this template today. This slide covers A or B testing strategies to determine which variation of email got the best results and to improve email templates. It includes variation A and Variation B of abandoned cart emails, click rate, and open rates.
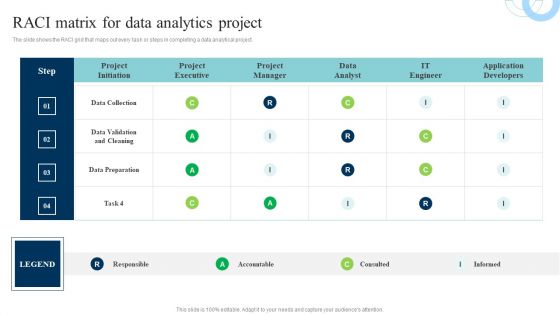
Data Evaluation And Processing Toolkit Raci Matrix For Data Analytics Project Infographics PDF
The slide shows the RACI grid that maps out every task or steps in completing a data analytical project. Whether you have daily or monthly meetings, a brilliant presentation is necessary. Data Evaluation And Processing Toolkit Raci Matrix For Data Analytics Project Infographics PDF can be your best option for delivering a presentation. Represent everything in detail using Data Evaluation And Processing Toolkit Raci Matrix For Data Analytics Project Infographics PDF and make yourself stand out in meetings. The template is versatile and follows a structure that will cater to your requirements. All the templates prepared by Slidegeeks are easy to download and edit. Our research experts have taken care of the corporate themes as well. So, give it a try and see the results.


 Continue with Email

 Home
Home


