Program Management Plan
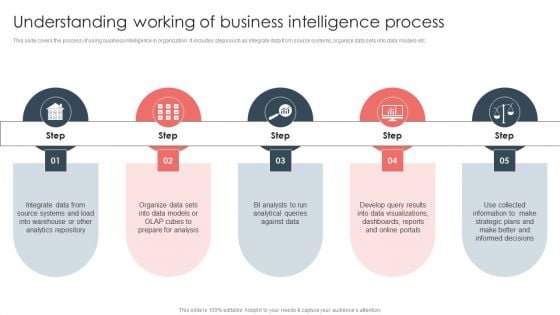
Overview Of BI For Enhanced Decision Making Understanding Working Of Business Intelligence Process Elements PDF
If you are looking for a format to display your unique thoughts, then the professionally designed Overview Of BI For Enhanced Decision Making Understanding Working Of Business Intelligence Process Elements PDF is the one for you. You can use it as a Google Slides template or a PowerPoint template. Incorporate impressive visuals, symbols, images, and other charts. Modify or reorganize the text boxes as you desire. Experiment with shade schemes and font pairings. Alter, share or cooperate with other people on your work. Download Overview Of BI For Enhanced Decision Making Understanding Working Of Business Intelligence Process Elements PDF and find out how to give a successful presentation. Present a perfect display to your team and make your presentation unforgettable.

Highlighting The Employee Satisfaction Survey Results Developing Employee Retention Techniques Background PDF
The purpose of this slide is to exhibit the staff satisfaction survey results. Organizations can evaluate the employee satisfaction level based on the survey results and can further implement employee retention tactics if required. Find a pre-designed and impeccable Highlighting The Employee Satisfaction Survey Results Developing Employee Retention Techniques Background PDF. The templates can ace your presentation without additional effort. You can download these easy-to-edit presentation templates to make your presentation stand out from others. So, what are you waiting for Download the template from Slidegeeks today and give a unique touch to your presentation.

Techniques To Optimize UX Issue 2 Increase In Ticket Backlogs And Support Cost Inspiration PDF
This slide provides an overview of major KPIs of customer service team that impact the organization. The metrics covered are ticket backlog and support cost. The best PPT templates are a great way to save time, energy, and resources. Slidegeeks have 100 percent editable powerpoint slides making them incredibly versatile. With these quality presentation templates, you can create a captivating and memorable presentation by combining visually appealing slides and effectively communicating your message. Download Techniques To Optimize UX Issue 2 Increase In Ticket Backlogs And Support Cost Inspiration PDF from Slidegeeks and deliver a wonderful presentation.
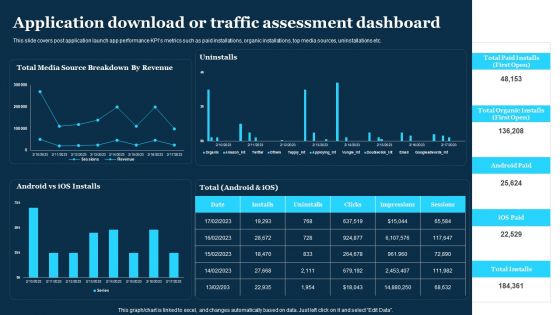
Play Store Launch Techniques For Shopping Apps Application Download Traffic Assessment Structure PDF
This slide covers post application launch app performance KPIs metrics such as paid installations, organic installations, top media sources, uninstallations etc. From laying roadmaps to briefing everything in detail, our templates are perfect for you. You can set the stage with your presentation slides. All you have to do is download these easy to edit and customizable templates. Play Store Launch Techniques For Shopping Apps Application Download Traffic Assessment Structure PDF will help you deliver an outstanding performance that everyone would remember and praise you for. Do download this presentation today.
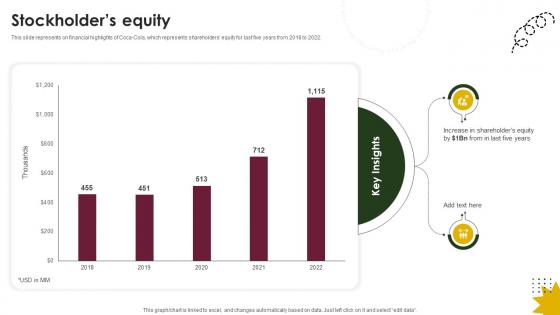
Stockholders Equity Beverage Company Profile CP SS V
This slide represents on financial highlights of Coca-Cola, which represents shareholders equity for last five years from 2018 to 2022.This Stockholders Equity Beverage Company Profile CP SS V is perfect for any presentation, be it in front of clients or colleagues. It is a versatile and stylish solution for organizing your meetings. The Stockholders Equity Beverage Company Profile CP SS V features a modern design for your presentation meetings. The adjustable and customizable slides provide unlimited possibilities for acing up your presentation. Slidegeeks has done all the homework before launching the product for you. So, do not wait, grab the presentation templates today This slide represents on financial highlights of Coca-Cola, which represents shareholders equity for last five years from 2018 to 2022.
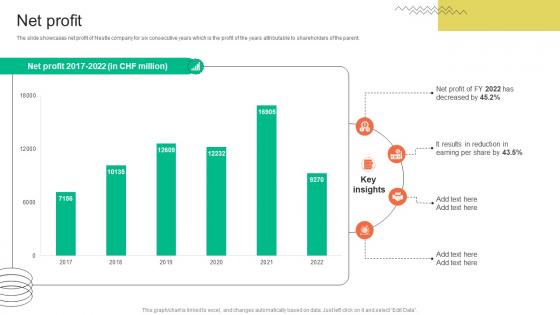
Net Profit FMCG Provider Company Profile CP SS V
The slide showcases net profit of Nestle company for six consecutive years which is the profit of the years attributable to shareholders of the parent. This Net Profit FMCG Provider Company Profile CP SS V is perfect for any presentation, be it in front of clients or colleagues. It is a versatile and stylish solution for organizing your meetings. The Net Profit FMCG Provider Company Profile CP SS V features a modern design for your presentation meetings. The adjustable and customizable slides provide unlimited possibilities for acing up your presentation. Slidegeeks has done all the homework before launching the product for you. So, do not wait, grab the presentation templates today The slide showcases net profit of Nestle company for six consecutive years which is the profit of the years attributable to shareholders of the parent.
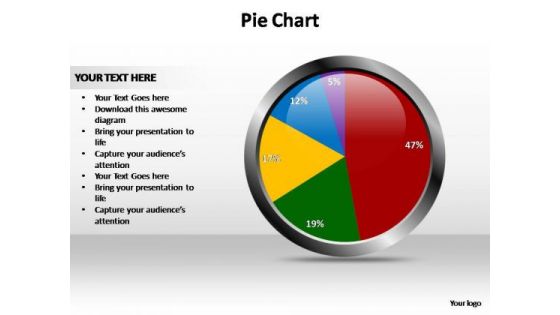
PowerPoint Theme Data Driven Pie Chart Ppt Design Slides
PowerPoint Theme Data Driven Pie Chart PPT Design Slides-The Circle of Life - a concept emmbedded in our minds and hence easy to comprehend. Life and Business is made up of processes comprising stages that flow from one to another. An excellent graphic to attract the attention of and understanding by your audience to improve earnings. Experience fame with our PowerPoint Theme Data Driven Pie Chart Ppt Design Slides. Absorb the adoration that will come your way.
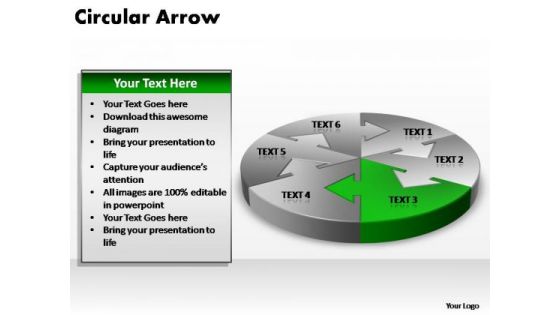
PowerPoint Slide Layout Chart Circular Arrow Ppt Backgrounds
PowerPoint_Slide_layout_Chart_Circular_Arrow_PPT_Backgrounds Business Power Points-The Circle of Life - a concept emmbedded in our minds and hence easy to comprehend. Life and Business is made up of processes comprising stages that flow from one to another. An excellent graphic to attract the attention of and understanding by your audience to improve earnings.-PowerPoint_Slide_layout_Chart_Circular_Arrow_PPT_Backgrounds Business Power Points Get familiar with our PowerPoint Slide Layout Chart Circular Arrow Ppt Backgrounds. They will prove an excellent ally.

Product Launch Event Campaign Task Progress Scorecard Guidelines PDF
This slide covers new product launch event preparation activities chart. It further includes team leader details, activity priority status along with the task progress status. Persuade your audience using this Product Launch Event Campaign Task Progress Scorecard Guidelines PDF. This PPT design covers five stages, thus making it a great tool to use. It also caters to a variety of topics including Campaign Activities, Budget Assigned, Department Approval. Download this PPT design now to present a convincing pitch that not only emphasizes the topic but also showcases your presentation skills.
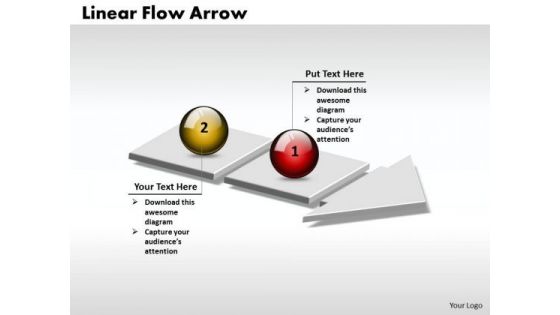
Ppt 3d Linear Flow Arrow Business 2 Stages PowerPoint Templates
PPT 3d linear flow arrow Business 2 stages PowerPoint Templates-The theme of this PowerPoint template is linear arrows. Use them to illustrate a stepwise process or a phase structure.-PPT 3d linear flow arrow Business 2 stages PowerPoint Templates-Achievement, Arrow, Ascending, Ascension, Business, Concept, 2 Stages, Evolution, Illustration, Leader, Leadership, Progress, Red, Render, Rise, Rising, Sphere, Success, Team, White, Circle, Charts, Shapes Examine the causes with our Ppt 3d Linear Flow Arrow Business 2 Stages PowerPoint Templates. Let everyone know what's behind it all.
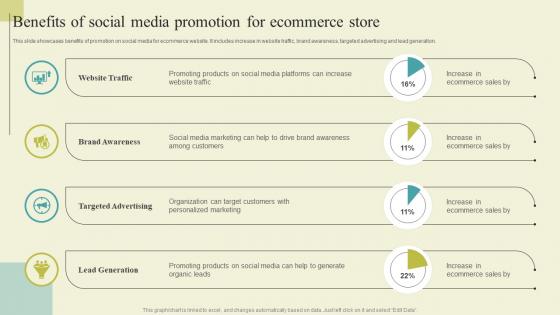
Successful Guide For Ecommerce Promotion Benefits Of Social Media Promotion For Formats Pdf
This slide showcases benefits of promotion on social media for ecommerce website. It includes increase in website traffic, brand awareness, targeted advertising and lead generation. Present like a pro with Successful Guide For Ecommerce Promotion Benefits Of Social Media Promotion For Formats Pdf Create beautiful presentations together with your team, using our easy-to-use presentation slides. Share your ideas in real-time and make changes on the fly by downloading our templates. So whether you are in the office, on the go, or in a remote location, you can stay in sync with your team and present your ideas with confidence. With Slidegeeks presentation got a whole lot easier. Grab these presentations today. This slide showcases benefits of promotion on social media for ecommerce website. It includes increase in website traffic, brand awareness, targeted advertising and lead generation.
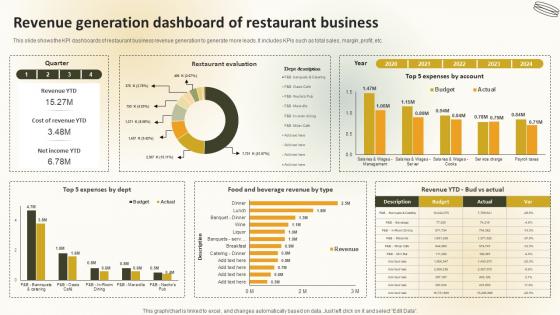
Revenue Generation Dashboard Of Restaurant Business Create An Effective Restaurant
This slide shows the KPI dashboards of restaurant business revenue generation to generate more leads. It includes KPIs such as total sales, margin,profit, etc. Present like a pro with Revenue Generation Dashboard Of Restaurant Business Create An Effective Restaurant. Create beautiful presentations together with your team, using our easy-to-use presentation slides. Share your ideas in real-time and make changes on the fly by downloading our templates. So whether you are in the office, on the go, or in a remote location, you can stay in sync with your team and present your ideas with confidence. With Slidegeeks presentation got a whole lot easier. Grab these presentations today. This slide shows the KPI dashboards of restaurant business revenue generation to generate more leads. It includes KPIs such as total sales, margin,profit, etc.

Create A Restaurant Marketing Revenue Generation Dashboard Of Restaurant
This slide shows the KPI dashboards of restaurant business revenue generation to generate more leads. It includes KPIs such as total sales, margin ,profit, etc. Present like a pro with Create A Restaurant Marketing Revenue Generation Dashboard Of Restaurant. Create beautiful presentations together with your team, using our easy-to-use presentation slides. Share your ideas in real-time and make changes on the fly by downloading our templates. So whether you are in the office, on the go, or in a remote location, you can stay in sync with your team and present your ideas with confidence. With Slidegeeks presentation got a whole lot easier. Grab these presentations today. This slide shows the KPI dashboards of restaurant business revenue generation to generate more leads. It includes KPIs such as total sales, margin ,profit, etc.
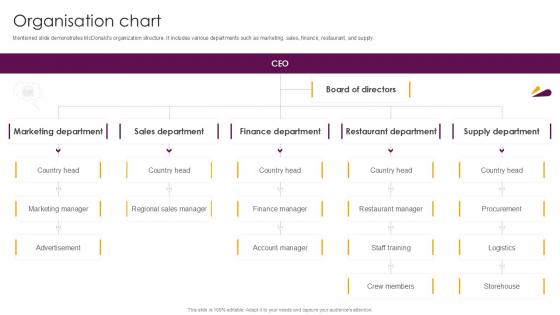
Organisation Chart Food And Beverages Company Profile Ppt Template CP SS V
Mentioned slide demonstrates McDonalds organization structure. It includes various departments such as marketing, sales, finance, restaurant, and supply. This Organisation Chart Food And Beverages Company Profile Ppt Template CP SS V from Slidegeeks makes it easy to present information on your topic with precision. It provides customization options, so you can make changes to the colors, design, graphics, or any other component to create a unique layout. It is also available for immediate download, so you can begin using it right away. Slidegeeks has done good research to ensure that you have everything you need to make your presentation stand out. Make a name out there for a brilliant performance. Mentioned slide demonstrates McDonalds organization structure. It includes various departments such as marketing, sales, finance, restaurant, and supply.

Tailored Product Approach Increasing Production Volume To Decrease Expenses Download Pdf
This slide showcases increase in product volume that can help organization in decreasing production expenses. Its key parameters are units produced per day, raw material cost per unit. Labour cost per hour plus fixed and variable cost per unit. If you are looking for a format to display your unique thoughts, then the professionally designed Tailored Product Approach Increasing Production Volume To Decrease Expenses Download Pdf is the one for you. You can use it as a Google Slides template or a PowerPoint template. Incorporate impressive visuals, symbols, images, and other charts. Modify or reorganize the text boxes as you desire. Experiment with shade schemes and font pairings. Alter, share or cooperate with other people on your work. Download Tailored Product Approach Increasing Production Volume To Decrease Expenses Download Pdf and find out how to give a successful presentation. Present a perfect display to your team and make your presentation unforgettable. This slide showcases increase in product volume that can help organization in decreasing production expenses. Its key parameters are units produced per day, raw material cost per unit. Labour cost per hour plus fixed and variable cost per unit.
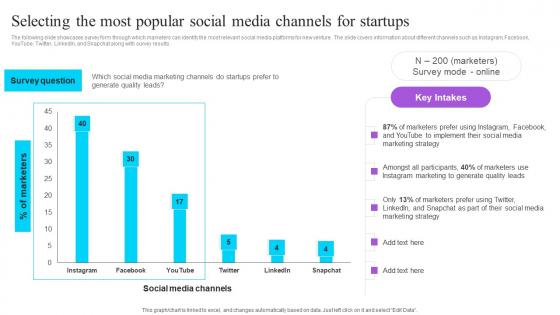
Selecting The Most Popular Social Media Channels For Startups Effective GTM Techniques Rules PDF
The following slide showcases survey form through which marketers can identify the most relevant social media platforms for new venture. The slide covers information about different channels such as Instagram, Facebook, YouTube, Twitter, LinkedIn, and Snapchat along with survey results. Boost your pitch with our creative Selecting The Most Popular Social Media Channels For Startups Effective GTM Techniques Rules PDF. Deliver an awe-inspiring pitch that will mesmerize everyone. Using these presentation templates you will surely catch everyones attention. You can browse the ppts collection on our website. We have researchers who are experts at creating the right content for the templates. So you do not have to invest time in any additional work. Just grab the template now and use them. The following slide showcases survey form through which marketers can identify the most relevant social media platforms for new venture. The slide covers information about different channels such as Instagram, Facebook, YouTube, Twitter, LinkedIn, and Snapchat along with survey results.
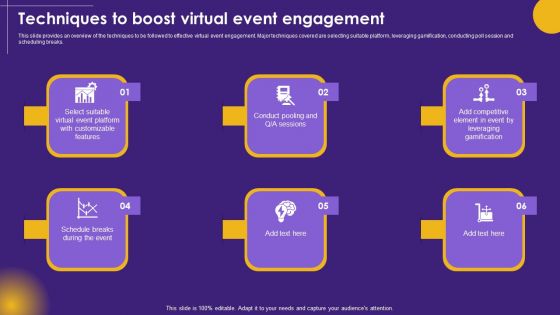
Virtual Communication Techniques To Boost Virtual Event Engagement Brochure PDF
This slide provides an overview of the techniques to be followed to effective virtual event engagement. Major techniques covered are selecting suitable platform, leveraging gamification, conducting poll session and scheduling breaks. If your project calls for a presentation, then Slidegeeks is your go to partner because we have professionally designed, easy to edit templates that are perfect for any presentation. After downloading, you can easily edit Virtual Communication Techniques To Boost Virtual Event Engagement Brochure PDF and make the changes accordingly. You can rearrange slides or fill them with different images. Check out all the handy templates
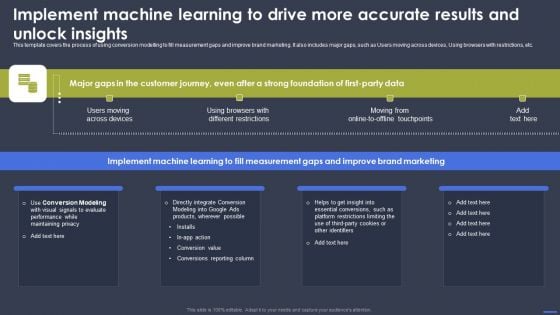
Optimizing Digital Marketing Strategy Implement Machine Learning To Drive More Accurate Rules PDF
This template covers the process of using conversion modelling to fill measurement gaps and improve brand marketing. It also includes major gaps, such as Users moving across devices, Using browsers with restrictions, etc. If your project calls for a presentation, then Slidegeeks is your go-to partner because we have professionally designed, easy-to-edit templates that are perfect for any presentation. After downloading, you can easily edit Optimizing Digital Marketing Strategy Implement Machine Learning To Drive More Accurate Rules PDF and make the changes accordingly. You can rearrange slides or fill them with different images. Check out all the handy templates.
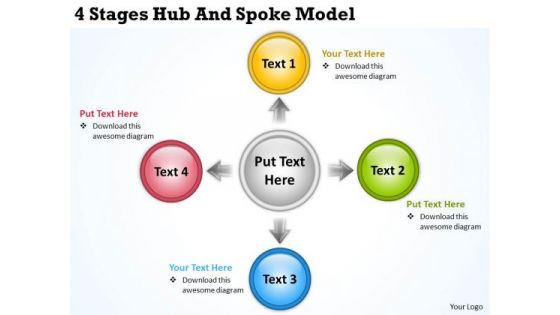
Business Process Diagram Chart Spoke Model PowerPoint Templates Backgrounds For Slides
We present our business process diagram chart spoke model PowerPoint templates backgrounds for slides.Download and present our Ring Charts PowerPoint Templates because Our PowerPoint Templates and Slides are Clear and concise. Use them and dispel any doubts your team may have. Present our Arrows PowerPoint Templates because Our PowerPoint Templates and Slides will effectively help you save your valuable time. They are readymade to fit into any presentation structure. Download our Circle Charts PowerPoint Templates because You have gained great respect for your brilliant ideas. Use our PowerPoint Templates and Slides to strengthen and enhance your reputation. Use our Process and Flows PowerPoint Templates because Our PowerPoint Templates and Slides will help you be quick off the draw. Just enter your specific text and see your points hit home. Download and present our Business PowerPoint Templates because You can Be the star of the show with our PowerPoint Templates and Slides. Rock the stage with your ideas.Use these PowerPoint slides for presentations relating to Abstraction, arrow, circle, circleprocess,cogwheel, eco, ecology, environmental, gear,mechanics, marketing,plant, process, question, rotation, shadow, site,structure, tooth, vector, web, wheel. The prominent colors used in the PowerPoint template are Yellow, Green, White. You are fastidious with your choices. Our Business Process Diagram Chart Spoke Model PowerPoint Templates Backgrounds For Slides will certainly catch your fancy.
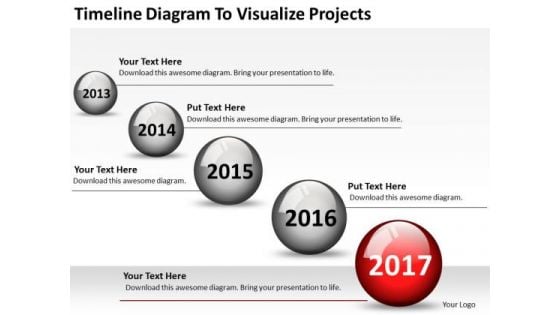
Business Process Flow Chart Example Diagram To Visualize Projects PowerPoint Templates
We present our business process flow chart example diagram to visualize projects PowerPoint templates.Download our Circle Charts PowerPoint Templates because Our PowerPoint Templates and Slides have the Brilliant backdrops. Guaranteed to illuminate the minds of your audience. Download our Business PowerPoint Templates because You aspire to touch the sky with glory. Let our PowerPoint Templates and Slides provide the fuel for your ascent. Use our Shapes PowerPoint Templates because Our PowerPoint Templates and Slides are Clear and concise. Use them and dispel any doubts your team may have. Present our Flow Charts PowerPoint Templates because Our PowerPoint Templates and Slides will provide weight to your words. They will bring out the depth of your thought process. Download and present our Process and Flows PowerPoint Templates because You have a driving passion to excel in your field. Our PowerPoint Templates and Slides will prove ideal vehicles for your ideas.Use these PowerPoint slides for presentations relating to Art, beautiful, celebration, circle, color, cottontail, crowd, decoration, design, element, frame, illustration, image, international, isolated, ornament, pattern, precious, present, red, reflection, silhouette, symbol, traditional, white, yellow . The prominent colors used in the PowerPoint template are Red, Gray, White. With our Business Process Flow Chart Example Diagram To Visualize Projects PowerPoint Templates there is no need to exaggerate. They are always brief and accurate.
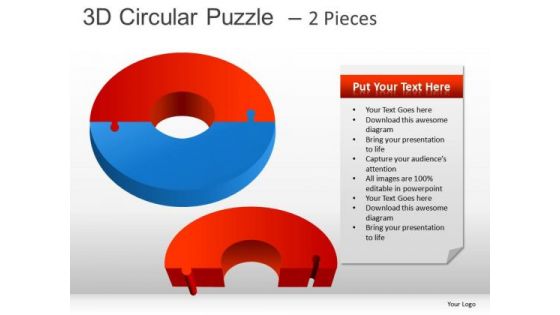
2 Pieces Circular Puzzle PowerPoint Slides And Ppt Diagram Templates
2 Pieces Circular Puzzle PowerPoint Slides And PPT Diagram Templates-These high quality, editable pre-designed powerpoint slides have been carefully created by our professional team to help you impress your audience. Each graphic in every slide is vector based and is 100% editable in powerpoint. Each and every property of any slide - color, size, shading etc can be modified to build an effective powerpoint presentation. Use these slides to convey complex business concepts in a simplified manner. Any text can be entered at any point in the powerpoint slide. Simply DOWNLOAD, TYPE and PRESENT! Extend the effect with our 2 Pieces Circular Puzzle PowerPoint Slides And Ppt Diagram Templates. Get greater control of your domain.
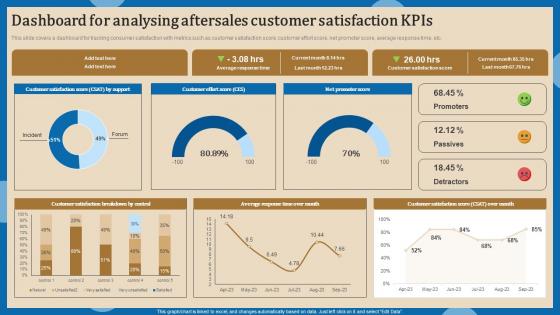
Dashboard For Analysing Increasing Client Retention Through Efficient Brochure Pdf
This slide covers a dashboard for tracking consumer satisfaction with metrics such as customer satisfaction score, customer effort score, net promoter score, average response time, etc. Do you have an important presentation coming up Are you looking for something that will make your presentation stand out from the rest Look no further than Dashboard For Analysing Increasing Client Retention Through Efficient Brochure Pdf. With our professional designs, you can trust that your presentation will pop and make delivering it a smooth process. And with Slidegeeks, you can trust that your presentation will be unique and memorable. So why wait Grab Dashboard For Analysing Increasing Client Retention Through Efficient Brochure Pdf today and make your presentation stand out from the rest. This slide covers a dashboard for tracking consumer satisfaction with metrics such as customer satisfaction score, customer effort score, net promoter score, average response time, etc.
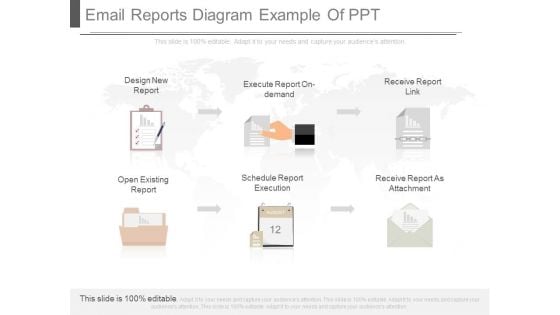
Email Reports Diagram Example Of Ppt
This is a email reports diagram example of ppt. This is a six stage process. The stages in this process are design new report, execute report on demand, receive report link, open existing report, schedule report execution, receive report as attachment.
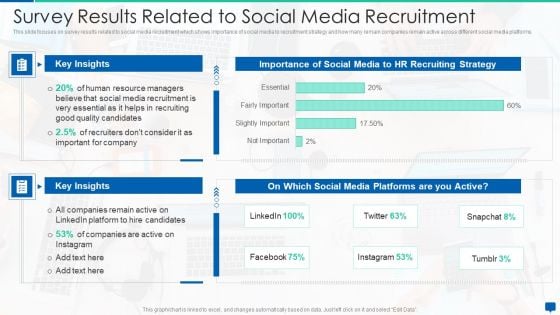
Social Media Hiring Process Optimization Survey Results Related To Social Media Recruitment Summary PDF
Deliver an awe inspiring pitch with this creative social media hiring process optimization survey results related to social media recruitment summary pdf bundle. Topics like importance of social, which social media, recruiting strategy can be discussed with this completely editable template. It is available for immediate download depending on the needs and requirements of the user.
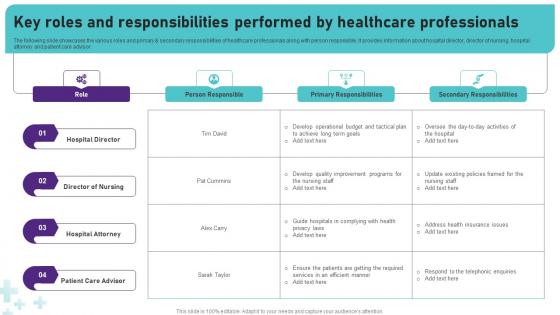
Key Roles And Responsibilities Performed By Healthcare Operational Areas Healthcare Ideas PDF
Explore a selection of the finest Key Roles And Responsibilities Performed By Healthcare Operational Areas Healthcare Ideas PDF here. With a plethora of professionally designed and pre-made slide templates, you can quickly and easily find the right one for your upcoming presentation. You can use our Key Roles And Responsibilities Performed By Healthcare Operational Areas Healthcare Ideas PDF to effectively convey your message to a wider audience. Slidegeeks has done a lot of research before preparing these presentation templates. The content can be personalized and the slides are highly editable. Grab templates today from Slidegeeks. The following slide showcases the various roles and primary and secondary responsibilities of healthcare professionals along with person responsible. It provides information about hospital director, director of nursing, hospital attorney and patient care advisor.
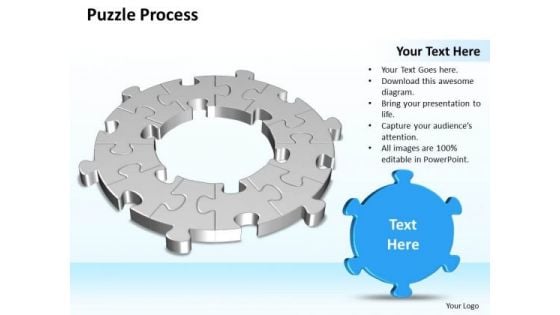
Business Charts PowerPoint Templates 3d Circular Flow Puzzle Piece Process Diagram 12 Stages
Business Charts PowerPoint templates 3d circular flow Puzzle piece process diagram 12 stages-This PowerPoint Diagram shows Interconnected puzzles arranged in circular manner from which center one is missing. It signifies business, buying, clearance, closeout, commerce, consuming, deal, enterprise, marketing, negotiation, purchase.-Business Charts PowerPoint templates 3d circular flow Puzzle piece process diagram 12 stages Get your ideas buzzing with our Business Charts PowerPoint Templates 3d Circular Flow Puzzle Piece Process Diagram 12 Stages. They will be flying all around.
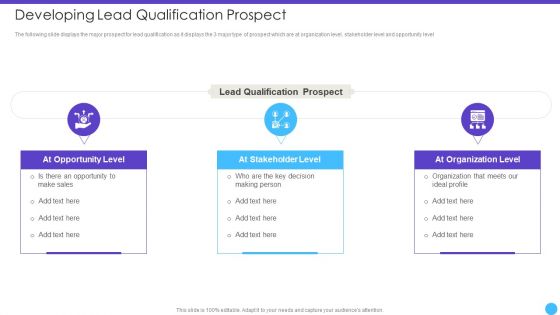
Sales Lead Qualification Rating Framework Developing Lead Qualification Prospect Demonstration PDF
The following slide displays the major prospect for lead qualification as it displays the 3 major type of prospect which are at organization level, stakeholder level and opportunity level.Presenting Sales Lead Qualification Rating Framework Developing Lead Qualification Prospect Demonstration PDF to provide visual cues and insights. Share and navigate important information on three stages that need your due attention. This template can be used to pitch topics like Lead Qualification, Stakeholder Level, Organization Level In addtion, this PPT design contains high resolution images, graphics, etc, that are easily editable and available for immediate download.
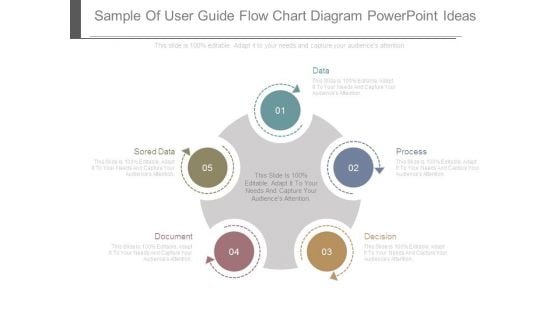
Sample Of User Guide Flow Chart Diagram Powerpoint Ideas
This is a sample of user guide flow chart diagram powerpoint ideas. This is a five stage process. The stages in this process are data, process, decision, document, sored data.
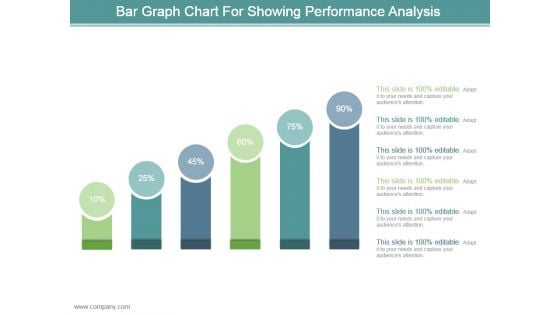
Bar Graph Chart For Showing Performance Analysis Ppt Design
This is a bar graph chart for showing performance analysis ppt design. This is a six stage process. The stages in this process are business, marketing, process, success, presentation.
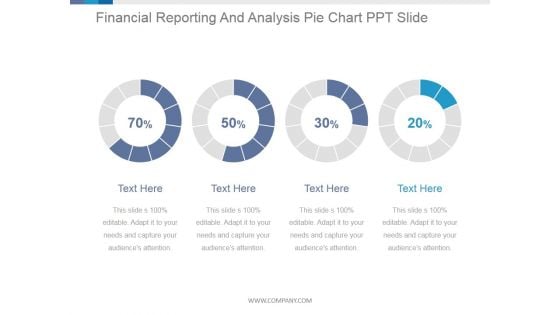
Financial Reporting And Analysis Pie Chart Ppt PowerPoint Presentation Guidelines
This is a financial reporting and analysis pie chart ppt powerpoint presentation guidelines. This is a four stage process. The stages in this process are process, percentage, business, marketing, finance.
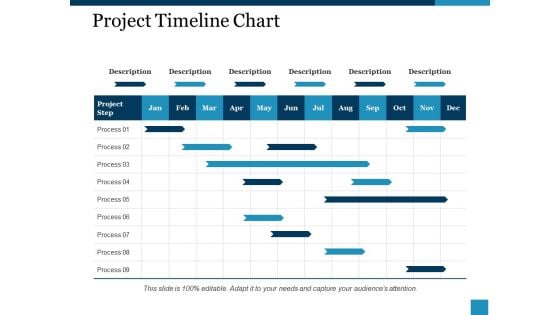
Project Timeline Chart Ppt PowerPoint Presentation Portfolio Gridlines
This is a project timeline chart ppt powerpoint presentation portfolio gridlines. This is a nine stage process. The stages in this process are description, process, project step, table, business.
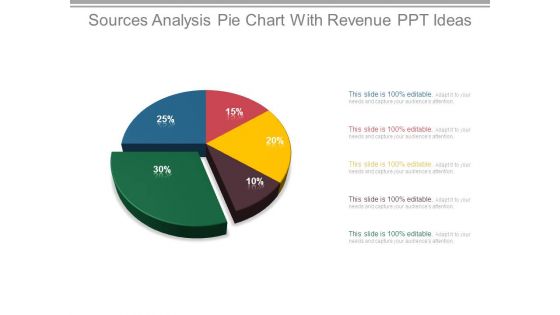
Sources Analysis Pie Chart With Revenue Ppt Ideas
This is a sources analysis pie chart with revenue ppt ideas. This is a five stage process. The stages in this process are finance, success, business, marketing, percentage, pie chart.
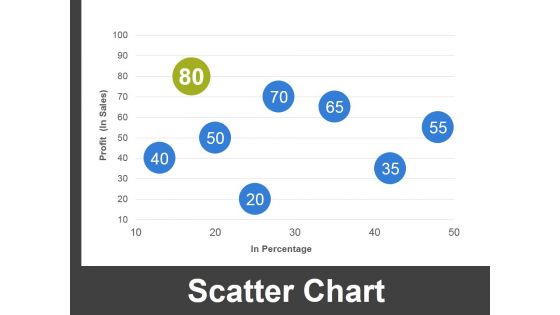
Scatter Chart Ppt PowerPoint Presentation Pictures Slide Download
This is a scatter chart ppt powerpoint presentation pictures slide download. This is a two stage process. The stages in this process are scatter chart, finance, analysis, marketing, business.
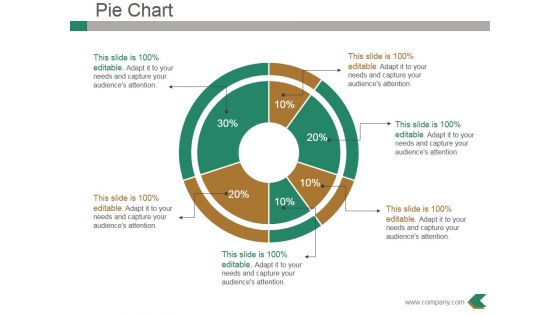
Pie Chart Ppt PowerPoint Presentation File Background Designs
This is a pie chart ppt powerpoint presentation file background designs. This is a six stage process. The stages in this process are business, marketing, pie chart, percentage, finance.
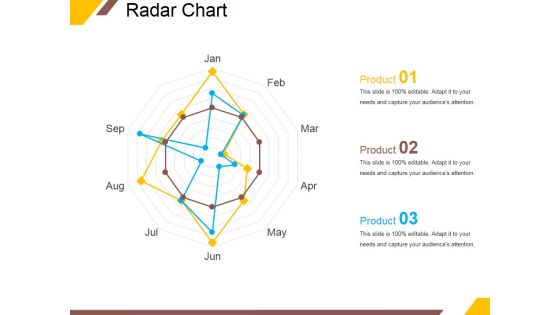
Radar Chart Ppt PowerPoint Presentation Slides Layout Ideas
This is a radar chart ppt powerpoint presentation slides layout ideas. This is a three stage process. The stages in this process are product, shapes, business, marketing, radar chart.
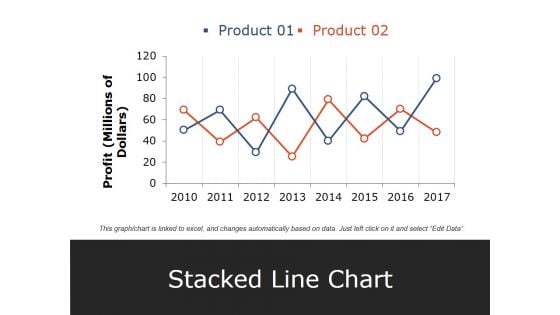
Stacked Line Chart Ppt PowerPoint Presentation Pictures Elements
This is a stacked line chart ppt powerpoint presentation pictures elements. This is a two stage process. The stages in this process are product, profit, stacked line chart, year, business.
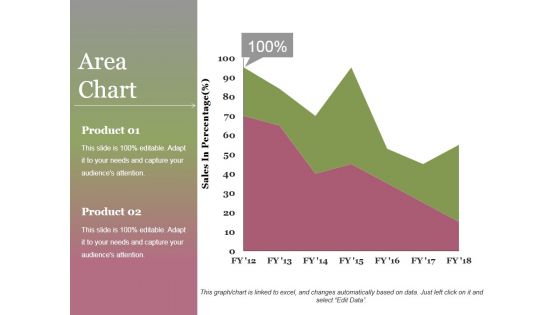
Area Chart Ppt PowerPoint Presentation Infographics File Formats
This is a area chart ppt powerpoint presentation infographics file formats. This is a two stage process. The stages in this process are area chart, product, sales in percentage, growth, success.
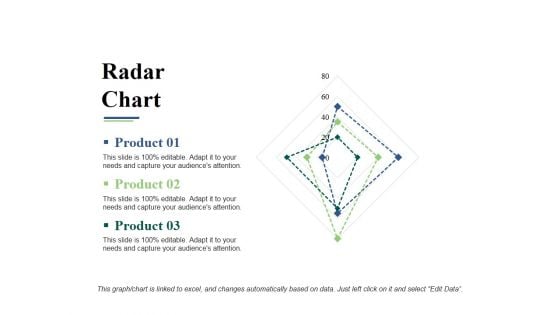
Radar Chart Ppt PowerPoint Presentation Infographic Template Microsoft
This is a radar chart ppt powerpoint presentation infographic template microsoft. This is a three stage process. The stages in this process are product, radar chart, shapes, business, marketing.
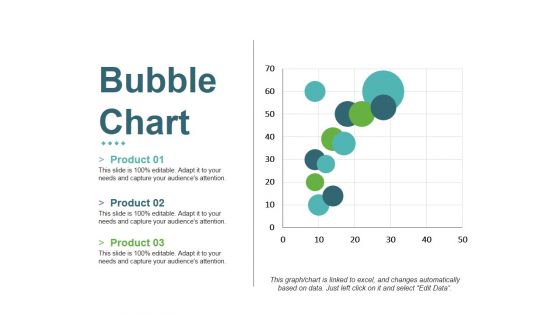
Bubble Chart Ppt PowerPoint Presentation Inspiration Graphics Download
This is a bubble chart ppt powerpoint presentation inspiration graphics download. This is a three stage process. The stages in this process are product, growth, success, bubble chart, business.

Radar Chart Ppt PowerPoint Presentation Professional Slide Portrait
This is a radar chart ppt powerpoint presentation professional slide portrait. This is a two stage process. The stages in this process are radar chart, shapes, product, business, marketing.
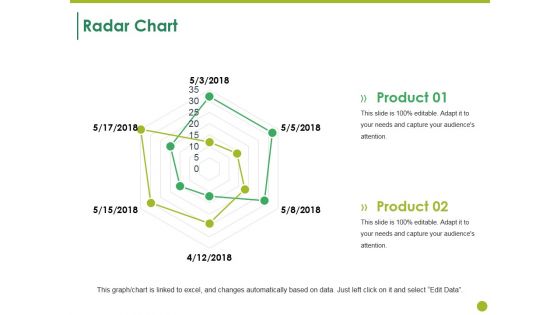
Radar Chart Ppt PowerPoint Presentation Summary Design Templates
This is a radar chart ppt powerpoint presentation summary design templates. This is a two stage process. The stages in this process are radar chart, product, shapes, business, marketing.

Radar Chart Ppt PowerPoint Presentation Inspiration Infographic Template
This is a radar chart ppt powerpoint presentation inspiration infographic template. This is a two stage process. The stages in this process are radar chart, product, business, finance, marketing.

Radar Chart Ppt PowerPoint Presentation Infographics Visual Aids
This is a radar chart ppt powerpoint presentation infographics visual aids. This is a two stage process. The stages in this process are radar chart, product, finance, business, marketing.
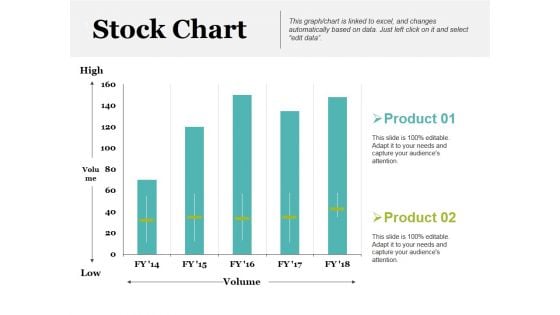
Stock Chart Ppt PowerPoint Presentation Inspiration Example Introduction
This is a stock chart ppt powerpoint presentation inspiration example introduction. This is a two stage process. The stages in this process are product, high, volume, low, stock chart.
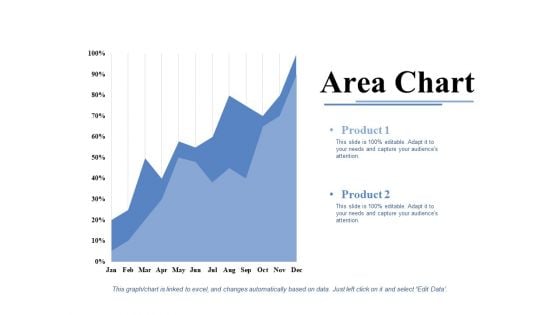
Area Chart Ppt PowerPoint Presentation Infographic Template Model
This is a area chart ppt powerpoint presentation infographic template model. This is a two stage process. The stages in this process are product, area chart, growth, percentage, success.
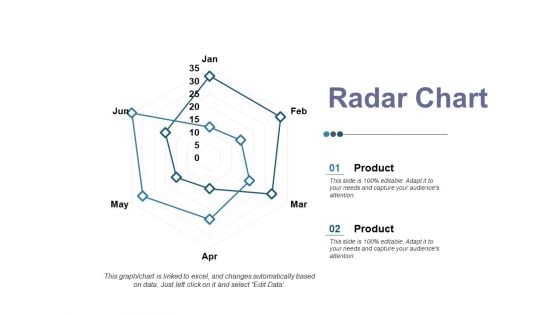
Radar Chart Ppt PowerPoint Presentation Professional Master Slide
This is a radar chart ppt powerpoint presentation professional master slide. This is a two stage process. The stages in this process are product, radar chart, financial, business, shape.
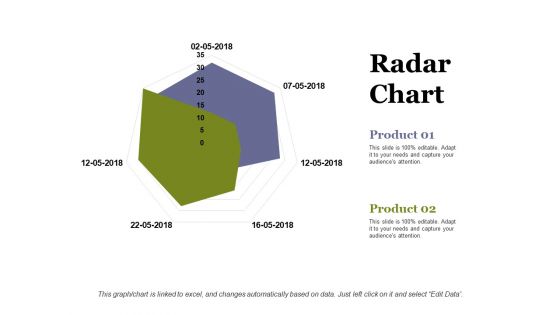
Radar Chart Ppt PowerPoint Presentation Infographic Template Information
This is a radar chart ppt powerpoint presentation infographic template information. This is a two stage process. The stages in this process are radar chart, product, business, marketing, shape.
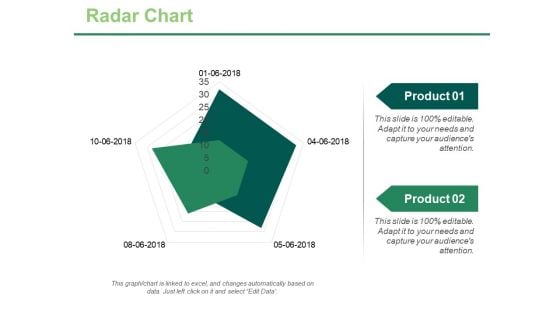
Radar Chart Ppt PowerPoint Presentation Portfolio Graphics Template
This is a radar chart ppt powerpoint presentation portfolio graphics template. This is a two stage process. The stages in this process are product, finance, shape, radar chart, business.

Radar Chart Ppt PowerPoint Presentation Professional Infographic Template
This is a radar chart ppt powerpoint presentation professional infographic template. This is a two stage process. The stages in this process are product, finance, shape, radar chart, business.
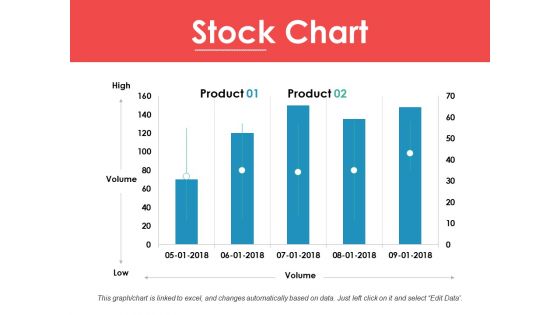
Stock Chart Ppt PowerPoint Presentation Ideas Infographic Template
This is a stock chart ppt powerpoint presentation ideas infographic template. This is a two stage process. The stages in this process are high, volume, low, product, stock chart.
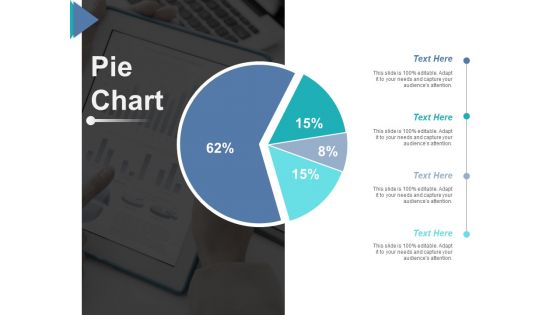
Pie Chart Ppt PowerPoint Presentation Inspiration Example File
This is a pie chart ppt powerpoint presentation inspiration example file. This is a four stage process. The stages in this process are pie chart, finance, percentage, business, marketing.
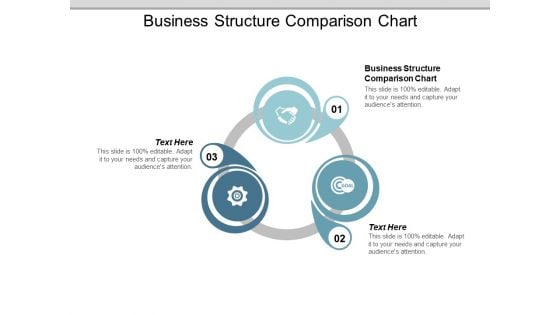
Business Structure Comparison Chart Ppt PowerPoint Presentation Infographic Template Vector
This is a business structure comparison chart ppt powerpoint presentation infographic template vector. This is a three stage process. The stages in this process are business structure comparison chart.
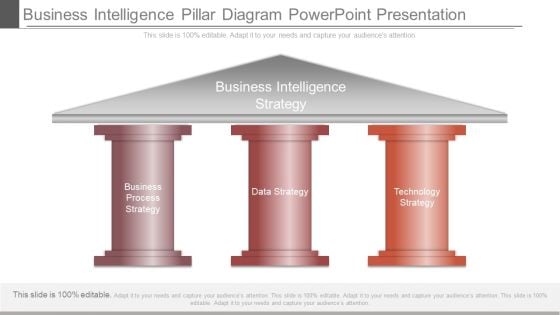
Business Intelligence Pillar Diagram Powerpoint Presentation
This is a business intelligence pillar diagram powerpoint presentation. This is a three stage process. The stages in this process are business intelligence strategy, business process strategy, data strategy, technology strategy.
Network Supply Process Of Pharma Company Icons PDF
This slide covers steps in pharmaceutical supply chain. It includes phases from new product development, active pharmaceutical ingredient manufacturing, secondary manufacturing and packaging, distribution, reaching patients. Persuade your audience using this Network Supply Process Of Pharma Company Icons PDF. This PPT design covers Four stages, thus making it a great tool to use. It also caters to a variety of topics including Innovation and Development, Pharmaceutical Ingredient, Distribution. Download this PPT design now to present a convincing pitch that not only emphasizes the topic but also showcases your presentation skills.
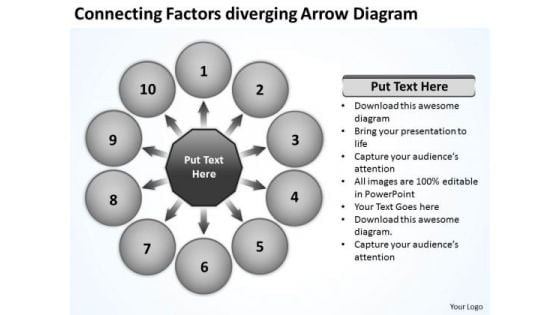
Connecting Factors Diverging Arrow Diagram Circular Flow Chart PowerPoint Slides
We present our connecting factors diverging arrow diagram Circular Flow Chart PowerPoint Slides.Present our Success PowerPoint Templates because you have come up with a brilliant breakthrough idea. you can also visualise the interest it will generate. Download and present our Arrows PowerPoint Templates because it shows the pyramid which is a symbol of the desire to reach the top in a steady manner. Download and present our Business PowerPoint Templates because you have churned your mind and come upwith solutions. Use our Shapes PowerPoint Templates because you will be able to Highlight your ideas broad-based on strong fundamentals and illustrate how they step by step acheive the set growth factor. Download our Flow Charts PowerPoint Templates because you know the path so show the way.Use these PowerPoint slides for presentations relating to Access, Arrow, Business, Chart, Circle, Concept, Conceptual, Connection, Corporate, Creative, Graphic, Illustration, Process, Shape, Template, Text, Usable, Web, Website. The prominent colors used in the PowerPoint template are White, Gray, Black. People tell us our connecting factors diverging arrow diagram Circular Flow Chart PowerPoint Slides are Appealing. Use our Connection PowerPoint templates and PPT Slides will generate and maintain the level of interest you desire. They will create the impression you want to imprint on your audience. Professionals tell us our connecting factors diverging arrow diagram Circular Flow Chart PowerPoint Slides will make the presenter look like a pro even if they are not computer savvy. Presenters tell us our Concept PowerPoint templates and PPT Slides are Efficacious. Professionals tell us our connecting factors diverging arrow diagram Circular Flow Chart PowerPoint Slides are Whimsical. PowerPoint presentation experts tell us our Chart PowerPoint templates and PPT Slides are Pleasant. Move away from amateur slides. Make them professional with our Connecting Factors Diverging Arrow Diagram Circular Flow Chart PowerPoint Slides. You will be at the top of your game.

Brand Elements Example Powerpoint Presentation
This is a brand elements example powerpoint presentation. This is a eight stage process. The stages in this process are slogan, logo, tone, jingle, packaging, charters, name, url.
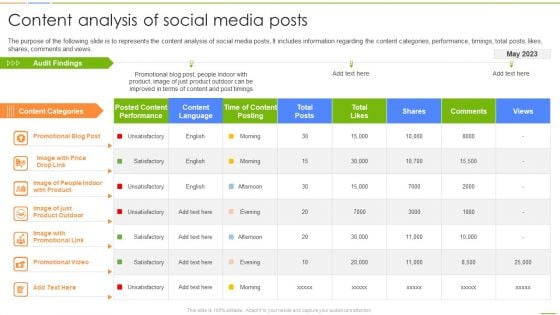
Social Media Channels Auditing Social Media Channels Auditing Content Analysis Formats PDF
The purpose of the following slide is to represents the content analysis of social media posts. It includes information regarding the content categories, performance, timings, total posts, likes, shares, comments and views. If you are looking for a format to display your unique thoughts, then the professionally designed Social Media Channels Auditing Social Media Channels Auditing Content Analysis Formats PDF is the one for you. You can use it as a Google Slides template or a PowerPoint template. Incorporate impressive visuals, symbols, images, and other charts. Modify or reorganize the text boxes as you desire. Experiment with shade schemes and font pairings. Alter, share or cooperate with other people on your work. Download Social Media Channels Auditing Social Media Channels Auditing Content Analysis Formats PDF and find out how to give a successful presentation. Present a perfect display to your team and make your presentation unforgettable.
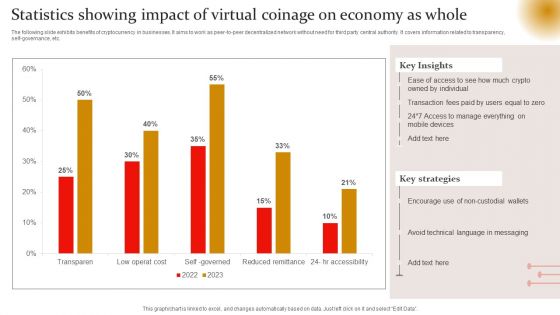
Statistics Showing Impact Of Virtual Coinage On Economy As Whole Graphics PDF
The following slide exhibits benefits of cryptocurrency in businesses. It aims to work as peer-to-peer decentralized network without need for third party central authority. It covers information related to transparency, self-governance, etc. Showcasing this set of slides titled Statistics Showing Impact Of Virtual Coinage On Economy As Whole Graphics PDF. The topics addressed in these templates are Key Insights, Key Strategies, Technical Language. All the content presented in this PPT design is completely editable. Download it and make adjustments in color, background, font etc. as per your unique business setting.
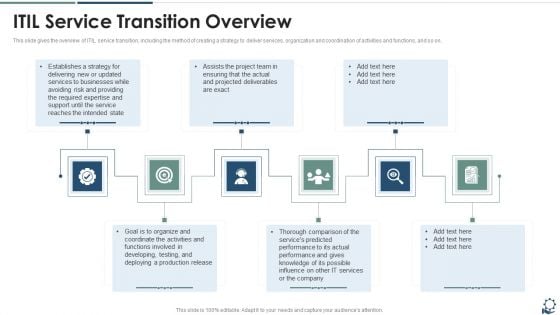
ITIL Service Transition Overview Information PDF
This slide gives the overview of ITIL service transition, including the method of creating a strategy to deliver services, organization and coordination of activities and functions, and so on.This is a ITIL Service Transition Overview Information PDF template with various stages. Focus and dispense information on six stages using this creative set, that comes with editable features. It contains large content boxes to add your information on topics like Services To Businesses, Deploying A Production, Thorough Comparison. You can also showcase facts, figures, and other relevant content using this PPT layout. Grab it now.
New Business PowerPoint Presentation Steps Diverging Ppt Charts And Diagrams Slides
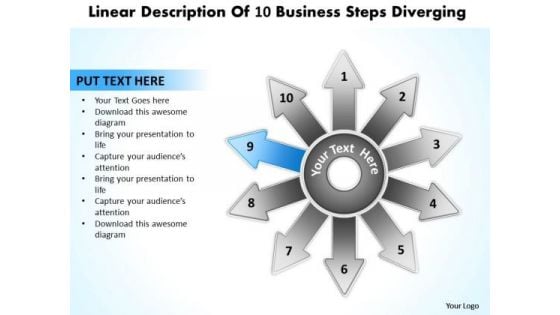
We present our new business powerpoint presentation steps diverging ppt Charts and Diagrams Slides.Download and present our Communication PowerPoint Templates because the concept and strategy is your strength. Use our Business PowerPoint Templates because it will demonstrate the strength of character under severe stress. Shine the torch ahead and bring the light to shine on all. Present our Arrows PowerPoint Templates because this slide is Designed to help bullet-point your views and thoughts. Present our Symbol PowerPoint Templates because it Creates a winner with your passion and dream. Download and present our Process and Flows PowerPoint Templates because you should Lay down the fundamentals to build upon.Use these PowerPoint slides for presentations relating to Abstract, Arrow, Background, Buttons, Circle, Clean, Communication, Concept, Conceptual, Design, Diagram, Direction, Elements, Exchange, Flow, Flowchart, Graph, Graphic, Icon, Illustration, Internet, Precise, Process, Red, Sign, Symbol, Template. The prominent colors used in the PowerPoint template are Blue, Gray, Black. Use our new business powerpoint presentation steps diverging ppt Charts and Diagrams Slides will make the presenter look like a pro even if they are not computer savvy. We assure you our Conceptual PowerPoint templates and PPT Slides are Luxuriant. People tell us our new business powerpoint presentation steps diverging ppt Charts and Diagrams Slides are readymade to fit into any presentation structure. PowerPoint presentation experts tell us our Background PowerPoint templates and PPT Slides are Pleasant. PowerPoint presentation experts tell us our new business powerpoint presentation steps diverging ppt Charts and Diagrams Slides are Great. Use our Circle PowerPoint templates and PPT Slides are Liberated. Your customer is the center of it all. Our New Business PowerPoint Presentation Steps Diverging Ppt Charts And Diagrams Slides will concentrate on him.


 Continue with Email

 Home
Home


