Progress Bar
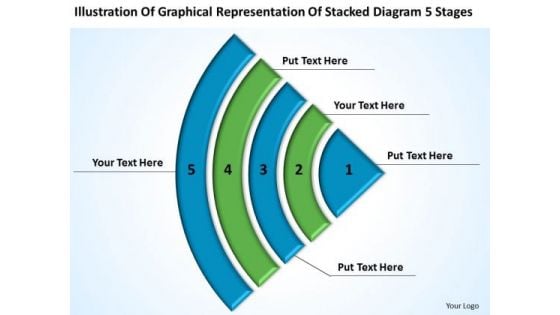
Graphical Representation Stacked Diagram 5 Stages Subway Business Plan PowerPoint Slides
We present our graphical representation stacked diagram 5 stages subway business plan PowerPoint Slides.Use our Business PowerPoint Templates because They will Put the wind in your sails. Skim smoothly over the choppy waters of the market. Use our Leadership PowerPoint Templates because Our PowerPoint Templates and Slides will Activate the energies of your audience. Get their creative juices flowing with your words. Download and present our Targets PowerPoint Templates because You should Press the right buttons with our PowerPoint Templates and Slides. They will take your ideas down the perfect channel. Use our Signs PowerPoint Templates because These PowerPoint Templates and Slides will give the updraft to your ideas. See them soar to great heights with ease. Download and present our Process and Flows PowerPoint Templates because Our PowerPoint Templates and Slides will let your ideas bloom. Create a bed of roses for your audience.Use these PowerPoint slides for presentations relating to team, logo icon, leadership, leader, forward, progress bar, target, circle logo, achievement, business, concept, sign, success, teamwork, symbol, logo design, diagram, circle, graphic, finance, difference, process, goal, marketing, different, development, price, abstract, graph, sectors, illustration, icon, circular, chart, forecast, direction, design, moving, motion, company, competition, progress, profit, increase, background, path, investment, aim, financial, communication. The prominent colors used in the PowerPoint template are Green, Blue, Black. You have been given an exacting task. Plan your approach with our Graphical Representation Stacked Diagram 5 Stages Subway Business Plan PowerPoint Slides.
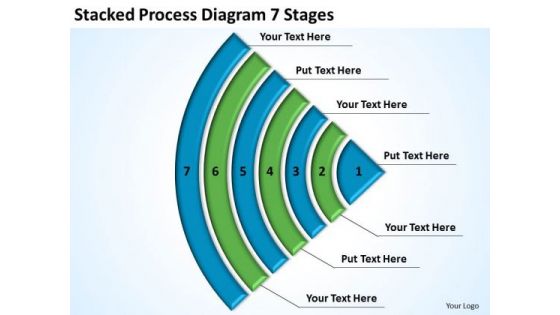
Stacked Process Diagram 7 Stages Business Plan Template Word PowerPoint Templates
We present our stacked process diagram 7 stages business plan template word PowerPoint templates.Download and present our Business PowerPoint Templates because Our PowerPoint Templates and Slides offer you the needful to organise your thoughts. Use them to list out your views in a logical sequence. Use our Leadership PowerPoint Templates because They will Put your wonderful verbal artistry on display. Our PowerPoint Templates and Slides will provide you the necessary glam and glitter. Download and present our Targets PowerPoint Templates because They will bring a lot to the table. Their alluring flavours will make your audience salivate. Present our Signs PowerPoint Templates because you can Set pulses racing with our PowerPoint Templates and Slides. They will raise the expectations of your team. Use our Process and Flows PowerPoint Templates because These PowerPoint Templates and Slides will give the updraft to your ideas. See them soar to great heights with ease.Use these PowerPoint slides for presentations relating to team, logo icon, leadership, leader, forward, progress bar, target, circle logo, achievement, business, concept, sign, success, teamwork, symbol, logo design, diagram, circle, graphic, finance, difference, process, goal, marketing, different, development, price, abstract, graph, sectors, illustration, icon, circular, chart, forecast, direction, design, moving, motion, company, competition, progress, profit, increase, background, path, investment, aim, financial, communication. The prominent colors used in the PowerPoint template are Green, Blue, Black. Evaluate options with our Stacked Process Diagram 7 Stages Business Plan Template Word PowerPoint Templates. Discern the best course of action to follow.

Circular Business Graph Globe PowerPoint Templates Ppt Backgrounds For Slides 0113
We present our Circular Business Graph Globe PowerPoint Templates PPT Backgrounds For Slides 0113.Use our Business PowerPoint Templates because Our PowerPoint Templates and Slides are conceived by a dedicated team. Use them and give form to your wondrous ideas. Download and present our Finance PowerPoint Templates because Our PowerPoint Templates and Slides will let you Clearly mark the path for others to follow. Download our Marketing PowerPoint Templates because Your success is our commitment. Our PowerPoint Templates and Slides will ensure you reach your goal. Use our Signs PowerPoint Templates because You can Double your output with our PowerPoint Templates and Slides. They make beating deadlines a piece of cake. Use our Success PowerPoint Templates because Your success is our commitment. Our PowerPoint Templates and Slides will ensure you reach your goal.Use these PowerPoint slides for presentations relating to 3D render of circular progress bars, business, finance, marketing, signs, success. The prominent colors used in the PowerPoint template are Green, Yellow, Brown. Use our Circular Business Graph Globe PowerPoint Templates PPT Backgrounds For Slides 0113 are topically designed to provide an attractive backdrop to any subject. The feedback we get is that our marketing PowerPoint templates and PPT Slides will impress their bosses and teams. Customers tell us our Circular Business Graph Globe PowerPoint Templates PPT Backgrounds For Slides 0113 will make the presenter look like a pro even if they are not computer savvy. Customers tell us our bars PowerPoint templates and PPT Slides will help you be quick off the draw. Just enter your specific text and see your points hit home. Presenters tell us our Circular Business Graph Globe PowerPoint Templates PPT Backgrounds For Slides 0113 have awesome images to get your point across. Presenters tell us our progress PowerPoint templates and PPT Slides are visually appealing. Be the expert you truly are. Use our Circular Business Graph Globe PowerPoint Templates Ppt Backgrounds For Slides 0113 to affirm your erudition.

Teamwork Raising The Bar01 Business PowerPoint Templates And PowerPoint Backgrounds 0811
Microsoft PowerPoint Template and Background with teamwork raising the bar Extend the effect with our Teamwork Raising The Bar01 Business PowerPoint Templates And PowerPoint Backgrounds 0811. Get greater control of your domain.

Teamwork Raising The Bar01 Business PowerPoint Themes And PowerPoint Slides 0811
Microsoft PowerPoint Theme and Slide with teamwork raising the bar Your thoughts and our Teamwork Raising The Bar01 Business PowerPoint Themes And PowerPoint Slides 0811 will get along famously. They will create an acclaimed team.
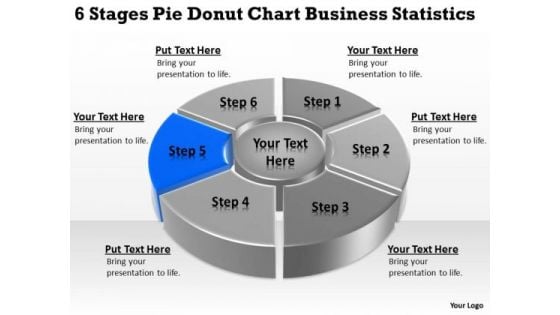
Templates Free Download Statistics Startup Business Plan Outline PowerPoint
We present our templates free download statistics startup business plan outline PowerPoint.Download our Process and Flows PowerPoint Templates because It can be used to Set your controls for the heart of the sun. Our PowerPoint Templates and Slides will be the propellant to get you there. Download our Circle Charts PowerPoint Templates because Our PowerPoint Templates and Slides will steer your racing mind. Hit the right buttons and spur on your audience. Present our Marketing PowerPoint Templates because You can Raise a toast with our PowerPoint Templates and Slides. Spread good cheer amongst your audience. Present our Flow Charts PowerPoint Templates because You can Double your output with our PowerPoint Templates and Slides. They make beating deadlines a piece of cake. Use our Business PowerPoint Templates because You can Rise to the occasion with our PowerPoint Templates and Slides. You will bring your audience on their feet in no time.Use these PowerPoint slides for presentations relating to Infographic, graph, chart, data, icon, diagram, progress, bar, line, download, button, pie, search, time, statistics, percent, segment, cloud, business, concept, sign,loading, symbol, template, circle, graphic, modern, status, visualization, roundabstract, management, mba, manage, illustration, weakness, strategy, project, clipart, guidelines, direction, design, organization, commerce, conceptual,heirarchy, resource, theoretical, action, goals, performance. The prominent colors used in the PowerPoint template are Blue, Gray, White. Display your class with our Templates Free Download Statistics Startup Business Plan Outline PowerPoint. Demonstrate your expertise to your audience.
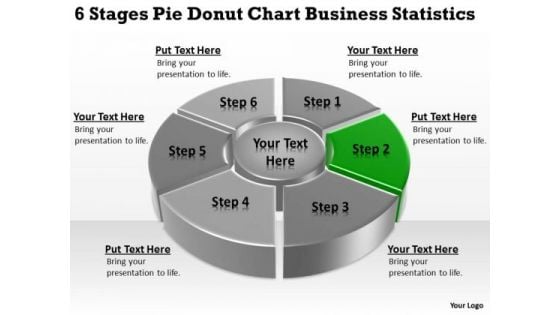
Templates Download Statistics Business Plan For Small PowerPoint Slides
We present our templates download statistics business plan for small PowerPoint Slides.Download our Process and Flows PowerPoint Templates because Our PowerPoint Templates and Slides will give you great value for your money. Be assured of finding the best projection to highlight your words. Present our Circle Charts PowerPoint Templates because You should Press the right buttons with our PowerPoint Templates and Slides. They will take your ideas down the perfect channel. Download our Shapes PowerPoint Templates because It will get your audience in sync. Download our Business PowerPoint Templates because You will get more than you ever bargained for. Download and present our Marketing PowerPoint Templates because Our PowerPoint Templates and Slides are focused like a searchlight beam. They highlight your ideas for your target audience.Use these PowerPoint slides for presentations relating to Infographic, graph, chart, data, icon, diagram, progress, bar, line, download, button, pie, search, time, statistics, percent, segment, cloud, business, concept, sign,loading, symbol, template, circle, graphic, full, element, report, level, black, shape, computer, modern, status, visualization, round, section, web,design, statistics, growth, colorful, info, stats, information, indicator. The prominent colors used in the PowerPoint template are Green, Gray, Black. Get up real close with our Templates Download Statistics Business Plan For Small PowerPoint Slides. Your goals will come within touching distance.
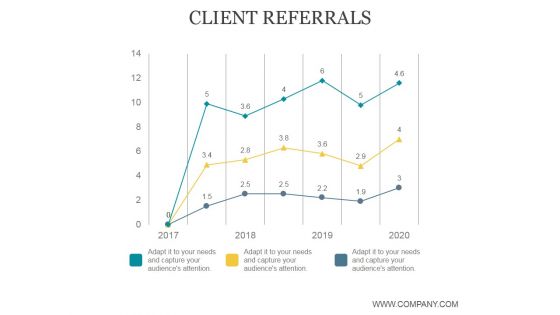
Client Referrals Ppt PowerPoint Presentation Tips
This is a client referrals ppt powerpoint presentation tips. This is a three stage process. The stages in this process are business, marketing, management, bar graph, line bar.
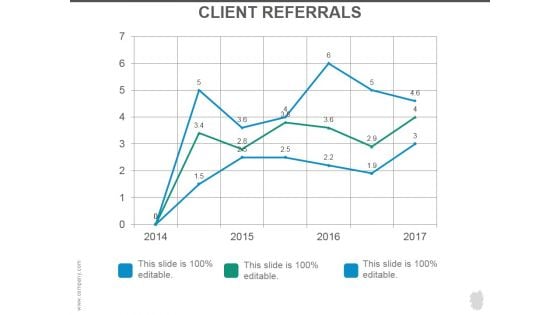
Client Referrals Ppt PowerPoint Presentation Example 2015
This is a client referrals ppt powerpoint presentation example 2015. This is a three stage process. The stages in this process are business, marketing, management, bar graph, line bar.
Financial Graph Economic Growth Vector Icon Ppt PowerPoint Presentation Infographics Graphic Images Cpb
This is a financial graph economic growth vector icon ppt powerpoint presentation infographics graphic images cpb. This is a three stage process. The stages in this process are bar chart icon, bar graph icon, data chart icon.
Histogram Column Chart With Red Arrow Vector Icon Ppt PowerPoint Presentation Outline Ideas Cpb
This is a histogram column chart with red arrow vector icon ppt powerpoint presentation outline ideas cpb. This is a three stage process. The stages in this process are bar chart icon, bar graph icon, data chart icon.
Histogram Financial Analysis Vector Icon Ppt PowerPoint Presentation Layouts File Formats Cpb
This is a histogram financial analysis vector icon ppt powerpoint presentation layouts file formats cpb. This is a three stage process. The stages in this process are bar chart icon, bar graph icon, data chart icon.
Histogram Icon Showing Economic Fluctuations Ppt PowerPoint Presentation Slides Samples Cpb
This is a histogram icon showing economic fluctuations ppt powerpoint presentation slides samples cpb. This is a three stage process. The stages in this process are bar chart icon, bar graph icon, data chart icon.
Histogram Showing Business Trends Vector Icon Ppt PowerPoint Presentation Styles Portrait Cpb
This is a histogram showing business trends vector icon ppt powerpoint presentation styles portrait cpb. This is a three stage process. The stages in this process are bar chart icon, bar graph icon, data chart icon.
Histogram With Dollar For Financial Success Vector Icon Ppt PowerPoint Presentation Portfolio Example File Cpb
This is a histogram with dollar for financial success vector icon ppt powerpoint presentation portfolio example file cpb. This is a three stage process. The stages in this process are bar chart icon, bar graph icon, data chart icon.
Histogram With Gear Vector Icon Ppt PowerPoint Presentation Professional Slides Cpb
This is a histogram with gear vector icon ppt powerpoint presentation professional slides cpb. This is a three stage process. The stages in this process are bar chart icon, bar graph icon, data chart icon.
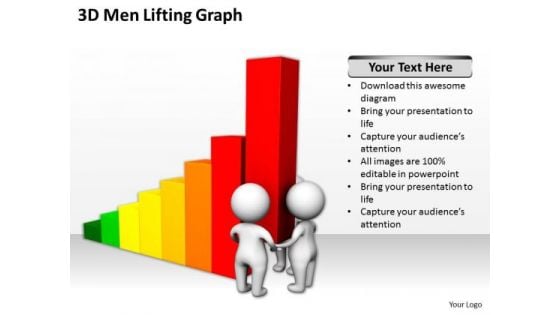
Successful Business Men 3d Lifting Graph PowerPoint Slides
We present our successful business men 3d lifting graph PowerPoint Slides.Download our Business PowerPoint Templates because Our PowerPoint Templates and Slides are aesthetically designed to attract attention. We gaurantee that they will grab all the eyeballs you need. Download and present our People PowerPoint Templates because Our PowerPoint Templates and Slides are created by a hardworking bunch of busybees. Always flitting around with solutions gauranteed to please. Present our Finance PowerPoint Templates because It is Aesthetically crafted by artistic young minds. Our PowerPoint Templates and Slides are designed to display your dexterity. Download our Success PowerPoint Templates because You can Connect the dots. Fan expectations as the whole picture emerges. Download and present our Marketing PowerPoint Templates because You are well armed with penetrative ideas. Our PowerPoint Templates and Slides will provide the gunpowder you need.Use these PowerPoint slides for presentations relating to 3d, abstract, accounting, achievement, advantage, bar, bar graph, bar-chart, bar-graph, business, cartoon, chart, company, concept, corporate, financial, graph, growth, help, icon, idiom, lifting, lifting the bar, market, meeting, men, metaphor, partnership, people, performance, presentation, progress, report, strength, team, teamwork. The prominent colors used in the PowerPoint template are Red, Yellow, Green. Position yourself with our Successful Business Men 3d Lifting Graph PowerPoint Slides. Download without worries with our money back guaranteee.
Consulting Slides Graph With Abc Steps And Icons Business Presentation
This diagram displays bar graph with ABC steps and business icons. This diagram may be used in your presentations to depict any information and data which requires visual presentation. Use this diagram, in your presentations to express view on growth, progress and success. Create eye-catching presentations using this diagram.
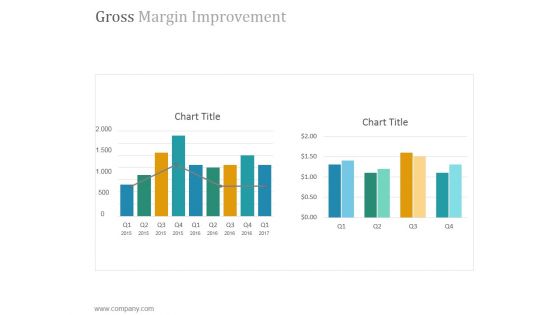
Gross Margin Improvement Ppt PowerPoint Presentation Layout
This is a gross margin improvement ppt powerpoint presentation layout. This is a two stage process. The stages in this process are chart, bar graph, success, growth, marketing.
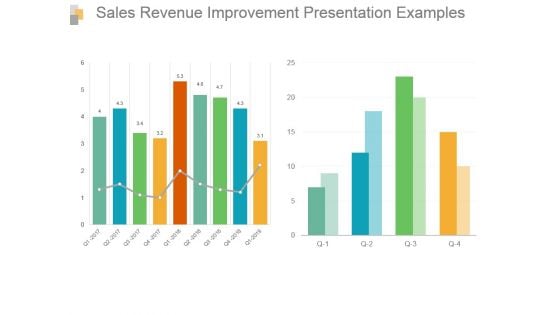
Sales Revenue Improvement Presentation Examples
This is a sales revenue improvement presentation examples. This is a two stage process. The stages in this process are bar graph, growth, sales, data, analysis.
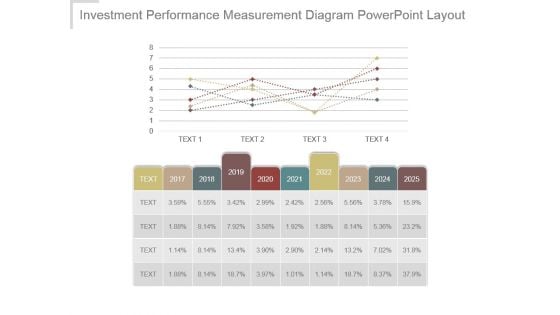
Investment Performance Measurement Diagram Powerpoint Layout
This is a investment performance measurement diagram powerpoint layout. This is a five stage process. The stages in this process are bar graph, growth, success, business, marketing.
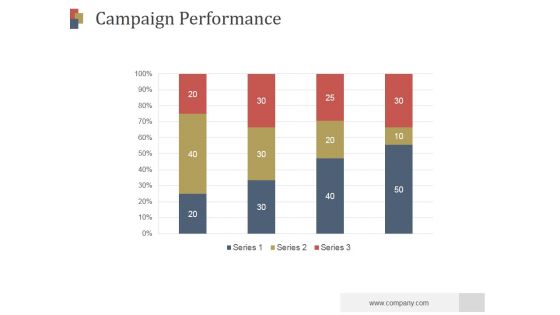
Campaign Performance Ppt PowerPoint Presentation Deck
This is a campaign performance ppt powerpoint presentation deck. This is a four stage process. The stages in this process are business, bar graph, strategy, growth, success.
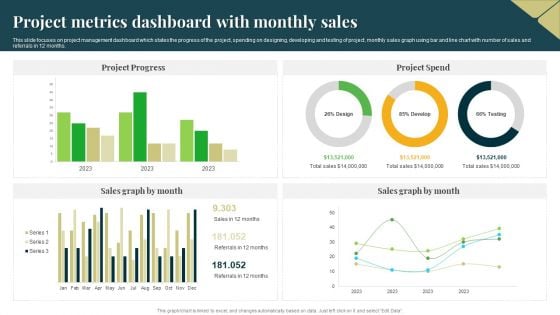
Project Metrics Dashboard With Monthly Sales Professional PDF
This slide focuses on project management dashboard which states the progress of the project, spending on designing, developing and testing of project, monthly sales graph using bar and line chart with number of sales and referrals in 12 months. Pitch your topic with ease and precision using this Project Metrics Dashboard With Monthly Sales Professional PDF. This layout presents information on Project Progress, Project Spend, Sales Graph. It is also available for immediate download and adjustment. So, changes can be made in the color, design, graphics or any other component to create a unique layout.
Growth Team Ppt PowerPoint Presentation Icon Topics
This is a growth team ppt powerpoint presentation icon topics. This is a five stage process. The stages in this process are bar graph, growth, success, business, marketing.
Stacked Column Ppt PowerPoint Presentation Icon Samples
This is a stacked column ppt powerpoint presentation icon samples. This is a nine stage process. The stages in this process are bar graph, business, marketing, success, growth.

Clustered Column Ppt PowerPoint Presentation Information
This is a clustered column ppt powerpoint presentation information. This is a twelve stage process. The stages in this process are bar graph, business, marketing, growth, success.
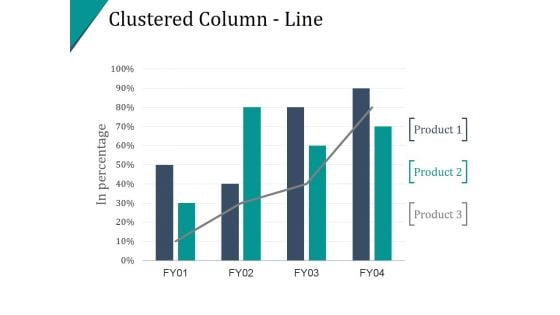
Clustered Column Line Ppt PowerPoint Presentation Samples
This is a clustered column line ppt powerpoint presentation samples. This is a four stage process. The stages in this process are finance, percentage, success, growth, bar graph.
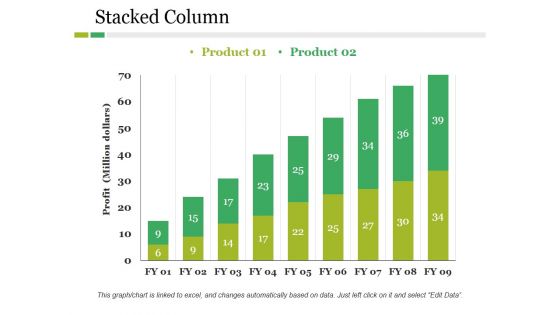
Stacked Column Ppt PowerPoint Presentation Pictures Outfit
This is a stacked column ppt powerpoint presentation pictures outfit. This is a two stage process. The stages in this process are product, profit, growth, bar graph, success.
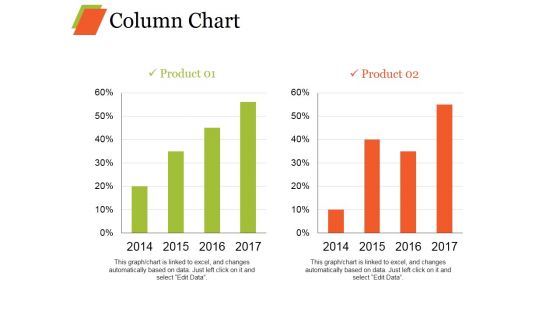
Column Chart Ppt PowerPoint Presentation Infographics Model
This is a column chart ppt powerpoint presentation infographics model. This is a two stage process. The stages in this process are bar graph, growth, product, percentage, year.
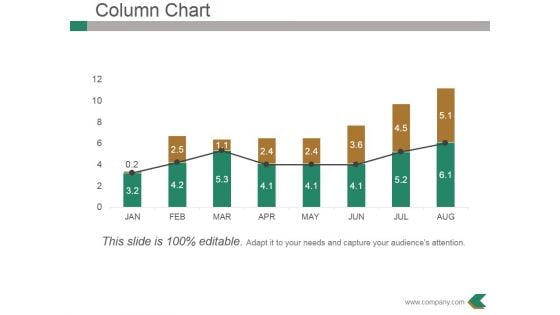
Column Chart Ppt PowerPoint Presentation Professional Example
This is a column chart ppt powerpoint presentation professional example. This is a eight stage process. The stages in this process are bar graph, growth, success, business, marketing.
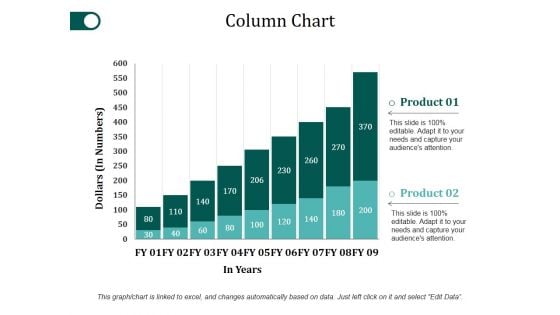
Column Chart Ppt PowerPoint Presentation Portfolio Clipart
This is a column chart ppt powerpoint presentation portfolio clipart. This is a two stage process. The stages in this process are bar graph, growth, success, product, dollars.
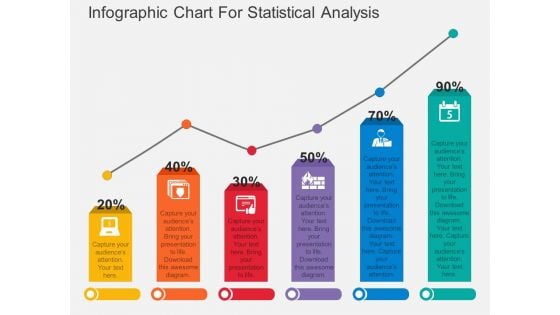
Infographic Chart For Statistical Analysis Powerpoint Template
Download this exclusive business diagram to display statistical analysis. This PowerPoint template contains bar chart with percentage values. This diagram is useful for business presentations.
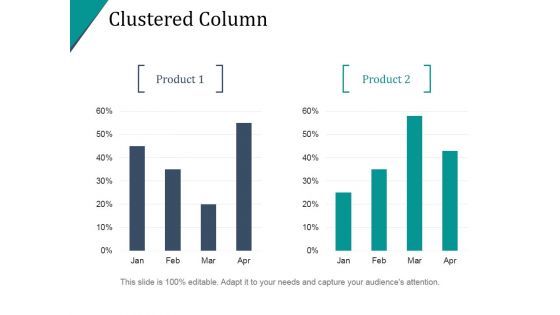
Clustered Column Ppt PowerPoint Presentation Infographic Template
This is a clustered column ppt powerpoint presentation infographic template. This is a two stage process. The stages in this process are finance, percentage, bar graph, business, marketing.
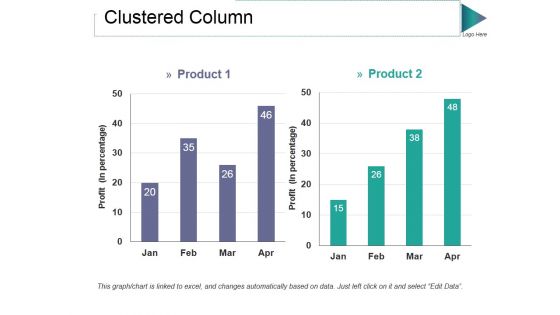
Clustered Column Ppt PowerPoint Presentation Professional Styles
This is a clustered column ppt powerpoint presentation professional styles. This is a two stage process. The stages in this process are product, profit, bar graph, growth, success.
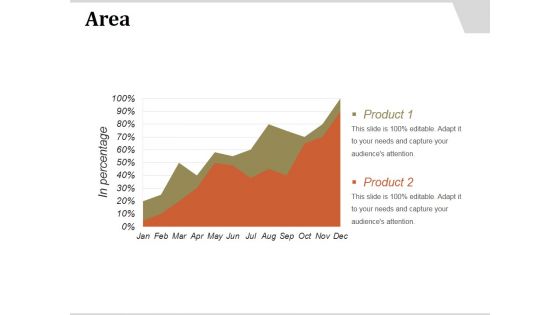
Area Ppt PowerPoint Presentation Show
This is a area ppt powerpoint presentation show. This is a two stage process. The stages in this process are area, bar graph, growth, years, business.

Increase Profits Business PowerPoint Template 0610
Increase burning gold graph bar on white background Develop a fearless attitude with our Increase Profits Business PowerPoint Template 0610. They assist in breaking through.

Success01 Business PowerPoint Template 0910
Confident businessman climbing a bar chart. Digital illustration Make education entertaining with our Success01 Business PowerPoint Template 0910. Add color to even the dullest activity.

Pareto Chart Ppt PowerPoint Presentation Ideas
This is a pareto chart ppt powerpoint presentation ideas. This is a four stage process. The stages in this process are bar graph, finance, marketing, strategy, analysis, business.

Success Graph Business PowerPoint Template 0910
Success in gold against a green bar graph Jump over obstacles with our Success Graph Business PowerPoint Template 0910. Make sure your presentation gets the attention it deserves.
Increasing Costs Of Education PowerPoint Icon C
Cost of Education Increasing in 3d With Bar Graph Realise fantasies with our Increasing Costs Of Education PowerPoint Icon C. Actualise your dreams with their help.
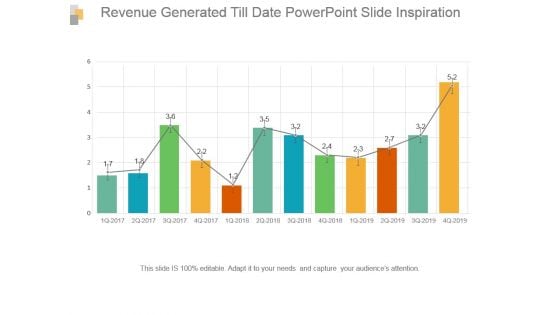
Revenue Generated Till Date Powerpoint Slide Inspiration
This is a revenue generated till date powerpoint slide inspiration. This is a twelve stage process. The stages in this process are bar graph, growth, success, data, analysis.
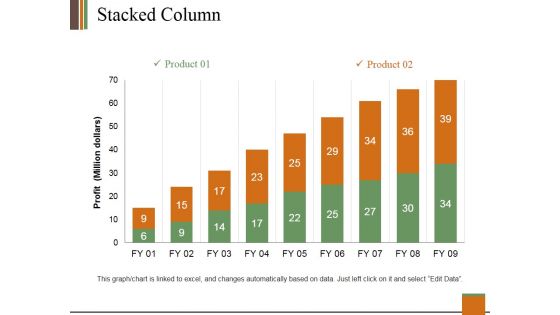
Stacked Column Ppt PowerPoint Presentation Outline Information
This is a stacked column ppt powerpoint presentation outline information. This is a two stage process. The stages in this process are profit, product, bar graph, growth, success.
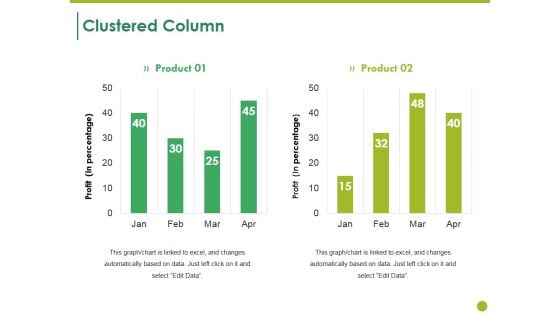
Clustered Column Ppt PowerPoint Presentation Layouts Ideas
This is a clustered column ppt powerpoint presentation layouts ideas. This is a two stage process. The stages in this process are product, profit, bar graph, growth, finance.

Column Chart Ppt PowerPoint Presentation Show Images
This is a column chart ppt powerpoint presentation show images. This is a two stage process. The stages in this process are product, expenditure, years, bar graph, growth.
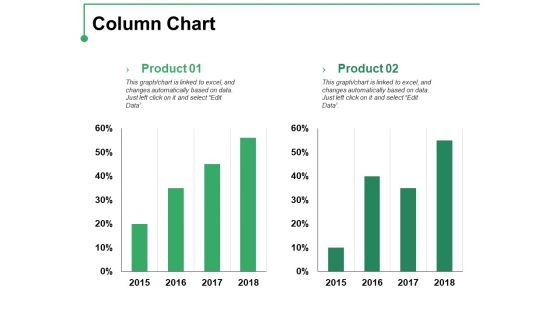
Column Chart Ppt PowerPoint Presentation Professional Template
This is a column chart ppt powerpoint presentation professional template. This is a two stage process. The stages in this process are product, percentage, finance, bar graph, growth.
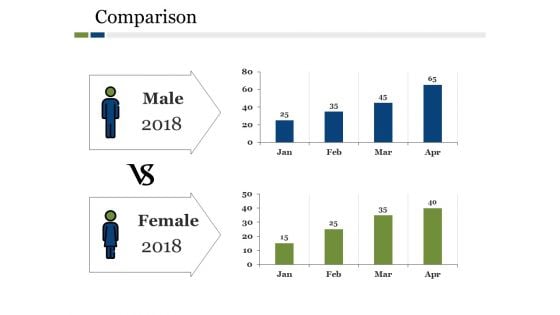
Comparison Ppt PowerPoint Presentation Ideas Show
This is a comparison ppt powerpoint presentation ideas show. This is a two stage process. The stages in this process are comparison, bar graph, growth, management, business.
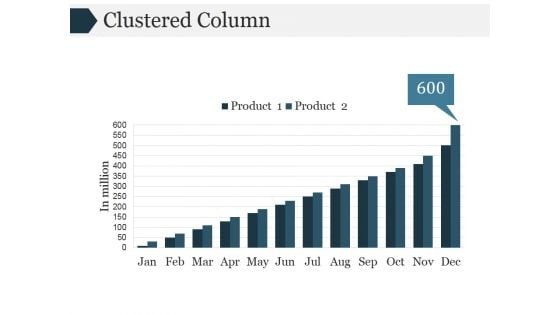
Clustered Column Ppt PowerPoint Presentation Slide Download
This is a clustered column ppt powerpoint presentation slide download. This is a twelve stage process. The stages in this process are bar graph, marketing, strategy, analysis, business.
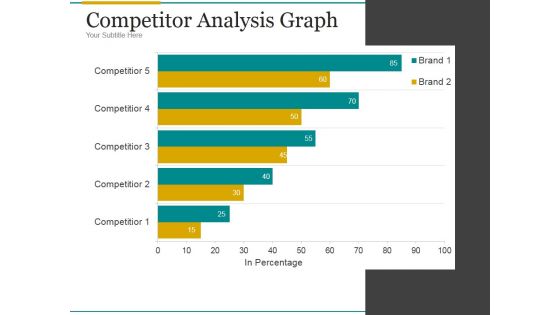
Competitor Analysis Graph Ppt PowerPoint Presentation Outline
This is a competitor analysis graph ppt powerpoint presentation outline. This is a five stage process. The stages in this process are bar graph, marketing, strategy, analysis, business.
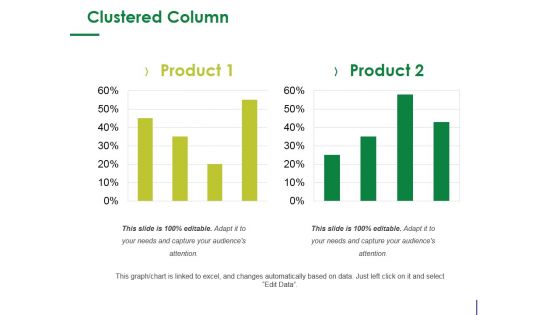
Clustered Column Ppt PowerPoint Presentation Ideas Show
This is a clustered column ppt powerpoint presentation ideas show. This is a two stage process. The stages in this process are product, percentage, finance, business, bar graph.
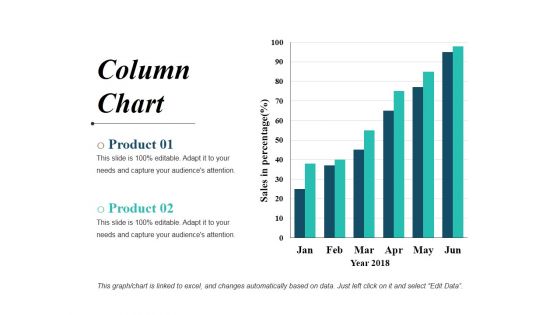
Column Chart Ppt PowerPoint Presentation Professional Layouts
This is a column chart ppt powerpoint presentation professional layouts. This is a six stage process. The stages in this process are bar graph, business, marketing, finance, planning.
Area Chart Ppt PowerPoint Presentation Icon Gallery
This is a area chart ppt powerpoint presentation icon gallery. This is a two stage process. The stages in this process are sales in percentage, product, bar graph.

Combo Chart Ppt PowerPoint Presentation Infographics Ideas
This is a combo chart ppt powerpoint presentation infographics ideas. This is a four stage process. The stages in this process are bar graph, marketing, strategy, finance, analysis.
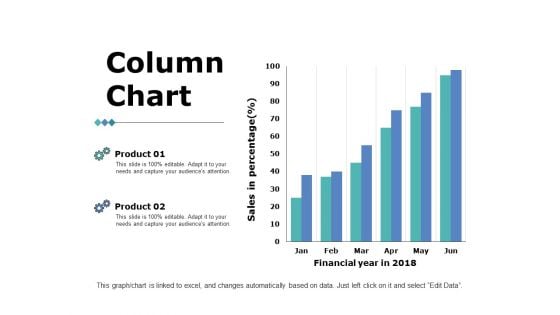
Column Chart Ppt PowerPoint Presentation Summary
This is a column chart ppt powerpoint presentation summary. This is a two stage process. The stages in this process are bar graph, marketing, strategy, finance, planning.
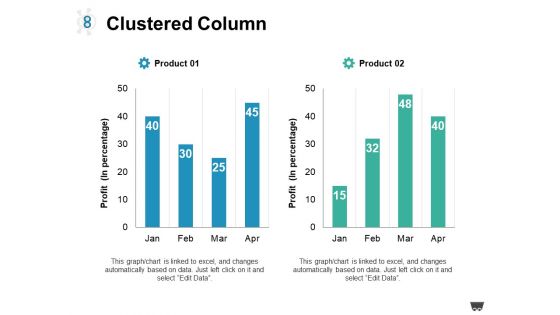
Clustered Column Ppt PowerPoint Presentation Show Introduction
This is a clustered column ppt powerpoint presentation show introduction. This is a two stage process. The stages in this process are product, profit, bar graph.
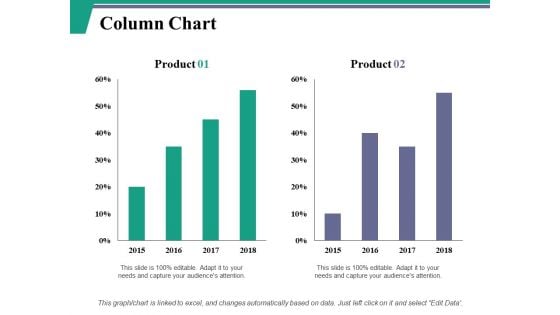
Column Chart Ppt PowerPoint Presentation Model Layout Ideas
This is a column chart ppt powerpoint presentation model layout ideas. This is a two stage process. The stages in this process are product, column chart, bar graph.
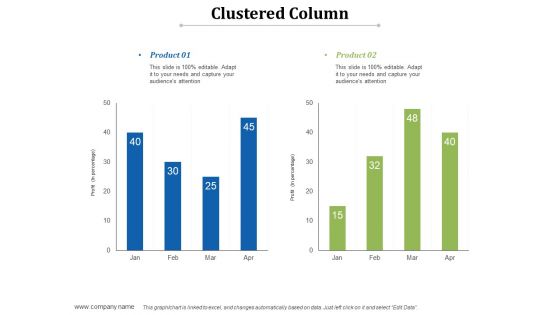
Clustered Column Ppt PowerPoint Presentation Styles Templates
This is a clustered column ppt powerpoint presentation styles templates. This is a two stage process. The stages in this process are product, profit, bar graph.
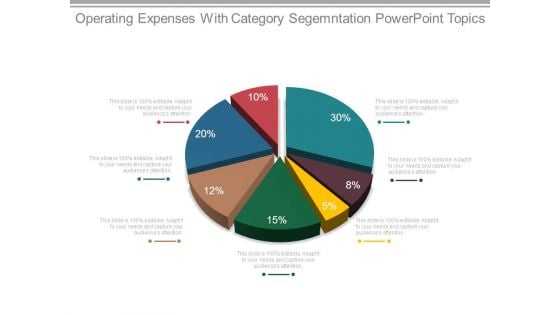
Operating Expenses With Category Segmentation Powerpoint Topics
This is a operating expenses with category segmentation powerpoint topics. This is a seven stage process. The stages in this process are bar chart, growth, business, success, management.
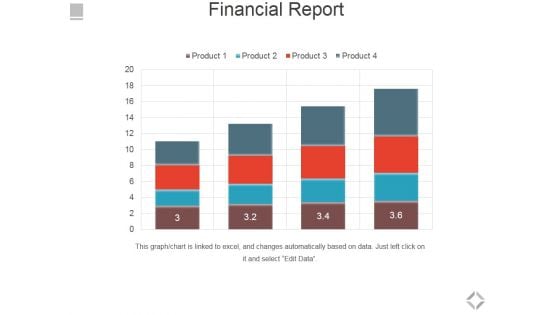
Financial Report Ppt PowerPoint Presentation Styles Skills
This is a financial report ppt powerpoint presentation styles skills. This is a four stage process. The stages in this process are bar graph, business, marketing, success, growth.
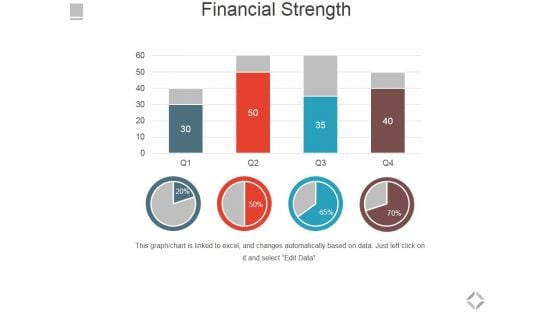
Financial Strength Ppt PowerPoint Presentation Summary Ideas
This is a financial strength ppt powerpoint presentation summary ideas. This is a four stage process. The stages in this process are bar graph, business, marketing, success, growth.
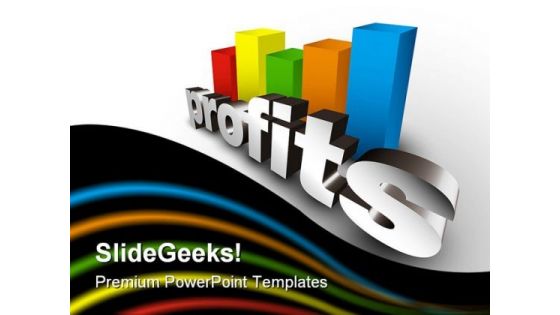
Profits Business PowerPoint Template 0910
profits word and columns bar 3d illustration Deal a decisive blow with our Profits Business PowerPoint Template 0910. Get clearlyahead in a critical event.


 Continue with Email

 Home
Home


