Progress Dashboard
Sales Analysis Dashboard Ppt PowerPoint Presentation Guidelines
This is a sales analysis dashboard ppt powerpoint presentation guidelines. This is a three stage process. The stages in this process are analysis, dashboard, business, marketing, strategy, success.
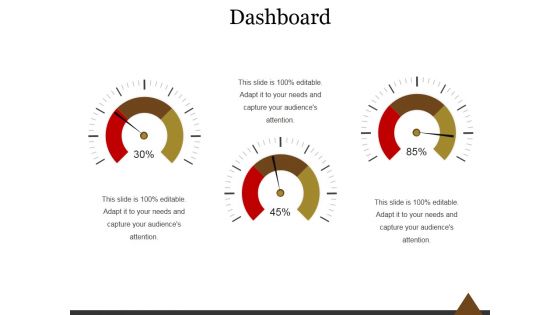
Dashboard Ppt PowerPoint Presentation Visual Aids
This is a dashboard ppt powerpoint presentation visual aids. This is a three stage process. The stages in this process are dashboard, business, marketing, process, success.
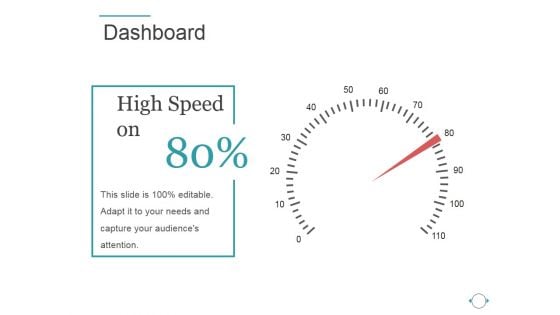
Dashboard Ppt PowerPoint Presentation File Tips
This is a dashboard ppt powerpoint presentation file tips. This is a one stage process. The stages in this process are high speed on, process, success, business, marketing.
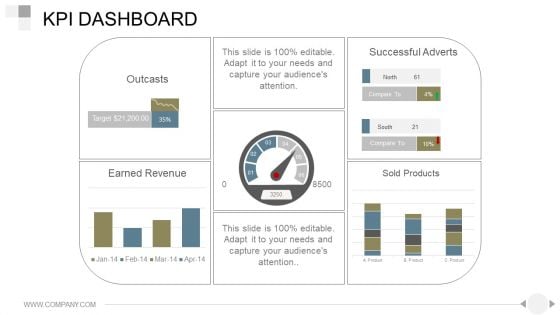
Kpi Dashboard Ppt PowerPoint Presentation Good
This is a kpi dashboard ppt powerpoint presentation good. This is a one stage process. The stages in this process are outcasts, earned revenue, successful adverts, sold products.
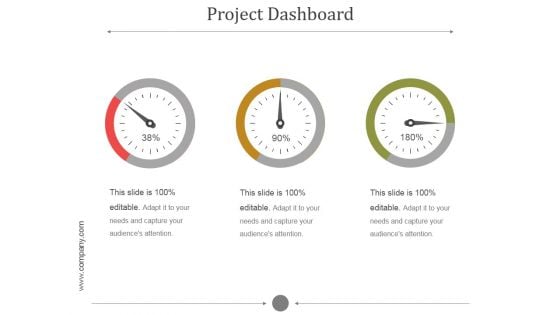
Project Dashboard Ppt PowerPoint Presentation Clipart
This is a project dashboard ppt powerpoint presentation clipart. This is a three stage process. The stages in this process are speed, meter, measure, needle, calculate.
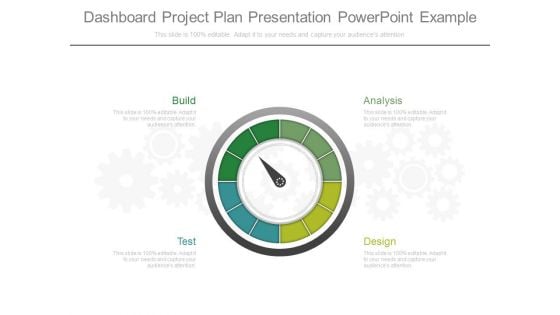
Dashboard Project Plan Presentation Powerpoint Example
This is a dashboard project plan presentation powerpoint example. This is a four stage process. The stages in this process are build, test, design, analysis.
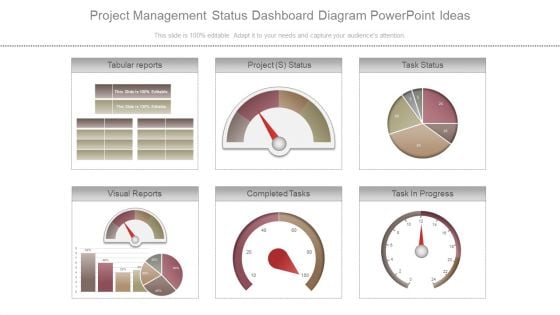
Project Management Status Dashboard Diagram Powerpoint Ideas
This is a project management status dashboard diagram powerpoint ideas. This is a six stage process. The stages in this process are tabular reports, project s status, task status, visual reports, completed tasks, task in progress.
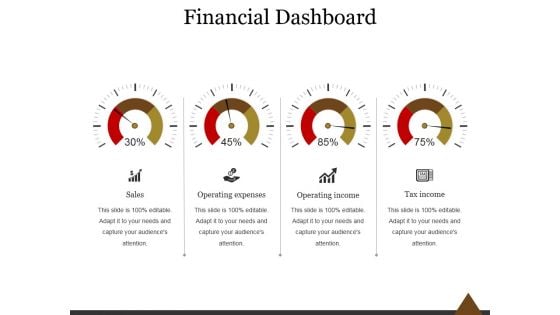
Financial Dashboard Ppt PowerPoint Presentation Information
This is a financial dashboard ppt powerpoint presentation information. This is a four stage process. The stages in this process are sales, operating expenses, operating income, tax income.
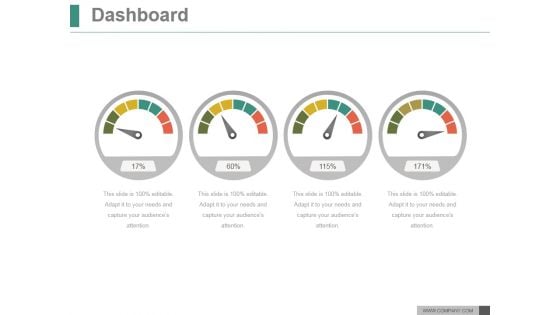
Dashboard Ppt PowerPoint Presentation Example 2015
This is a dashboard ppt powerpoint presentation example 2015. This is a four stage process. The stages in this process are business, marketing, management, analysis, dashboard.
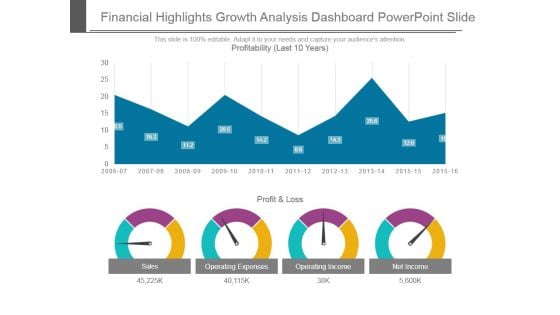
Financial Highlights Growth Analysis Dashboard Powerpoint Slide
This is a financial highlights growth analysis dashboard powerpoint slide. This is a four stage process. The stages in this process are profit and loss, sales, operating expenses, operating income, net income, profitability.
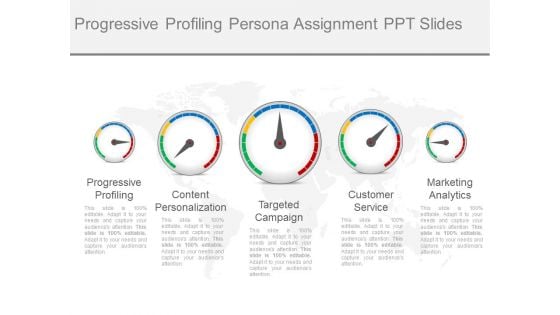
Progressive Profiling Persona Assignment Ppt Slides
This is a progressive profiling persona assignment ppt slides. This is a five stage process. The stages in this process are progressive profiling, content personalization, targeted campaign, customer service, marketing analytics.
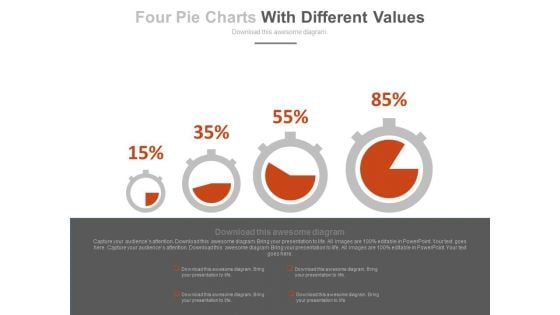
Dashboard With Increasing Values Powerpoint Slides
This innovative, stunningly beautiful dashboard has been designed for data visualization. It contains pie charts with increasing percentage values. This PowerPoint template helps to display your information in a useful, simple and uncluttered way.

Revenue Kpi Dashboard Ppt Infographic Template
This is a revenue kpi dashboard ppt infographic template. This is a five stage process. The stages in this process are outcasts, successful adverts, earned revenue, sold products, operations.
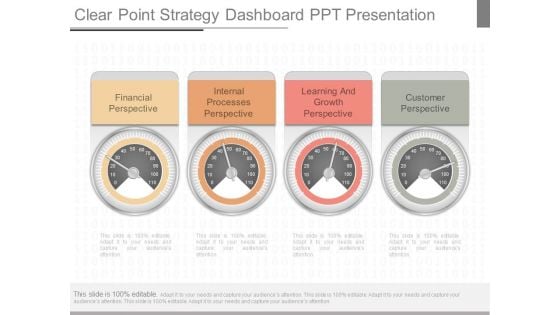
Clear Point Strategy Dashboard Ppt Presentation
This is a clear point strategy dashboard ppt presentation. This is a four stage process. The stages in this process are financial perspective, internal processes perspective, learning and growth perspective, customer perspective.
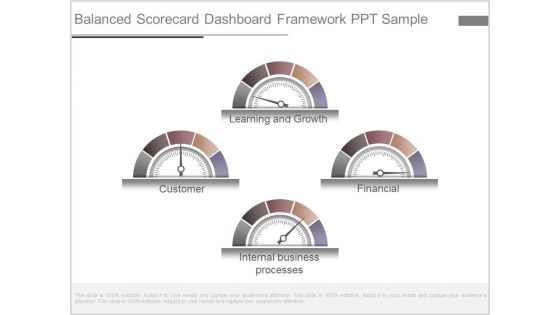
Balanced Scorecard Dashboard Framework Ppt Sample
This is a balanced scorecard dashboard framework ppt sample. This is a four stage process. The stages in this process are learning and growth, financial, internal business processes, customer.
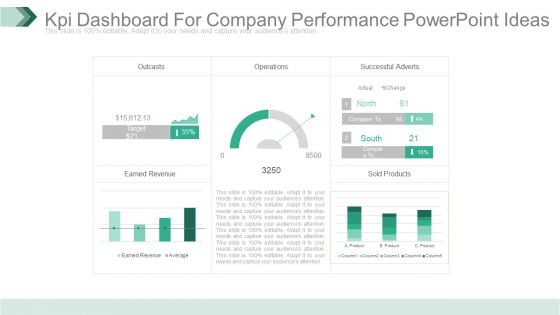
Kpi Dashboard For Company Performance Powerpoint Ideas
This is a kpi dashboard for company performance powerpoint ideas. This is a five stage process. The stages in this process are outcasts, operations, successful adverts, earned revenue, sold products.
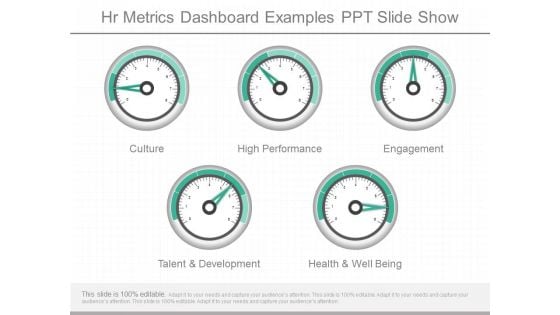
Hr Metrics Dashboard Examples Ppt Slide Show
This is a hr metrics dashboard examples ppt slide show. This is a five stage process. The stages in this process are culture, high performance, engagement, talent and development, health and well being.
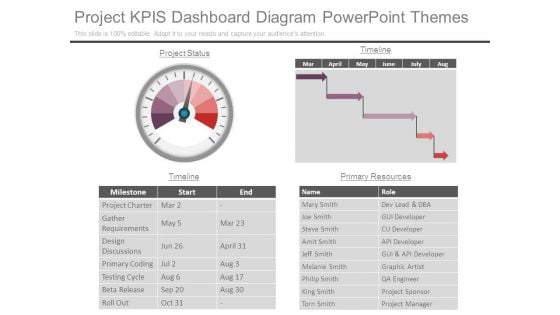
Project Kpis Dashboard Diagram Powerpoint Themes
This is a project kpis dashboard diagram powerpoint themes. This is a one stage process. The stages in this process are project status, timeline, name, role, milestone, start, end, primary resources, project charter, gather requirements, design discussions, primary coding, testing cycle, beta release, roll out, mary smith, joe smith, steve smith, amit smith, jeff smith, melanie smith, philip smith, king smith, torn smith, dev lead and dba, gui developer, cu developer, api developer, gui and api developer, graphic artist, qa engineer, project sponsor, project manager.
Project Tracking Dashboard Template Ppt Sample
This is a project tracking dashboard template ppt sample. This is a five stage process. The stages in this process are requirements, analytics, needs, performance, analysis.
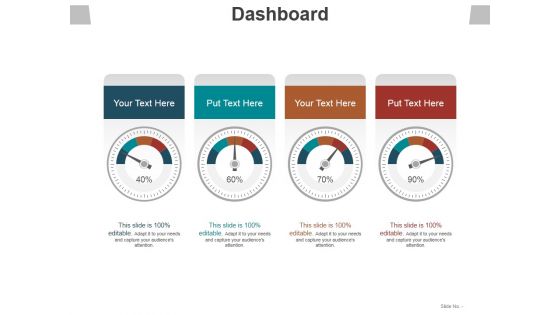
Dashboard Ppt PowerPoint Presentation Pictures Graphic Images
This is a dashboard ppt powerpoint presentation pictures graphic images. This is a four stage process. The stages in this process are dashboard, communication, technology, business, marketing.
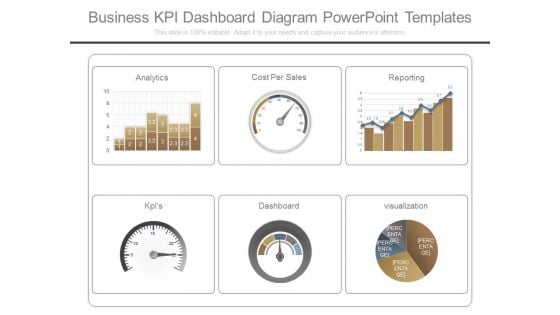
Business Kpi Dashboard Diagram Powerpoint Templates
This is a business kpi dashboard diagram powerpoint templates. This is a six stage process. The stages in this process are analytics, cost per sales, reporting, kpis, dashboard, visualization.
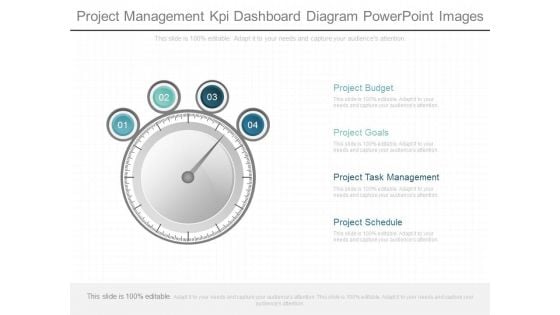
Project Management Kpi Dashboard Diagram Powerpoint Images
This is a project management kpi dashboard diagram powerpoint images. This is a four stage process. The stages in this process are project budget, project goals, project task management, project schedule.
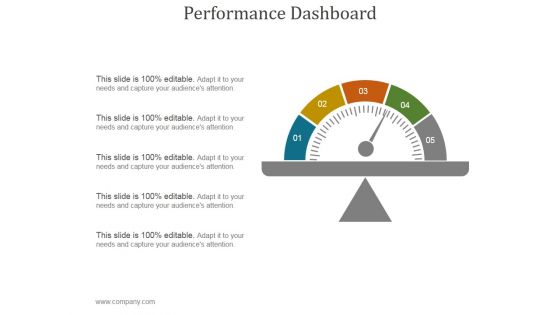
Performance Dashboard Ppt PowerPoint Presentation Background Designs
This is a performance dashboard ppt powerpoint presentation background designs. This is a one stage process. The stages in this process are performance, management, marketing, strategy, business.
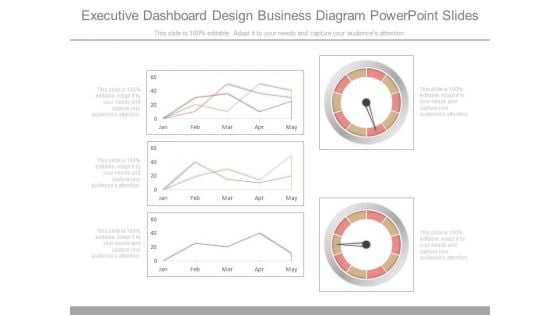
Executive Dashboard Design Business Diagram Powerpoint Slides
This is a executive dashboard design business diagram powerpoint slides. This is a three stage process. The stages in this process are jan, feb, mar, apr, may.
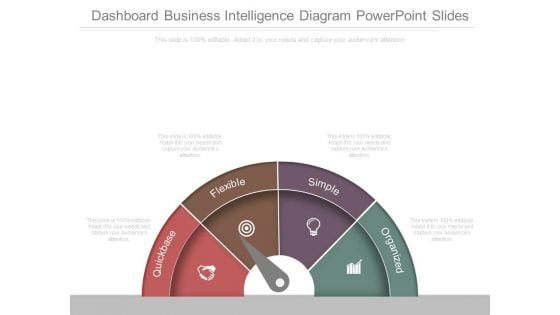
Dashboard Business Intelligence Diagram Powerpoint Slides
This is a dashboard business intelligence diagram powerpoint slides. This is a four stage process. The stages in this process are quickbase, flexible, simple, organized.
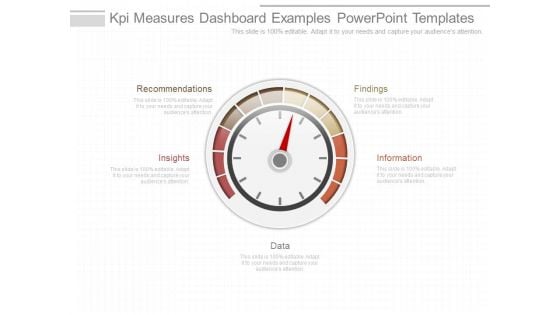
Kpi Measures Dashboard Examples Powerpoint Templates
This is a kpi measures dashboard examples powerpoint templates. This is a four stage process. The stages in this process are recommendations, insights, data, information, findings.
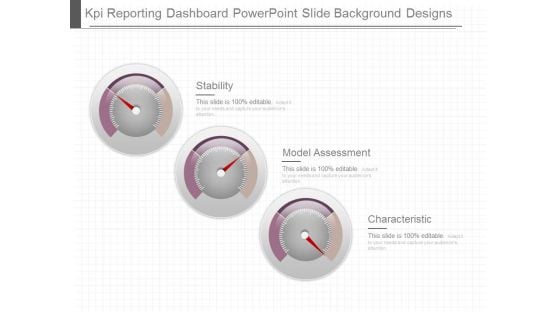
Kpi Reporting Dashboard Powerpoint Slide Background Designs
This is a kpi reporting dashboard powerpoint slide background designs. This is a three stage process. The stages in this process are stability, model assessment, characteristic.
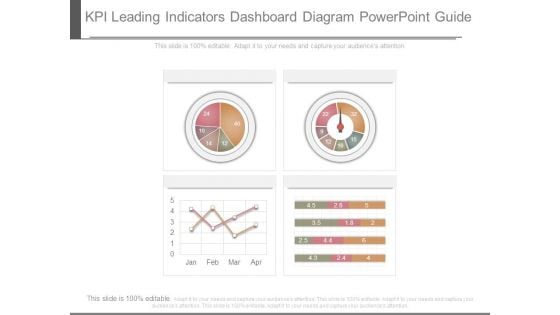
Kpi Leading Indicators Dashboard Diagram Powerpoint Guide
This is a kpi leading indicators dashboard diagram powerpoint guide. This is a four stage process. The stages in this process are business, success, process.
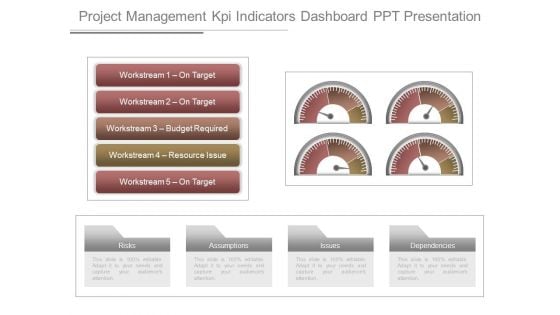
Project Management Kpi Indicators Dashboard Ppt Presentation
This is a project management kpi indicators dashboard ppt presentation. This is a three stage process. The stages in this process are workstream 1 on target, workstream 2 on target, workstream 3 budget required, workstream 4 resource issue, workstream 5 on target.
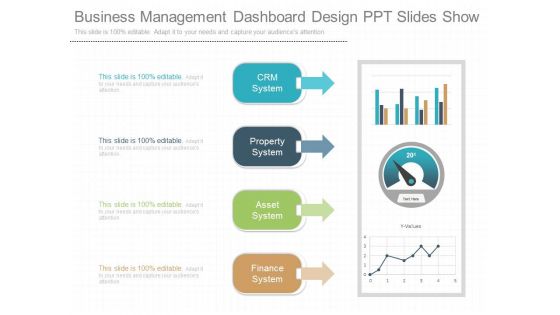
Business Management Dashboard Design Ppt Slides Show
This is a business management dashboard design ppt slides show. This is a four stage process. The stages in this process are crm system, property system, asset system, finance system.

Hr Dashboard Solutions Diagram Powerpoint Slides
This is a hr dashboard solutions diagram powerpoint slides. This is a two stage process. The stages in this process are time to recruit by month, recruitment cost by month, sick, holiday, suspended, injured.
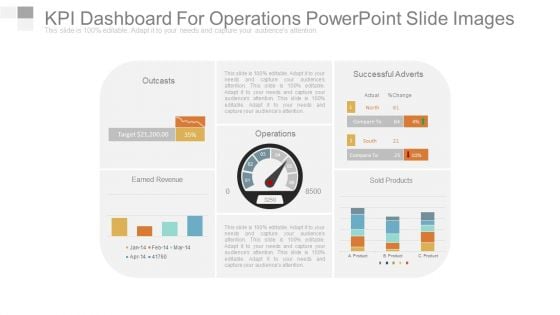
Kpi Dashboard For Operations Powerpoint Slide Images
This is a kpi dashboard for operations powerpoint slide images. This is a four stage process. The stages in this process are outcasts, earned revenue, operations, successful adverts, sold products.
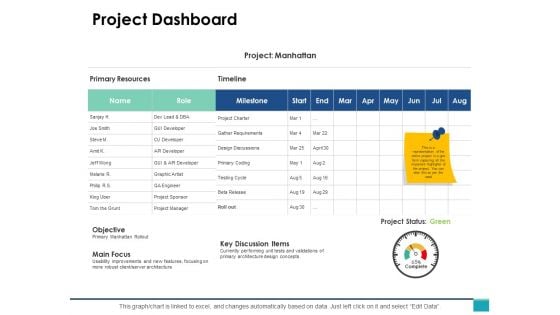
Project Dashboard Ppt PowerPoint Presentation Show Samples
This is a project dashboard ppt powerpoint presentation show samples. The topics discussed in this diagram are business, management, marketing, dashboard. This is a completely editable PowerPoint presentation, and is available for immediate download.
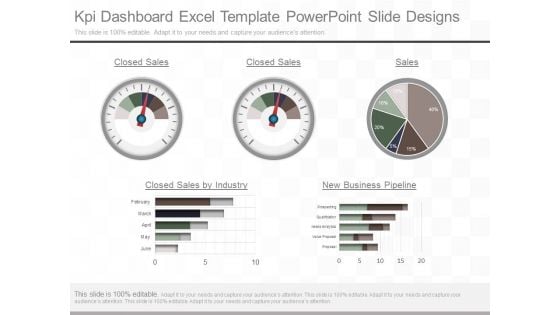
Kpi Dashboard Excel Template Powerpoint Slide Designs
This is a kpi dashboard excel template powerpoint slide designs. This is a five stage process. The stages in this process are closed sales, closed sales, sales, closed sales by industry, new business pipeline, february, march april, may, june, prospecting, qualification, needs analytics, value proposal, proposal.
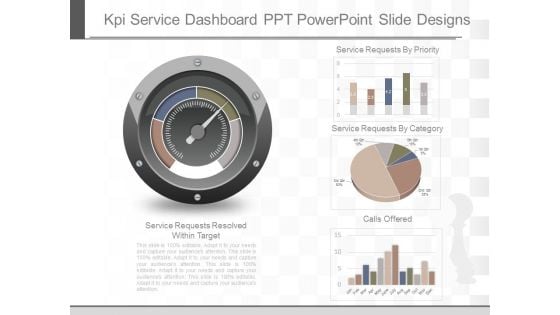
Kpi Service Dashboard Ppt Powerpoint Slide Designs
This is a kpi service dashboard ppt powerpoint slide designs. This is a four stage process. The stages in this process are service requests resolved within target, service requests by priority, service requests by category, calls offered, jan, feb, mar, apr, may, june, july, aug, sep, oct, nov, dec.
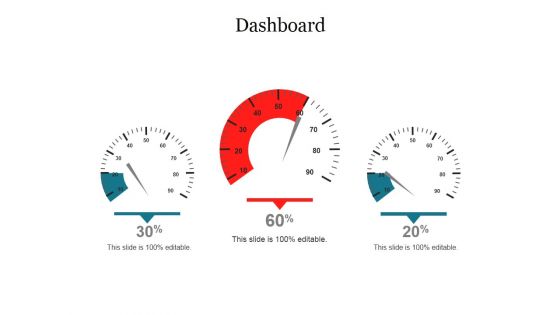
Dashboard Ppt PowerPoint Presentation Show Themes
This is a dashboard ppt powerpoint presentation show themes. This is a three stage process. The stages in this process are dashboard, management, planning, marketing, business, strategy.
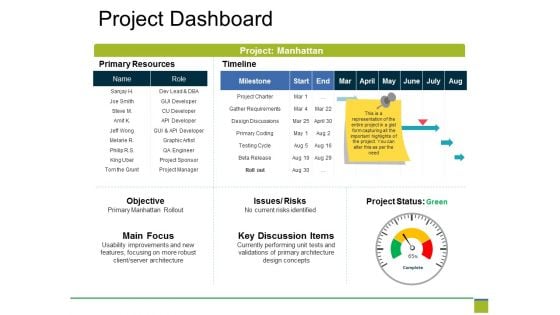
Project Dashboard Ppt PowerPoint Presentation Professional Show
This is a project dashboard ppt powerpoint presentation professional show. This is a six stage process. The stages in this process are primary resources, timeline, objective, main focus, key discussion items.
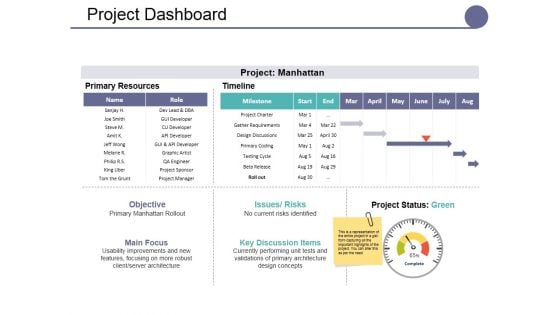
Project Dashboard Ppt PowerPoint Presentation Model Layouts
This is a project dashboard ppt powerpoint presentation model layouts. This is a five stage process. The stages in this process are key discussion items, project status, issues, objective, main focus.
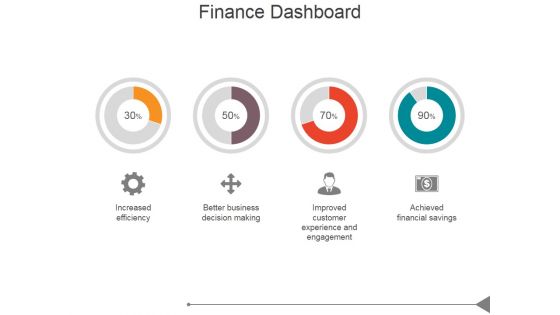
Finance Dashboard Ppt PowerPoint Presentation Diagrams
This is a finance dashboard ppt powerpoint presentation diagrams. This is a four stage process. The stages in this process are increased efficiency, better business decision making, improved customer experience and engagement, achieved financial savings.
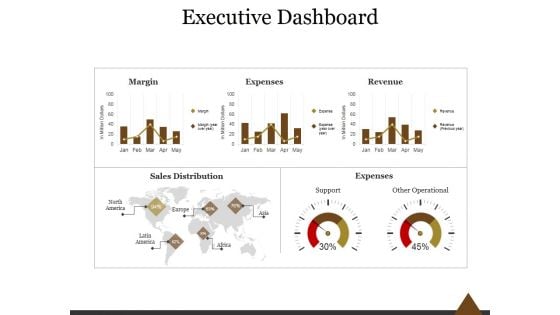
Executive Dashboard Ppt PowerPoint Presentation Professional
This is a executive dashboard ppt powerpoint presentation professional. This is a five stage process. The stages in this process are margin, expenses, revenue, sales distribution, expenses, support, other operational.
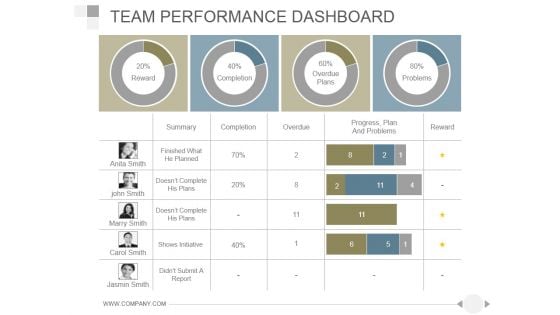
Team Performance Dashboard Ppt PowerPoint Presentation Rules
This is a team performance dashboard ppt powerpoint presentation rules. This is a four stage process. The stages in this process are summary, completion, overdue, progress, plan and problems, reward.
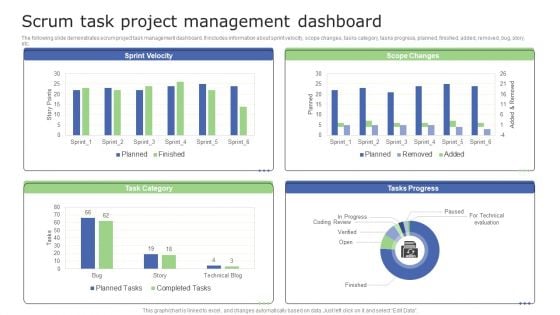
Scrum Task Project Management Dashboard Information PDF
The following slide demonstrates scrum project task management dashboard. It includes information about sprint velocity, scope changes, tasks category, tasks progress, planned, finished, added, removed, bug, story, etc. Pitch your topic with ease and precision using this Scrum Task Project Management Dashboard Information PDF. This layout presents information on Scrum Task Project, Management Dashboard. It is also available for immediate download and adjustment. So, changes can be made in the color, design, graphics or any other component to create a unique layout.
Project Error Tracking KPI Dashboard Themes PDF
This slide illustrates the dashboard for the project issue tracking and management. It includes the column chart for issues assignee, incomplete issues by priority and project, monthly percentage increase in issues created and closed, etc. Pitch your topic with ease and precision using this Project Error Tracking KPI Dashboard Themes PDF. This layout presents information on Issues Assignee, Issue Status, Incomplete Issues. It is also available for immediate download and adjustment. So, changes can be made in the color, design, graphics or any other component to create a unique layout.
Regional Sales Growth Dashboard Icon Slides Pdf
Pitch your topic with ease and precision using this Regional Sales Growth Dashboard Icon Slides Pdf. This layout presents information on Regional Sales, Growth Dashboard. It is also available for immediate download and adjustment. So, changes can be made in the color, design, graphics or any other component to create a unique layout. Our Regional Sales Growth Dashboard Icon Slides Pdf are topically designed to provide an attractive backdrop to any subject. Use them to look like a presentation pro.
Consumer Demographics Segmentation Dashboard Icon Clipart Pdf
Pitch your topic with ease and precision using this Consumer Demographics Segmentation Dashboard Icon Clipart Pdf. This layout presents information on Consumer Demographics, Segmentation, Dashboard Icon. It is also available for immediate download and adjustment. So, changes can be made in the color, design, graphics or any other component to create a unique layout. Our Consumer Demographics Segmentation Dashboard Icon Clipart Pdf are topically designed to provide an attractive backdrop to any subject. Use them to look like a presentation pro.
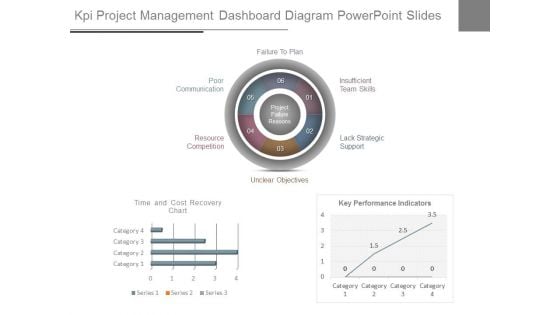
Kpi Project Management Dashboard Diagram Powerpoint Slides
This is a kpi project management dashboard diagram powerpoint slides. This is a three stage process. The stages in this process are unclear objectives, resource competition, poor communication, failure to plan, insufficient team skills, lack strategic support.
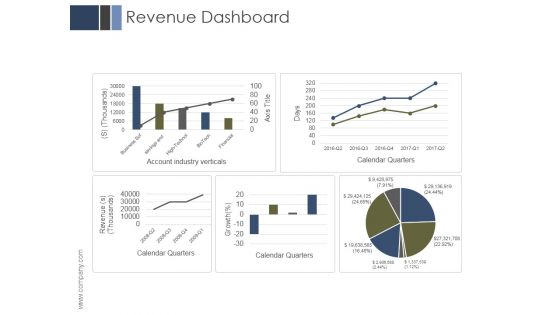
Revenue Dashboard Ppt PowerPoint Presentation Files
This is a revenue dashboard ppt powerpoint presentation files. This is a five stage process. The stages in this process are business, marketing, management, revenue, dashboard.
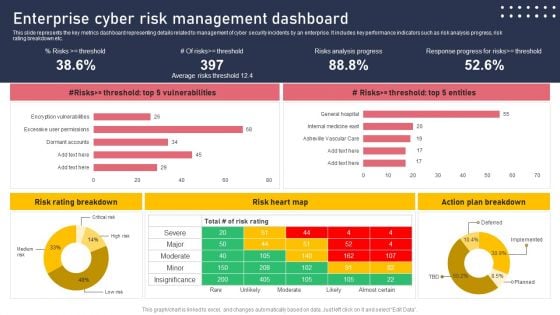
Enterprise Cyber Risk Management Dashboard Sample PDF
This slide represents the key metrics dashboard representing details related to management of cyber security incidents by an enterprise. It includes key performance indicators such as risk analysis progress, risk rating breakdown etc. There are so many reasons you need a Enterprise Cyber Risk Management Dashboard Sample PDF. The first reason is you cannot spend time making everything from scratch, Thus, Slidegeeks has made presentation templates for you too. You can easily download these templates from our website easily.
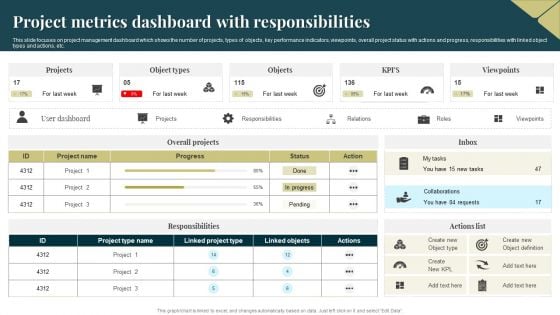
Project Metrics Dashboard With Responsibilities Graphics PDF
This slide focuses on project management dashboard which shows the number of projects, types of objects, key performance indicators, viewpoints, overall project status with actions and progress, responsibilities with linked object types and actions, etc. Pitch your topic with ease and precision using this Project Metrics Dashboard With Responsibilities Graphics PDF. This layout presents information on Project Metrics, Dashboard With Responsibilities. It is also available for immediate download and adjustment. So, changes can be made in the color, design, graphics or any other component to create a unique layout.
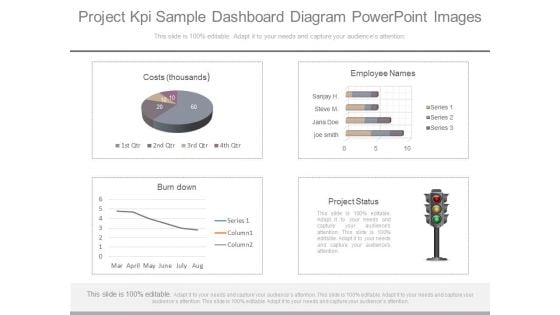
Project Kpi Sample Dashboard Diagram Powerpoint Images
This is a project kpi sample dashboard diagram powerpoint images. This is a four stage process. The stages in this process are costs thousands, employee names, burndown, project status.
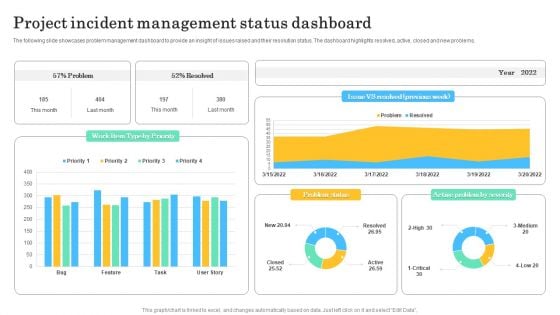
Project Incident Management Status Dashboard Sample PDF
The following slide showcases problem management dashboard to provide an insight of issues raised and their resolution status. The dashboard highlights resolved, active, closed and new problems. Pitch your topic with ease and precision using this Project Incident Management Status Dashboard Sample PDF. This layout presents information on Project Incident, Management Status Dashboard. It is also available for immediate download and adjustment. So, changes can be made in the color, design, graphics or any other component to create a unique layout.
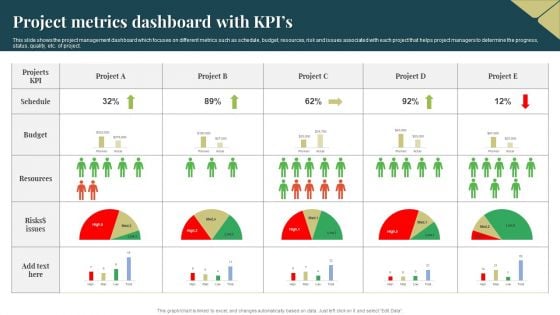
Project Metrics Dashboard With Kpis Ideas PDF
This slide shows the project management dashboard which focuses on different metrics such as schedule, budget, resources, risk and issues associated with each project that helps project managers to determine the progress, status, quality, etc. of project. Pitch your topic with ease and precision using this Project Metrics Dashboard With Kpis Ideas PDF. This layout presents information on Resources, Budget, Risks. It is also available for immediate download and adjustment. So, changes can be made in the color, design, graphics or any other component to create a unique layout.
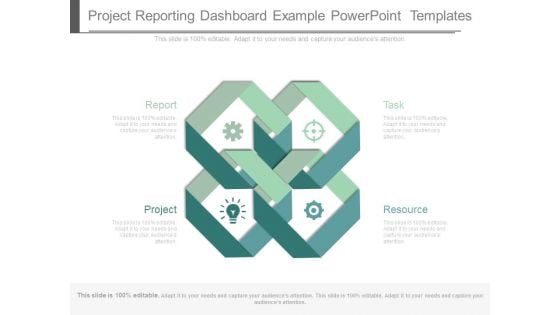
Project Reporting Dashboard Example Powerpoint Templates
This is a project reporting dashboard example powerpoint templates. This is a four stage process. The stages in this process are report, project, task, resource.

Devops Project Incident Administration Dashboard Diagrams PDF
This slide depicts developer operations DevOps project incident management dashboard. It provides information about after hour, daytime, escalation policy, escalations made, etc. Showcasing this set of slides titled Devops Project Incident Administration Dashboard Diagrams PDF. The topics addressed in these templates are Devops Project Incident, Administration Dashboard. All the content presented in this PPT design is completely editable. Download it and make adjustments in color, background, font etc. as per your unique business setting.
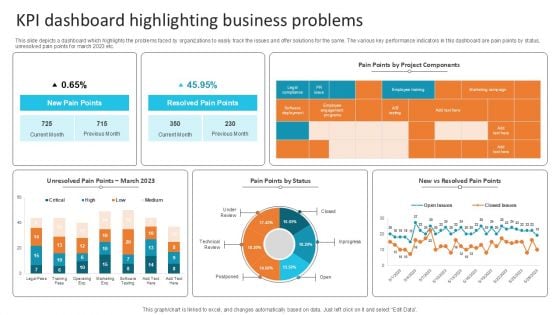
KPI Dashboard Highlighting Business Problems Microsoft PDF
Customizable Dashboard Enhanced Analytics Powerpoint Slides
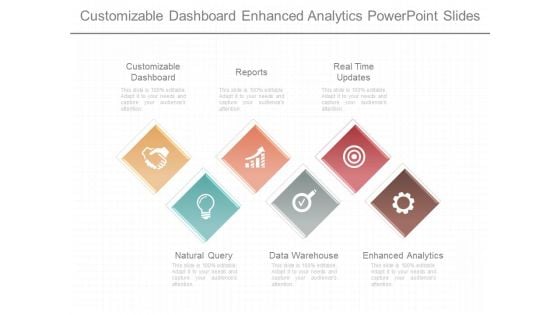
This is a customizable dashboard enhanced analytics powerpoint slides. This is a six stage process. The stages in this process are customizable dashboard, reports, real time updates, natural query, data warehouse, enhanced analytics.
Dashboard Related To Construction Management Guidelines PDF
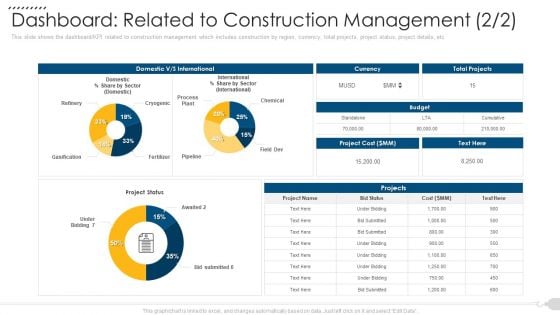
This slide shows the dashboard KPI related to construction management which includes total project details, Running project status, contractor details, invoice status, etc. Deliver and pitch your topic in the best possible manner with this dashboard related to construction management guidelines pdf. Use them to share invaluable insights on dashboard related to construction management and impress your audience. This template can be altered and modified as per your expectations. So, grab it now.
Dashboard Related To Construction Management Demonstration PDF
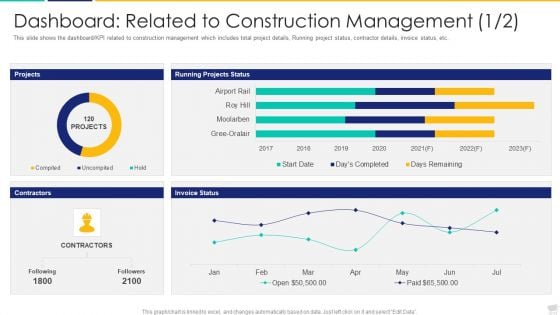
This slide shows the dashboard or KPI related to construction management which includes total project details, Running project status, contractor details, invoice status, etc.Deliver and pitch your topic in the best possible manner with this dashboard related to construction management demonstration pdf. Use them to share invaluable insights on dashboard related to construction management and impress your audience. This template can be altered and modified as per your expectations. So, grab it now.
Cost Reporting Dashboard Example Powerpoint Slides
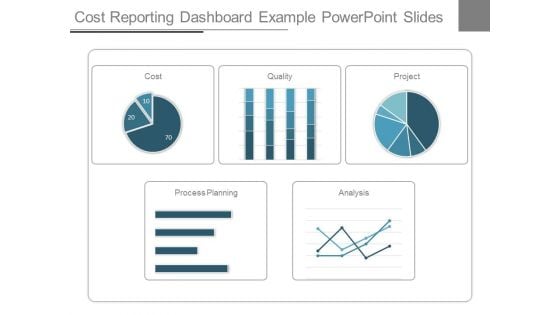
This is a cost reporting dashboard example powerpoint slides. This is a five stage process. The stages in this process are cost, quality, project, process planning, analysis.
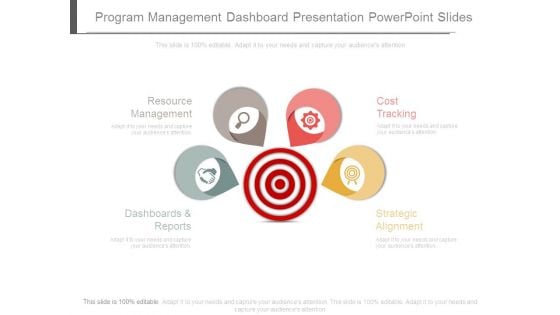
Program Management Dashboard Presentation Powerpoint Slides
This is a program management dashboard presentation powerpoint slides. This is a four stage process. The stages in this process are resource management, dashboards and reports, cost tracking, strategic alignment.


 Continue with Email

 Home
Home


