Progress Dashboard
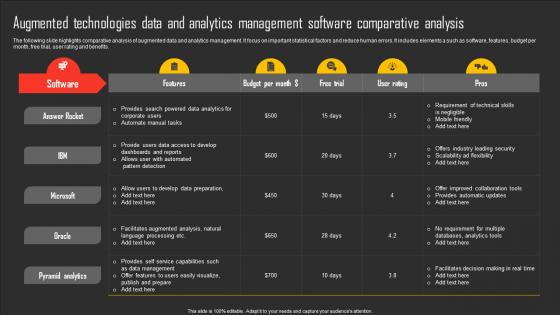
Augmented Technologies Data And Analytics Management Software Comparative Analysis Formats Pdf
The following slide highlights comparative analysis of augmented data and analytics management. It focus on important statistical factors and reduce human errors. It includes elements a such as software, features, budget per month, free trial, user rating and benefits. Showcasing this set of slides titled Augmented Technologies Data And Analytics Management Software Comparative Analysis Formats Pdf. The topics addressed in these templates are Answer Rocket, Microsoft, Pyramid Analytics . All the content presented in this PPT design is completely editable. Download it and make adjustments in color, background, font etc. as per your unique business setting. The following slide highlights comparative analysis of augmented data and analytics management. It focus on important statistical factors and reduce human errors. It includes elements a such as software, features, budget per month, free trial, user rating and benefits.
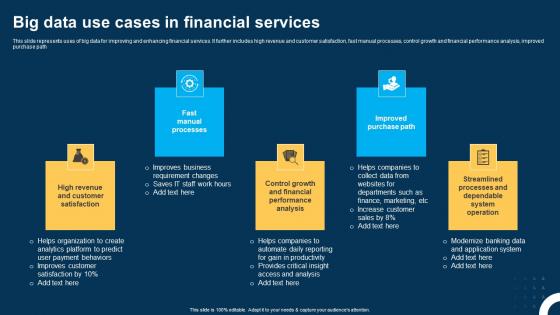
Big Data Use Cases In Financial Services Ppt Layouts Infographic Template pdf
This slide represents uses of big data for improving and enhancing financial services. It further includes high revenue and customer satisfaction, fast manual processes, control growth and financial performance analysis, improved purchase path. Showcasing this set of slides titled Big Data Use Cases In Financial Services Ppt Layouts Infographic Template pdf. The topics addressed in these templates are Fast Manual Processes, Improved Purchase Path, High Revenue. All the content presented in this PPT design is completely editable. Download it and make adjustments in color, background, font etc. as per your unique business setting. This slide represents uses of big data for improving and enhancing financial services. It further includes high revenue and customer satisfaction, fast manual processes, control growth and financial performance analysis, improved purchase path.
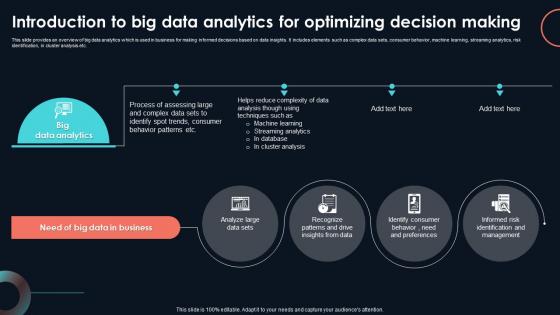
Introduction To Big Data Analytics For Developing Strategic Insights Using Big Data Analytics SS V
This slide provides an overview of big data analytics which is used in business for making informed decisions based on data insights. It includes elements such as complex data sets, consumer behavior, machine learning, streaming analytics, risk identification, in cluster analysis etc. Slidegeeks is one of the best resources for PowerPoint templates. You can download easily and regulate Introduction To Big Data Analytics For Developing Strategic Insights Using Big Data Analytics SS V for your personal presentations from our wonderful collection. A few clicks is all it takes to discover and get the most relevant and appropriate templates. Use our Templates to add a unique zing and appeal to your presentation and meetings. All the slides are easy to edit and you can use them even for advertisement purposes. This slide provides an overview of big data analytics which is used in business for making informed decisions based on data insights. It includes elements such as complex data sets, consumer behavior, machine learning, streaming analytics, risk identification, in cluster analysis etc.
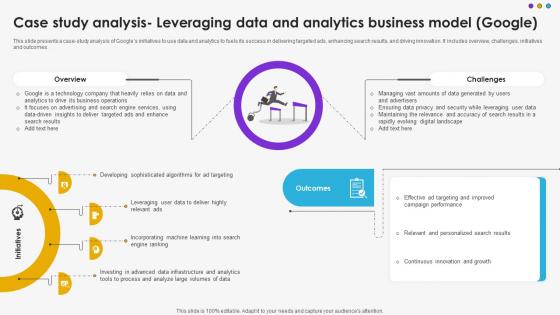
Case Study Analysis Leveraging Data And Analytics Business Model Google DT SS V
This slide presents a case-study analysis of Googles initiatives to use data and analytics to fuels its success in delivering targeted ads, enhancing search results, and driving innovation. It includes overview, challenges, initiatives and outcomes.Find highly impressive Case Study Analysis Leveraging Data And Analytics Business Model Google DT SS V on Slidegeeks to deliver a meaningful presentation. You can save an ample amount of time using these presentation templates. No need to worry to prepare everything from scratch because Slidegeeks experts have already done a huge research and work for you. You need to download Case Study Analysis Leveraging Data And Analytics Business Model Google DT SS V for your upcoming presentation. All the presentation templates are 100 percent editable and you can change the color and personalize the content accordingly. Download now This slide presents a case-study analysis of Googles initiatives to use data and analytics to fuels its success in delivering targeted ads, enhancing search results, and driving innovation. It includes overview, challenges, initiatives and outcomes.
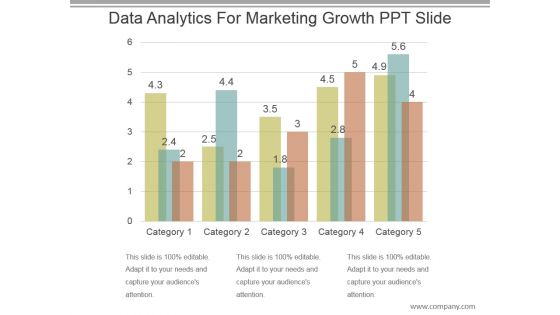
Data Analytics For Marketing Growth Ppt Slide
This is a data analytics for marketing growth ppt slide. This is a five stage process. The stages in this process are category.
Analysis Of Performance Review Report Icon Sample PDF
Presenting Analysis Of Performance Review Report Icon Sample PDF to dispense important information. This template comprises four stages. It also presents valuable insights into the topics including Analysis Performance, Review Report Icon. This is a completely customizable PowerPoint theme that can be put to use immediately. So, download it and address the topic impactfully.
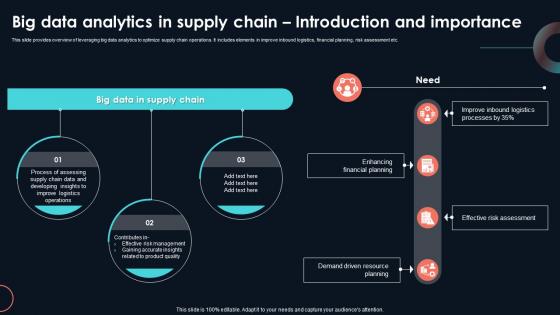
Big Data Analytics In Supply Chain Developing Strategic Insights Using Big Data Analytics SS V
This slide provides overview of leveraging big data analytics to optimize supply chain operations. It includes elements in improve inbound logistics, financial planning, risk assessment etc. Crafting an eye-catching presentation has never been more straightforward. Let your presentation shine with this tasteful yet straightforward Big Data Analytics In Supply Chain Developing Strategic Insights Using Big Data Analytics SS V template. It offers a minimalistic and classy look that is great for making a statement. The colors have been employed intelligently to add a bit of playfulness while still remaining professional. Construct the ideal Big Data Analytics In Supply Chain Developing Strategic Insights Using Big Data Analytics SS V that effortlessly grabs the attention of your audience Begin now and be certain to wow your customers This slide provides overview of leveraging big data analytics to optimize supply chain operations. It includes elements in improve inbound logistics, financial planning, risk assessment etc.

Combined Strength Of Big Data Analytics Developing Strategic Insights Using Big Data Analytics SS V
This slide showcases benefits of leveraging descriptive, predictive and prescriptive analytics combined to improve business operations. It provides information regarding accurate forecasting, identifying uncertainties, outcome driven recommendations etc. Formulating a presentation can take up a lot of effort and time, so the content and message should always be the primary focus. The visuals of the PowerPoint can enhance the presenters message, so our Combined Strength Of Big Data Analytics Developing Strategic Insights Using Big Data Analytics SS V was created to help save time. Instead of worrying about the design, the presenter can concentrate on the message while our designers work on creating the ideal templates for whatever situation is needed. Slidegeeks has experts for everything from amazing designs to valuable content, we have put everything into Combined Strength Of Big Data Analytics Developing Strategic Insights Using Big Data Analytics SS V This slide showcases benefits of leveraging descriptive, predictive and prescriptive analytics combined to improve business operations. It provides information regarding accurate forecasting, identifying uncertainties, outcome driven recommendations etc.

Big Data Types Analyzed To Drive Valuable Developing Strategic Insights Using Big Data Analytics SS V
This slide showcases various types of big data that is used for data analysis which helps in creating deeper insights to enhance business operations. It provides information regarding structure , unstructured and semi structured data. Make sure to capture your audiences attention in your business displays with our gratis customizable Big Data Types Analyzed To Drive Valuable Developing Strategic Insights Using Big Data Analytics SS V. These are great for business strategies, office conferences, capital raising or task suggestions. If you desire to acquire more customers for your tech business and ensure they stay satisfied, create your own sales presentation with these plain slides. This slide showcases various types of big data that is used for data analysis which helps in creating deeper insights to enhance business operations. It provides information regarding structure , unstructured and semi structured data.
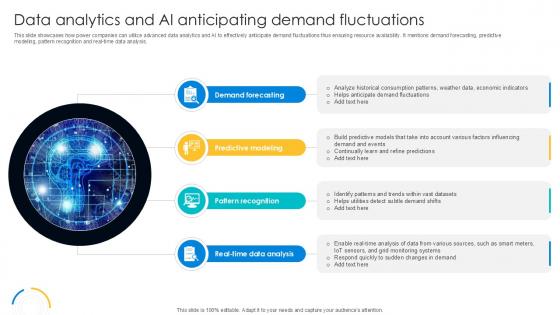
Data Analytics And AI Anticipating Digital Transformation Journey PPT Example DT SS V
This slide showcases how power companies can utilize advanced data analytics and AI to effectively anticipate demand fluctuations thus ensuring resource availability. It mentions demand forecasting, predictive modeling, pattern recognition and real-time data analysis. Formulating a presentation can take up a lot of effort and time, so the content and message should always be the primary focus. The visuals of the PowerPoint can enhance the presenters message, so our Data Analytics And AI Anticipating Digital Transformation Journey PPT Example DT SS V was created to help save time. Instead of worrying about the design, the presenter can concentrate on the message while our designers work on creating the ideal templates for whatever situation is needed. Slidegeeks has experts for everything from amazing designs to valuable content, we have put everything into Data Analytics And AI Anticipating Digital Transformation Journey PPT Example DT SS V This slide showcases how power companies can utilize advanced data analytics and AI to effectively anticipate demand fluctuations thus ensuring resource availability. It mentions demand forecasting, predictive modeling, pattern recognition and real-time data analysis.
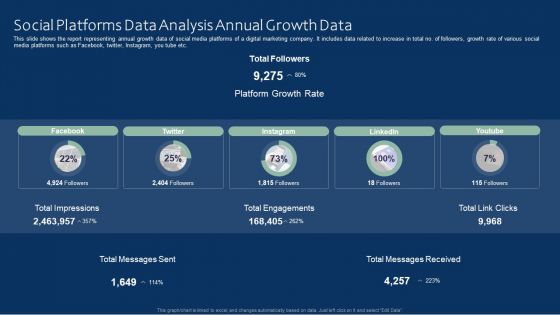
Social Platforms Data Analysis Annual Growth Data Ideas PDF
This slide shows the report representing annual growth data of social media platforms of a digital marketing company. It includes data related to increase in total no. of followers, growth rate of various social media platforms such as Facebook, twitter, Instagram, you tube etc. Pitch your topic with ease and precision using this Social Platforms Data Analysis Annual Growth Data Ideas PDF. This layout presents information on Social Platforms Data Analysis, Annual Growth Data. It is also available for immediate download and adjustment. So, changes can be made in the color, design, graphics or any other component to create a unique layout.
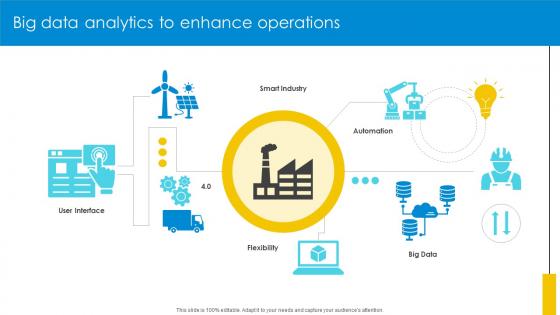
Big Data Analytics To Enhance Operations Optimizing Inventory Management IoT SS V
If your project calls for a presentation, then Slidegeeks is your go-to partner because we have professionally designed, easy-to-edit templates that are perfect for any presentation. After downloading, you can easily edit Big Data Analytics To Enhance Operations Optimizing Inventory Management IoT SS V and make the changes accordingly. You can rearrange slides or fill them with different images. Check out all the handy templates Our Big Data Analytics To Enhance Operations Optimizing Inventory Management IoT SS V are topically designed to provide an attractive backdrop to any subject. Use them to look like a presentation pro.
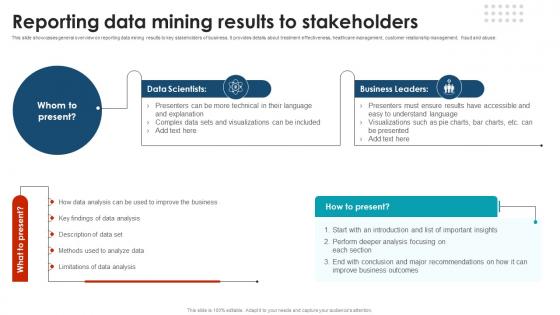
Reporting Data Mining Results To Stakeholders Using Data Mining Tools To Optimize Processes AI SS V
This slide showcases general overview on reporting data mining results to key stakeholders of business. It provides details about treatment effectiveness, healthcare management, customer relationship management, fraud and abuse. Here you can discover an assortment of the finest PowerPoint and Google Slides templates. With these templates, you can create presentations for a variety of purposes while simultaneously providing your audience with an eye-catching visual experience. Download Reporting Data Mining Results To Stakeholders Using Data Mining Tools To Optimize Processes AI SS V to deliver an impeccable presentation. These templates will make your job of preparing presentations much quicker, yet still, maintain a high level of quality. Slidegeeks has experienced researchers who prepare these templates and write high-quality content for you. Later on, you can personalize the content by editing the Reporting Data Mining Results To Stakeholders Using Data Mining Tools To Optimize Processes AI SS V. This slide showcases general overview on reporting data mining results to key stakeholders of business. It provides details about treatment effectiveness, healthcare management, customer relationship management, fraud and abuse.

Data Mining Techniques Regression Analysis Data Warehousing And Data Mining Guide AI SS V
This slide showcases regression analysis method of data mining to help businesses forecasting and tracking useful patterns for their operations. It provides details about linear, polynomial, logistic, ridge, lasso, marketing planning, crop yield, etc. Make sure to capture your audiences attention in your business displays with our gratis customizable Data Mining Techniques Regression Analysis Data Warehousing And Data Mining Guide AI SS V. These are great for business strategies, office conferences, capital raising or task suggestions. If you desire to acquire more customers for your tech business and ensure they stay satisfied, create your own sales presentation with these plain slides. This slide showcases regression analysis method of data mining to help businesses forecasting and tracking useful patterns for their operations. It provides details about linear, polynomial, logistic, ridge, lasso, marketing planning, crop yield, etc.
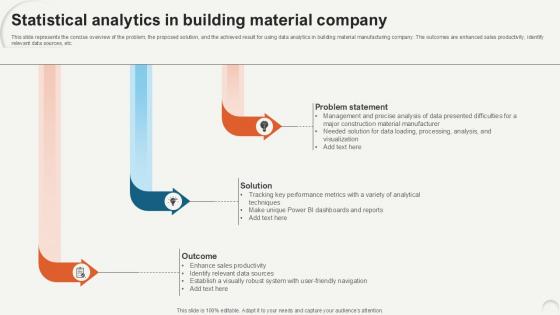
Statistical Analytics In Building Data Analytics For Informed Decision Ppt PowerPoint
This slide represents the concise overview of the problem, the proposed solution, and the achieved result for using data analytics in building material manufacturing company. The outcomes are enhanced sales productivity, identify relevant data sources, etc. Do you know about Slidesgeeks Statistical Analytics In Building Data Analytics For Informed Decision Ppt PowerPoint These are perfect for delivering any kind od presentation. Using it, create PowerPoint presentations that communicate your ideas and engage audiences. Save time and effort by using our pre-designed presentation templates that are perfect for a wide range of topic. Our vast selection of designs covers a range of styles, from creative to business, and are all highly customizable and easy to edit. Download as a PowerPoint template or use them as Google Slides themes. This slide represents the concise overview of the problem, the proposed solution, and the achieved result for using data analytics in building material manufacturing company. The outcomes are enhanced sales productivity, identify relevant data sources, etc.
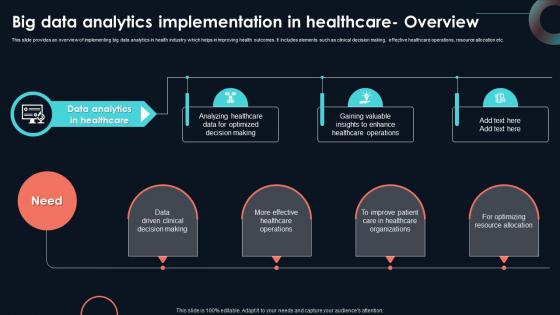
Big Data Analytics Implementation In Developing Strategic Insights Using Big Data Analytics SS V
This slide provides an overview of implementing big data analytics in health industry which helps in improving health outcomes. It includes elements such as clinical decision making, effective healthcare operations, resource allocation etc. If you are looking for a format to display your unique thoughts, then the professionally designed Big Data Analytics Implementation In Developing Strategic Insights Using Big Data Analytics SS V is the one for you. You can use it as a Google Slides template or a PowerPoint template. Incorporate impressive visuals, symbols, images, and other charts. Modify or reorganize the text boxes as you desire. Experiment with shade schemes and font pairings. Alter, share or cooperate with other people on your work. Download Big Data Analytics Implementation In Developing Strategic Insights Using Big Data Analytics SS V and find out how to give a successful presentation. Present a perfect display to your team and make your presentation unforgettable. This slide provides an overview of implementing big data analytics in health industry which helps in improving health outcomes. It includes elements such as clinical decision making, effective healthcare operations, resource allocation etc.
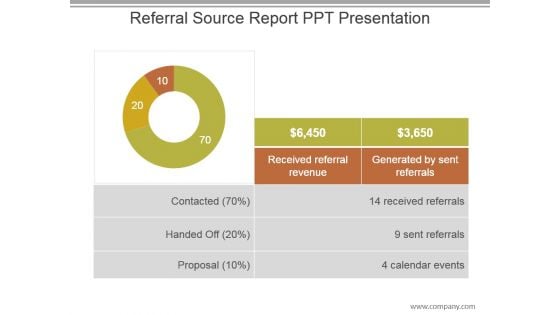
Referral Source Report Ppt Presentation
This is a referral source report ppt presentation. This is a three stage process. The stages in this process are received referral revenue, generated by sent referrals, contacted, handed off, proposal, received referrals, sent referrals, calendar events.

Benefits Of Leveraging Decision Tree Analysis Data Analytics SS V
This slide outlines key advantages of leveraging decision tree analysis aimed at identifying correct solutions to any problem. It covers the benefits such as depicts suitable project, easy classification, assistance for multiple tools, etc.Coming up with a presentation necessitates that the majority of the effort goes into the content and the message you intend to convey. The visuals of a PowerPoint presentation can only be effective if it supplements and supports the story that is being told. Keeping this in mind our experts created Benefits Of Leveraging Decision Tree Analysis Data Analytics SS V to reduce the time that goes into designing the presentation. This way, you can concentrate on the message while our designers take care of providing you with the right template for the situation. This slide outlines key advantages of leveraging decision tree analysis aimed at identifying correct solutions to any problem. It covers the benefits such as depicts suitable project, easy classification, assistance for multiple tools, etc.
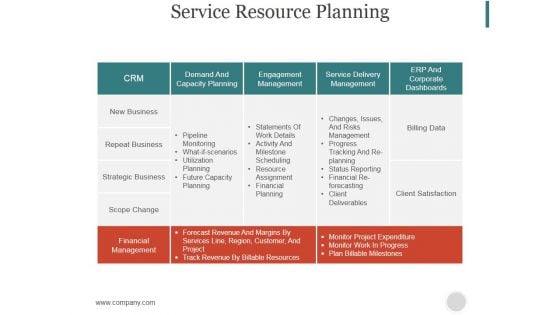
Service Resource Planning Ppt PowerPoint Presentation Styles
This is a service resource planning ppt powerpoint presentation styles. This is a five stage process. The stages in this process are crm, demand and capacity planning, engagement management, service delivery management, erp and corporate dashboards, financial management.

Project And Change Management Powerpoint Ideas
This is a project and change management powerpoint ideas. This is a seven stage process. The stages in this process are process visualization, project and change management, procedure quality management, performance metric system, scorecards and dashboards, process mapping, process simulation.
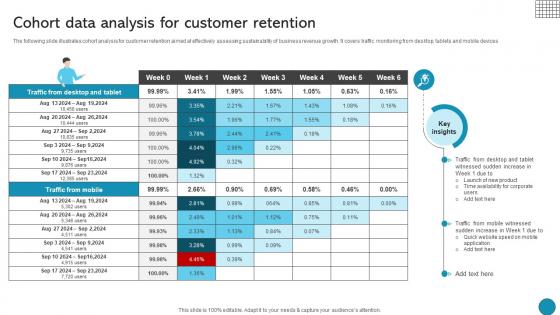
Cohort Data Analysis For Customer Retention Driving Business Success Integrating Product
The following slide illustrates cohort analysis for customer retention aimed at effectively assessing sustainability of business revenue growth. It covers traffic monitoring from desktop, tablets and mobile devicesFind highly impressive Cohort Data Analysis For Customer Retention Driving Business Success Integrating Product on Slidegeeks to deliver a meaningful presentation. You can save an ample amount of time using these presentation templates. No need to worry to prepare everything from scratch because Slidegeeks experts have already done a huge research and work for you. You need to download Cohort Data Analysis For Customer Retention Driving Business Success Integrating Product for your upcoming presentation. All the presentation templates are 100 percent editable and you can change the color and personalize the content accordingly. Download now The following slide illustrates cohort analysis for customer retention aimed at effectively assessing sustainability of business revenue growth. It covers traffic monitoring from desktop, tablets and mobile devices
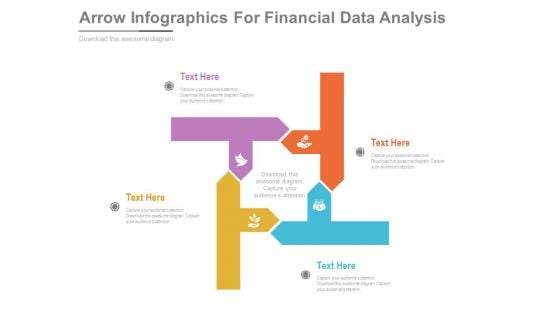
Arrow Infographics For Financial Data Analysis Powerpoint Template
This PowerPoint slide contains diagram of arrows infographic. This professional slide helps to exhibit financial data analysis for business growth. Use this PowerPoint template to make impressive presentations.

Current IT Infrastructure Assessment Report Data Migration From On Premises
This slide showcases assessment of existing IT infrastructure which includes hardware, software, network and storage hubs, web servers, routers, database servers etc. If your project calls for a presentation, then Slidegeeks is your go-to partner because we have professionally designed, easy-to-edit templates that are perfect for any presentation. After downloading, you can easily edit Current IT Infrastructure Assessment Report Data Migration From On Premises and make the changes accordingly. You can rearrange slides or fill them with different images. Check out all the handy templates This slide showcases assessment of existing IT infrastructure which includes hardware, software, network and storage hubs, web servers, routers, database servers etc.

Data Mining Tools Market Growth Drivers Using Data Mining Tools To Optimize Processes AI SS V
This slide showcases growth drivers of data mining tools market which can help associated players to gain insights and improve their current offerings. It provides details about banking sector, surging demand and BYOD trend. Take your projects to the next level with our ultimate collection of Data Mining Tools Market Growth Drivers Using Data Mining Tools To Optimize Processes AI SS V. Slidegeeks has designed a range of layouts that are perfect for representing task or activity duration, keeping track of all your deadlines at a glance. Tailor these designs to your exact needs and give them a truly corporate look with your own brand colors they will make your projects stand out from the rest This slide showcases growth drivers of data mining tools market which can help associated players to gain insights and improve their current offerings. It provides details about banking sector, surging demand and BYOD trend.
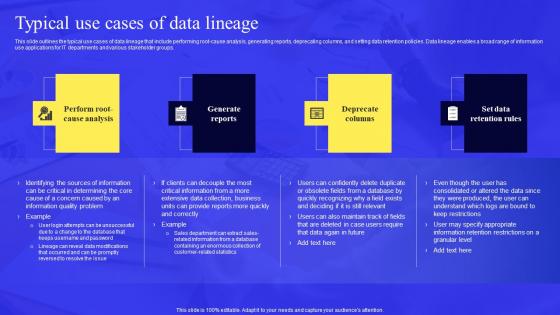
Business Process Data Lineage Typical Use Cases Of Data Lineage Elements Pdf
This slide outlines the typical use cases of data lineage that include performing root cause analysis, generating reports, deprecating columns, and setting data retention policies. Data lineage enables a broad range of information use applications for IT departments and various stakeholder groups. Make sure to capture your audiences attention in your business displays with our gratis customizable Business Process Data Lineage Typical Use Cases Of Data Lineage Elements Pdf. These are great for business strategies, office conferences, capital raising or task suggestions. If you desire to acquire more customers for your tech business and ensure they stay satisfied, create your own sales presentation with these plain slides. This slide outlines the typical use cases of data lineage that include performing root-cause analysis, generating reports, deprecating columns, and setting data retention policies. Data lineage enables a broad range of information use applications for IT departments and various stakeholder groups.
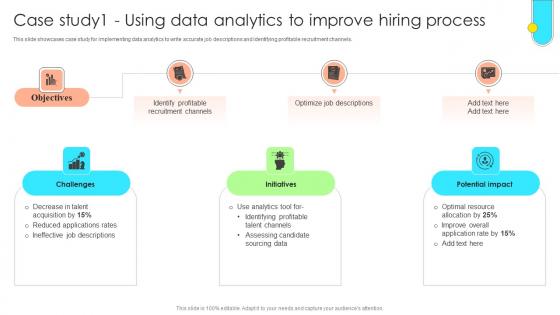
Data Driven Approach To Optimise Case Study1 Using Data Analytics To Improve CRP SS V
This slide showcases case study for implementing data analytics to write accurate job descriptions and identifying profitable recruitment channels. Whether you have daily or monthly meetings, a brilliant presentation is necessary. Data Driven Approach To Optimise Case Study1 Using Data Analytics To Improve CRP SS V can be your best option for delivering a presentation. Represent everything in detail using Data Driven Approach To Optimise Case Study1 Using Data Analytics To Improve CRP SS V and make yourself stand out in meetings. The template is versatile and follows a structure that will cater to your requirements. All the templates prepared by Slidegeeks are easy to download and edit. Our research experts have taken care of the corporate themes as well. So, give it a try and see the results. This slide showcases case study for implementing data analytics to write accurate job descriptions and identifying profitable recruitment channels.

Introduction To Big Data Predictive Analytics Developing Strategic Insights Using Big Data Analytics SS V
This slide provides an overview of leveraging predictive analytics in analyzing big data which helps in driving valuable insights. It includes elements such as decision trees, neural networks, text analysis, structured data, operational efficiency, strategic decision making etc. Want to ace your presentation in front of a live audience Our Introduction To Big Data Predictive Analytics Developing Strategic Insights Using Big Data Analytics SS V can help you do that by engaging all the users towards you. Slidegeeks experts have put their efforts and expertise into creating these impeccable powerpoint presentations so that you can communicate your ideas clearly. Moreover, all the templates are customizable, and easy-to-edit and downloadable. Use these for both personal and commercial use. This slide provides an overview of leveraging predictive analytics in analyzing big data which helps in driving valuable insights. It includes elements such as decision trees, neural networks, text analysis, structured data, operational efficiency, strategic decision making etc.
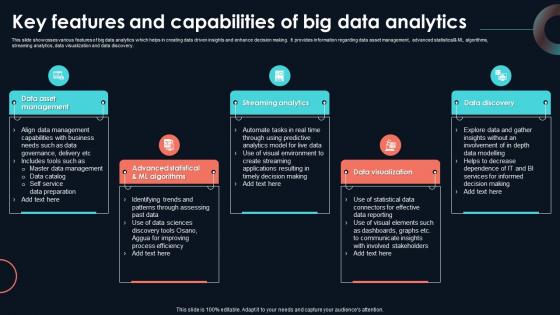
Key Features And Capabilities Of Big Data Developing Strategic Insights Using Big Data Analytics SS V
This slide showcases various features of big data analytics which helps in creating data driven insights and enhance decision making. It provides information regarding data asset management, advanced statisticalAnd ML algorithms, streaming analytics, data visualization and data discovery. From laying roadmaps to briefing everything in detail, our templates are perfect for you. You can set the stage with your presentation slides. All you have to do is download these easy-to-edit and customizable templates. Key Features And Capabilities Of Big Data Developing Strategic Insights Using Big Data Analytics SS V will help you deliver an outstanding performance that everyone would remember and praise you for. Do download this presentation today. This slide showcases various features of big data analytics which helps in creating data driven insights and enhance decision making. It provides information regarding data asset management, advanced statisticaland ML algorithms, streaming analytics, data visualization and data discovery.
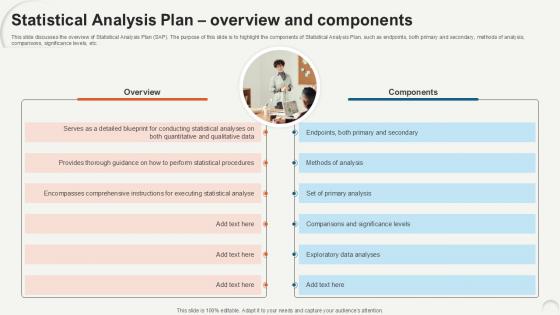
Statistical Analysis Plan Overview Data Analytics For Informed Decision Ppt Template
This slide discusses the overview of Statistical Analysis Plan SAP. The purpose of this slide is to highlight the components of Statistical Analysis Plan, such as endpoints, both primary and secondary, methods of analysis, comparisons, significance levels, etc. Here you can discover an assortment of the finest PowerPoint and Google Slides templates. With these templates, you can create presentations for a variety of purposes while simultaneously providing your audience with an eye-catching visual experience. Download Statistical Analysis Plan Overview Data Analytics For Informed Decision Ppt Template to deliver an impeccable presentation. These templates will make your job of preparing presentations much quicker, yet still, maintain a high level of quality. Slidegeeks has experienced researchers who prepare these templates and write high-quality content for you. Later on, you can personalize the content by editing the Statistical Analysis Plan Overview Data Analytics For Informed Decision Ppt Template. This slide discusses the overview of Statistical Analysis Plan SAP. The purpose of this slide is to highlight the components of Statistical Analysis Plan, such as endpoints, both primary and secondary, methods of analysis, comparisons, significance levels, etc.
Project And Management Source Control Ppt Example
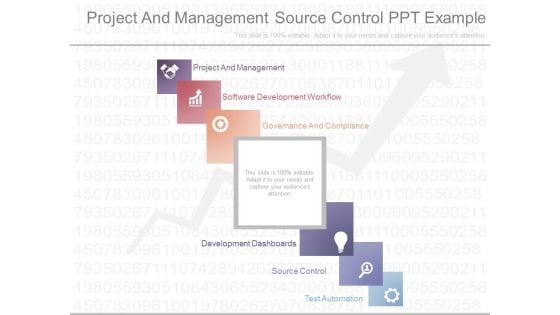
This is a project and management source control ppt example. This is a six stage process. The stages in this process are project and management, software development workflow, governance and compliance, development dashboards, source control, test automation.
Marketing Data Analytics Ppt Sample Presentations
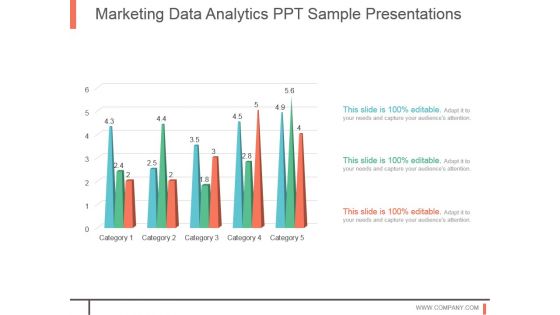
This is a marketing data analytics ppt sample presentations. This is a five stage process. The stages in this process are business, strategy, marketing, process, linear process.
Analytics Solutions Sample Of Ppt Presentation
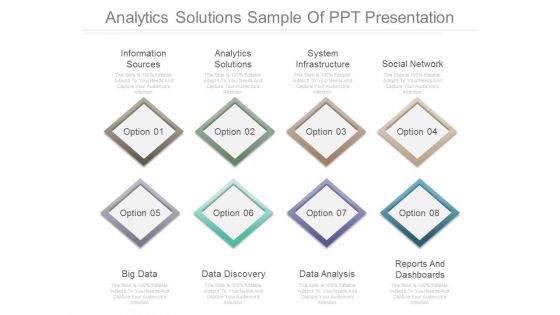
This is a analytics solutions sample of ppt presentation. This is a eight stage process. The stages in this process are information sources, analytics solutions, system infrastructure, social network, big data, data discovery, data analysis, reports and dashboards.
Global Data Security Industry Report Gartners Magic Quadrant Assessing Industry Disruption IR SS V
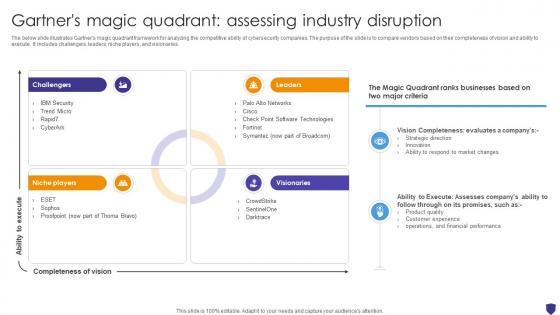
The below slide illustrates Gartners magic quadrant framework for analyzing the competitive ability of cybersecurity companies. The purpose of the slide is to compare vendors based on their completeness of vision and ability to execute. It includes challengers, leaders, niche players, and visionaries. Find highly impressive Global Data Security Industry Report Gartners Magic Quadrant Assessing Industry Disruption IR SS V on Slidegeeks to deliver a meaningful presentation. You can save an ample amount of time using these presentation templates. No need to worry to prepare everything from scratch because Slidegeeks experts have already done a huge research and work for you. You need to download Global Data Security Industry Report Gartners Magic Quadrant Assessing Industry Disruption IR SS V for your upcoming presentation. All the presentation templates are 100 percent editable and you can change the color and personalize the content accordingly. Download now The below slide illustrates Gartners magic quadrant framework for analyzing the competitive ability of cybersecurity companies. The purpose of the slide is to compare vendors based on their completeness of vision and ability to execute. It includes challengers, leaders, niche players, and visionaries.

HR Analytics Metrics For Data Driven Decision Summary Pdf
This slide illustrates human resource key performance indicators that help organization to analyze actionable insights for taking effective and date driven decision. It includes KPIs such as recruitment, employee engagement, retention and diversity and inclusion.Pitch your topic with ease and precision using this HR Analytics Metrics For Data Driven Decision Summary Pdf This layout presents information on Estimate Accumulated, Involved Recruitment, Provide Actionable Insight It is also available for immediate download and adjustment. So, changes can be made in the color, design, graphics or any other component to create a unique layout. This slide illustrates human resource key performance indicators that help organization to analyze actionable insights for taking effective and date driven decision. It includes KPIs such as recruitment, employee engagement, retention and diversity and inclusion.
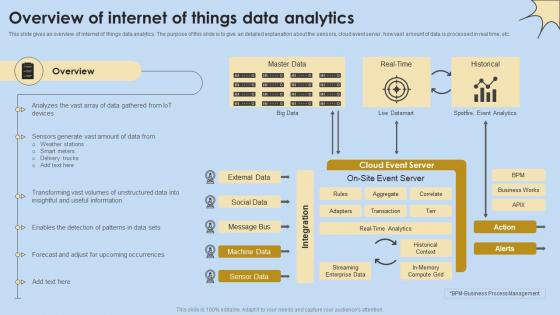
Overview Of Internet Of Things Data Analytics Internet Of Things Analysis Clipart Pdf
This slide gives an overview of internet of things data analytics. The purpose of this slide is to give an detailed explanation about the sensors, cloud event server, how vast amount of data is processed in real time, etc. Retrieve professionally designed Overview Of Internet Of Things Data Analytics Internet Of Things Analysis Clipart Pdf to effectively convey your message and captivate your listeners. Save time by selecting pre-made slideshows that are appropriate for various topics, from business to educational purposes. These themes come in many different styles, from creative to corporate, and all of them are easily adjustable and can be edited quickly. Access them as PowerPoint templates or as Google Slides themes. You do not have to go on a hunt for the perfect presentation because Slidegeeks got you covered from everywhere. This slide gives an overview of internet of things data analytics. The purpose of this slide is to give an detailed explanation about the sensors, cloud event server, how vast amount of data is processed in real time, etc.
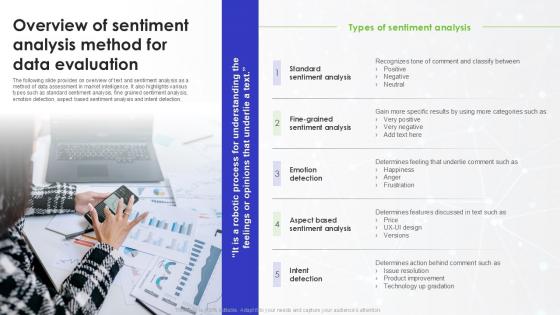
Overview Of Sentiment Analysis Method For Data Evaluation
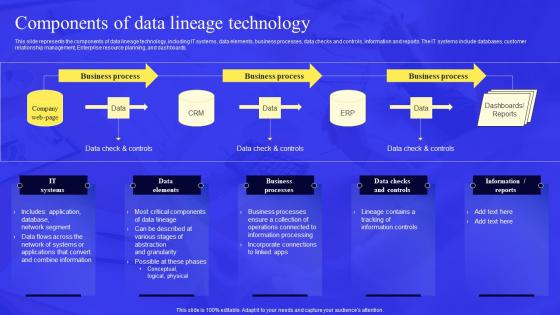
Business Process Data Lineage Components Of Data Lineage Technology Clipart Pdf
This slide represents the components of data lineage technology, including IT systems, data elements, business processes, data checks and controls, information and reports. The IT systems include databases, customer relationship management, Enterprise resource planning, and dashboards. Present like a pro with Business Process Data Lineage Components Of Data Lineage Technology Clipart Pdf Create beautiful presentations together with your team, using our easy to use presentation slides. Share your ideas in real time and make changes on the fly by downloading our templates. So whether you are in the office, on the go, or in a remote location, you can stay in sync with your team and present your ideas with confidence. With Slidegeeks presentation got a whole lot easier. Grab these presentations today. This slide represents the components of data lineage technology, including IT systems, data elements, business processes, data checks and controls, information and reports. The IT systems include databases, customer relationship management, Enterprise resource planning, and dashboards.
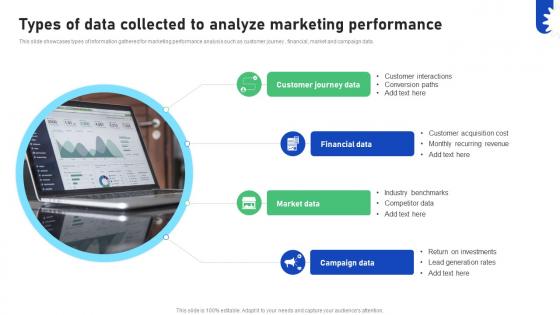
Improving Business Marketing Performance Types Of Data Collected To Analyze CRP DK SS V
This slide showcases types of information gathered for marketing performance analysis such as customer journey , financial, market and campaign data. Present like a pro with Improving Business Marketing Performance Types Of Data Collected To Analyze CRP DK SS V. Create beautiful presentations together with your team, using our easy-to-use presentation slides. Share your ideas in real-time and make changes on the fly by downloading our templates. So whether you are in the office, on the go, or in a remote location, you can stay in sync with your team and present your ideas with confidence. With Slidegeeks presentation got a whole lot easier. Grab these presentations today. This slide showcases types of information gathered for marketing performance analysis such as customer journey , financial, market and campaign data.
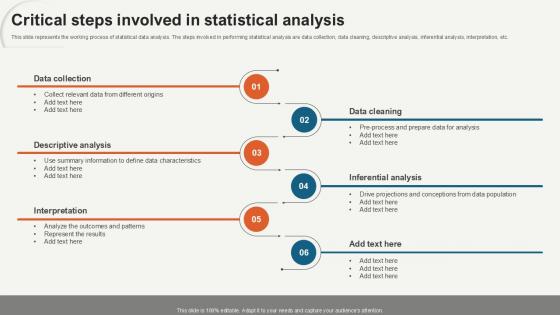
Critical Steps Involved In Statistical Data Analytics For Informed Decision Ppt Presentation
This slide represents the working process of statistical data analysis. The steps involved in performing statistical analysis are data collection, data cleaning, descriptive analysis, inferential analysis, interpretation, etc. Slidegeeks is here to make your presentations a breeze with Critical Steps Involved In Statistical Data Analytics For Informed Decision Ppt Presentation With our easy-to-use and customizable templates, you can focus on delivering your ideas rather than worrying about formatting. With a variety of designs to choose from, you are sure to find one that suits your needs. And with animations and unique photos, illustrations, and fonts, you can make your presentation pop. So whether you are giving a sales pitch or presenting to the board, make sure to check out Slidegeeks first This slide represents the working process of statistical data analysis. The steps involved in performing statistical analysis are data collection, data cleaning, descriptive analysis, inferential analysis, interpretation, etc.
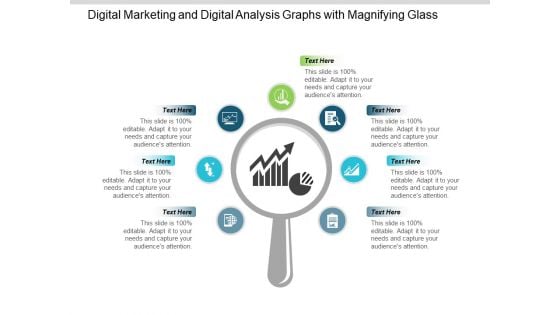
Digital Marketing And Digital Analysis Graphs With Magnifying Glass Ppt PowerPoint Presentation Portfolio Show
This is a digital marketing and digital analysis graphs with magnifying glass ppt powerpoint presentation portfolio show. This is a seven stage process. The stages in this process are digital analytics, digital dashboard, marketing.
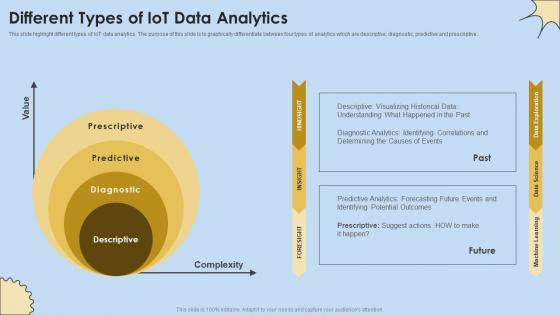
Different Types Of IoT Data Analytics Internet Of Things Analysis Mockup Pdf
This slide highlight different types of IoT data analytics. The purpose of this slide is to graphically differentiate between four types of analytics which are descriptive, diagnostic, predictive and prescriptive. Are you in need of a template that can accommodate all of your creative concepts This one is crafted professionally and can be altered to fit any style. Use it with Google Slides or PowerPoint. Include striking photographs, symbols, depictions, and other visuals. Fill, move around, or remove text boxes as desired. Test out color palettes and font mixtures. Edit and save your work, or work with colleagues. Download Different Types Of IoT Data Analytics Internet Of Things Analysis Mockup Pdf and observe how to make your presentation outstanding. Give an impeccable presentation to your group and make your presentation unforgettable. This slide highlight different types of IoT data analytics. The purpose of this slide is to graphically differentiate between four types of analytics which are descriptive, diagnostic, predictive and prescriptive.
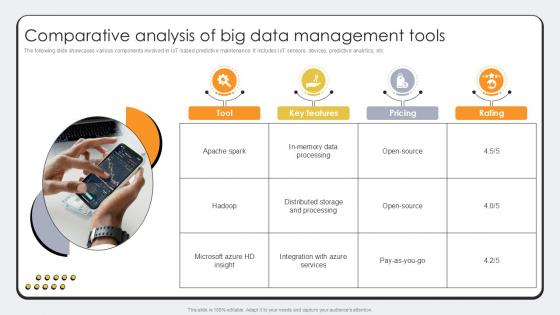
Comparative Analysis Of Big Data Revolutionizing Production IoT Ppt Slide
The following slide showcases various components involved in IoT-based predictive maintenance. It includes IoT sensors, devices, predictive analytics, etc. Slidegeeks is here to make your presentations a breeze with Comparative Analysis Of Big Data Revolutionizing Production IoT Ppt Slide With our easy-to-use and customizable templates, you can focus on delivering your ideas rather than worrying about formatting. With a variety of designs to choose from, you are sure to find one that suits your needs. And with animations and unique photos, illustrations, and fonts, you can make your presentation pop. So whether you are giving a sales pitch or presenting to the board, make sure to check out Slidegeeks first The following slide showcases various components involved in IoT-based predictive maintenance. It includes IoT sensors, devices, predictive analytics, etc.
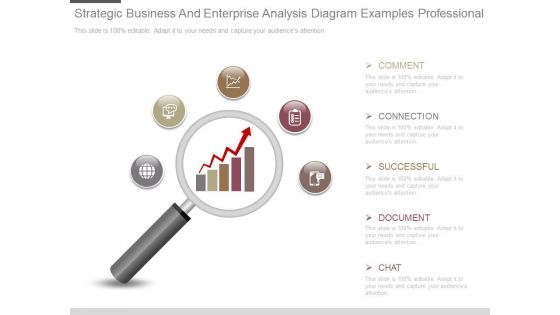
Strategic Business And Enterprise Analysis Diagram Examples Professional
This is a strategic business and enterprise analysis diagram examples professional. This is a five stage process. The stages in this process are comment, connection, successful, document, chat.\n\n\n\n\n\n\n\n
Data Analysis Reports Under Magnifying Glass Ppt Powerpoint Presentation Summary Slideshow
This is a data analysis reports under magnifying glass ppt powerpoint presentation summary slideshow. This is a three stage process. The stages in this process are data visualization icon, data management icon.
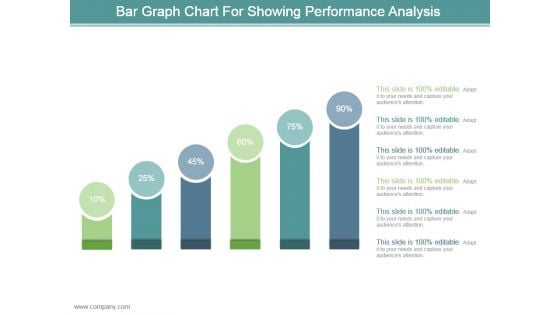
Bar Graph Chart For Showing Performance Analysis Ppt Design
This is a bar graph chart for showing performance analysis ppt design. This is a six stage process. The stages in this process are business, marketing, process, success, presentation.

Current Scenario Analysis Of Big Data Revolutionizing Production IoT Ppt Slide
The following slide showcases current scenario analysis of big data management to assess scope of improvement. It includes KPIs such as data accuracy, downtime reduction, etc. Whether you have daily or monthly meetings, a brilliant presentation is necessary. Current Scenario Analysis Of Big Data Revolutionizing Production IoT Ppt Slide can be your best option for delivering a presentation. Represent everything in detail using Current Scenario Analysis Of Big Data Revolutionizing Production IoT Ppt Slide and make yourself stand out in meetings. The template is versatile and follows a structure that will cater to your requirements. All the templates prepared by Slidegeeks are easy to download and edit. Our research experts have taken care of the corporate themes as well. So, give it a try and see the results. The following slide showcases current scenario analysis of big data management to assess scope of improvement. It includes KPIs such as data accuracy, downtime reduction, etc.
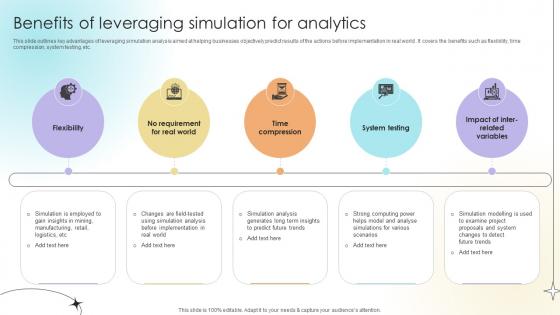
Benefits Of Leveraging Simulation For Analytics Data Analytics SS V
This slide outlines key advantages of leveraging simulation analysis aimed at helping businesses objectively predict results of the actions before implementation in real world . It covers the benefits such as flexibility, time compression, system testing, etc. This modern and well-arranged Benefits Of Leveraging Simulation For Analytics Data Analytics SS V provides lots of creative possibilities. It is very simple to customize and edit with the Powerpoint Software. Just drag and drop your pictures into the shapes. All facets of this template can be edited with Powerpoint, no extra software is necessary. Add your own material, put your images in the places assigned for them, adjust the colors, and then you can show your slides to the world, with an animated slide included. This slide outlines key advantages of leveraging simulation analysis aimed at helping businesses objectively predict results of the actions before implementation in real world . It covers the benefits such as flexibility, time compression, system testing, etc.
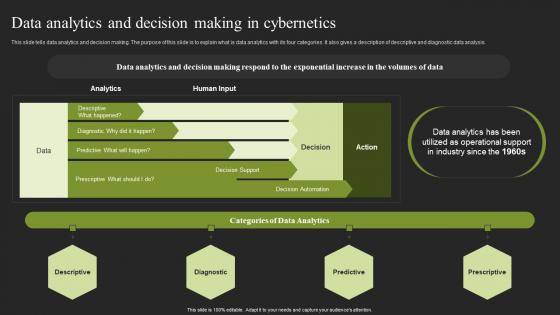
Data Analytics And Decision Making In Cybernetics Cybernetic Systems Inspiration Pdf
This slide tells data analytics and decision making. The purpose of this slide is to explain what is data analytics with its four categories. It also gives a description of descriptive and diagnostic data analysis. Welcome to our selection of the Data Analytics And Decision Making In Cybernetics Cybernetic Systems Inspiration Pdf. These are designed to help you showcase your creativity and bring your sphere to life. Planning and Innovation are essential for any business that is just starting out. This collection contains the designs that you need for your everyday presentations. All of our PowerPoints are 100 percent editable, so you can customize them to suit your needs. This multi purpose template can be used in various situations. Grab these presentation templates today This slide tells data analytics and decision making. The purpose of this slide is to explain what is data analytics with its four categories. It also gives a description of descriptive and diagnostic data analysis.

Makeup And Skincare Market Overview Industry Report And Trend Analysis IR V
This Makeup And Skincare Market Overview Industry Report And Trend Analysis IR V is designed to help you retain your audiences attention. This content-ready PowerPoint Template enables you to take your audience on a journey and share information in a way that is easier to recall. It helps you highlight the crucial parts of your work so that the audience does not get saddled with information download. This forty slide PPT Deck comes prepared with the graphs and charts you could need to showcase your information through visuals. You only need to enter your own data in them. Download this editable PowerPoint Theme and walk into that meeting with confidence. Our Makeup And Skincare Market Overview Industry Report And Trend Analysis IR V are topically designed to provide an attractive backdrop to any subject. Use them to look like a presentation pro.
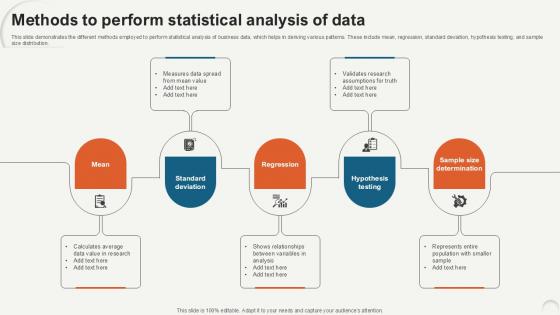
Methods To Perform Statistical Data Analytics For Informed Decision Ppt Presentation
This slide demonstrates the different methods employed to perform statistical analysis of business data, which helps in deriving various patterns. These include mean, regression, standard deviation, hypothesis testing, and sample size distribution. The best PPT templates are a great way to save time, energy, and resources. Slidegeeks have 100 percent editable powerpoint slides making them incredibly versatile. With these quality presentation templates, you can create a captivating and memorable presentation by combining visually appealing slides and effectively communicating your message. Download Methods To Perform Statistical Data Analytics For Informed Decision Ppt Presentation from Slidegeeks and deliver a wonderful presentation. This slide demonstrates the different methods employed to perform statistical analysis of business data, which helps in deriving various patterns. These include mean, regression, standard deviation, hypothesis testing, and sample size distribution.
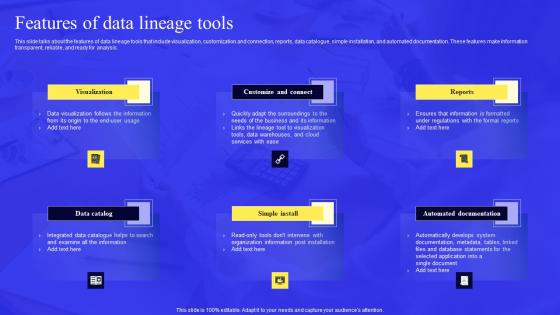
Business Process Data Lineage Features Of Data Lineage Tools Structure Pdf
This slide talks about the features of data lineage tools that include visualization, customization and connection, reports, data catalogue, simple installation, and automated documentation. These features make information transparent, reliable, and ready for analysis. The best PPT templates are a great way to save time, energy, and resources. Slidegeeks have 100 percent editable powerpoint slides making them incredibly versatile. With these quality presentation templates, you can create a captivating and memorable presentation by combining visually appealing slides and effectively communicating your message. Download Business Process Data Lineage Features Of Data Lineage Tools Structure Pdf from Slidegeeks and deliver a wonderful presentation. This slide talks about the features of data lineage tools that include visualization, customization and connection, reports, data catalogue, simple installation, and automated documentation. These features make information transparent, reliable, and ready for analysis.
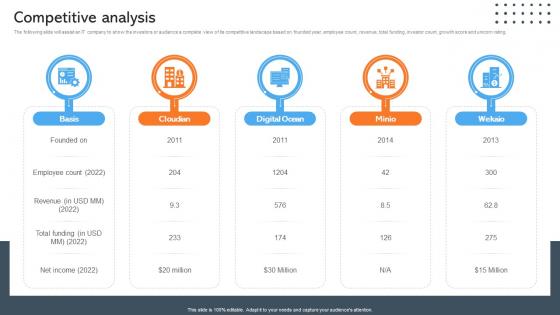
Competitive Analysis Data Management Company Investor Funding Pitch Deck
The following slide will assist an IT company to show the investors or audience a complete view of its competitive landscape based on founded year, employee count, revenue, total funding, investor count, growth score and unicorn rating. Want to ace your presentation in front of a live audience Our Competitive Analysis Data Management Company Investor Funding Pitch Deck can help you do that by engaging all the users towards you. Slidegeeks experts have put their efforts and expertise into creating these impeccable powerpoint presentations so that you can communicate your ideas clearly. Moreover, all the templates are customizable, and easy-to-edit and downloadable. Use these for both personal and commercial use. The following slide will assist an IT company to show the investors or audience a complete view of its competitive landscape based on founded year, employee count, revenue, total funding, investor count, growth score and unicorn rating.
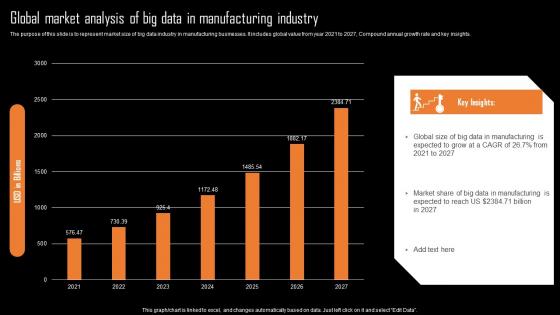
Global Market Analysis Of Big Data In Manufacturing Industry Information Pdf
The purpose of this slide is to represent market size of big data industry in manufacturing businesses. It includes global value from year 2021 to 2027, Compound annual growth rate and key insights.Showcasing this set of slides titled Global Market Analysis Of Big Data In Manufacturing Industry Information Pdf The topics addressed in these templates are Data Manufacturing, Expected Grow, Data Manufacturing All the content presented in this PPT design is completely editable. Download it and make adjustments in color, background, font etc. as per your unique business setting. The purpose of this slide is to represent market size of big data industry in manufacturing businesses. It includes global value from year 2021 to 2027, Compound annual growth rate and key insights.
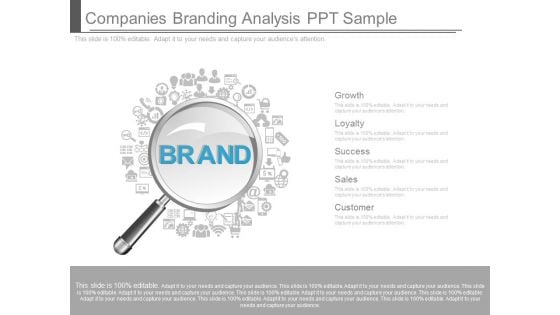
Companies Branding Analysis Ppt Sample
This is a companies branding analysis ppt sample. This is a five stage process. The stages in this process are growth, loyalty, success, sales, customer.
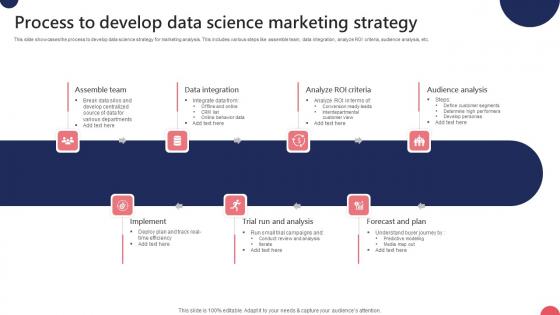
Process To Develop Data Science Marketing Strategy Ppt Portfolio Format Pdf
This slide showcases the process to develop data science strategy for marketing analysis. This includes various steps like assemble team, data integration, analyze ROI criteria, audience analysis, etc. Pitch your topic with ease and precision using this Process To Develop Data Science Marketing Strategy Ppt Portfolio Format Pdf. This layout presents information on Assemble Team, Data Integration, Analyze ROI Criteria. It is also available for immediate download and adjustment. So, changes can be made in the color, design, graphics or any other component to create a unique layout. This slide showcases the process to develop data science strategy for marketing analysis. This includes various steps like assemble team, data integration, analyze ROI criteria, audience analysis, etc.
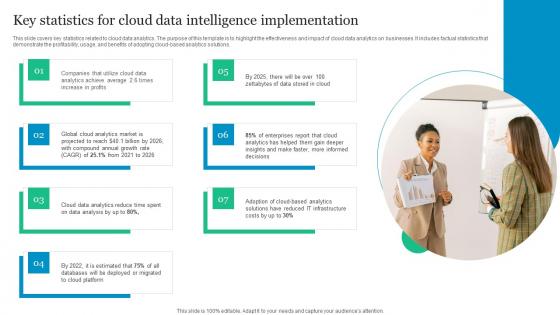
Key Statistics For Cloud Data Intelligence Implementation Download Pdf
This slide covers key statistics related to cloud data analytics. The purpose of this template is to highlight the effectiveness and impact of cloud data analytics on businesses. It includes factual statistics that demonstrate the profitability, usage, and benefits of adopting cloud based analytics solutions. Showcasing this set of slides titled Key Statistics For Cloud Data Intelligence Implementation Download Pdf. The topics addressed in these templates are Analytics Achieve Average, Growth Rate, Global Cloud Analytics. All the content presented in this PPT design is completely editable. Download it and make adjustments in color, background, font etc. as per your unique business setting. This slide covers key statistics related to cloud data analytics. The purpose of this template is to highlight the effectiveness and impact of cloud data analytics on businesses. It includes factual statistics that demonstrate the profitability, usage, and benefits of adopting cloud based analytics solutions.
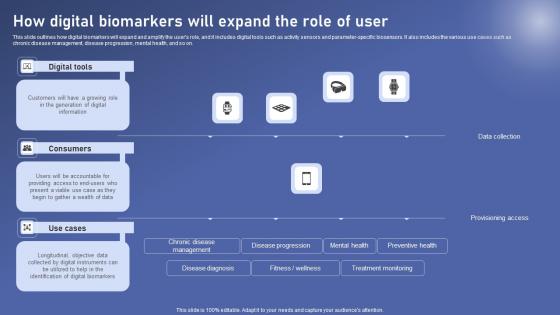
How Digital Biomarkers Expand Biomedical Data Science And Health Informatics Inspiration Pdf
This slide outlines how digital biomarkers will expand and amplify the users role, and it includes digital tools such as activity sensors and parameter specific biosensors. It also includes the various use cases such as chronic disease management, disease progression, mental health, and so on. The How Digital Biomarkers Expand Biomedical Data Science And Health Informatics Inspiration Pdf is a compilation of the most recent design trends as a series of slides. It is suitable for any subject or industry presentation, containing attractive visuals and photo spots for businesses to clearly express their messages. This template contains a variety of slides for the user to input data, such as structures to contrast two elements, bullet points, and slides for written information. Slidegeeks is prepared to create an impression. This slide outlines how digital biomarkers will expand and amplify the users role, and it includes digital tools such as activity sensors and parameter specific biosensors. It also includes the various use cases such as chronic disease management, disease progression, mental health, and so on.
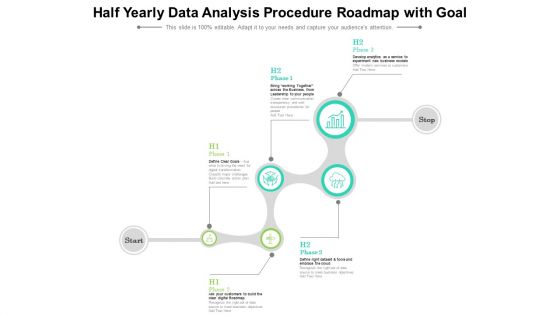
Half Yearly Data Analysis Procedure Roadmap With Goal Summary
Introducing our half yearly data analysis procedure roadmap with goal summary. This PPT presentation is Google Slides compatible, therefore, you can share it easily with the collaborators for measuring the progress. Also, the presentation is available in both standard screen and widescreen aspect ratios. So edit the template design by modifying the font size, font type, color, and shapes as per your requirements. As this PPT design is fully editable it can be presented in PDF, JPG and PNG formats.
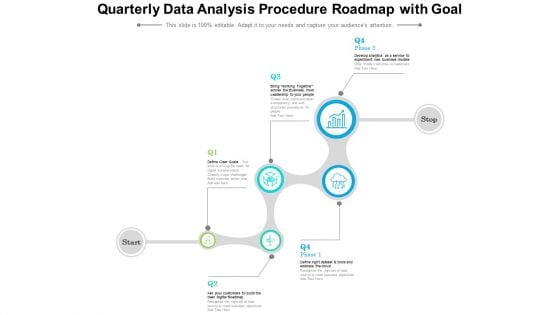
Quarterly Data Analysis Procedure Roadmap With Goal Summary
Introducing our quarterly data analysis procedure roadmap with goal summary. This PPT presentation is Google Slides compatible, therefore, you can share it easily with the collaborators for measuring the progress. Also, the presentation is available in both standard screen and widescreen aspect ratios. So edit the template design by modifying the font size, font type, color, and shapes as per your requirements. As this PPT design is fully editable it can be presented in PDF, JPG and PNG formats.
Half Yearly Strategy Roadmap For Data Analysis Icons
Introducing our half yearly strategy roadmap for data analysis icons. This PPT presentation is Google Slides compatible, therefore, you can share it easily with the collaborators for measuring the progress. Also, the presentation is available in both standard screen and widescreen aspect ratios. So edit the template design by modifying the font size, font type, color, and shapes as per your requirements. As this PPT design is fully editable it can be presented in PDF, JPG and PNG formats.


 Continue with Email

 Home
Home


