Progress Dashboard
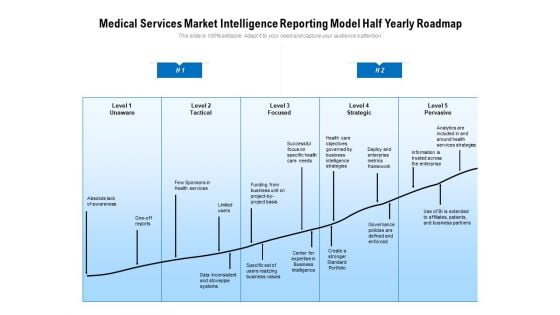
Medical Services Market Intelligence Reporting Model Half Yearly Roadmap Infographics
Introducing our medical services market intelligence reporting model half yearly roadmap infographics. This PPT presentation is Google Slides compatible, therefore, you can share it easily with the collaborators for measuring the progress. Also, the presentation is available in both standard screen and widescreen aspect ratios. So edit the template design by modifying the font size, font type, color, and shapes as per your requirements. As this PPT design is fully editable it can be presented in PDF, JPG and PNG formats.
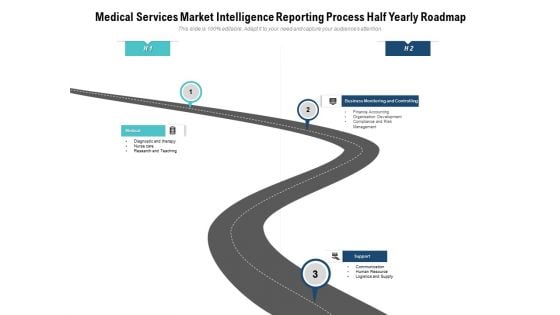
Medical Services Market Intelligence Reporting Process Half Yearly Roadmap Download
Introducing our medical services market intelligence reporting process half yearly roadmap download. This PPT presentation is Google Slides compatible, therefore, you can share it easily with the collaborators for measuring the progress. Also, the presentation is available in both standard screen and widescreen aspect ratios. So edit the template design by modifying the font size, font type, color, and shapes as per your requirements. As this PPT design is fully editable it can be presented in PDF, JPG and PNG formats.
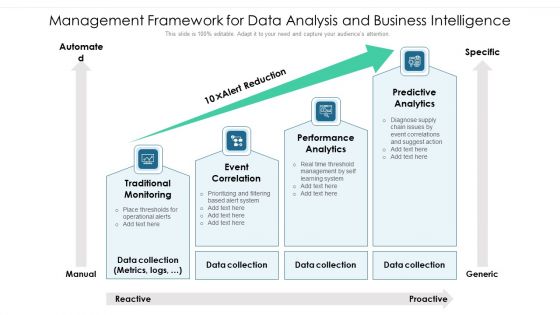
Management Framework For Data Analysis And Business Intelligence Ppt PowerPoint Presentation Layouts Smartart PDF
Persuade your audience using this management framework for data analysis and business intelligence ppt powerpoint presentation layouts smartart pdf. This PPT design covers four stages, thus making it a great tool to use. It also caters to a variety of topics including traditional monitoring, event correlation, performance analytics. Download this PPT design now to present a convincing pitch that not only emphasizes the topic but also showcases your presentation skills.
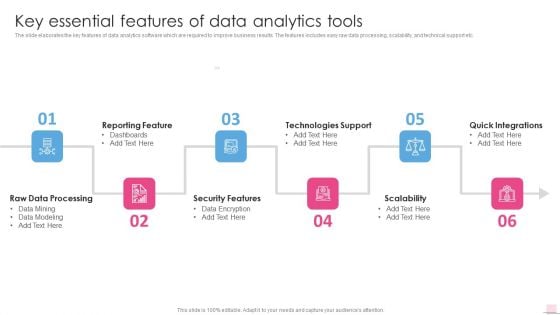
Key Essential Features Of Data Analytics Tools Business Analysis Modification Toolkit Structure PDF
The slide elaborates the key features of data analytics software which are required to improve business results. The features includes easy raw data processing, scalability, and technical support etc.This is a Key Essential Features Of Data Analytics Tools Business Analysis Modification Toolkit Structure PDF template with various stages. Focus and dispense information on six stages using this creative set, that comes with editable features. It contains large content boxes to add your information on topics like Reporting Feature, Security Features, Technologies Support. You can also showcase facts, figures, and other relevant content using this PPT layout. Grab it now.
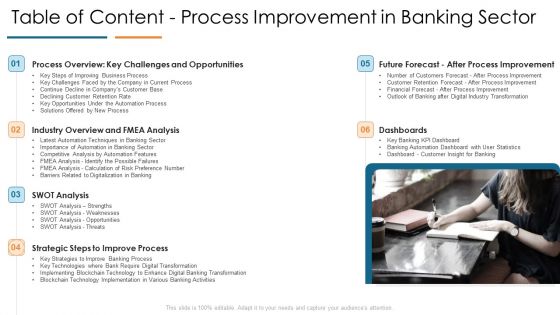
Table Of Content Process Improvement In Banking Sector Develop Organizational Productivity Enhancing Business Process Inspiration PDF
Presenting table of content process improvement in banking sector develop organizational productivity enhancing business process inspiration pdf to provide visual cues and insights. Share and navigate important information on six stages that need your due attention. This template can be used to pitch topics like analysis, opportunities, process, improvement, dashboards. In addtion, this PPT design contains high resolution images, graphics, etc, that are easily editable and available for immediate download.

Business Diagram Business Bar Graph For Data Analysis Presentation Template
This business slide displays pie charts with percentage ratios. This diagram is a data visualization tool that gives you a simple way to present statistical information. This slide helps your audience examines and interprets the data you present.
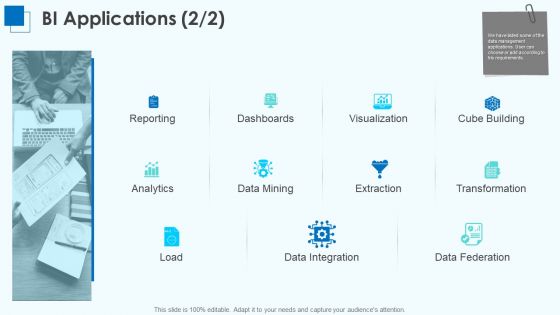
Corporate Intelligence Business Analysis BI Applications Load Ppt Pictures Rules PDF
This is a corporate intelligence business analysis bi applications load ppt pictures rules pdf template with various stages. Focus and dispense information on eleven stages using this creative set, that comes with editable features. It contains large content boxes to add your information on topics like reporting, analytics, data mining, dashboards, visualization. You can also showcase facts, figures, and other relevant content using this PPT layout. Grab it now.
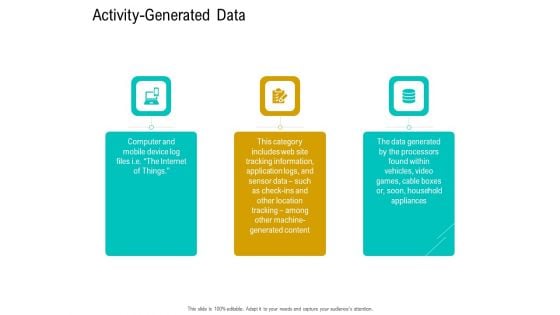
Business Data Analysis Activity Generated Data Guidelines PDF
This is a business data analysis activity generated data guidelines pdf template with various stages. Focus and dispense information on three stages using this creative set, that comes with editable features. It contains large content boxes to add your information on topics like the data generated by the processors found within vehicles, video games, cable boxes or, soon, household appliances, the data generated by the processors found within vehicles, video games, cable boxes or, soon, household appliances. You can also showcase facts, figures, and other relevant content using this PPT layout. Grab it now.
Weekly Workforce Productivity Tracking Report Structure PDF
The following slide depicts the insights of marketing work stream to monitor its progress. It includes elements such as activities, due date, reported person, planned and actual hours etc. Showcasing this set of slides titled Weekly Workforce Productivity Tracking Report Structure PDF. The topics addressed in these templates areDesign Marketing Campaign, Securing Database, Evaluate Campaign Results. All the content presented in this PPT design is completely editable. Download it and make adjustments in color, background, font etc. as per your unique business setting.

5 Steps Procedure Magnifying Glass Ppt PowerPoint Presentation Diagrams
This is a 5 steps procedure magnifying glass ppt powerpoint presentation diagrams. This is a five stage process. The stages in this process are technology, business, marketing, communication, success.
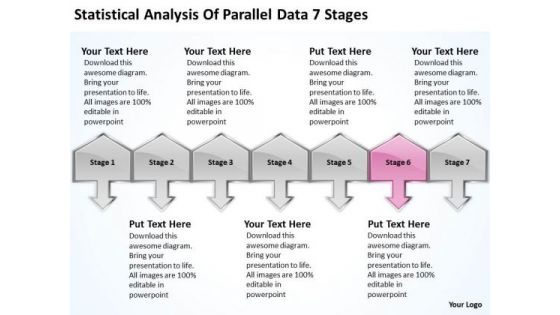
Statistical Analysis Of Parallel Data 7 Stages Business Planning Guide PowerPoint Slides
We present our statistical analysis of parallel data 7 stages business planning guide PowerPoint Slides.Download our Communication PowerPoint Templates because the mind is always whirring with new ideas. Use our Business PowerPoint Templates because watch the excitement levels rise as they realise their worth. Download our Arrows PowerPoint Templates because you know Coincidentally it will always point to the top. Use our Success PowerPoint Templates because they represent the proress in our lives. Use our Symbol PowerPoint Templates because with the help of our Slides you can Illustrate how each element flows seamlessly onto the next stage.Use these PowerPoint slides for presentations relating to 3d, Achievement, Action, Aim, Arrows, Black, Business, Color, Communication, Competition, Concept, Connection, Creative, Design, Different, Direction, Element, First, Forward, Graph, Graphic, Group, Growth, Higher, Icon, Illustration, Image, Isolated, Leader, Leadership, Line, Menu, Motion, Orange, Progress, Series, Seven, Sign, Slew, Solution, Success, Swerve, Symbol, Team, Teamwork, Turn, Up. The prominent colors used in the PowerPoint template are Pink, Gray, Black. Customers tell us our statistical analysis of parallel data 7 stages business planning guide PowerPoint Slides are Graceful. Use our Black PowerPoint templates and PPT Slides are Attractive. PowerPoint presentation experts tell us our statistical analysis of parallel data 7 stages business planning guide PowerPoint Slides are Nice. People tell us our Business PowerPoint templates and PPT Slides are Glamorous. We assure you our statistical analysis of parallel data 7 stages business planning guide PowerPoint Slides are Flirty. People tell us our Color PowerPoint templates and PPT Slides are Great. Scale mountains with our Statistical Analysis Of Parallel Data 7 Stages Business Planning Guide PowerPoint Slides. You will come out on top.
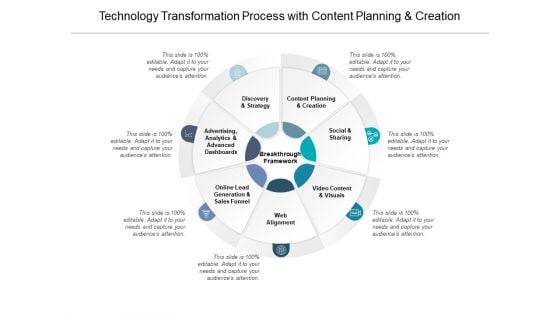
Technology Transformation Process With Content Planning And Creation Ppt PowerPoint Presentation Ideas Templates
Presenting this set of slides with name technology transformation process with content planning and creation ppt powerpoint presentation ideas templates. This is a seven stage process. The stages in this process are content planning and creation, social and sharing, video content and visuals, web alignment, online lead generation and sales funnel, advertising, analytics and advanced dashboards, discovery and strategy. This is a completely editable PowerPoint presentation and is available for immediate download. Download now and impress your audience.
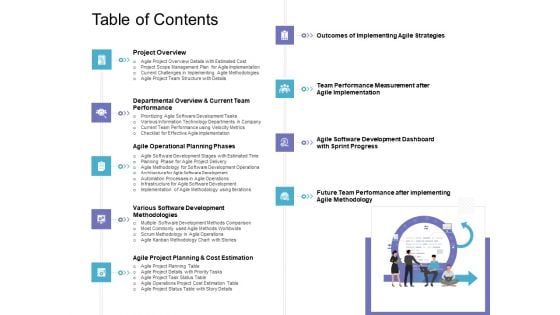
Executing Agile Operations Structured System Support Table Of Contents Template PDF
This is a executing agile operations structured system support table of contents template pdf template with various stages. Focus and dispense information on nine stages using this creative set, that comes with editable features. It contains large content boxes to add your information on topics like project overview, agile operational planning phases, development dashboard, team performance, agile project planning. You can also showcase facts, figures, and other relevant content using this PPT layout. Grab it now.

Oracle Analytics Cloud Application Roles Background PDF
This slide represents the oracle analytics aloud application roles. It includes BI service administrator, BI data model author, BI content writer, BI data load, DV content writer, and DV consumer. Deliver an awe inspiring pitch with this creative oracle analytics cloud application roles background pdf bundle. Topics like administrator, content, communicate, dashboards, visualizations can be discussed with this completely editable template. It is available for immediate download depending on the needs and requirements of the user.
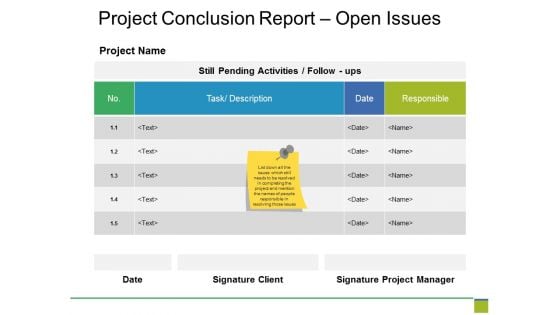
Project Conclusion Report Open Issues Ppt PowerPoint Presentation Outline Gallery
This is a project conclusion report open issues ppt powerpoint presentation outline gallery. This is a five stage process. The stages in this process are project name, table, data analysis, data analysis.
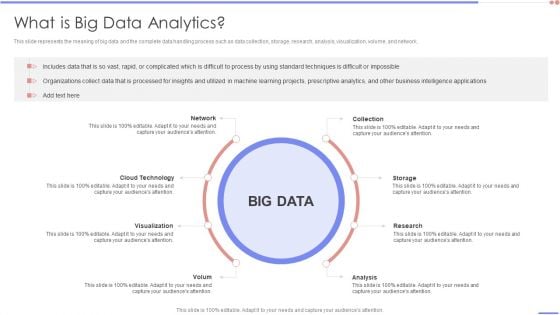
Data Analytics Management What Is Big Data Analytics Slides PDF
This slide represents the meaning of big data and the complete data handling process such as data collection, storage, research, analysis, visualization, volume, and network.This is a Data Analytics Management What Is Big Data Analytics Slides PDF template with various stages. Focus and dispense information on one stage using this creative set, that comes with editable features. It contains large content boxes to add your information on topics like Standard Techniques, Difficult Impossible, Intelligence. You can also showcase facts, figures, and other relevant content using this PPT layout. Grab it now.
Big Data Analysis Icon Data Analytic Business Ppt PowerPoint Presentation Complete Deck
Presenting this set of slides with name big data analysis icon data analytic business ppt powerpoint presentation complete deck. The topics discussed in these slides are data analytic, business, growth, gear, magnifying glass. This is a completely editable PowerPoint presentation and is available for immediate download. Download now and impress your audience.
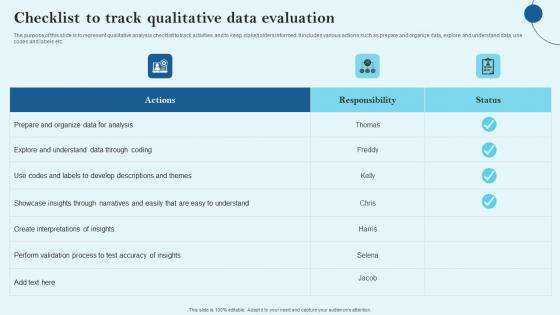
Checklist To Track Qualitative Data Evaluation Microsoft Pdf
The purpose of this slide is to represent qualitative analysis checklist to track activities and to keep stakeholders informed. It includes various actions such as prepare and organize data, explore and understand data, use codes and labels etc. Pitch your topic with ease and precision using this Checklist To Track Qualitative Data Evaluation Microsoft Pdf This layout presents information on Prepare And Organize, Data For Analysis, Responsibility It is also available for immediate download and adjustment. So, changes can be made in the color, design, graphics or any other component to create a unique layout. The purpose of this slide is to represent qualitative analysis checklist to track activities and to keep stakeholders informed. It includes various actions such as prepare and organize data, explore and understand data, use codes and labels etc.
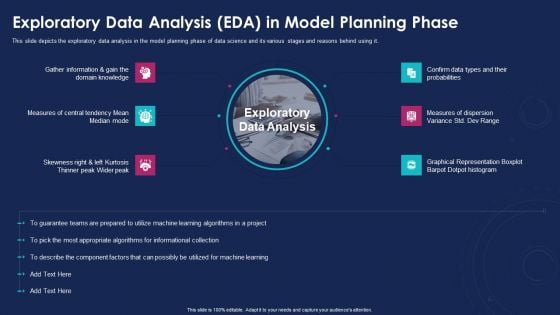
Data Analytics IT Exploratory Data Analysis EDA In Model Ppt Outline Inspiration PDF
This slide depicts the exploratory data analysis in the model planning phase of data science and its various stages and reasons behind using it. This is a data analytics it exploratory data analysis eda in model ppt outline inspiration pdf template with various stages. Focus and dispense information on six stages using this creative set, that comes with editable features. It contains large content boxes to add your information on topics like measures, probabilities, graphical representation. You can also showcase facts, figures, and other relevant content using this PPT layout. Grab it now.
Magnifier Glass Ppt PowerPoint Presentation Visual Aids
This is a magnifier glass ppt powerpoint presentation visual aids. This is a four stage process. The stages in this process are business, strategy, marketing, analysis, success, magnifier glass.
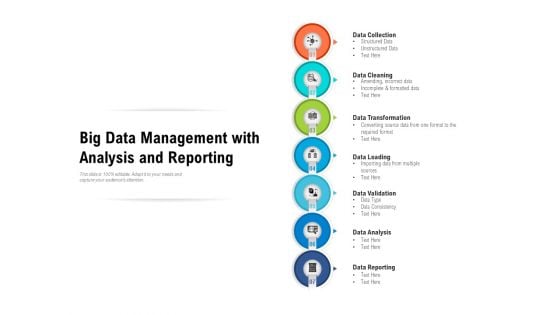
Big Data Management With Analysis And Reporting Ppt PowerPoint Presentation File Example Topics PDF
Presenting big data management with analysis and reporting ppt powerpoint presentation file example topics pdf to dispense important information. This template comprises seven stages. It also presents valuable insights into the topics including data collection, data cleaning, data transformation. This is a completely customizable PowerPoint theme that can be put to use immediately. So, download it and address the topic impactfully.
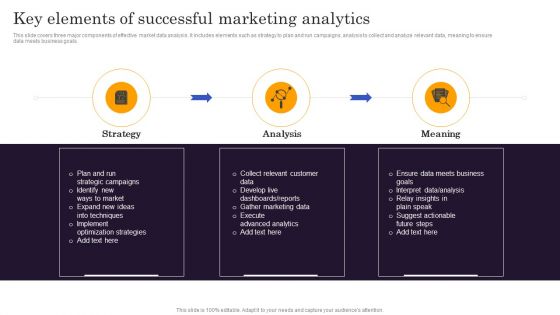
Marketers Guide To Data Analysis Optimization Key Elements Of Successful Marketing Analytics Slides PDF
This slide covers three major components of effective market data analysis. It includes elements such as strategy to plan and run campaigns, analysis to collect and analyze relevant data, meaning to ensure data meets business goals. Slidegeeks has constructed Marketers Guide To Data Analysis Optimization Key Elements Of Successful Marketing Analytics Slides PDF after conducting extensive research and examination. These presentation templates are constantly being generated and modified based on user preferences and critiques from editors. Here, you will find the most attractive templates for a range of purposes while taking into account ratings and remarks from users regarding the content. This is an excellent jumping off point to explore our content and will give new users an insight into our top notch PowerPoint Templates.
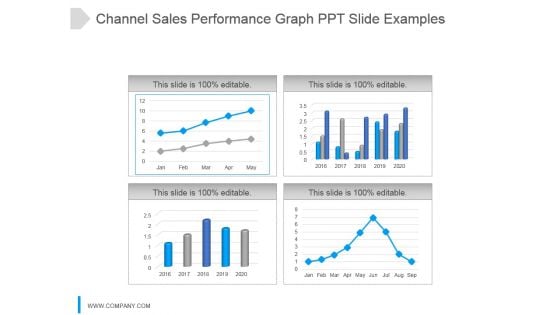
Channel Sales Performance Graph Ppt Slide Examples
This is a channel sales performance graph ppt slide examples. This is a four stage process. The stages in this process are jan, feb, mar, apr, may, jun, jul, aug, sep.
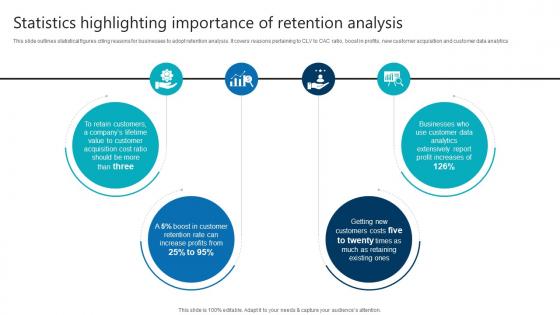
Statistics Highlighting Importance Of Retention Analysis Product Analytics Implementation Data Analytics V
This slide outlines statistical figures citing reasons for businesses to adopt retention analysis. It covers reasons pertaining to CLV to CAC ratio, boost in profits, new customer acquisition and customer data analyticsAre you in need of a template that can accommodate all of your creative concepts This one is crafted professionally and can be altered to fit any style. Use it with Google Slides or PowerPoint. Include striking photographs, symbols, depictions, and other visuals. Fill, move around, or remove text boxes as desired. Test out color palettes and font mixtures. Edit and save your work, or work with colleagues. Download Statistics Highlighting Importance Of Retention Analysis Product Analytics Implementation Data Analytics V and observe how to make your presentation outstanding. Give an impeccable presentation to your group and make your presentation unforgettable. This slide outlines statistical figures citing reasons for businesses to adopt retention analysis. It covers reasons pertaining to CLV to CAC ratio, boost in profits, new customer acquisition and customer data analytics
Information Analysis For Secondary Market Research Vector Icon Ppt PowerPoint Presentation Gallery Brochure PDF
Presenting information analysis for secondary market research vector icon ppt powerpoint presentation gallery brochure pdf to dispense important information. This template comprises three stages. It also presents valuable insights into the topics including information analysis for secondary market research vector icon. This is a completely customizable PowerPoint theme that can be put to use immediately. So, download it and address the topic impactfully.
Marketing Strategy Analysis Icon With Check Mark Ppt PowerPoint Presentation File Slide Portrait PDF
Presenting marketing strategy analysis icon with check mark ppt powerpoint presentation file slide portrait pdf to dispense important information. This template comprises three stages. It also presents valuable insights into the topics including marketing strategy analysis icon with check mark. This is a completely customizable PowerPoint theme that can be put to use immediately. So, download it and address the topic impactfully.
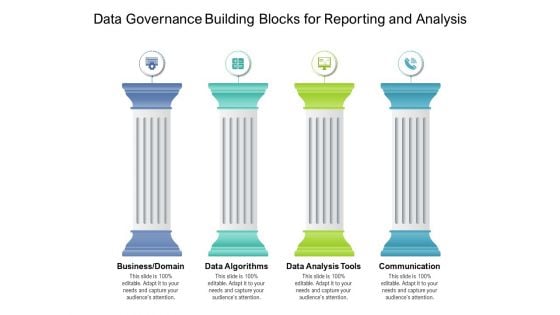
Data Governance Building Blocks For Reporting And Analysis Ppt PowerPoint Presentation Gallery Example PDF
Presenting this set of slides with name data governance building blocks for reporting and analysis ppt powerpoint presentation gallery example pdf. This is a four stage process. The stages in this process are business, data algorithms, data analysis. This is a completely editable PowerPoint presentation and is available for immediate download. Download now and impress your audience.
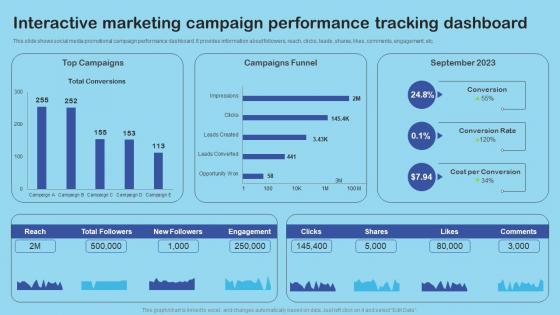
Interactive Marketing Campaign Performance Enhance Client Engagement With Interactive Pictures Pdf
This slide shows social media promotional campaign performance dashboard. It provides information about followers, reach, clicks, leads, shares, likes, comments, engagement, etc. Whether you have daily or monthly meetings, a brilliant presentation is necessary. Interactive Marketing Campaign Performance Enhance Client Engagement With Interactive Pictures Pdf can be your best option for delivering a presentation. Represent everything in detail using Interactive Marketing Campaign Performance Enhance Client Engagement With Interactive Pictures Pdf and make yourself stand out in meetings. The template is versatile and follows a structure that will cater to your requirements. All the templates prepared by Slidegeeks are easy to download and edit. Our research experts have taken care of the corporate themes as well. So, give it a try and see the results. This slide shows social media promotional campaign performance dashboard. It provides information about followers, reach, clicks, leads, shares, likes, comments, engagement, etc.
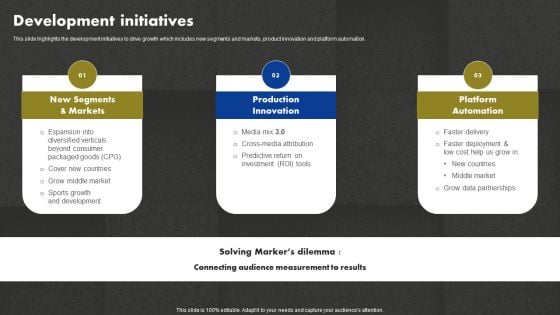
Data And Customer Analysis Company Outline Development Initiatives Pictures PDF
Man Doing Data Analysis And Reporting Ppt PowerPoint Presentation Icon Portfolio PDF
Presenting this set of slides with name man doing data analysis and reporting ppt powerpoint presentation icon portfolio pdf. This is a three stage process. The stages in this process are man doing data analysis and reporting. This is a completely editable PowerPoint presentation and is available for immediate download. Download now and impress your audience.

Mutually Beneficial Supplier Relations Ppt PowerPoint Presentation File Templates
This is a mutually beneficial supplier relations ppt powerpoint presentation file templates. This is a one stage process. The stages in this process are magnifier, search, marketing, strategy, analysis, business.
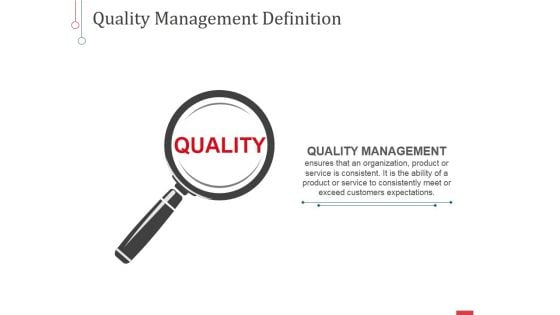
Quality Ppt PowerPoint Presentation Infographic Template Sample
This is a quality ppt powerpoint presentation infographic template sample. This is a one stage process. The stages in this process are quality management, magnifier, search, marketing, strategy, analysis, business.
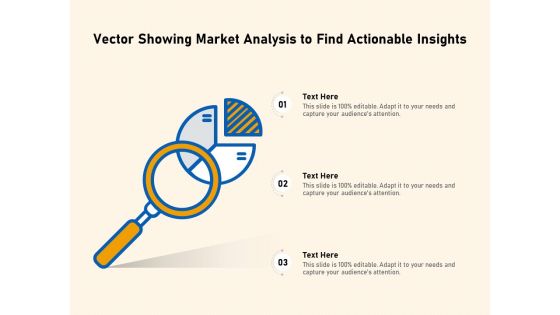
Vector Showing Market Analysis To Find Actionable Insights Ppt PowerPoint Presentation Professional Graphics Example PDF
Persuade your audience using this vector showing market analysis to find actionable insights ppt powerpoint presentation professional graphics example pdf. This PPT design covers three stages, thus making it a great tool to use. It also caters to a variety of topics including vector showing market analysis to find actionable insights. Download this PPT design now to present a convincing pitch that not only emphasizes the topic but also showcases your presentation skills.
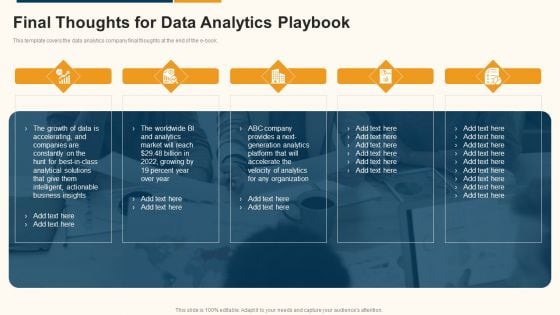
Data Interpretation And Analysis Playbook Final Thoughts For Data Analytics Playbook Graphics PDF
This template covers the data analytics company final thoughts at the end of the e-book. This is a data interpretation and analysis playbook final thoughts for data analytics playbook graphics pdf template with various stages. Focus and dispense information on five stages using this creative set, that comes with editable features. It contains large content boxes to add your information on topics like business, analytics, growth, organization. You can also showcase facts, figures, and other relevant content using this PPT layout. Grab it now.
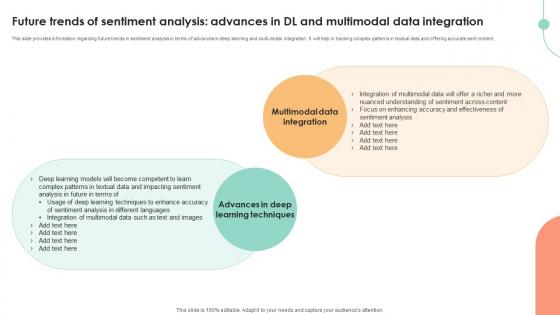
Future Trends Of Sentiment Analysis Advances Decoding User Emotions In Depth Exploration AI SS V
This slide provides information regarding future trends in sentiment analysis in terms of advances in deep learning and multi-modal integration. It will help in tracking complex patterns in textual data and offering accurate sent content. This Future Trends Of Sentiment Analysis Advances Decoding User Emotions In Depth Exploration AI SS V is perfect for any presentation, be it in front of clients or colleagues. It is a versatile and stylish solution for organizing your meetings. The Future Trends Of Sentiment Analysis Advances Decoding User Emotions In Depth Exploration AI SS V features a modern design for your presentation meetings. The adjustable and customizable slides provide unlimited possibilities for acing up your presentation. Slidegeeks has done all the homework before launching the product for you. So, do not wait, grab the presentation templates today This slide provides information regarding future trends in sentiment analysis in terms of advances in deep learning and multi-modal integration. It will help in tracking complex patterns in textual data and offering accurate sent content.
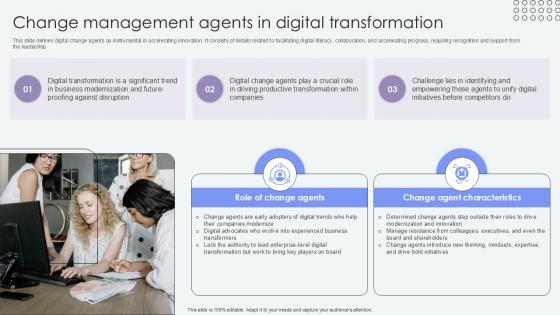
Change Management Agents In Digital Agents Of Change Pioneers PPT Sample CM SS V
This slide defines digital change agents as instrumental in accelerating innovation. It consists of details related to facilitating digital literacy, collaboration, and accelerating progress, requiring recognition and support from the leadership. Slidegeeks is here to make your presentations a breeze with Change Management Agents In Digital Agents Of Change Pioneers PPT Sample CM SS V With our easy-to-use and customizable templates, you can focus on delivering your ideas rather than worrying about formatting. With a variety of designs to choose from, you are sure to find one that suits your needs. And with animations and unique photos, illustrations, and fonts, you can make your presentation pop. So whether you are giving a sales pitch or presenting to the board, make sure to check out Slidegeeks first This slide defines digital change agents as instrumental in accelerating innovation. It consists of details related to facilitating digital literacy, collaboration, and accelerating progress, requiring recognition and support from the leadership.
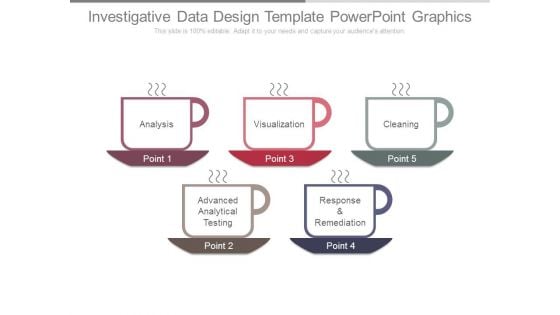
Investigative Data Design Template Powerpoint Graphics
This is a investigative data design template powerpoint graphics. This is a five stage process. The stages in this process are analysis, visualization, cleaning, response and remediation, advanced analytical testing.
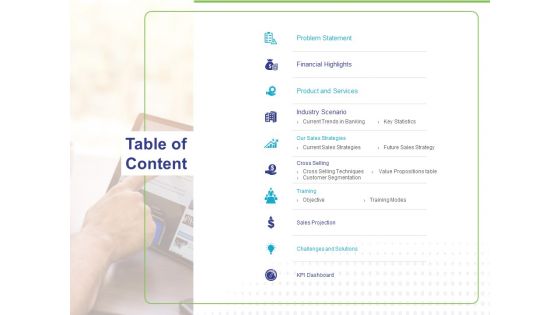
Commodity Up Selling Table Of Content Ppt Show Ideas PDF
Presenting this set of slides with name commodity up selling table of content ppt show ideas pdf. This is a ten stage process. The stages in this process are problem statement, financial highlights, product and services, industry scenario, training, sales projection, challenges and solutions, kpi dashboard. This is a completely editable PowerPoint presentation and is available for immediate download. Download now and impress your audience.
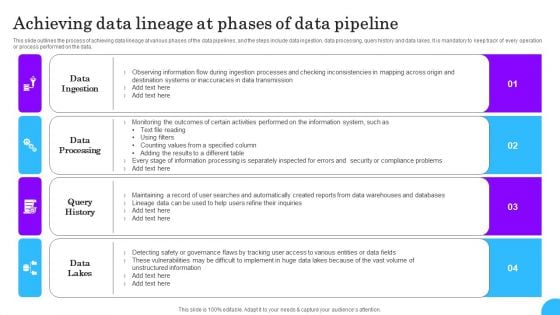
Comprehensive Analysis Of Different Data Lineage Classification Achieving Data Lineage At Phases Data Structure PDF
This slide outlines the process of achieving data lineage at various phases of the data pipelines, and the steps include data ingestion, data processing, query history and data lakes. It is mandatory to keep track of every operation or process performed on the data. Create an editable Comprehensive Analysis Of Different Data Lineage Classification Achieving Data Lineage At Phases Data Structure PDF that communicates your idea and engages your audience. Whether you are presenting a business or an educational presentation, pre designed presentation templates help save time. Comprehensive Analysis Of Different Data Lineage Classification Achieving Data Lineage At Phases Data Structure PDF is highly customizable and very easy to edit, covering many different styles from creative to business presentations. Slidegeeks has creative team members who have crafted amazing templates. So, go and get them without any delay.

Splunk Analysis Of Big Data To Assess Business Value Sample Pdf
Following slide showcases splunk big data analysis to evaluate business value. The purpose of this slide is to help businesses in forming better decisions by providing insights into their data. It includes components such as search, deploy, proactive monitoring, etc. Showcasing this set of slides titled Splunk Analysis Of Big Data To Assess Business Value Sample Pdf The topics addressed in these templates are Enterprise Scalability, Operational Intelligence All the content presented in this PPT design is completely editable. Download it and make adjustments in color, background, font etc. as per your unique business setting. Following slide showcases splunk big data analysis to evaluate business value. The purpose of this slide is to help businesses in forming better decisions by providing insights into their data. It includes components such as search, deploy, proactive monitoring, etc.
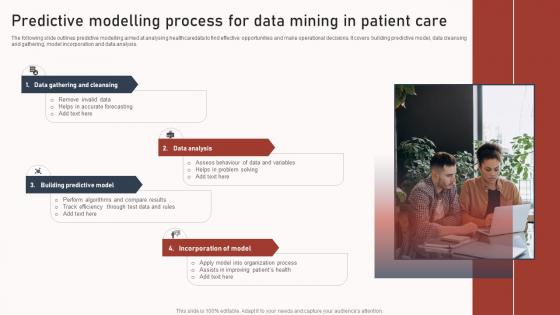
Predictive Modelling Process For Data Mining In Patient Care Slides Pdf
The following slide outlines predictive modelling aimed at analysing healthcaredata to find effective opportunities and make operational decisions. It covers building predictive model, data cleansing and gathering, model incorporation and data analysis. Showcasing this set of slides titled Predictive Modelling Process For Data Mining In Patient Care Slides Pdf. The topics addressed in these templates are Data Gathering Cleansing, Data Analysis, Incorporation Model. All the content presented in this PPT design is completely editable. Download it and make adjustments in color, background, font etc. as per your unique business setting. The following slide outlines predictive modelling aimed at analysing healthcaredata to find effective opportunities and make operational decisions. It covers building predictive model, data cleansing and gathering, model incorporation and data analysis.
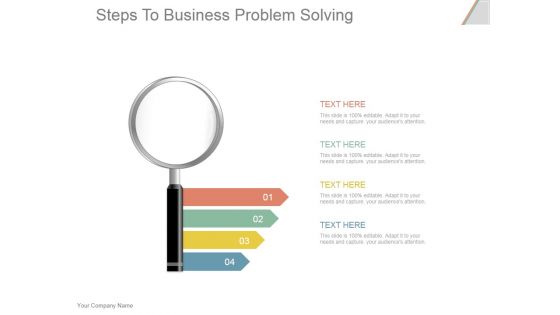
Steps To Business Problem Solving Ppt PowerPoint Presentation Deck
This is a steps to business problem solving ppt powerpoint presentation deck. This is a four stage process. The stages in this process are business, success, big data analysis, arrow, strategy.

Performing Basket Analysis In Ecommerce Using Data Mining Tools To Optimize Processes AI SS V
This slide showcases basket analysis, a data mining technique which can guide ecommerce websites to identify customer insights properly. It provides details about product affinities, shopper profile, planograms, product combos, etc. Presenting this PowerPoint presentation, titled Performing Basket Analysis In Ecommerce Using Data Mining Tools To Optimize Processes AI SS V, with topics curated by our researchers after extensive research. This editable presentation is available for immediate download and provides attractive features when used. Download now and captivate your audience. Presenting this Performing Basket Analysis In Ecommerce Using Data Mining Tools To Optimize Processes AI SS V. Our researchers have carefully researched and created these slides with all aspects taken into consideration. This is a completely customizable Performing Basket Analysis In Ecommerce Using Data Mining Tools To Optimize Processes AI SS V that is available for immediate downloading. Download now and make an impact on your audience. Highlight the attractive features available with our PPTs. This slide showcases basket analysis, a data mining technique which can guide ecommerce websites to identify customer insights properly. It provides details about product affinities, shopper profile, planograms, product combos, etc.
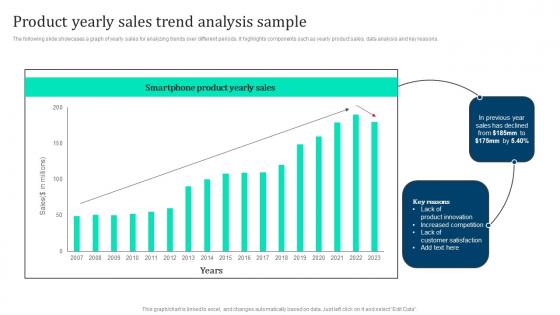
Product Yearly Sales Trend Analysis Marketing Intelligence Guide Data Gathering Introduction Pdf
The following slide showcases a graph of yearly sales for analyzing trends over different periods. It highlights components such as yearly product sales, data analysis and key reasons. Create an editable Product Yearly Sales Trend Analysis Marketing Intelligence Guide Data Gathering Introduction Pdf that communicates your idea and engages your audience. Whether you are presenting a business or an educational presentation, pre designed presentation templates help save time. Product Yearly Sales Trend Analysis Marketing Intelligence Guide Data Gathering Introduction Pdf is highly customizable and very easy to edit, covering many different styles from creative to business presentations. Slidegeeks has creative team members who have crafted amazing templates. So, go and get them without any delay. The following slide showcases a graph of yearly sales for analyzing trends over different periods. It highlights components such as yearly product sales, data analysis and key reasons.
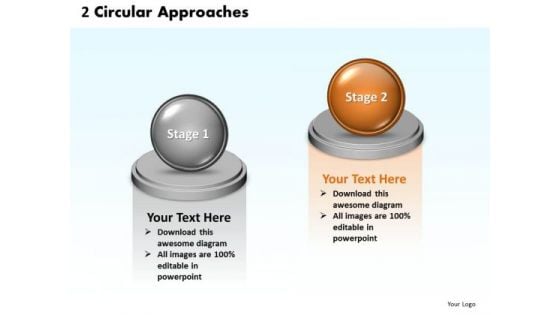
Ppt 3d Animated 2 PowerPoint Presentation Circular Corresponding Approaches Templates
PPT 3d animated 2 powerpoint presentation circular corresponding approaches Templates-This 3D animated Circular approaches diagram allows presenters to illustrate Contrasting approaches.-PPT 3d animated 2 powerpoint presentation circular corresponding approaches Templates-3d, Abstract, Backgrounds, Ball, Business, Choice, Comparison, Concept, Descriptive, Equilibrium, Grow, Illustrations, Instrument, Measurement, Metallic, Part, Partnership, Pattern, Progress, Reflections, Scales, Several, Sphere, Strategy, Success Get on board the bandwagon with your ideas. Book your berth with our Ppt 3d Animated 2 PowerPoint Presentation Circular Corresponding Approaches Templates.
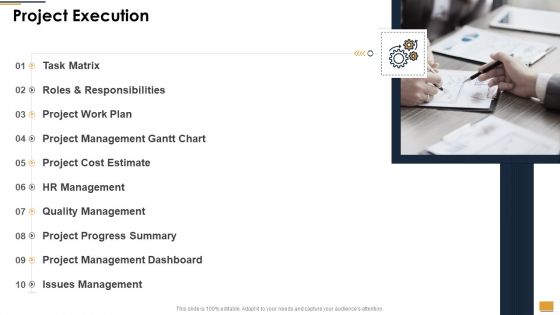
Project Ideation And Administration Project Execution Ppt Professional Background Images PDF
This is a project ideation and administration project execution ppt professional background images pdf template with various stages. Focus and dispense information on ten stages using this creative set, that comes with editable features. It contains large content boxes to add your information on topics like project management dashboard, quality management, project management gantt chart, project cost estimate. You can also showcase facts, figures, and other relevant content using this PPT layout. Grab it now.
Medical Services Market Intelligence Reporting And Solutions Half Yearly Roadmap Icons
Introducing our medical services market intelligence reporting and solutions half yearly roadmap icons. This PPT presentation is Google Slides compatible, therefore, you can share it easily with the collaborators for measuring the progress. Also, the presentation is available in both standard screen and widescreen aspect ratios. So edit the template design by modifying the font size, font type, color, and shapes as per your requirements. As this PPT design is fully editable it can be presented in PDF, JPG and PNG formats.
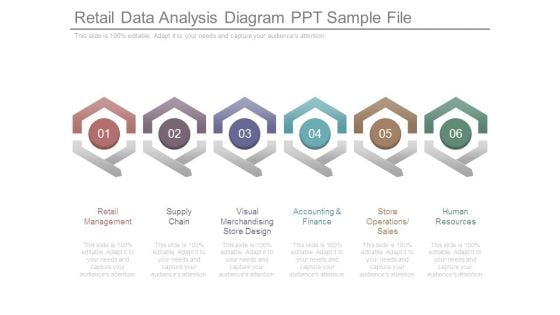
Retail Data Analysis Diagram Ppt Sample File
This is a retail data analysis diagram ppt sample file. This is a six stage process. The stages in this process are retail management, supply chain, visual merchandising store design, accounting and finance, store operations sales, human resources.
Cloud Computing Data Performance Gap Analysis Icon Microsoft PDF
Persuade your audience using this Cloud Computing Data Performance Gap Analysis Icon Microsoft PDF. This PPT design covers three stages, thus making it a great tool to use. It also caters to a variety of topics including Cloud Computing Data, Performance Gap Analysis Icon. Download this PPT design now to present a convincing pitch that not only emphasizes the topic but also showcases your presentation skills.
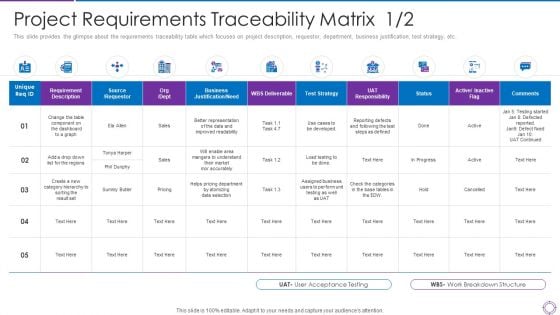
Project Administration Planning Project Requirements Traceability Matrix Business Ppt PowerPoint Presentation File Example PDF
This slide provides the glimpse about the requirements traceability table which focuses on project description, requestor, department, business justification, test strategy, etc. Deliver and pitch your topic in the best possible manner with this project administration planning project requirements traceability matrix business ppt powerpoint presentation file example pdf. Use them to share invaluable insights on dashboard, responsibility, strategy, business, source and impress your audience. This template can be altered and modified as per your expectations. So, grab it now.
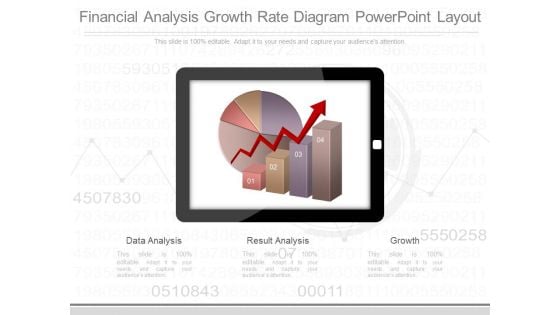
Financial Analysis Growth Rate Diagram Powerpoint Layout
This is a financial analysis growth rate diagram powerpoint layout. This is a three stage process. The stages in this process are data analysis, result analysis, growth.
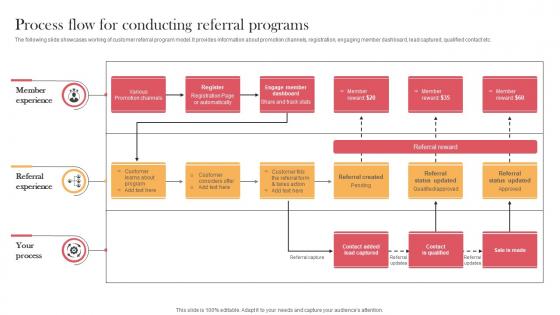
Process Flow For Conducting Referral Programs Designing Approaches Pictures Pdf
The following slide showcases working of customer referral program model. It provides information about promotion channels, registration, engaging member dashboard, lead captured, qualified contact etc. Are you searching for a Process Flow For Conducting Referral Programs Designing Approaches Pictures Pdf that is uncluttered, straightforward, and original Its easy to edit, and you can change the colors to suit your personal or business branding. For a presentation that expresses how much effort you have put in, this template is ideal With all of its features, including tables, diagrams, statistics, and lists, its perfect for a business plan presentation. Make your ideas more appealing with these professional slides. Download Process Flow For Conducting Referral Programs Designing Approaches Pictures Pdf from Slidegeeks today. The following slide showcases working of customer referral program model. It provides information about promotion channels, registration, engaging member dashboard, lead captured, qualified contact etc.
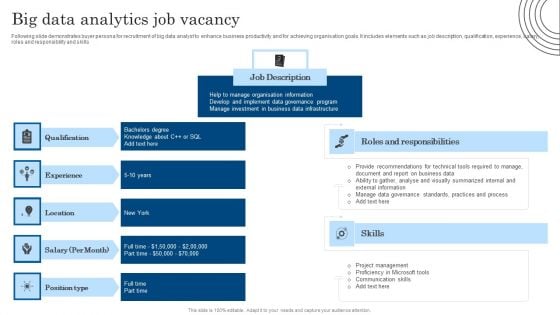
Big Data Analytics Job Vacancy Demonstration PDF
Following slide demonstrates buyer persona for recruitment of big data analyst to enhance business productivity and for achieving organisation goals. It includes elements such as job description, qualification, experience, salary, roles and responsibility and skills. Pitch your topic with ease and precision using this Big Data Analytics Job Vacancy Demonstration PDF. This layout presents information on Location, Information, Internal. It is also available for immediate download and adjustment. So, changes can be made in the color, design, graphics or any other component to create a unique layout.
Variance Analysis Techniques And Models Efficient Operations Cycle Icon Introduction PDF
Persuade your audience using this variance analysis techniques and models efficient operations cycle icon introduction pdf. This PPT design covers four stages, thus making it a great tool to use. It also caters to a variety of topics including variance analysis techniques and models efficient operations cycle icon. Download this PPT design now to present a convincing pitch that not only emphasizes the topic but also showcases your presentation skills.

Products And Services Offered Ovation Capital Funding Pitch Deck Mockup Pdf
This slide covers products and services offered by company. It involves services such as customer feedback, surveys, online reviews, customer dashboard, text marketing and enterprise reporting. Do you know about Slidesgeeks Products And Services Offered Ovation Capital Funding Pitch Deck Mockup Pdf These are perfect for delivering any kind od presentation. Using it, create PowerPoint presentations that communicate your ideas and engage audiences. Save time and effort by using our pre designed presentation templates that are perfect for a wide range of topic. Our vast selection of designs covers a range of styles, from creative to business, and are all highly customizable and easy to edit. Download as a PowerPoint template or use them as Google Slides themes. This slide covers products and services offered by company. It involves services such as customer feedback, surveys, online reviews, customer dashboard, text marketing and enterprise reporting.
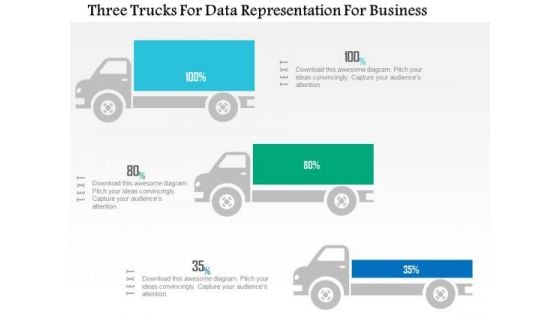
Business Diagram Three Trucks For Data Representation For Business PowerPoint Slide
This business diagram displays three trucks graphic. This diagram contains trucks for percentage value growth. Use this diagram to display business growth over a period of time.

Overview Optimizing Business Intelligence With Erp Erp And Digital Transformation For Maximizing DT SS V
This slide presents an overview of how transforming ERP helps in optimizing business intelligence. It includes features advanced analytics, customizable dashboards, data integration, predictive analytics, ad hoc reporting, etc.Welcome to our selection of the Overview Optimizing Business Intelligence With Erp Erp And Digital Transformation For Maximizing DT SS V. These are designed to help you showcase your creativity and bring your sphere to life. Planning and Innovation are essential for any business that is just starting out. This collection contains the designs that you need for your everyday presentations. All of our PowerPoints are 100 percent editable, so you can customize them to suit your needs. This multi-purpose template can be used in various situations. Grab these presentation templates today. This slide presents an overview of how transforming ERP helps in optimizing business intelligence. It includes features advanced analytics, customizable dashboards, data integration, predictive analytics, ad hoc reporting, etc.

Before Vs After Data Integration Implementation Data Integration Strategies For Business
This slide showcases the comparative analysis of the before versus after data integration implementation. The purpose of this slide is to discuss the different performance aspects and how data management has proved beneficial for these aspects. Get a simple yet stunning designed Before Vs After Data Integration Implementation Data Integration Strategies For Business. It is the best one to establish the tone in your meetings. It is an excellent way to make your presentations highly effective. So, download this PPT today from Slidegeeks and see the positive impacts. Our easy-to-edit Before Vs After Data Integration Implementation Data Integration Strategies For Business can be your go-to option for all upcoming conferences and meetings. So, what are you waiting for Grab this template today. This slide showcases the comparative analysis of the before versus after data integration implementation. The purpose of this slide is to discuss the different performance aspects and how data management has proved beneficial for these aspects.

Key Benefits Of Customer Journey Mapping Product Analytics Implementation Data Analytics V
This slide outlines benefits of journey mapping aimed at tracking customer activities to make data driven decisions. It covers major benefits such as team alignment, customer retention, improvement in messaging and customer centric culture with key drivers This Key Benefits Of Customer Journey Mapping Product Analytics Implementation Data Analytics V from Slidegeeks makes it easy to present information on your topic with precision. It provides customization options, so you can make changes to the colors, design, graphics, or any other component to create a unique layout. It is also available for immediate download, so you can begin using it right away. Slidegeeks has done good research to ensure that you have everything you need to make your presentation stand out. Make a name out there for a brilliant performance. This slide outlines benefits of journey mapping aimed at tracking customer activities to make data driven decisions. It covers major benefits such as team alignment, customer retention, improvement in messaging and customer centric culture with key drivers
Key Elements Successful Major Promotional Analytics Future Trends Summary Pdf
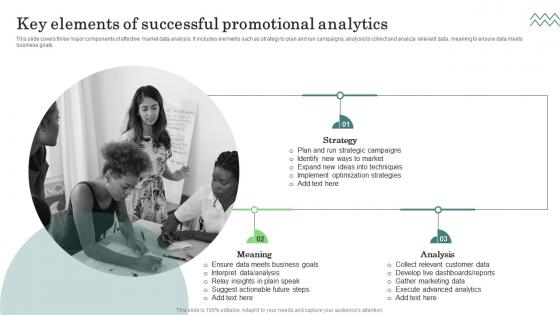
This slide covers three major components of effective market data analysis. It includes elements such as strategy to plan and run campaigns, analysis to collect and analyze relevant data, meaning to ensure data meets business goals. Explore a selection of the finest Key Elements Successful Major Promotional Analytics Future Trends Summary Pdf here. With a plethora of professionally designed and pre made slide templates, you can quickly and easily find the right one for your upcoming presentation. You can use our Key Elements Successful Major Promotional Analytics Future Trends Summary Pdf to effectively convey your message to a wider audience. Slidegeeks has done a lot of research before preparing these presentation templates. The content can be personalized and the slides are highly editable. Grab templates today from Slidegeeks. This slide covers three major components of effective market data analysis. It includes elements such as strategy to plan and run campaigns, analysis to collect and analyze relevant data, meaning to ensure data meets business goals.


 Continue with Email

 Home
Home


