Progress Meter
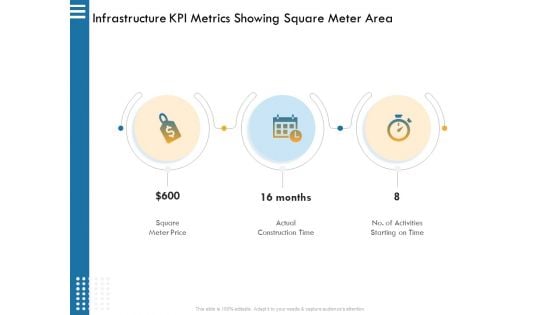
IT Infrastructure Governance Infrastructure KPI Metrics Showing Square Meter Area Ppt Infographics Guide PDF
Presenting it infrastructure governance infrastructure kpi metrics showing square meter area ppt infographics guide pdf. to provide visual cues and insights. Share and navigate important information on three stages that need your due attention. This template can be used to pitch topics like square meter price actual, construction time, no. activities starting time. In addtion, this PPT design contains high resolution images, graphics, etc, that are easily editable and available for immediate download.
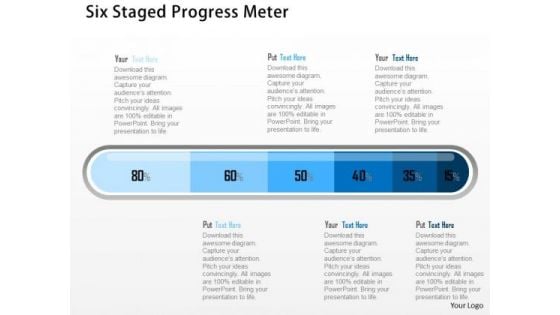
Business Diagram Six Staged Progress Meter Presentation Template
Our above business slide displays graphics of progress meter. This slide can be used as value chain example. This diagram provides an effective way of displaying information you can edit text, color, shade and style as per you need.
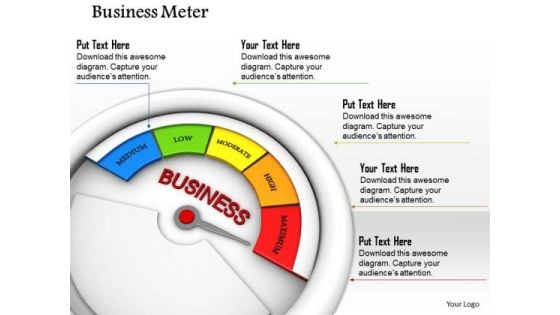
Stock Photo Business Meter Displaying Maximum Value PowerPoint Slide
This PowerPoint slide displays business meter displaying maximum value. This image slide has been crafted with graphic of business meter with values. This image depicts business progress. Use this image slide to express views on success and achievements in your presentations. This image slide may also be used to display successful business model. Enhance the quality of your presentations using this image.
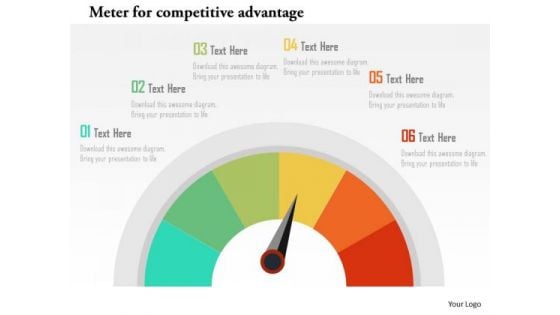
Meter For Competitive Advantage Presentation Template
This pre-designed diagram of meter signifies the concept of competitive advantage. This template is carefully designed to look interesting and informative. Use this theme to give unified look to your presentations.
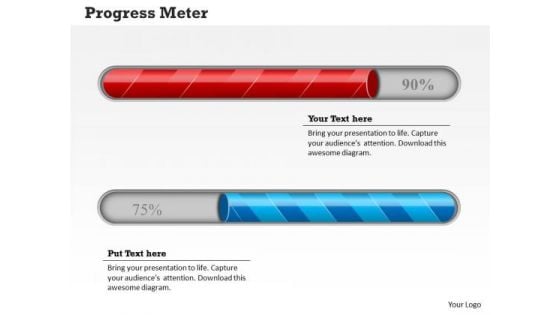
Strategy Diagram Meter Design For Business Progress Sales Diagram
Our Strategy Diagram Meter Design For Business Progress Sales Diagram Powerpoint Templates Abhor Doodling. They Never Let The Interest Flag.
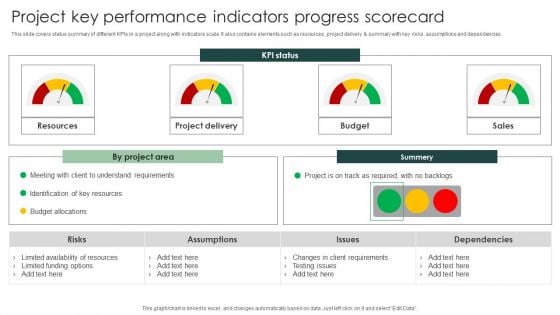
Project Key Performance Indicators Progress Scorecard Portrait PDF
This slide covers status summary of different KPIs in a project along with indicators scale. It also contains elements such as resources , project delivery summary with key risks, assumptions and dependencies.Pitch your topic with ease and precision using this Project Key Performance Indicators Progress Scorecard Portrait PDF. This layout presents information on Limited Availability Resources, Limited Funding Options, Key Resources . It is also available for immediate download and adjustment. So, changes can be made in the color, design, graphics or any other component to create a unique layout.
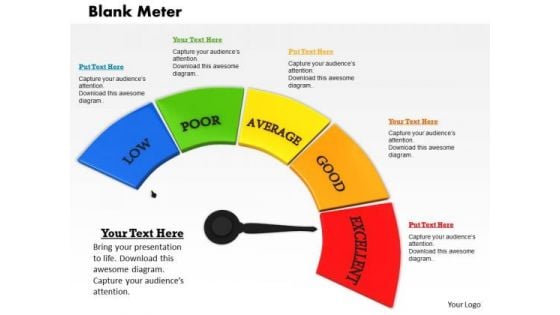
Stock Photo 3d Unique Meter With Low Medium And High Value PowerPoint Slide
This professional image displays graphics of conceptual meter. This meter depicts various levels. You can download this image to make presentations on team performance. Above image provides the ideal backdrop to make interactive presentations.
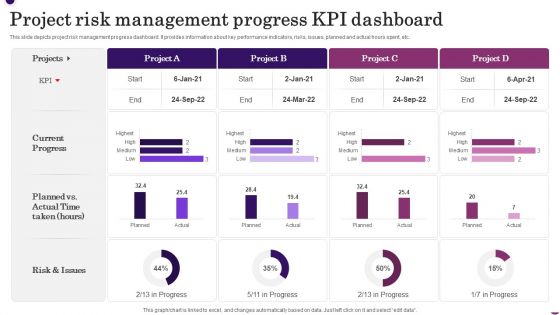
Project Risk Management Progress KPI Dashboard Template PDF
This slide depicts project risk management progress dashboard. It provides information about key performance indicators, risks, issues, planned and actual hours spent, etc. Pitch your topic with ease and precision using this Project Risk Management Progress KPI Dashboard Template PDF. This layout presents information on Current Progress, Risk And Issues. It is also available for immediate download and adjustment. So, changes can be made in the color, design, graphics or any other component to create a unique layout.
Circular Meter For Progress Status Vector Icon Ppt Inspiration Template PDF
Presenting circular meter for progress status vector icon ppt inspiration template pdf to dispense important information. This template comprises three stages. It also presents valuable insights into the topics including circular meter for progress status vector icon. This is a completely customizable PowerPoint theme that can be put to use immediately. So, download it and address the topic impactfully.
Five Colors Piggy Bank Finance PowerPoint Templates And PowerPoint Themes 1012
Five Colors Piggy Bank Finance PowerPoint Templates And PowerPoint Themes 1012-Use this Graphical PowerPoint Template showing colorful Piggy banks. It indicates Savings, investments, reserves, nest egg, funds, hoard, stash, money etc. Clear thinking is your strength. Transmit your thoughts to your eager team. Adjust the above image in your PPT presentations to visually support your content in your Investment PPT slideshows.-Five Colors Piggy Bank Finance PowerPoint Templates And PowerPoint Themes 1012-This PowerPoint template can be used for presentations relating to-Five piggy bank in different colors, money, business, success, finance, symbol Correct wrongs with our Five Colors Piggy Bank Finance PowerPoint Templates And PowerPoint Themes 1012. Download without worries with our money back guaranteee.
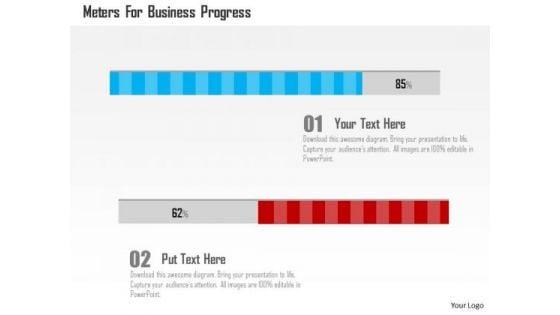
Business Diagram Meters For Business Progress Presentation Template
This business slide contains graphics of meter. You may use this slide to depict business progress. Download our above diagram to express information in a visual way.

Consulting Slides Circular Meter Agenda Diagram Business Presentation
This circular process layout helps to describe the ordered set of steps required to complete a task. You can download this diagram to make awesome presentations in PowerPoint.

KPI Dashboard Showcasing Smart Meter Internet Of Things Solutions To Enhance Energy IoT SS V
This slide exhibits a smart meter monitoring dashboard that provides valuable data, helpful in decision making and enhance regulatory compliance. It includes elements such as voltage, energy consumption, energy meters, energy consumption rate, etc. Here you can discover an assortment of the finest PowerPoint and Google Slides templates. With these templates, you can create presentations for a variety of purposes while simultaneously providing your audience with an eye-catching visual experience. Download KPI Dashboard Showcasing Smart Meter Internet Of Things Solutions To Enhance Energy IoT SS V to deliver an impeccable presentation. These templates will make your job of preparing presentations much quicker, yet still, maintain a high level of quality. Slidegeeks has experienced researchers who prepare these templates and write high-quality content for you. Later on, you can personalize the content by editing the KPI Dashboard Showcasing Smart Meter Internet Of Things Solutions To Enhance Energy IoT SS V. This slide exhibits a smart meter monitoring dashboard that provides valuable data, helpful in decision making and enhance regulatory compliance. It includes elements such as voltage, energy consumption, energy meters, energy consumption rate, etc.

Empowering The Future Statistical Graph Showcasing Smart Meter Market Growth IoT SS V
This slide showcases information about the global market size of smart meters. It includes key reasons such as government initiatives to promote energy conversation, smart city initiatives, accurate billing process, etc. The Empowering The Future Statistical Graph Showcasing Smart Meter Market Growth IoT SS V is a compilation of the most recent design trends as a series of slides. It is suitable for any subject or industry presentation, containing attractive visuals and photo spots for businesses to clearly express their messages. This template contains a variety of slides for the user to input data, such as structures to contrast two elements, bullet points, and slides for written information. Slidegeeks is prepared to create an impression. This slide showcases information about the global market size of smart meters. It includes key reasons such as government initiatives to promote energy conversation, smart city initiatives, accurate billing process, etc.
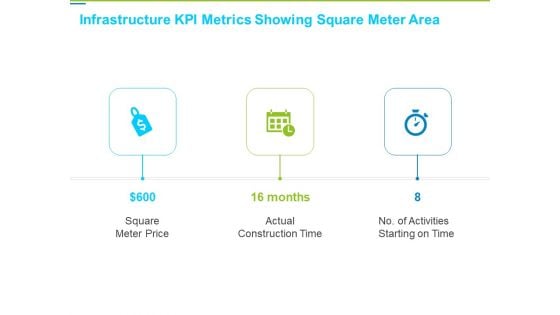
Framework Administration Infrastructure KPI Metrics Showing Square Meter Area Elements PDF
Presenting framework administration infrastructure kpi metrics showing square meter area elements pdf to provide visual cues and insights. Share and navigate important information on three stages that need your due attention. This template can be used to pitch topics like square meter price, actual construction time, no. of activities starting on time. In addition, this PPT design contains high-resolution images, graphics, etc, that are easily editable and available for immediate download.
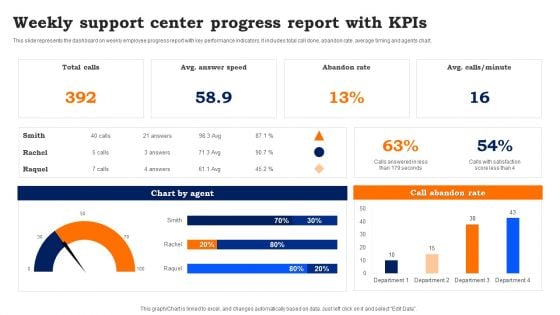
Weekly Support Center Progress Report With Kpis Template PDF
This slide represents the dashboard on weekly employee progress report with key performance indicators. It includes total call done, abandon rate, average timing and agents chart. Pitch your topic with ease and precision using this Weekly Support Center Progress Report With Kpis Template PDF. This layout presents information on Weekly Support, Center Progress Report. It is also available for immediate download and adjustment. So, changes can be made in the color, design, graphics or any other component to create a unique layout.
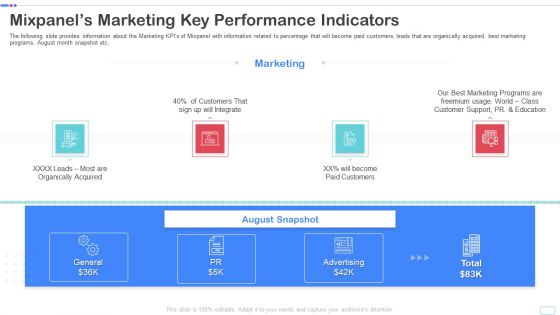
Mixpanel Capital Raising Pitch Deck Mixpanels Marketing Key Performance Indicators Portrait PDF
The following slide provides information about the Marketing KPIs of Mixpanel with information related to percentage that will become paid customers, leads that are organically acquired, best marketing programs, August month snapshot etc. Presenting mixpanel capital raising pitch deck mixpanels marketing key performance indicators portrait pdf to provide visual cues and insights. Share and navigate important information on four stages that need your due attention. This template can be used to pitch topics like mixpanels marketing key performance indicators. In addtion, this PPT design contains high resolution images, graphics, etc, that are easily editable and available for immediate download.
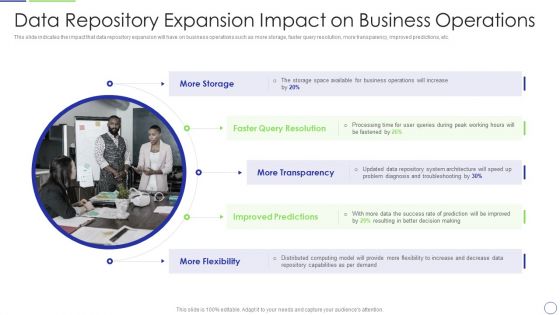
Developing Organization Primary Data Storage Action Plan Data Repository Expansion Impact On Business Operations Formats PDF
This slide indicates the impact that data repository expansion will have on business operations such as more storage, faster query resolution, more transparency, improved predictions, etc. This is a developing organization primary data storage action plan data repository expansion impact on business operations formats pdf template with various stages. Focus and dispense information on one stages using this creative set, that comes with editable features. It contains large content boxes to add your information on topics like resolution, processing, transparency, predictions, improved, success. You can also showcase facts, figures, and other relevant content using this PPT layout. Grab it now.
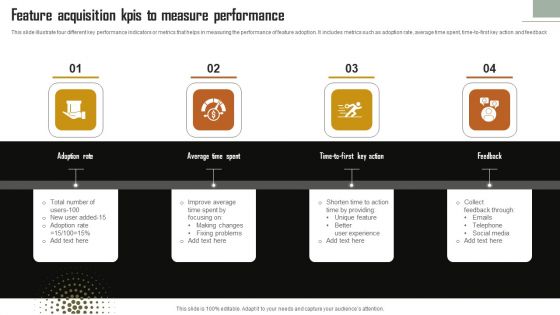
Feature Acquisition Kpis To Measure Performance Themes PDF
This slide illustrate four different key performance indicators or metrics that helps in measuring the performance of feature adoption. It includes metrics such as adoption rate, average time spent, time-to-first key action and feedback. Persuade your audience using this Feature Acquisition Kpis To Measure Performance Themes PDF. This PPT design covers four stages, thus making it a great tool to use. It also caters to a variety of topics including Adoption Rate, Average Time Spent, Feedback. Download this PPT design now to present a convincing pitch that not only emphasizes the topic but also showcases your presentation skills.

Meter For Speed Control Powerpoint Templates
Our professionally designed business diagram is as an effective tool for communicating business ideas and strategies for corporate planning. It contains graphics of speed control meter. Above slide is suitable to display business options with technology.
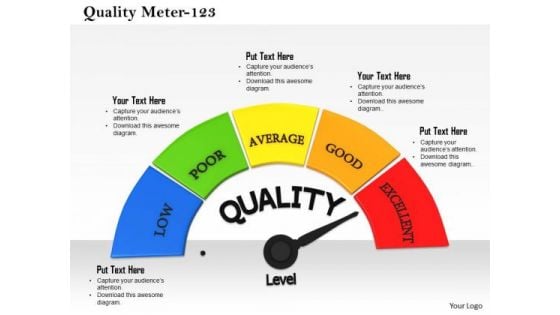
Stock Photo Meter Indicating Maximum Quality Level PowerPoint Slide
This image has been designed with graphics of meter indicating maximum level of quality. Concept of maintaining best quality can be explained with this image. Use this image to make business presentations.
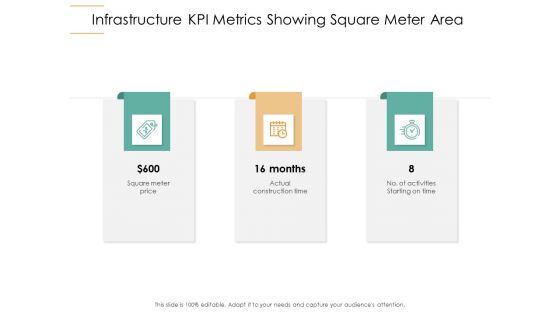
Infrastructure Strategies Infrastructure KPI Metrics Showing Square Meter Area Ppt Outline Graphics Pictures PDF
Presenting infrastructure strategies infrastructure kpi metrics showing square meter area ppt outline graphics pictures pdf to provide visual cues and insights. Share and navigate important information on three stages that need your due attention. This template can be used to pitch topics like square meter price, actual construction time, no of activities starting on time. In addtion, this PPT design contains high resolution images, graphics, etc, that are easily editable and available for immediate download.
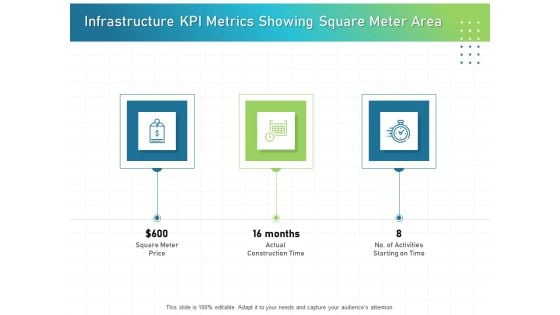
IT Infrastructure Administration Infrastructure KPI Metrics Showing Square Meter Area Guidelines PDF
Presenting it infrastructure administration infrastructure kpi metrics showing square meter area guidelines pdf to provide visual cues and insights. Share and navigate important information on three stages that need your due attention. This template can be used to pitch topics like square meter price, actual construction time, no of activities starting on time. In addtion, this PPT design contains high resolution images, graphics, etc, that are easily editable and available for immediate download.
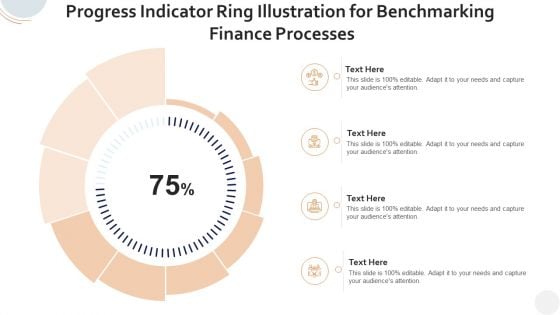
Progress Indicator Ring Illustration For Benchmarking Finance Processes Clipart PDF
Pitch your topic with ease and precision using this progress indicator ring illustration for benchmarking finance processes clipart pdf. This layout presents information on progress indicator ring illustration for benchmarking finance processes. It is also available for immediate download and adjustment. So, changes can be made in the color, design, graphics or any other component to create a unique layout.

Three Circular Steps Indicating Business Product Lines Ppt PowerPoint Presentation File Shapes PDF
Persuade your audience using this three circular steps indicating business product lines ppt powerpoint presentation file shapes pdf. This PPT design covers three stages, thus making it a great tool to use. It also caters to a variety of topics including three circular steps indicating business product lines. Download this PPT design now to present a convincing pitch that not only emphasizes the topic but also showcases your presentation skills.
Good Better Best Rating Meter With Icons Ppt Powerpoint Presentation Outline Vector
This is a good better best rating meter with icons ppt powerpoint presentation outline vector. This is a three stage process. The stages in this process are good better best, good great superb, good great excellent.

Software Development Project Task Progress Scorecard Ideas PDF
This slide covers status summary of software development project and task allotment report. It includes details such as key stakeholders, tasks list, assigned person, start dates, top concerns, open actions, task meter,milestones, etc. Pitch your topic with ease and precision using this Software Development Project Task Progress Scorecard Ideas PDF. This layout presents information on Performance Analysis, Document Generation, Change Requests. It is also available for immediate download and adjustment. So, changes can be made in the color, design, graphics or any other component to create a unique layout.
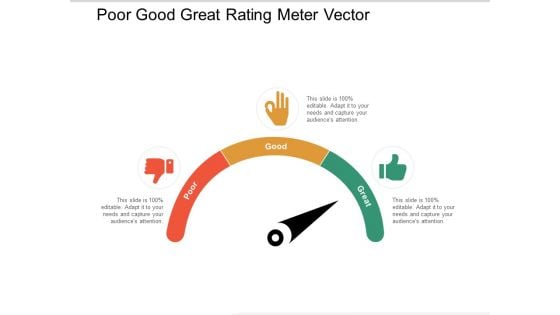
Poor Good Great Rating Meter Vector Ppt PowerPoint Presentation Show Slide Download
Presenting this set of slides with name poor good great rating meter vector ppt powerpoint presentation show slide download. This is a three stage process. The stages in this process are product quality, product improvement, rating scale. This is a completely editable PowerPoint presentation and is available for immediate download. Download now and impress your audience.
Strategic Management Progress Meter Dashboard Design Marketing Diagram
Be A Donor Of Great Ideas. Display Your Charity On Our Strategic Management Progress Meter Dashboard Design Marketing Diagram Powerpoint Templates.
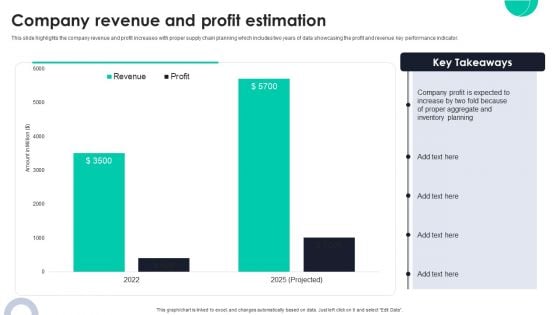
Company Revenue And Profit Estimation Ppt PowerPoint Presentation File Ideas PDF
This slide highlights the company revenue and profit increases with proper supply chain planning which includes two years of data showcasing the profit and revenue key performance indicator. Do you have to make sure that everyone on your team knows about any specific topic I yes, then you should give Company Revenue And Profit Estimation Ppt PowerPoint Presentation File Ideas PDF a try. Our experts have put a lot of knowledge and effort into creating this impeccable Company Revenue And Profit Estimation Ppt PowerPoint Presentation File Ideas PDF. You can use this template for your upcoming presentations, as the slides are perfect to represent even the tiniest detail. You can download these templates from the Slidegeeks website and these are easy to edit. So grab these today.
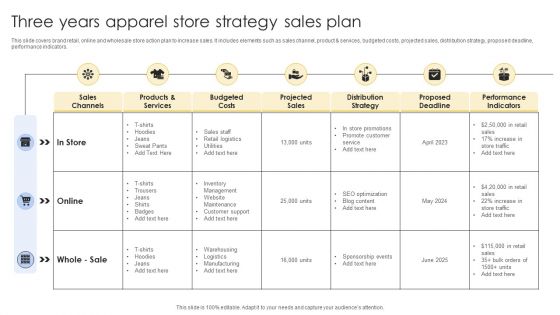
Three Years Apparel Store Strategy Sales Plan Download PDF
This slide covers brand retail, online and wholesale store action plan to increase sales. It includes elements such as sales channel, product and services, budgeted costs, projected sales, distribution strategy, proposed deadline, performance indicators. Showcasing this set of slides titled Three Years Apparel Store Strategy Sales Plan Download PDF. The topics addressed in these templates are Budgeted Costs, Distribution Strategy, Projected Sales. All the content presented in this PPT design is completely editable. Download it and make adjustments in color, background, font etc. as per your unique business setting.
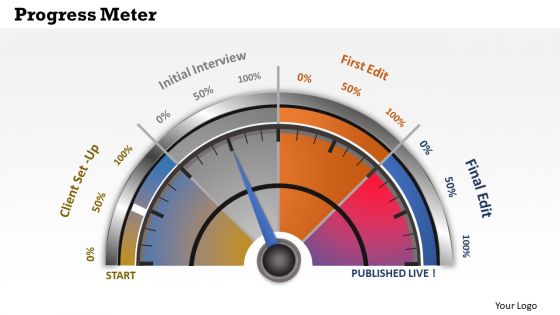
Consulting Diagram Business Dashboard Progress Meter Business Diagram
Be The Doer With Our Consulting Diagram Business Dashboard Progress Meter Business Diagram Powerpoint Templates. Put Your Thoughts Into Practice.
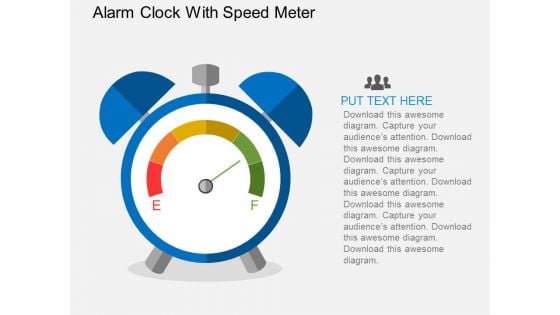
Alarm Clock With Speed Meter Powerpoint Templates
Our above PPT slide contains graphics of alarm clock with speed meter. This PowerPoint template helps to display concept of deadlines and performance. Use this diagram to create more sound impact on viewers.

Sales Team Performance Meter Ppt PowerPoint Presentation Diagrams
This is a sales team performance meter ppt powerpoint presentation diagrams. This is a five stage process. The stages in this process are business, meter, speed, time, sales.
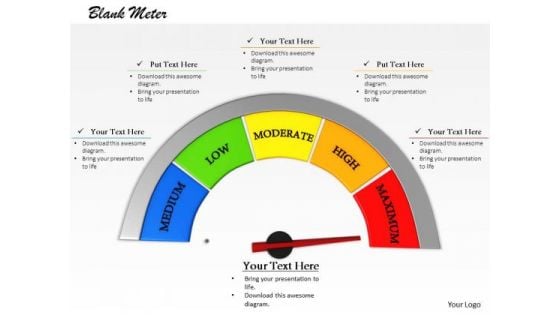
Stock Photo 3d Meter With Maximum Value PowerPoint Slide
This image of 3d meter is very useful for presentations about growth and success. This high quality image has graphics of 3d meter pointing at maximum value. Create eye-catching presentation using this image.
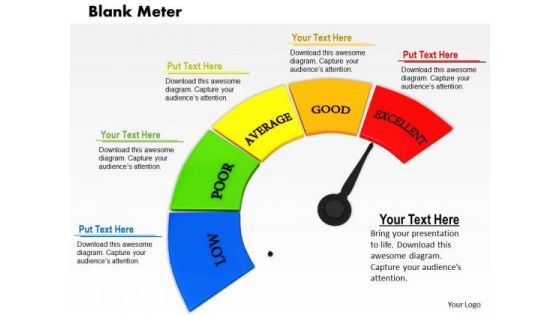
Stock Photo Meter With Red Maximum Value PowerPoint Slide
This image of 3d meter is very useful for presentations about growth and success. This high quality image has graphics of 3d meter pointing at maximum value. Create eye-catching presentation using this image.
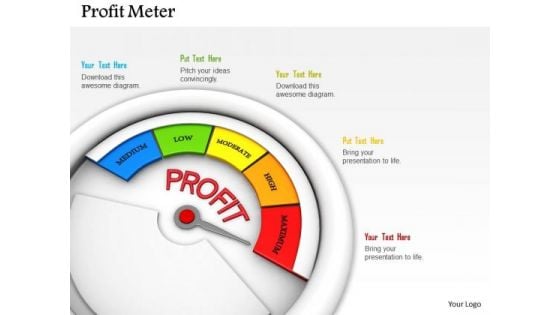
Stock Photo Meter Indicating Maximum Level Of Profit PowerPoint Slide
Display the concept of profit growth with this image. This image has been designed with graphics of meter indicating maximum level of profit. Use this image to make business presentations.
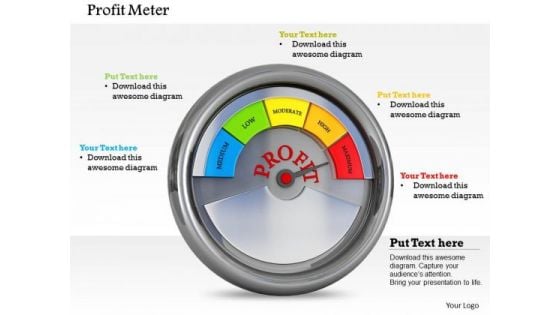
Stock Photo Profit Meter At Maximum Level PowerPoint Slide
Display the concept of profit growth with this image. This image has been designed with graphics of meter indicating maximum level of profit. Use this image to make business presentations.
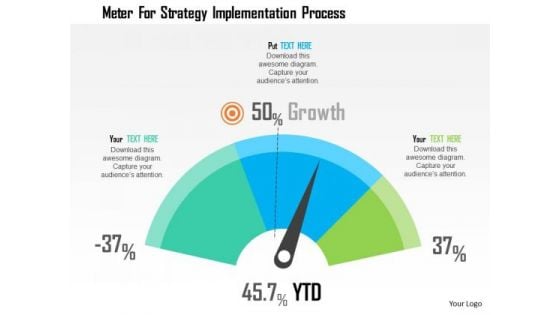
Business Diagram Meter For Strategy Implementation Process Presentation Template
This business diagram has been designed with graphic of meter displaying YTD growth. Use this slide to exhibit strategy implementation process. Use this slide for your business and marketing related presentations.
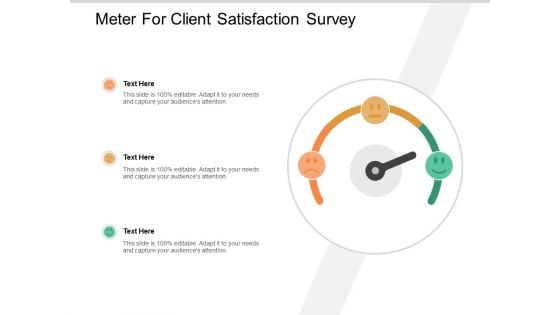
Meter For Client Satisfaction Survey Ppt PowerPoint Presentation Portfolio Outline
Presenting this set of slides with name meter for client satisfaction survey ppt powerpoint presentation portfolio outline. This is a three stage process. The stages in this process are product quality, product improvement, rating scale. This is a completely editable PowerPoint presentation and is available for immediate download. Download now and impress your audience.
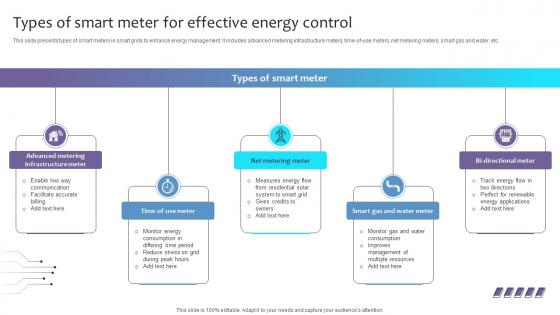
Empowering The Future Types Of Smart Meter For Effective Energy Control IoT SS V
This slide presents types of smart meters in smart grids to enhance energy management. It includes advanced metering infrastructure meters, time-of-use meters, net metering meters, smart gas and water, etc. Here you can discover an assortment of the finest PowerPoint and Google Slides templates. With these templates, you can create presentations for a variety of purposes while simultaneously providing your audience with an eye-catching visual experience. Download Empowering The Future Types Of Smart Meter For Effective Energy Control IoT SS V to deliver an impeccable presentation. These templates will make your job of preparing presentations much quicker, yet still, maintain a high level of quality. Slidegeeks has experienced researchers who prepare these templates and write high-quality content for you. Later on, you can personalize the content by editing the Empowering The Future Types Of Smart Meter For Effective Energy Control IoT SS V. This slide presents types of smart meters in smart grids to enhance energy management. It includes advanced metering infrastructure meters, time-of-use meters, net metering meters, smart gas and water, etc.
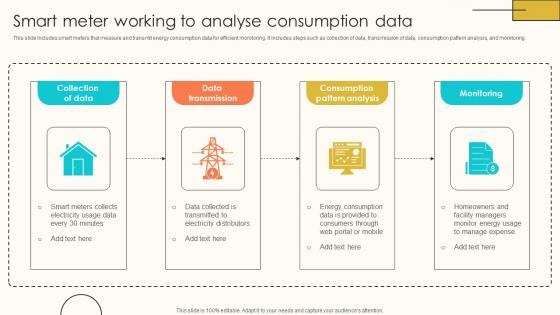
Smart Meter Working To Analyse Consumption Internet Of Things Solutions To Enhance Energy IoT SS V
This slide includes smart meters that measure and transmit energy consumption data for efficient monitoring. It includes steps such as collection of data, transmission of data, consumption pattern analysis, and monitoring. Slidegeeks has constructed Smart Meter Working To Analyse Consumption Internet Of Things Solutions To Enhance Energy IoT SS V after conducting extensive research and examination. These presentation templates are constantly being generated and modified based on user preferences and critiques from editors. Here, you will find the most attractive templates for a range of purposes while taking into account ratings and remarks from users regarding the content. This is an excellent jumping-off point to explore our content and will give new users an insight into our top-notch PowerPoint Templates. This slide includes smart meters that measure and transmit energy consumption data for efficient monitoring. It includes steps such as collection of data, transmission of data, consumption pattern analysis, and monitoring.
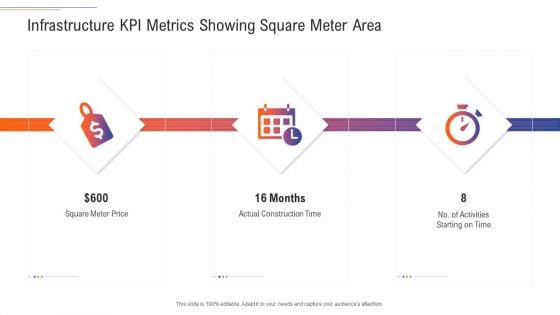
Support Services Management Infrastructure KPI Metrics Showing Square Meter Area Ideas PDF
Presenting support services management infrastructure kpi metrics showing square meter area ideas pdf to provide visual cues and insights. Share and navigate important information on three stages that need your due attention. This template can be used to pitch topics like square meter price, actual construction time, no of activities starting on time. In addtion, this PPT design contains high resolution images, graphics, etc, that are easily editable and available for immediate download.
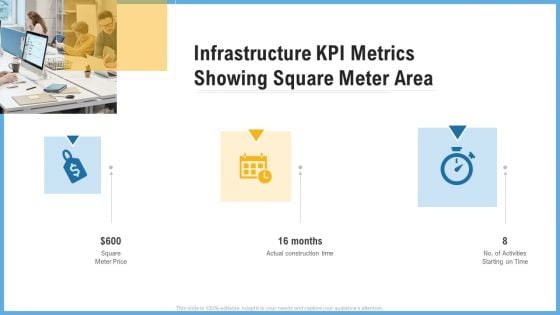
Improving Operational Activities Enterprise Infrastructure Kpi Metrics Showing Square Meter Area Portrait PDF
This is a improving operational activities enterprise infrastructure kpi metrics showing square meter area portrait pdf template with various stages. Focus and dispense information on three stages using this creative set, that comes with editable features. It contains large content boxes to add your information on topics like infrastructure kpi metrics showing square meter area. You can also showcase facts, figures, and other relevant content using this PPT layout. Grab it now.
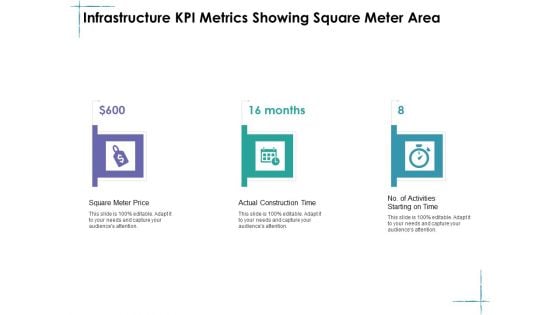
Facility Management Infrastructure KPI Metrics Showing Square Meter Area Ppt Inspiration Example PDF
Presenting facility management infrastructure kpi metrics showing square meter area ppt inspiration example pdf to provide visual cues and insights. Share and navigate important information on three stages that need your due attention. This template can be used to pitch topics like square meter price, actual construction time, no of activities starting on time. In addtion, this PPT design contains high resolution images, graphics, etc, that are easily editable and available for immediate download.
Infrastructure Project Management In Construction Infrastructure KPI Metrics Showing Square Meter Area Portrait PDF
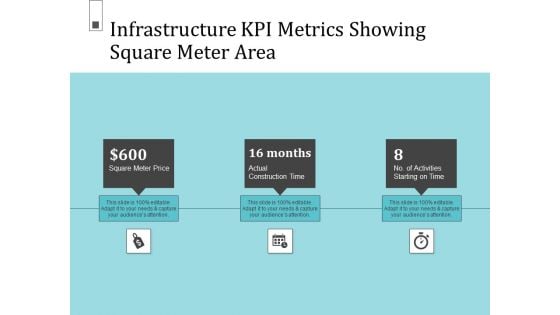
Presenting infrastructure project management in construction infrastructure kpi metrics showing square meter area portrait pdf. to provide visual cues and insights. Share and navigate important information on three stages that need your due attention. This template can be used to pitch topics like Square Meter Price, Actual Construction Time. In addtion, this PPT design contains high resolution images, graphics, etc, that are easily editable and available for immediate download.
Civil Infrastructure Designing Services Management Infrastructure Kpi Metrics Showing Square Meter Area Slides PDF
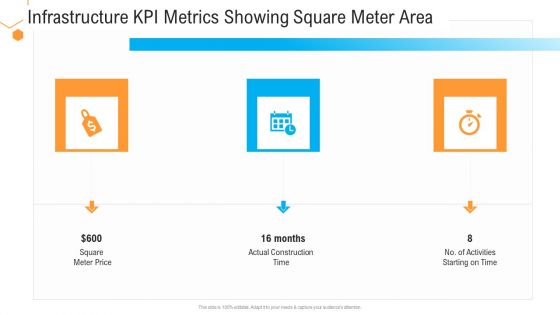
Presenting civil infrastructure designing services management infrastructure kpi metrics showing square meter area slides pdf to provide visual cues and insights. Share and navigate important information on three stages that need your due attention. This template can be used to pitch topics like infrastructure kpi metrics showing square meter area. In addtion, this PPT design contains high resolution images, graphics, etc, that are easily editable and available for immediate download.
Business Activities Assessment Examples Infrastructure KPI Metrics Showing Square Meter Area Elements PDF
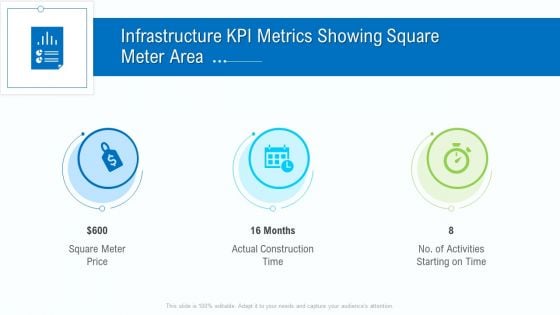
Presenting business activities assessment examples infrastructure kpi metrics showing square meter area elements pdf to provide visual cues and insights. Share and navigate important information on three stages that need your due attention. This template can be used to pitch topics like square meter price, actual construction time, activities starting on time. In addtion, this PPT design contains high resolution images, graphics, etc, that are easily editable and available for immediate download.
Infrastructure Designing And Administration Infrastructure KPI Metrics Showing Square Meter Area Guidelines PDF
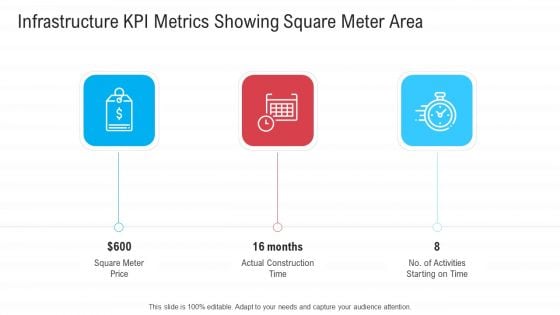
Presenting infrastructure designing and administration infrastructure kpi metrics showing square meter area guidelines pdf to provide visual cues and insights. Share and navigate important information on three stages that need your due attention. This template can be used to pitch topics like square meter price, actual construction time, no of activities starting on time. In addtion, this PPT design contains high resolution images, graphics, etc, that are easily editable and available for immediate download.
Red Yellow Green Meter With Emoticons For Feedback Ppt PowerPoint Presentation Ideas Template
Presenting this set of slides with name red yellow green meter with emoticons for feedback ppt powerpoint presentation ideas template. This is a three stage process. The stages in this process are product quality, product improvement, rating scale. This is a completely editable PowerPoint presentation and is available for immediate download. Download now and impress your audience.

Sales Employee Kpi Progress Evaluation Ideas Pdf
This slide showcase performance indicators for progress review which helps in improving employee engagement and achieving results faster. It include indicators such as number of sales, conversion rate, lead generation and client acquisition rate. Pitch your topic with ease and precision using this Sales Employee Kpi Progress Evaluation Ideas Pdf This layout presents information on Meeting Conversion Rate, Conversion Rate, Lead Generation It is also available for immediate download and adjustment. So, changes can be made in the color, design, graphics or any other component to create a unique layout. This slide showcase performance indicators for progress review which helps in improving employee engagement and achieving results faster. It include indicators such as number of sales, conversion rate, lead generation and client acquisition rate.
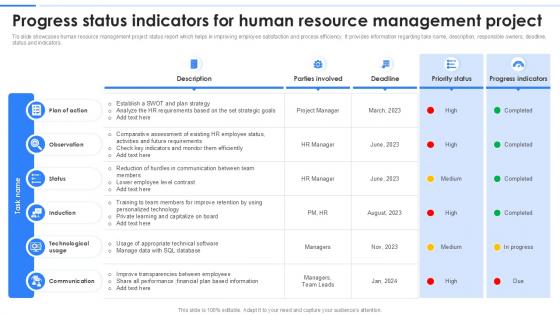
Progress Status Indicators For Human Resource Management Project
If you are looking for a format to display your unique thoughts, then the professionally designed Profit And Loss Waterfall Powerpoint Ppt Template is the one for you. You can use it as a Google Slides template or a PowerPoint template. Incorporate impressive visuals, symbols, images, and other charts. Modify or reorganize the text boxes as you desire. Experiment with shade schemes and font pairings. Alter, share or cooperate with other people on your work. Download Profit And Loss Waterfall Powerpoint Ppt Template and find out how to give a successful presentation. Present a perfect display to your team and make your presentation unforgettable. This template showcases Human Resource Management Project Status Report designed to enhance employee satisfaction and streamline process efficiency. It includes components such as task name, description, responsible owners, deadlines, current status, and progress indicators.
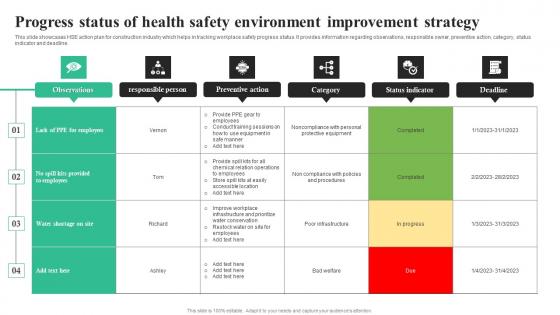
Progress Status Of Health Safety Environment Improvement Strategy Guidelines Pdf
This slide showcases HSE action plan for construction industry which helps in tracking workplace safety progress status. It provides information regarding observations, responsible owner, preventive action, category, status indicator and deadline.Showcasing this set of slides titled Progress Status Of Health Safety Environment Improvement Strategy Guidelines Pdf The topics addressed in these templates are Poor Infrastructure, Responsible Person, Preventive Action All the content presented in this PPT design is completely editable. Download it and make adjustments in color, background, font etc. as per your unique business setting. This slide showcases HSE action plan for construction industry which helps in tracking workplace safety progress status. It provides information regarding observations, responsible owner, preventive action, category, status indicator and deadline.
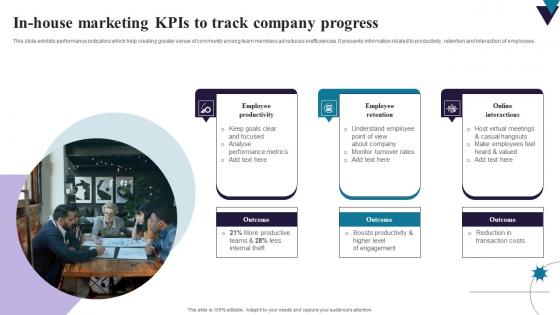
In House Marketing Kpis To Track Company Progress Inspiration Pdf
This slide exhibits performance indicators which help creating greater sense of community among team members ad reduces inefficiencies. It presents information related to productivity, retention and interaction of employees. Showcasing this set of slides titled In House Marketing Kpis To Track Company Progress Inspiration Pdf. The topics addressed in these templates are Employee Productivity, Employee Retention, Online Interactions. All the content presented in this PPT design is completely editable. Download it and make adjustments in color, background, font etc. as per your unique business setting. This slide exhibits performance indicators which help creating greater sense of community among team members ad reduces inefficiencies. It presents information related to productivity, retention and interaction of employees.
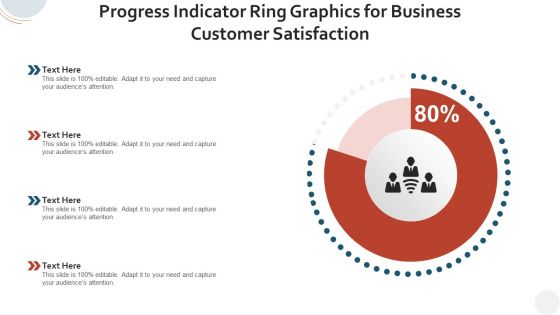
Progress Indicator Ring Graphics For Business Customer Satisfaction Background PDF
Pitch your topic with ease and precision using this progress indicator ring graphics for business customer satisfaction background pdf. This layout presents information on progress indicator ring graphics for business customer satisfaction. It is also available for immediate download and adjustment. So, changes can be made in the color, design, graphics or any other component to create a unique layout.
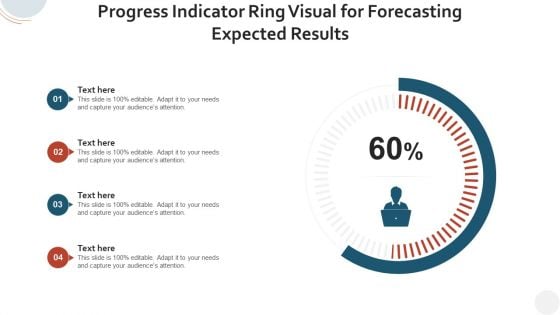
Progress Indicator Ring Visual For Forecasting Expected Results Diagrams PDF
Pitch your topic with ease and precision using this progress indicator ring visual for forecasting expected results diagrams pdf. This layout presents information on progress indicator ring visual for forecasting expected results. It is also available for immediate download and adjustment. So, changes can be made in the color, design, graphics or any other component to create a unique layout.
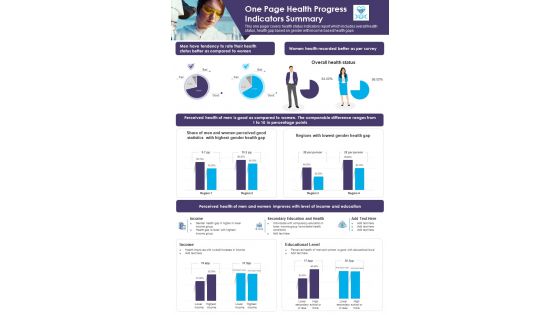
One Page Health Progress Indicators Summary PDF Document PPT Template
Here we present the One Page Health Progress Indicators Summary PDF Document PPT Template. This One-pager template includes everything you require. You can edit this document and make changes according to your needs it offers complete freedom of customization. Grab this One Page Health Progress Indicators Summary PDF Document PPT Template Download now.
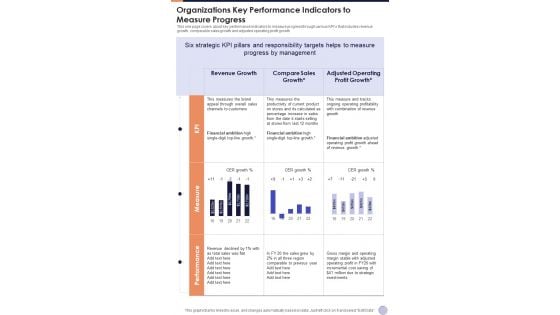
Organizations Key Performance Indicators To Measure Progress One Pager Documents
This one page covers about key performance indicators to measure progress through various KPIs that includes revenue growth, comparable sales growth and adjusted operating profit growth. Presenting you a fantastic Organizations Key Performance Indicators To Measure Progress One Pager Documents. This piece is crafted on hours of research and professional design efforts to ensure you have the best resource. It is completely editable and its design allow you to rehash its elements to suit your needs. Get this Organizations Key Performance Indicators To Measure Progress One Pager Documents A4 One-pager now.
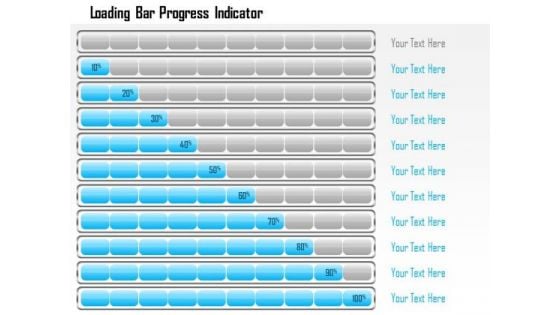
Business Framework Loading Bar Progress Indicator PowerPoint Presentation
This business diagram displays bar progress indicators. This business slide contains the concept of business growth shown in multiple levels. Use this diagram to present and compare data in an impressive manner.
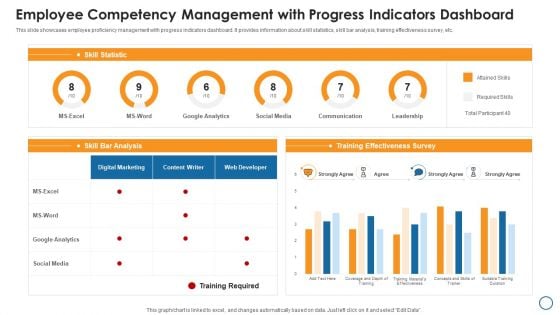
Employee Competency Management With Progress Indicators Dashboard Graphics PDF
This slide showcases employee proficiency management with progress indicators dashboard. It provides information about skill statistics, skill bar analysis, training effectiveness survey, etc. Showcasing this set of slides titled employee competency management with progress indicators dashboard graphics pdf. The topics addressed in these templates are google analytics, social media, survey. All the content presented in this PPT design is completely editable. Download it and make adjustments in color, background, font etc. as per your unique business setting.


 Continue with Email

 Home
Home


