Progressive Charts
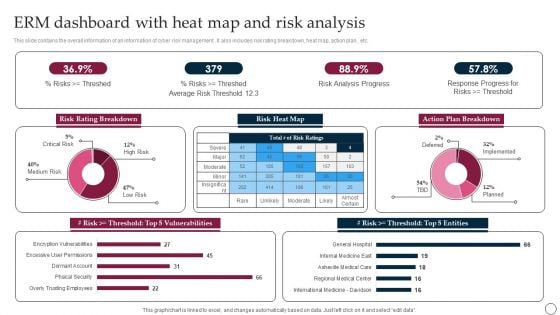
ERM Dashboard With Heat Map And Risk Analysis Ppt PowerPoint Presentation File Backgrounds PDF
This slide contains the overall information of an information of cyber risk management . It also includes risk rating breakdown, heat map, action plan , etc. Showcasing this set of slides titled ERM Dashboard With Heat Map And Risk Analysis Ppt PowerPoint Presentation File Backgrounds PDF. The topics addressed in these templates are Risk Rating Breakdown, Average Risk, Risk Analysis Progress. All the content presented in this PPT design is completely editable. Download it and make adjustments in color, background, font etc. as per your unique business setting.
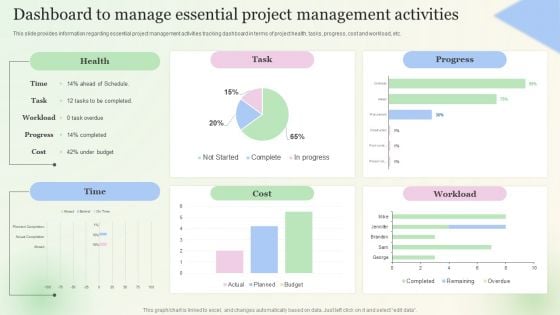
Dashboard To Manage Essential Project Management Activities Pictures PDF
This slide provides information regarding essential project management activities tracking dashboard in terms of project health, tasks, progress, cost and workload, etc. Boost your pitch with our creative Dashboard To Manage Essential Project Management Activities Pictures PDF. Deliver an awe-inspiring pitch that will mesmerize everyone. Using these presentation templates you will surely catch everyones attention. You can browse the ppts collection on our website. We have researchers who are experts at creating the right content for the templates. So you do not have to invest time in any additional work. Just grab the template now and use them.
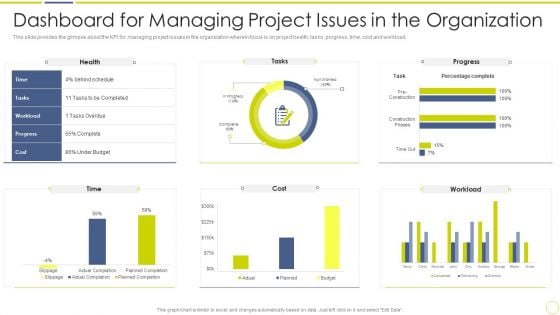
Incident And Issue Management Procedure Dashboard For Managing Project Issues In The Organization Designs PDF
This slide provides the glimpse about the KPI for managing project issues in the organization wherein focus is on project health, tasks, progress, time, cost and workload. Deliver and pitch your topic in the best possible manner with this incident and issue management procedure dashboard for managing project issues in the organization designs pdf. Use them to share invaluable insights on dashboard for managing project issues in the organization and impress your audience. This template can be altered and modified as per your expectations. So, grab it now.
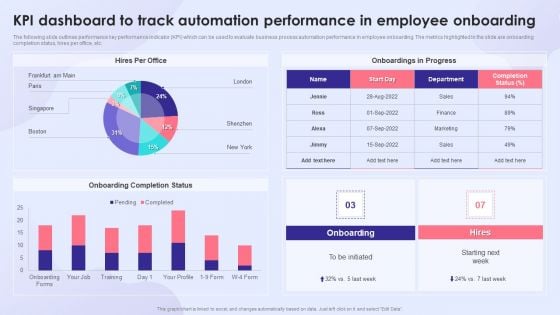
KPI Dashboard To Track Automation Performance In Employee Onboarding Introduction PDF
The following slide outlines performance key performance indicator KPI which can be used to evaluate business process automation performance in employee onboarding. The metrics highlighted in the slide are onboarding completion status, hires per office, etc. Deliver an awe inspiring pitch with this creative KPI Dashboard To Track Automation Performance In Employee Onboarding Introduction PDF bundle. Topics like Onboarding Completion Status, Onboardings In Progress, Employee Onboarding can be discussed with this completely editable template. It is available for immediate download depending on the needs and requirements of the user.
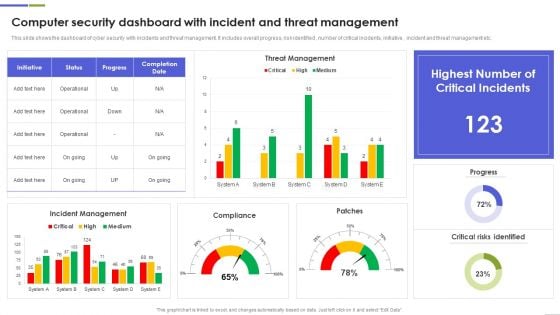
Computer Security Dashboard With Incident And Threat Management Rules PDF
This slide shows the dashboard of cyber security with incidents and threat management. It includes overall progress, risk identified , number of critical incidents, initiative , incident and threat management etc.Showcasing this set of slides titled Computer Security Dashboard With Incident And Threat Management Rules PDF The topics addressed in these templates are Critical Incidents, Risks Identified, Compliance All the content presented in this PPT design is completely editable. Download it and make adjustments in color, background, font etc. as per your unique business setting.
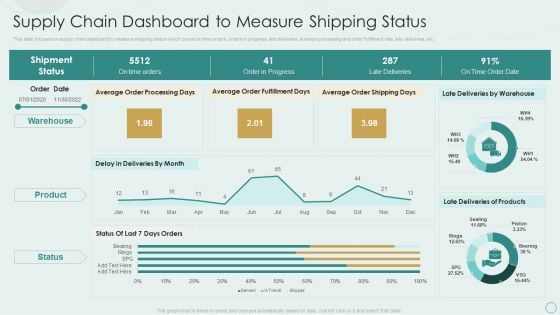
Learning Various Supply Chain Models Supply Chain Dashboard To Measure Shipping Status Graphics PDF
This slide focuses on supply chain dashboard to measure shipping status which covers on time orders, orders in progress, late deliveries, average processing and order fulfillment rate, late deliveries, etc. Deliver and pitch your topic in the best possible manner with this Learning Various Supply Chain Models Supply Chain Dashboard To Measure Shipping Status Graphics PDF. Use them to share invaluable insights on Warehouse, Product, Late Deliveries, On Time Orders and impress your audience. This template can be altered and modified as per your expectations. So, grab it now.
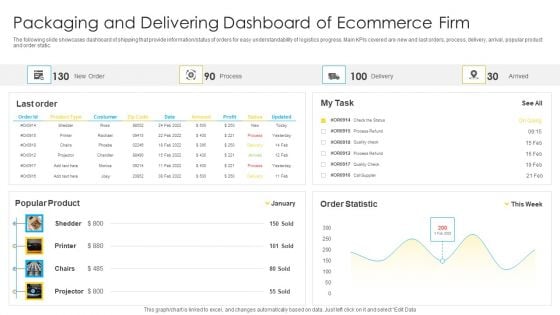
Packaging And Delivering Dashboard Of Ecommerce Firm Slides PDF
The following slide showcases dashboard of shipping that provide information or status of orders for easy understandability of logistics progress. Main KPIs covered are new and last orders, process, delivery, arrival, popular product and order static. Showcasing this set of slides titled Packaging And Delivering Dashboard Of Ecommerce Firm Slides PDF. The topics addressed in these templates are Packaging And Delivering, Dashboard Ecommerce Firm. All the content presented in this PPT design is completely editable. Download it and make adjustments in color, background, font etc. as per your unique business setting.
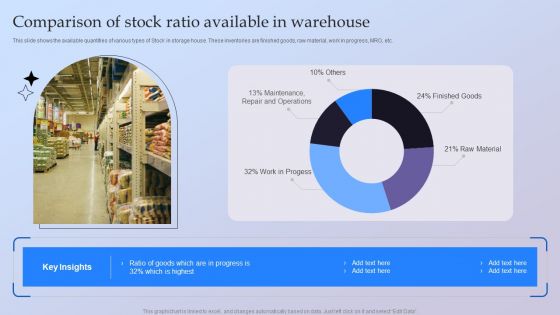
Comparison Of Stock Ratio Available In Warehouse Ppt Show Elements PDF
This slide shows the available quantities of various types of Stock in storage house. These inventories are finished goods, raw material, work in progress, MRO, etc. Showcasing this set of slides titled Comparison Of Stock Ratio Available In Warehouse Ppt Show Elements PDF. The topics addressed in these templates are Raw Material, Work Progess, Maintenance, Repair And Operations. All the content presented in this PPT design is completely editable. Download it and make adjustments in color, background, font etc. as per your unique business setting.
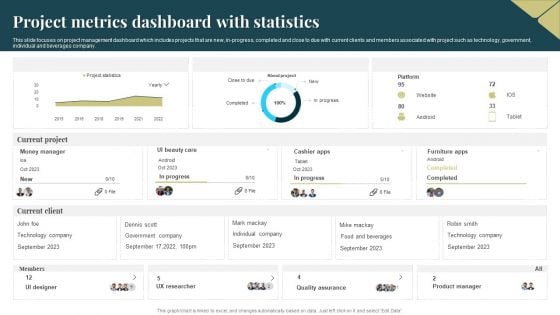
Project Metrics Dashboard With Statistics Slides PDF
This slide focuses on project management dashboard which includes projects that are new, in progress, completed and close to due with current clients and members associated with project such as technology, government, individual and beverages company. Showcasing this set of slides titled Project Metrics Dashboard With Statistics Slides PDF. The topics addressed in these templates are Quality Assurance, Product Manager, Technology. All the content presented in this PPT design is completely editable. Download it and make adjustments in color, background, font etc. as per your unique business setting.

KPI Dashboard Highlighting Automation Results In Supply Achieving Operational Efficiency Graphics PDF
The following slide outlines a comprehensive dashboard depicting the business process automation BPA results in the supply chain. Information covered in the slide is related to average order processing days, average shipping days, etc.Deliver and pitch your topic in the best possible manner with this KPI Dashboard Highlighting Automation Results In Supply Achieving Operational Efficiency Graphics PDF. Use them to share invaluable insights on Orders Progress, Late Deliveries, Deliveries Warehouse and impress your audience. This template can be altered and modified as per your expectations. So, grab it now.
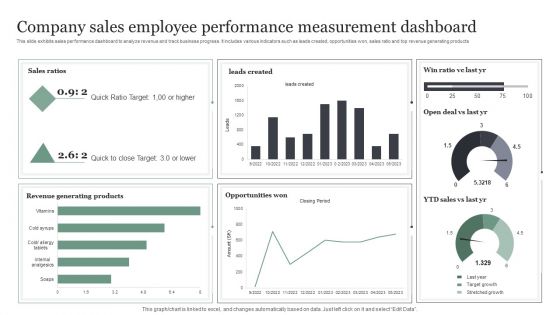
Company Sales Employee Performance Measurement Dashboard Information PDF
This slide exhibits sales performance dashboard to analyze revenue and track business progress. It includes various indicators such as leads created, opportunities won, sales ratio and top revenue generating products. Showcasing this set of slides titled Company Sales Employee Performance Measurement Dashboard Information PDF. The topics addressed in these templates are Quick Ratio Target, Opportunities Won, Revenue Generating Products. All the content presented in this PPT design is completely editable. Download it and make adjustments in color, background, font etc. as per your unique business setting.
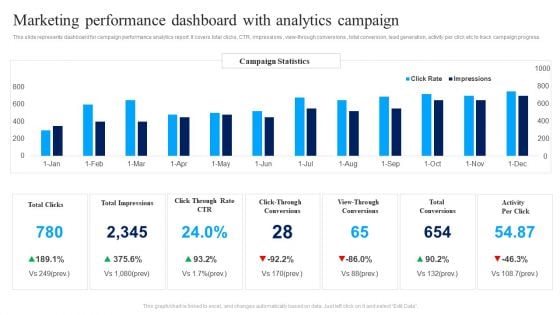
Marketing Performance Dashboard With Analytics Campaign Ppt Infographics Background Images PDF
This slide represents dashboard for campaign performance analytics report. It covers total clicks, CTR, impressions , view-through conversions , total conversion, lead generation, activity per click etc to track campaign progress. Showcasing this set of slides titled Marketing Performance Dashboard With Analytics Campaign Ppt Infographics Background Images PDF. The topics addressed in these templates are Total Clicks, Total Impressions, Total Conversions, Activity Per Click. All the content presented in this PPT design is completely editable. Download it and make adjustments in color, background, font etc. as per your unique business setting.
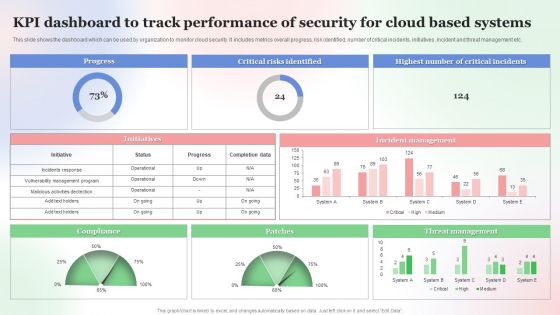
KPI Dashboard To Track Performance Of Security For Cloud Based Systems Clipart PDF
This slide shows the dashboard which can be used by organization to monitor cloud security. It includes metrics overall progress, risk identified, number of critical incidents, initiatives, incident and threat management etc. Showcasing this set of slides titled KPI Dashboard To Track Performance Of Security For Cloud Based Systems Clipart PDF. The topics addressed in these templates are Kpi Dashboard To Track, Performance Of Security, Cloud Based Systems . All the content presented in this PPT design is completely editable. Download it and make adjustments in color, background, font etc. as per your unique business setting.
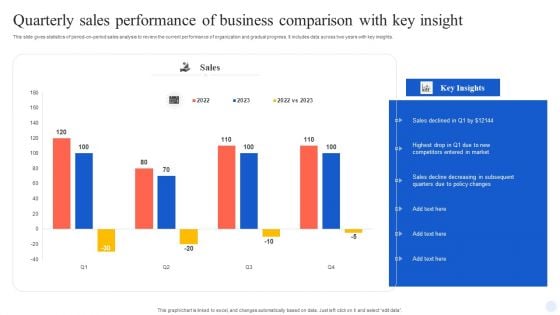
Quarterly Sales Performance Of Business Comparison With Key Insight Guidelines PDF
This slide gives statistics of period-on-period sales analysis to review the current performance of organization and gradual progress. It includes data across two years with key insights. Showcasing this set of slides titled Quarterly Sales Performance Of Business Comparison With Key Insight Guidelines PDF. The topics addressed in these templates are Quarterly Sales Performance, Business Comparison, Key Insight. All the content presented in this PPT design is completely editable. Download it and make adjustments in color, background, font etc. as per your unique business setting.
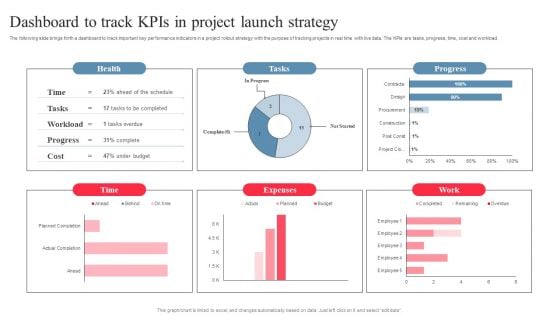
Dashboard To Track Kpis In Project Launch Strategy Pictures PDF
The following slide brings forth a dashboard to track important key performance indicators in a project rollout strategy with the purpose of tracking projects in real time with live data. The KPIs are tasks, progress, time, cost and workload. Showcasing this set of slides titled Dashboard To Track Kpis In Project Launch Strategy Pictures PDF. The topics addressed in these templates are Expenses, Project Launch Strategy, Dashboard To Track Kpis. All the content presented in this PPT design is completely editable. Download it and make adjustments in color, background, font etc. as per your unique business setting.
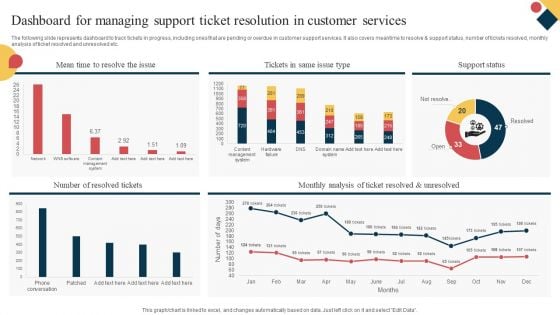
Dashboard For Managing Support Ticket Resolution In Customer Services Ideas PDF
The following slide represents dashboard to track tickets in progress, including ones that are pending or overdue in customer support services. It also covers meantime to resolve and support status, number of tickets resolved, monthly analysis of ticket resolved and unresolved etc. Showcasing this set of slides titled Dashboard For Managing Support Ticket Resolution In Customer Services Ideas PDF. The topics addressed in these templates are Resolved Tickets, Ticket Resolved Unresolved, Support Status. All the content presented in this PPT design is completely editable. Download it and make adjustments in color, background, font etc. as per your unique business setting.
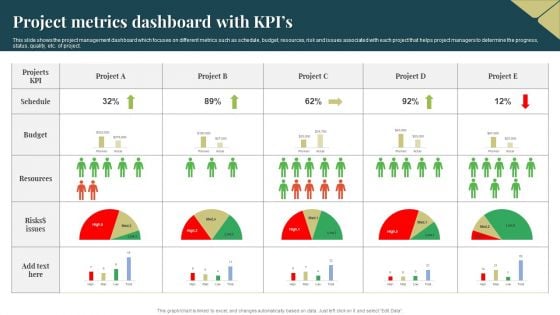
Project Metrics Dashboard With Kpis Ideas PDF
This slide shows the project management dashboard which focuses on different metrics such as schedule, budget, resources, risk and issues associated with each project that helps project managers to determine the progress, status, quality, etc. of project. Pitch your topic with ease and precision using this Project Metrics Dashboard With Kpis Ideas PDF. This layout presents information on Resources, Budget, Risks. It is also available for immediate download and adjustment. So, changes can be made in the color, design, graphics or any other component to create a unique layout.
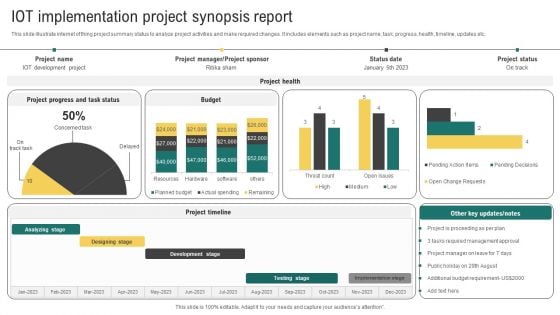
IOT Implementation Project Synopsis Report Summary PDF
This slide illustrate internet of thing project summary status to analyze project activities and make required changes. It includes elements such as project name, task, progress, health, timeline, updates etc. Pitch your topic with ease and precision using this IOT Implementation Project Synopsis Report Summary PDF. This layout presents information on Development Stage, Testing Stage, Implementation Stage. It is also available for immediate download and adjustment. So, changes can be made in the color, design, graphics or any other component to create a unique layout.
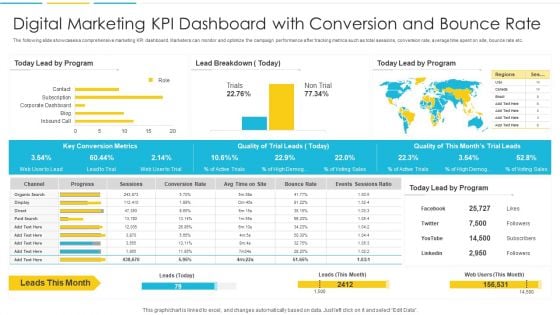
Digital Marketing KPI Dashboard With Conversion And Bounce Rate Introduction PDF
The following slide showcases a comprehensive marketing KPI dashboard. Marketers can monitor and optimize the campaign performance after tracking metrics such as total sessions, conversion rate, average time spent on site, bounce rate etc. Pitch your topic with ease and precision using this Digital Marketing KPI Dashboard With Conversion And Bounce Rate Introduction PDF. This layout presents information on Organic, Progress, Conversion Rate. It is also available for immediate download and adjustment. So, changes can be made in the color, design, graphics or any other component to create a unique layout
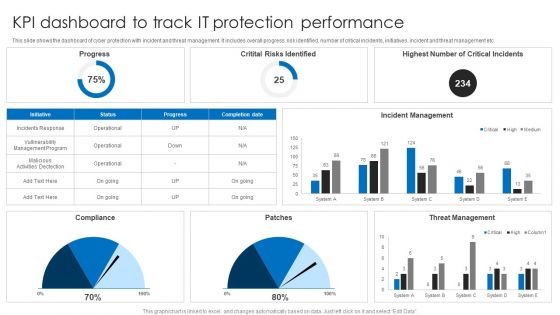
KPI Dashboard To Track IT Protection Performance Elements PDF
This slide shows the dashboard of cyber protection with incident and threat management. It includes overall progress, risk identified, number of critical incidents, initiatives, incident and threat management etc. Pitch your topic with ease and precision using this KPI Dashboard To Track IT Protection Performance Elements PDF. This layout presents information on Incident Management, Threat Management, Critital Risks Identified. It is also available for immediate download and adjustment. So, changes can be made in the color, design, graphics or any other component to create a unique layout.
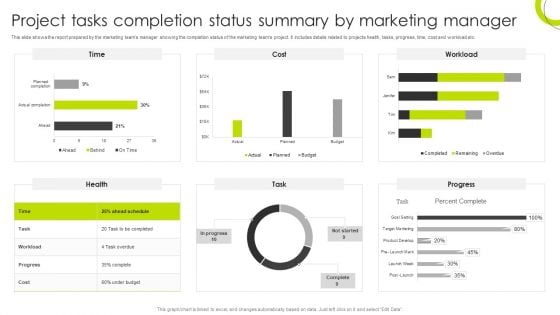
Project Tasks Completion Status Summary By Marketing Manager Mockup PDF
This slide shows the report prepared by the marketing teams manager showing the completion status of the marketing teams project. It includes details related to projects health, tasks, progress, time, cost and workload etc. Pitch your topic with ease and precision using thisProject Tasks Completion Status Summary By Marketing Manager Mockup PDF. This layout presents information on Project Tasks, Completion Status, Summary Marketing Manager. It is also available for immediate download and adjustment. So, changes can be made in the color, design, graphics or any other component to create a unique layout.
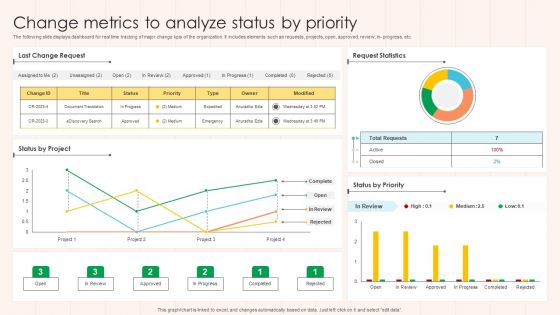
Change Metrics To Analyze Status By Priority Formats PDF
The following slide displays dashboard for real time tracking of major change kpis of the organization. It includes elements such as requests, projects, open, approved, review, in- progress, etc. Pitch your topic with ease and precision using this Change Metrics To Analyze Status By Priority Formats PDF This layout presents information on Project, Request Statistics, Priority. It is also available for immediate download and adjustment. So, changes can be made in the color, design, graphics or any other component to create a unique layout.
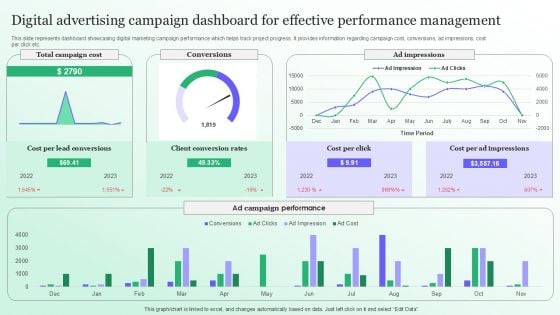
Digital Advertising Campaign Dashboard For Effective Performance Management Sample PDF
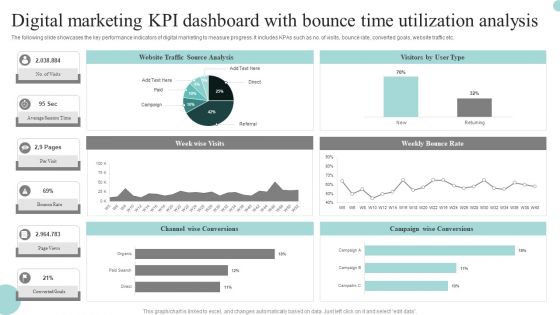
Digital Marketing Kpi Dashboard With Bounce Time Utilization Analysis Graphics PDF
The following slide showcases the key performance indicators of digital marketing to measure progress. It includes KPAs such as no. of visits, bounce rate, converted goals, website traffic etc. Pitch your topic with ease and precision using this Digital Marketing Kpi Dashboard With Bounce Time Utilization Analysis Graphics PDF. This layout presents information on Digital Marketing, KPI Dashboard, Bounce Time Utilization Analysis. It is also available for immediate download and adjustment. So, changes can be made in the color, design, graphics or any other component to create a unique layout.
Impact Of Artificial Intelligence In Business Deploying Artificial Intelligence In Business Icons PDF
This pie chart focuses on the impact of AI after being implemented in the business such as rising revenues, better customer experience, improved decision making, etc.Deliver and pitch your topic in the best possible manner with this Impact Of Artificial Intelligence In Business Deploying Artificial Intelligence In Business Icons PDF. Use them to share invaluable insights on Improves Customer, Experience Support, Technologies Makes and impress your audience. This template can be altered and modified as per your expectations. So, grab it now.
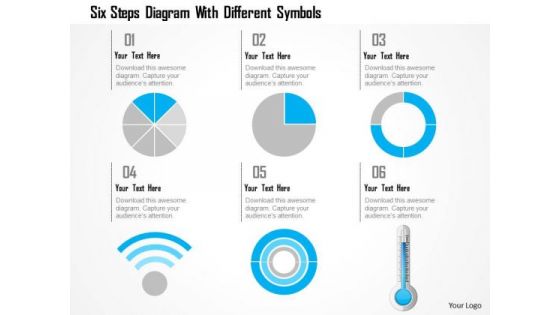
Business Diagram Six Steps Diagram With Different Symbols Presentation Template
This power point template has been crafted with graphic of 3d pie charts with Wi-Fi symbol and thermometer. This PPT contains the concept of calculation and result analysis. Use this PPT for your business and science related presentations.
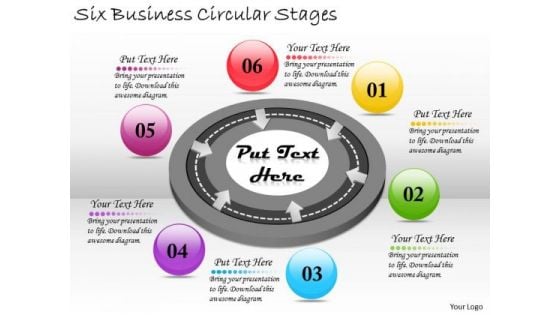
Timeline PowerPoint Template Six Business Circular Stages
Make Your Dreams A Reality With Our Timeline Six Business Circular Stages Powerpoint Templates. Your Ideas Will Begin To Take Shape. Breathe Life Into Your Dreams With Our Circle Charts Powerpoint Templates. Give Your Thoughts A Tangible Form.
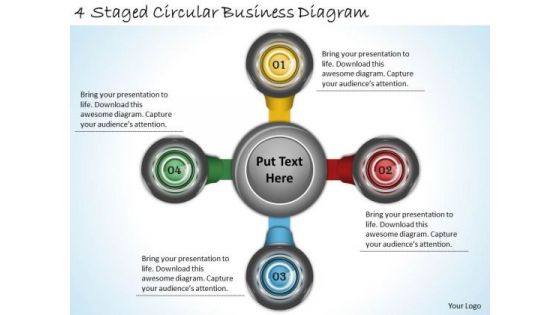
Timeline Ppt Template 4 Staged Circular Business Diagram
Our Timeline Ppt Template 4 Staged Circular Business Diagram Powerpoint Templates Abhor Doodling. They Never Let The Interest Flag. Our Circle Charts Powerpoint Templates Make Good Beasts Of Burden. Place All Your Demands On Them.
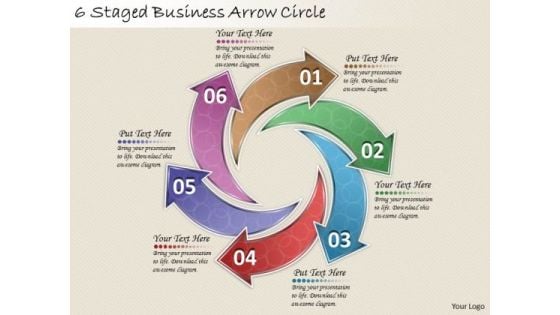
Timeline Ppt Template 6 Staged Business Arrow Circle
Plan For All Contingencies With Our Timeline Ppt Template 6 Staged Business Arrow Circle Powerpoint Templates. Douse The Fire Before It Catches. Generate Camaraderie With Our Circle Charts Powerpoint Templates. Good Wishes Will Come Raining Down.
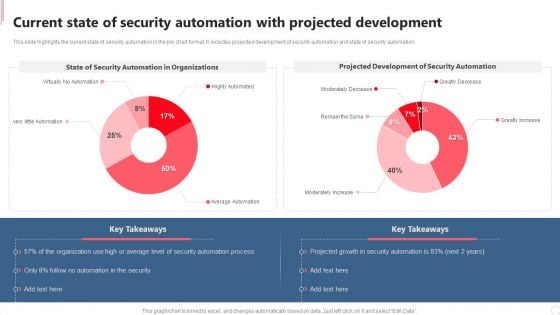
Current State Of Security Automation With Projected Development Rules PDF
This slide highlights the current state of security automation in the pie chart format. It includes projected development of security automation and state of security automation. If you are looking for a format to display your unique thoughts, then the professionally designed Current State Of Security Automation With Projected Development Rules PDF is the one for you. You can use it as a Google Slides template or a PowerPoint template. Incorporate impressive visuals, symbols, images, and other charts. Modify or reorganize the text boxes as you desire. Experiment with shade schemes and font pairings. Alter, share or cooperate with other people on your work. Download Current State Of Security Automation With Projected Development Rules PDF and find out how to give a successful presentation. Present a perfect display to your team and make your presentation unforgettable.
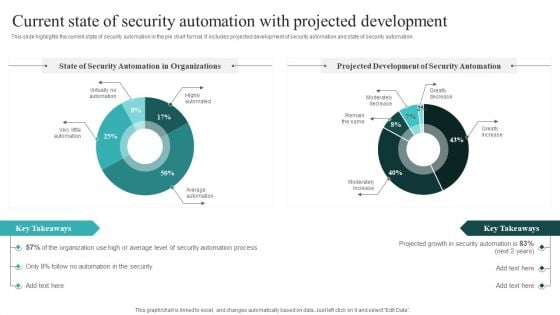
Current State Of Security Automation With Projected Development Slides PDF
This slide highlights the current state of security automation in the pie chart format. It includes projected development of security automation and state of security automation. If you are looking for a format to display your unique thoughts, then the professionally designed IT Security Automation Systems Guide Different Security Automation Tools With Pros And Cons Summary PDF is the one for you. You can use it as a Google Slides template or a PowerPoint template. Incorporate impressive visuals, symbols, images, and other charts. Modify or reorganize the text boxes as you desire. Experiment with shade schemes and font pairings. Alter, share or cooperate with other people on your work. Download IT Security Automation Systems Guide Different Security Automation Tools With Pros And Cons Summary PDF and find out how to give a successful presentation. Present a perfect display to your team and make your presentation unforgettable.
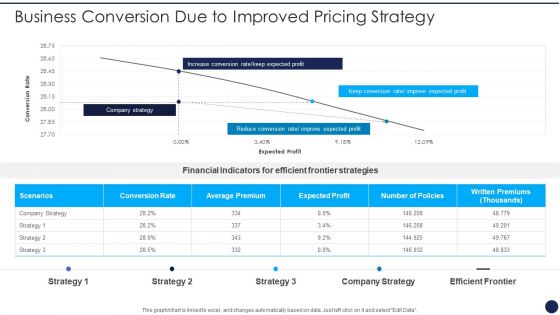
Product Pricing Strategies Analysis Business Conversion Due To Improved Pricing Strategy Slides PDF
This graph or chart is linked to excel, and changes automatically based on data. Just left click on it and select Edit Data. Deliver an awe inspiring pitch with this creative Product Pricing Strategies Analysis Business Conversion Due To Improved Pricing Strategy Slides PDF bundle. Topics like Increase Conversion Rate, Keep Expected Profit, Reduce Conversion Rate, Improve Expected Profit can be discussed with this completely editable template. It is available for immediate download depending on the needs and requirements of the user.

Timeline Ppt Template 3 Staged Circular Diagram
Be The Doer With Our Timeline Ppt Template 3 Staged Circular Diagram Powerpoint Templates. Put Your Thoughts Into Practice. Your Ideas Will Do The Trick. Wave The Wand With Our Circle Charts Powerpoint Templates.
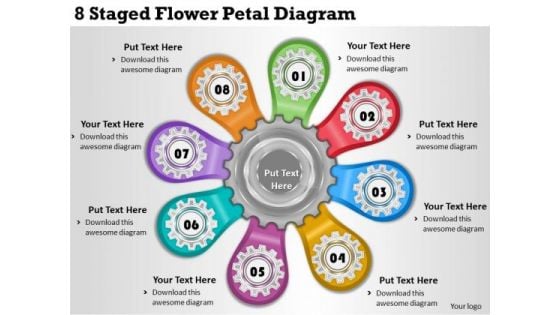
Timeline Ppt Template 8 Staged Flower Petal Diagram
Be The Dramatist With Our Timeline Ppt Template 8 Staged Flower Petal Diagram Powerpoint Templates. Script Out The Play Of Words. Put Our Circle Charts Powerpoint Templates Into The Draw. Your Thoughts Will Win The Lottery.
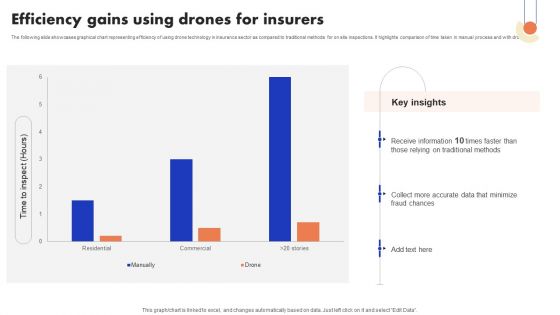
Implementation Of Digital Advancement Techniques Efficiency Gains Using Drones Pictures PDF
The following slide showcases graphical chart representing efficiency of using drone technology in insurance sector as compared to traditional methods for on site inspections. It highlights comparison of time taken in manual process and with drone. Want to ace your presentation in front of a live audience Our Implementation Of Digital Advancement Techniques Efficiency Gains Using Drones Pictures PDF can help you do that by engaging all the users towards you. Slidegeeks experts have put their efforts and expertise into creating these impeccable powerpoint presentations so that you can communicate your ideas clearly. Moreover, all the templates are customizable, and easy to edit and downloadable. Use these for both personal and commercial use.
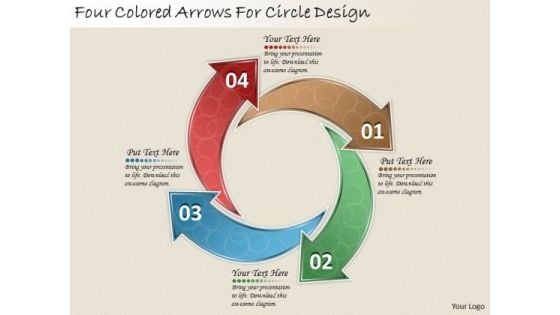
Timeline Ppt Template Four Colored Arrows For Circle Design
Draw On The Experience Of Our Timeline Ppt Template Four Colored Arrows For Circle Design Powerpoint Templates. They Imbibe From Past Masters. Drink The Nectar Of Our Circle Charts Powerpoint Templates. Give Your Thoughts A Long Life.
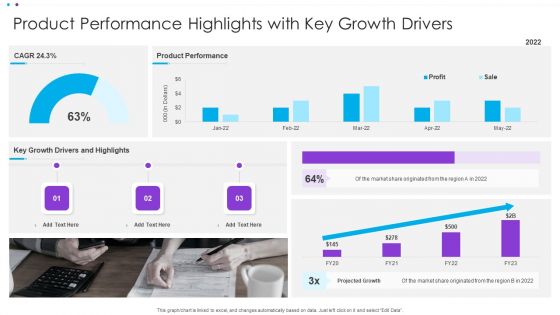
Product Performance Highlights With Key Growth Drivers Ppt Pictures Design Templates PDF
This graph or chart is linked to excel, and changes automatically based on data. Just left click on it and select Edit Data. Pitch your topic with ease and precision using this Product Performance Highlights With Key Growth Drivers Ppt Pictures Design Templates PDF. This layout presents information on Product Performance, Key Growth, Projected Growth. It is also available for immediate download and adjustment. So, changes can be made in the color, design, graphics or any other component to create a unique layout.
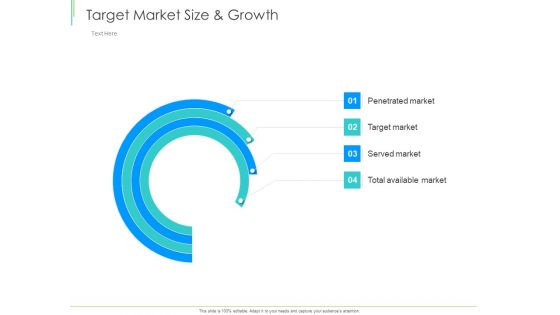
Marketing Plan Implementation Target Market Size And Growth Ppt File Model PDF
This graph or chart is linked to excel, and changes automatically based on data. Just left click on it and select Edit Data. Deliver an awe-inspiring pitch with this creative marketing plan implementation target market size and growth ppt file model pdf bundle. Topics like target market size and growth can be discussed with this completely editable template. It is available for immediate download depending on the needs and requirements of the user.

Byjus Investor Capital Financing Pitch Deck Byjus Annual Revenue And Growth Rate Background PDF
This slide provides information about the annual revenue and growth rate of Byjus in terms of graph and line chart for 3 years.Deliver an awe inspiring pitch with this creative Byjus Investor Capital Financing Pitch Deck Byjus Annual Revenue And Growth Rate Background PDF bundle. Topics like Annual Revenue, Annual Growth, Previous Period can be discussed with this completely editable template. It is available for immediate download depending on the needs and requirements of the user.
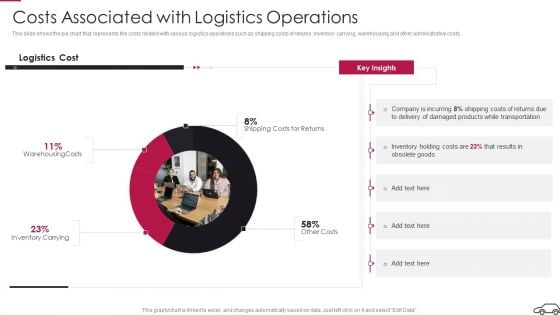
Continual Improvement Procedure In Supply Chain Costs Associated With Logistics Operations Diagrams PDF
This slide shows the pie chart that represents the costs related with various logistics operations such as shipping costs of returns, inventory carrying, warehousing and other administrative costs.Deliver an awe inspiring pitch with this creative Continual Improvement Procedure In Supply Chain Costs Associated With Logistics Operations Diagrams PDF bundle. Topics like Damaged Products, Transportation, Inventory Holding can be discussed with this completely editable template. It is available for immediate download depending on the needs and requirements of the user.
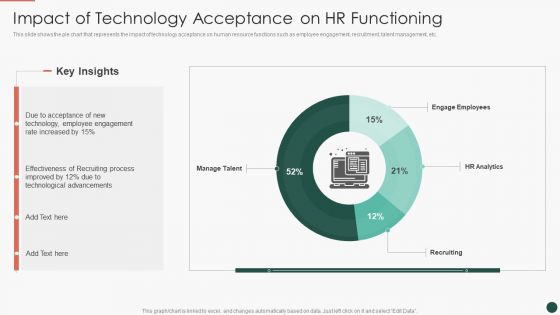
Developing HR Process Flow Impact Of Technology Acceptance On HR Functioning Elements PDF
This slide shows the pie chart that represents the impact of technology acceptance on human resource functions such as employee engagement, recruitment, talent management, etc.Deliver an awe inspiring pitch with this creative Developing HR Process Flow Impact Of Technology Acceptance On HR Functioning Elements PDF bundle. Topics like Employee Engagement, Effectiveness Of Recruiting, Technological Advancements can be discussed with this completely editable template. It is available for immediate download depending on the needs and requirements of the user.
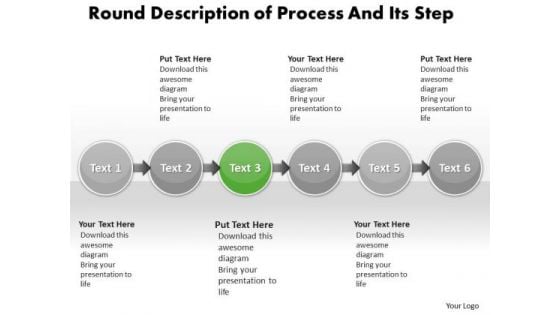
Ppt Horizontal Description Of Process And Its Step PowerPoint Templates
PPT horizontal description of process and its step PowerPoint Templates-Round charts show the relative importance of values over a period of time. Although Round charts are similar to line charts, area charts emphasize the amount of change or magnitude of values, rather than time and the rate of change. This PowerPoint Diagram is an excellent graphic to attract the attention of and understanding by your audience to improve earnings.-PPT horizontal description of process and its step PowerPoint Templates-Analysis, Arrow, Background, Backlink, Circle, Code, Content, Diagram, Engine, Illustration, Keyword, Optimization, Offpage, Process, Search, Template, Tracking, Unpage, Violet, Visitor, Expose your team to a brave new world. Challenge preset boundaries with our Ppt Horizontal Description Of Process And Its Step PowerPoint Templates.
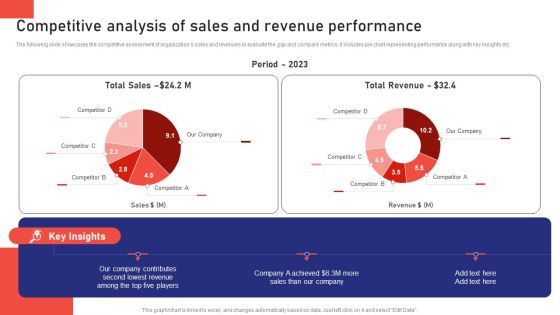
Sales Risk Assessment For Profit Maximization Competitive Analysis Of Sales And Revenue Performance Introduction PDF
The following slide showcases the competitive assessment of organizations sales and revenues to evaluate the gap and compare metrics. It includes pie chart representing performance along with key insights etc. Slidegeeks is one of the best resources for PowerPoint templates. You can download easily and regulate Sales Risk Assessment For Profit Maximization Competitive Analysis Of Sales And Revenue Performance Introduction PDF for your personal presentations from our wonderful collection. A few clicks is all it takes to discover and get the most relevant and appropriate templates. Use our Templates to add a unique zing and appeal to your presentation and meetings. All the slides are easy to edit and you can use them even for advertisement purposes.
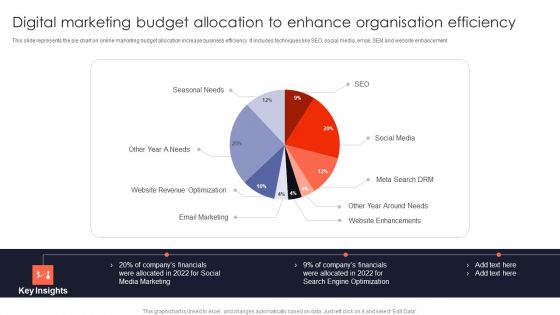
Digital Marketing Budget Allocation To Enhance Organisation Efficiency Mockup PDF
This slide represents the pie chart on online marketing budget allocation increase business efficiency. It includes techniques like SEO, social media, email, SEM and website enhancement, Deliver an awe inspiring pitch with this creative Digital Marketing Budget Allocation To Enhance Organisation Efficiency Mockup PDF bundle. Topics like Revenue Optimization, Seasonal Needs, Engine Optimization can be discussed with this completely editable template. It is available for immediate download depending on the needs and requirements of the user.
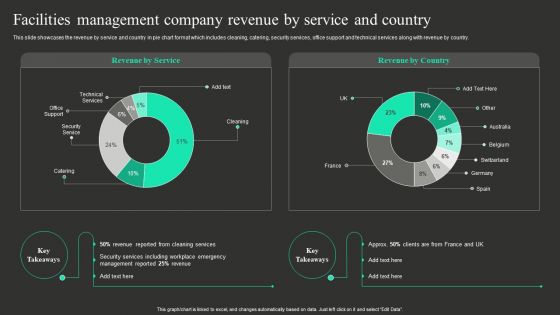
Facilities Management Company Revenue By Service And Country Information PDF
This slide showcases the revenue by service and country in pie chart format which includes cleaning, catering, security services, office support and technical services along with revenue by country. If you are looking for a format to display your unique thoughts, then the professionally designed Facilities Management Company Revenue By Service And Country Information PDF is the one for you. You can use it as a Google Slides template or a PowerPoint template. Incorporate impressive visuals, symbols, images, and other charts. Modify or reorganize the text boxes as you desire. Experiment with shade schemes and font pairings. Alter, share or cooperate with other people on your work. Download Facilities Management Company Revenue By Service And Country Information PDF and find out how to give a successful presentation. Present a perfect display to your team and make your presentation unforgettable.
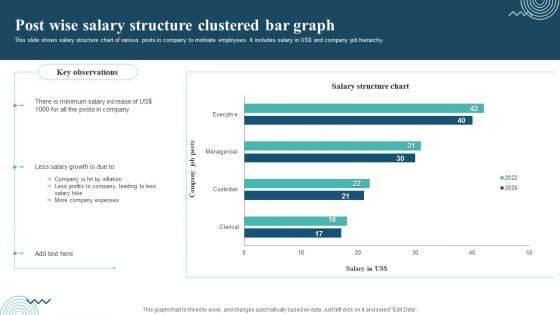
Post Wise Salary Structure Clustered Bar Graph Professional PDF
This slide shows salary structure chart of various posts in company to motivate employees. It includes salary in US dollar and company job hierarchy. Showcasing this set of slides titled Post Wise Salary Structure Clustered Bar Graph Professional PDF. The topics addressed in these templates are Minimum Salary Increase, Less Salary Growth, Company Expenses. All the content presented in this PPT design is completely editable. Download it and make adjustments in color, background, font etc. as per your unique business setting.
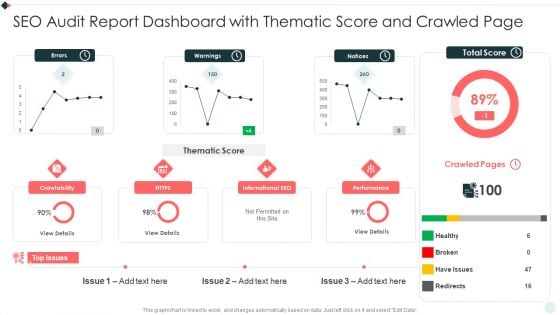
SEO Audit Summary To Increase SEO Audit Report Dashboard With Thematic Score Download PDF
This graph or chart is linked to excel, and changes automatically based on data. Just left click on it and select Edit Data. Deliver an awe inspiring pitch with this creative SEO Audit Summary To Increase SEO Audit Report Dashboard With Thematic Score Download PDF bundle. Topics like Total Score, Crawled Pages, Top Issues can be discussed with this completely editable template. It is available for immediate download depending on the needs and requirements of the user.
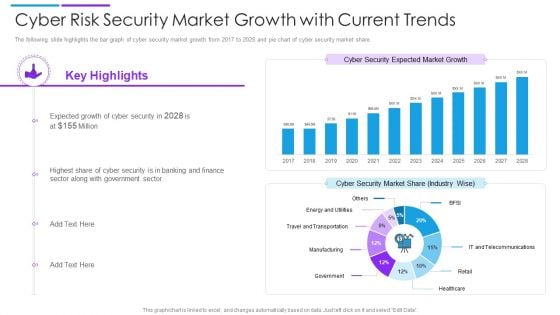
Cyber Risk Security Market Growth With Current Trends Summary PDF
The following slide highlights the bar graph of cyber security market growth from 2017 to 2028 and pie chart of cyber security market share. Showcasing this set of slides titled cyber risk security market growth with current trends summary pdf. The topics addressed in these templates are cyber security market share, cyber security expected market growth, banking and finance. All the content presented in this PPT design is completely editable. Download it and make adjustments in color, background, font etc. as per your unique business setting.
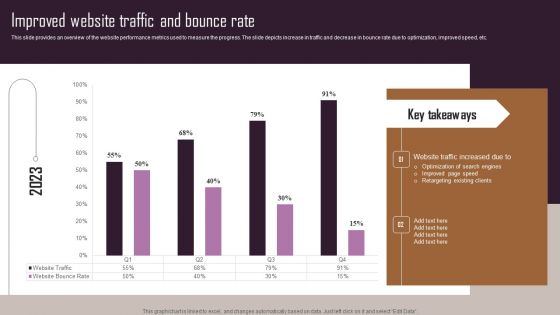
Effective NPO Promotional Strategies For Recruit Volunteers Improved Website Traffic And Bounce Rate Themes PDF
This slide provides an overview of the website performance metrics used to measure the progress. The slide depicts increase in traffic and decrease in bounce rate due to optimization, improved speed, etc. Are you searching for a Effective NPO Promotional Strategies For Recruit Volunteers Improved Website Traffic And Bounce Rate Themes PDF that is uncluttered, straightforward, and original Its easy to edit, and you can change the colors to suit your personal or business branding. For a presentation that expresses how much effort you have put in, this template is ideal With all of its features, including tables, diagrams, statistics, and lists, its perfect for a business plan presentation. Make your ideas more appealing with these professional slides. Download Effective NPO Promotional Strategies For Recruit Volunteers Improved Website Traffic And Bounce Rate Themes PDF from Slidegeeks today.

Improving Corporate Performance Sales Opportunity Monitoring Dashboard Portrait PDF
This graph or chart is linked to excel, and changes automatically based on data. Just left click on it and select Edit Data. Welcome to our selection of the Improving Corporate Performance Sales Opportunity Monitoring Dashboard Portrait PDF. These are designed to help you showcase your creativity and bring your sphere to life. Planning and Innovation are essential for any business that is just starting out. This collection contains the designs that you need for your everyday presentations. All of our PowerPoints are 100 percent editable, so you can customize them to suit your needs. This multi-purpose template can be used in various situations. Grab these presentation templates today.
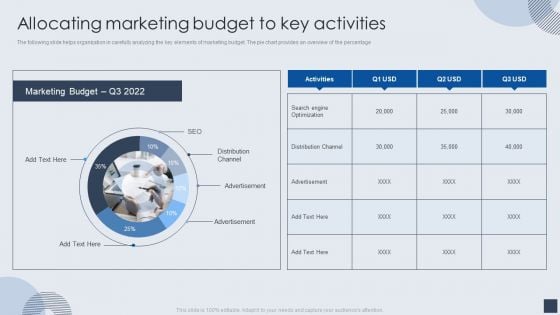
Implementing Marketing Mix Strategy To Enhance Overall Performance Allocating Marketing Budget To Key Activities Mockup PDF
The following slide helps organization in carefully analyzing the key elements of marketing budget. The pie chart provides an overview of the percentage. Deliver and pitch your topic in the best possible manner with this Implementing Marketing Mix Strategy To Enhance Overall Performance Allocating Marketing Budget To Key Activities Mockup PDF. Use them to share invaluable insights on Marketing Budget, Optimization, Advertisement and impress your audience. This template can be altered and modified as per your expectations. So, grab it now.
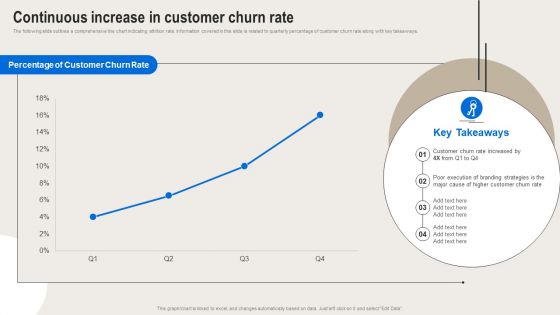
Formulating Branding Strategy To Enhance Revenue And Sales Continuous Increase In Customer Churn Rate Themes PDF
The following slide outlines a comprehensive line chart indicating attrition rate. Information covered in this slide is related to quarterly percentage of customer churn rate along with key takeaways. Boost your pitch with our creative Formulating Branding Strategy To Enhance Revenue And Sales Continuous Increase In Customer Churn Rate Themes PDF. Deliver an awe-inspiring pitch that will mesmerize everyone. Using these presentation templates you will surely catch everyones attention. You can browse the ppts collection on our website. We have researchers who are experts at creating the right content for the templates. So you do not have to invest time in any additional work. Just grab the template now and use them.
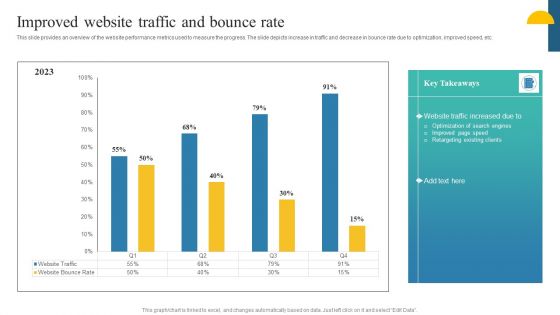
Charity Fundraising Marketing Plan Improved Website Traffic And Bounce Rate Graphics PDF
This slide provides an overview of the website performance metrics used to measure the progress. The slide depicts increase in traffic and decrease in bounce rate due to optimization, improved speed, etc. Presenting this PowerPoint presentation, titled Charity Fundraising Marketing Plan Improved Website Traffic And Bounce Rate Graphics PDF, with topics curated by our researchers after extensive research. This editable presentation is available for immediate download and provides attractive features when used. Download now and captivate your audience. Presenting this Charity Fundraising Marketing Plan Improved Website Traffic And Bounce Rate Graphics PDF. Our researchers have carefully researched and created these slides with all aspects taken into consideration. This is a completely customizable Charity Fundraising Marketing Plan Improved Website Traffic And Bounce Rate Graphics PDF that is available for immediate downloading. Download now and make an impact on your audience. Highlight the attractive features available with our PPTs.
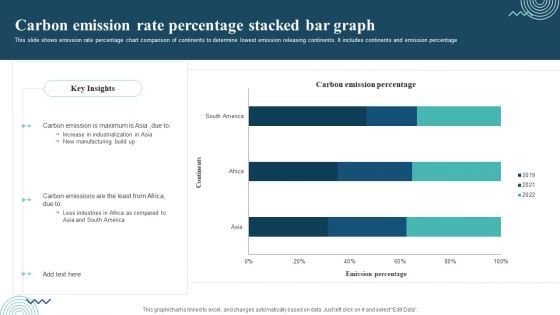
Carbon Emission Rate Percentage Stacked Bar Graph Rules PDF
This slide shows emission rate percentage chart comparison of continents to determine lowest emission releasing continents. It includes continents and emission percentage Showcasing this set of slides titled Carbon Emission Rate Percentage Stacked Bar Graph Rules PDF. The topics addressed in these templates are Carbon Emission, Increase In Industrialization, New Manufacturing. All the content presented in this PPT design is completely editable. Download it and make adjustments in color, background, font etc. as per your unique business setting.
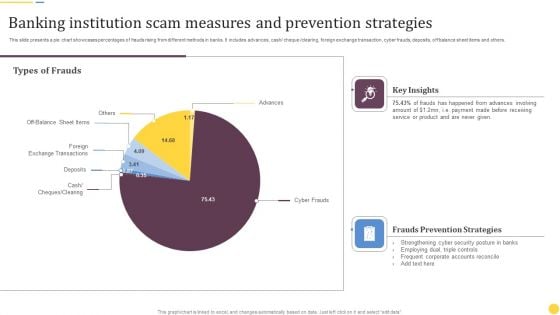
Banking Institution Scam Measures And Prevention Strategies Information PDF
This slide presents a pie chart showcases percentages of frauds rising from different methods in banks. It includes advances, cash or cheque or clearing, foreign exchange transaction, cyber frauds, deposits, off balance sheet items and others. Showcasing this set of slides titled Banking Institution Scam Measures And Prevention Strategies Information PDF. The topics addressed in these templates are Key Insights, Frauds Prevention Strategies, Types Of Frauds. All the content presented in this PPT design is completely editable. Download it and make adjustments in color, background, font etc. as per your unique business setting.
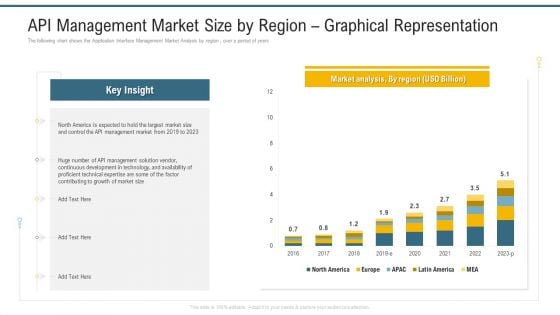
API Management Market Size By Region Graphical Representation Ppt Layouts Visuals PDF
The following chart shows the Application Interface Management Market Analysis by region , over a period of years. Deliver and pitch your topic in the best possible manner with this api management market size by region graphical representation ppt layouts visuals pdf. Use them to share invaluable insights on development in technology, growth of market size, management market and impress your audience. This template can be altered and modified as per your expectations. So, grab it now.
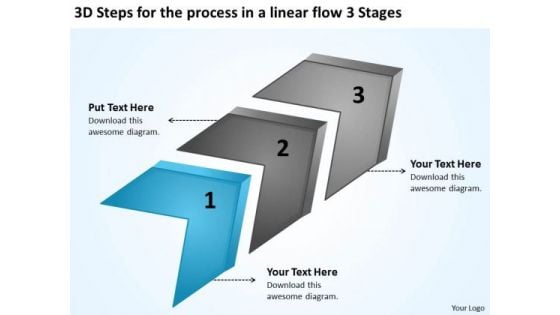
Steps For The Process In A Linear Flow 3 Stages Samples Of Business Plans PowerPoint Slides
We present our steps for the process in a linear flow 3 stages samples of business plans PowerPoint Slides.Download our Business PowerPoint Templates because you can Lead your flock steadily to greater heights. Look around at the vast potential of achievement around you. Download our Arrows PowerPoint Templates because they will Amplify your thoughts via our appropriate templates. Use our Shapes PowerPoint Templates because you have the basic goal in mind. Present our Process and Flows PowerPoint Templates because this template helps you to illustrate your method, piece by piece, and interlock the whole process in the minds of your audience. Download our Flow charts PowerPoint Templates because our PowerPoint templates give this step by step process to acheive the aim.Use these PowerPoint slides for presentations relating to Budget, business charts, character, chart, drawing on, finance, financial, flow, graph, growth, hand, isolated, horizontal, leadership, marker, pen, power, professional, progress, reducing, showing one, the concept, the employee, the line manager, success, space, upward leader. The prominent colors used in the PowerPoint template are Blue, Black, White. The feedback we get is that our steps for the process in a linear flow 3 stages samples of business plans PowerPoint Slides provide great value for your money. Be assured of finding the best projection to highlight your words. The feedback we get is that our financial PowerPoint templates and PPT Slides are Adorable. People tell us our steps for the process in a linear flow 3 stages samples of business plans PowerPoint Slides are Spectacular. We assure you our charts PowerPoint templates and PPT Slides are Striking. We assure you our steps for the process in a linear flow 3 stages samples of business plans PowerPoint Slides are Enchanting. The feedback we get is that our charts PowerPoint templates and PPT Slides are Luxuriant. Get familiar with our Steps For The Process In A Linear Flow 3 Stages Samples Of Business Plans PowerPoint Slides. They will prove an excellent ally.
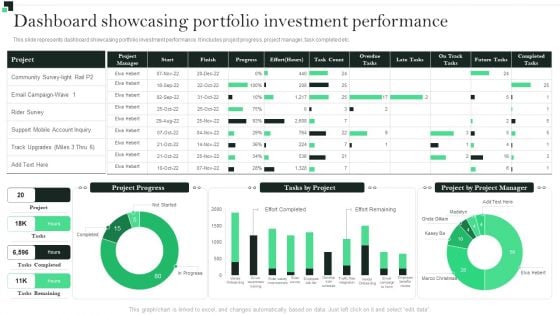
Dashboard Showcasing Portfolio Investment Performance Strategies To Enhance Portfolio Management Summary PDF
This slide represents dashboard showcasing portfolio investment performance. It includes project progress, project manager, task completed etc.Formulating a presentation can take up a lot of effort and time, so the content and message should always be the primary focus. The visuals of the PowerPoint can enhance the presenters message, so our Dashboard Showcasing Portfolio Investment Performance Strategies To Enhance Portfolio Management Summary PDF was created to help save time. Instead of worrying about the design, the presenter can concentrate on the message while our designers work on creating the ideal templates for whatever situation is needed. Slidegeeks has experts for everything from amazing designs to valuable content, we have put everything into Dashboard Showcasing Portfolio Investment Performance Strategies To Enhance Portfolio Management Summary PDF.
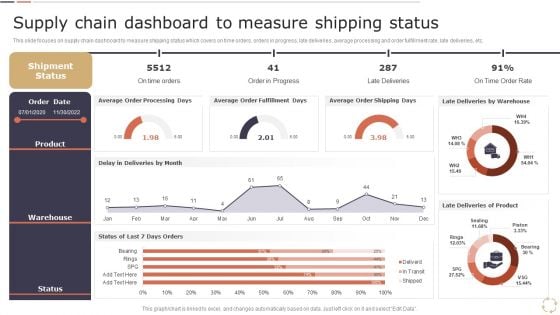
Optimizing Logistics Models To Enhance Supply Chain Management Supply Chain Dashboard To Measure Shipping Status Pictures PDF
This slide focuses on supply chain dashboard to measure shipping status which covers on time orders, orders in progress, late deliveries, average processing and order fulfillment rate, late deliveries, etc. Welcome to our selection of the Optimizing Logistics Models To Enhance Supply Chain Management Supply Chain Dashboard To Measure Shipping Status Pictures PDF. These are designed to help you showcase your creativity and bring your sphere to life. Planning and Innovation are essential for any business that is just starting out. This collection contains the designs that you need for your everyday presentations. All of our PowerPoints are 100 percent editable, so you can customize them to suit your needs. This multi purpose template can be used in various situations. Grab these presentation templates today.
Deploying Cyber Security Incident Response Administration Enterprise Cyber Risk Management Dashboard Icons PDF
This slide represents the key metrics dashboard representing details related to management of cyber security incidents by an enterprise. It includes key performance indicators such as risk analysis progress, risk rating breakdown etc. Whether you have daily or monthly meetings, a brilliant presentation is necessary. Deploying Cyber Security Incident Response Administration Enterprise Cyber Risk Management Dashboard Icons PDF can be your best option for delivering a presentation. Represent everything in detail using Deploying Cyber Security Incident Response Administration Enterprise Cyber Risk Management Dashboard Icons PDF and make yourself stand out in meetings. The template is versatile and follows a structure that will cater to your requirements. All the templates prepared by Slidegeeks are easy to download and edit. Our research experts have taken care of the corporate themes as well. So, give it a try and see the results.


 Continue with Email

 Home
Home


