Progressive Charts
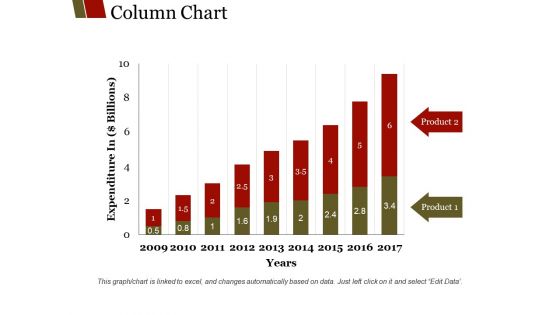
Column Chart Ppt PowerPoint Presentation Summary Graphics
This is a column chart ppt powerpoint presentation summary graphics. This is a nine stage process. The stages in this process are product, years, expenditure in billions, graph, business.
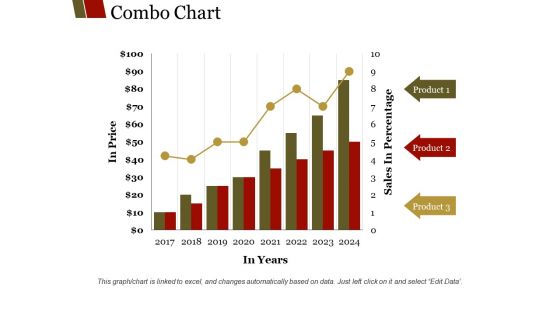
Combo Chart Ppt PowerPoint Presentation Summary Layouts
This is a combo chart ppt powerpoint presentation summary layouts. This is a eight stage process. The stages in this process are product, sales in percentage, in years, in price, graph.
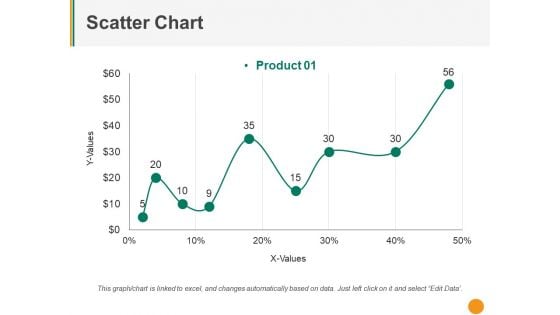
Scatter Chart Ppt PowerPoint Presentation Summary Smartart
This is a scatter chart ppt powerpoint presentation summary smartart. This is a nine stage process. The stages in this process are y values, x values, product, business, graph.
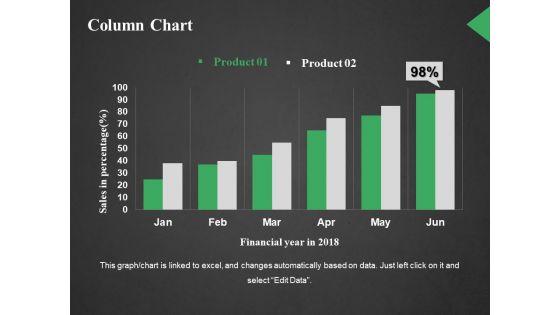
Column Chart Ppt PowerPoint Presentation Outline Styles
This is a column chart ppt powerpoint presentation outline styles. This is a two stage process. The stages in this process are sales in percentage, financial year in, business, marketing, graph.
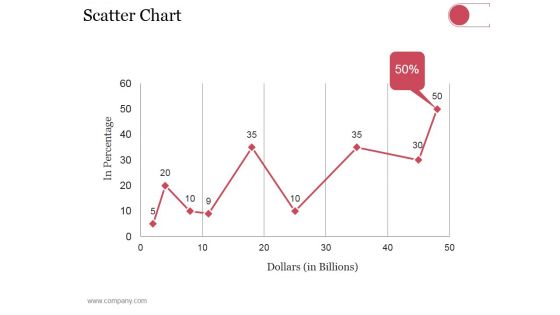
Scatter Chart Ppt PowerPoint Presentation Styles Show
This is a scatter chart ppt powerpoint presentation styles show. This is a nine stage process. The stages in this process are dollars, in percentage, finance, growth strategy.
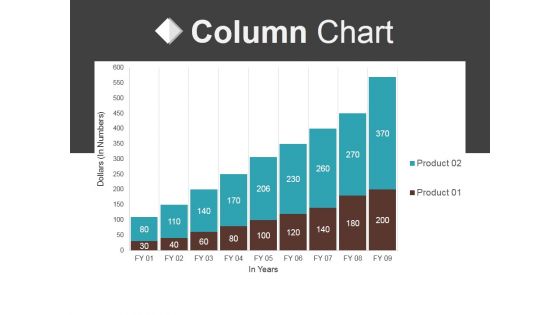
Column Chart Ppt PowerPoint Presentation Professional Vector
This is a column chart ppt powerpoint presentation professional vector. This is a nine stage process. The stages in this process are business, marketing, graph, finance, growth.
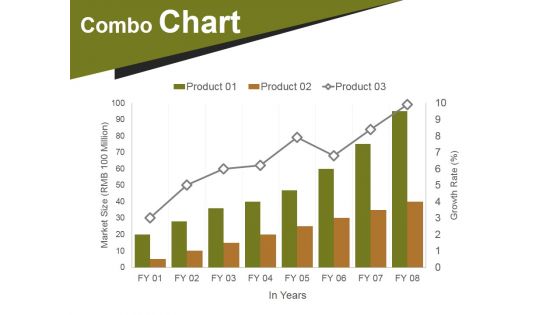
Combo Chart Ppt PowerPoint Presentation Portfolio Infographics
This is a combo chart ppt powerpoint presentation portfolio infographics. This is a eight stage process. The stages in this process are market size, growth, years, finance, business.
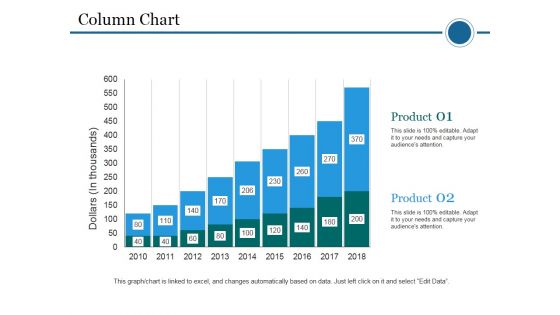
Column Chart Ppt PowerPoint Presentation Ideas Styles
This is a column chart ppt powerpoint presentation ideas styles. This is a two stage process. The stages in this process are dollars, product, planning, business, years.
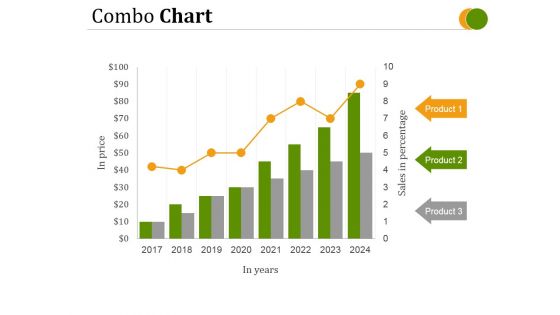
Combo Chart Ppt PowerPoint Presentation Deck
This is a combo chart ppt powerpoint presentation deck. This is a eight stage process. The stages in this process are in price, in years, product.
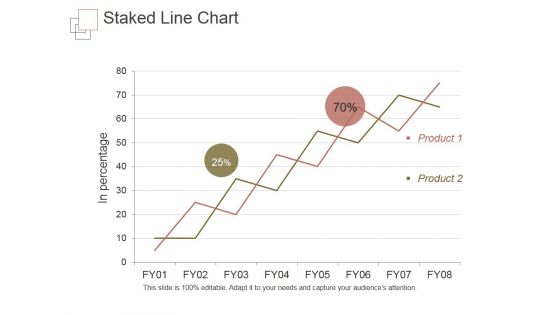
Staked Line Chart Ppt PowerPoint Presentation Topics
This is a staked line chart ppt powerpoint presentation topics. This is a two stage process. The stages in this process are in percentage, product.
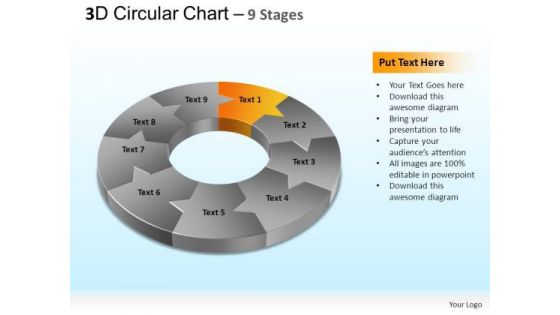
PowerPoint Designs Strategy Circular Chart Ppt Presentation
PowerPoint_Designs_Strategy_circular_chart_PPT_Presentation Business Power Points-The Circle of Life - a concept emmbedded in our minds and hence easy to comprehend. Life and Business is made up of processes comprising stages that flow from one to another. An excellent graphic to attract the attention of and understanding by your audience to improve earnings.-These amazing PowerPoint pre-designed slides and PowerPoint templates have been carefully created by our team of experts to help you impress your audience. Our stunning collection of Powerpoint slides are 100% editable and can easily fit in any PowerPoint presentations. By using these animations and graphics in PowerPoint and you can easily make professional presentations. Any text can be entered at any point in the PowerPoint template or slide. Just DOWNLOAD our awesome PowerPoint templates and you are ready to go.
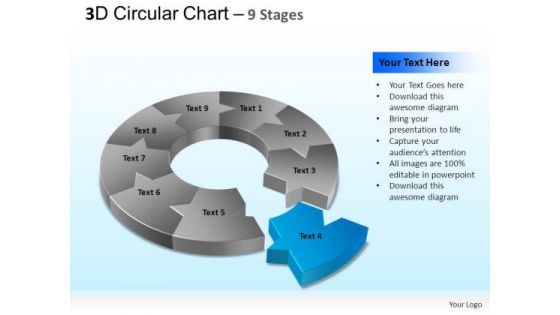
PowerPoint Layout Process Circular Chart Ppt Backgrounds
PowerPoint_Layout_Process_circular_chart_PPT_Backgrounds Business Power Points-The Circle of Life - a concept emmbedded in our minds and hence easy to comprehend. Life and Business is made up of processes comprising stages that flow from one to another. An excellent graphic to attract the attention of and understanding by your audience to improve earnings.-These amazing PowerPoint pre-designed slides and PowerPoint templates have been carefully created by our team of experts to help you impress your audience. Our stunning collection of Powerpoint slides are 100% editable and can easily fit in any PowerPoint presentations. By using these animations and graphics in PowerPoint and you can easily make professional presentations. Any text can be entered at any point in the PowerPoint template or slide. Just DOWNLOAD our awesome PowerPoint templates and you are ready to go. Give credit where its due. Just download, type and present.
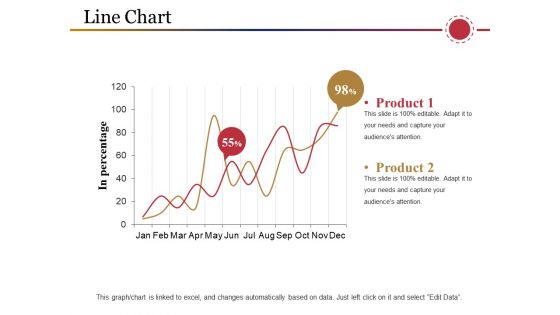
Line Chart Ppt PowerPoint Presentation Inspiration Samples
This is a line chart ppt powerpoint presentation inspiration samples. This is a two stage process. The stages in this process are product, in percentage, business, marketing, graph.
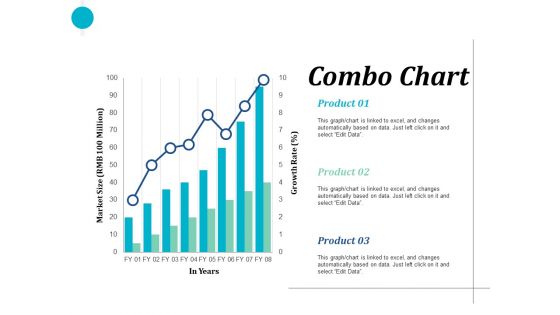
Combo Chart Finance Ppt PowerPoint Presentation Clipart
This is a combo chart finance ppt powerpoint presentation pictures show. This is a two stage process. The stages in this process are finance, marketing, management, investment, analysis.
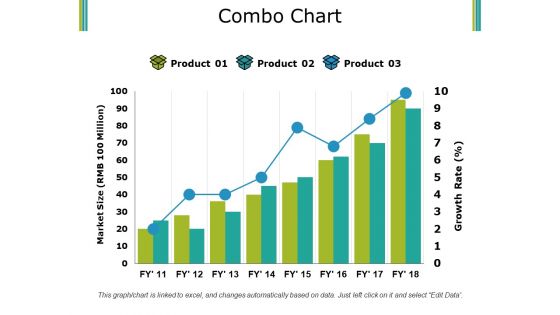
Combo Chart Ppt PowerPoint Presentation Pictures Summary
This is a combo chart ppt powerpoint presentation pictures summary. This is a three stage process. The stages in this process are product, market size, growth rate, bar graph, success.
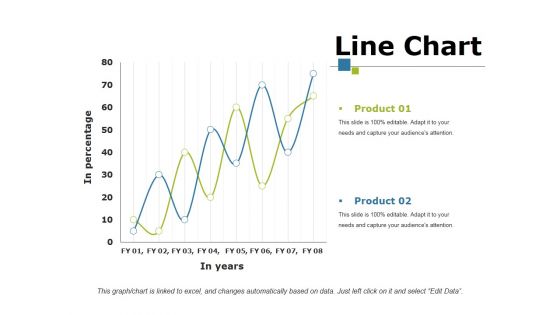
Line Chart Ppt PowerPoint Presentation Portfolio Mockup
This is a line chart ppt powerpoint presentation portfolio mockup. This is a two stage process. The stages in this process are product, in percentage, in year, growth, success.
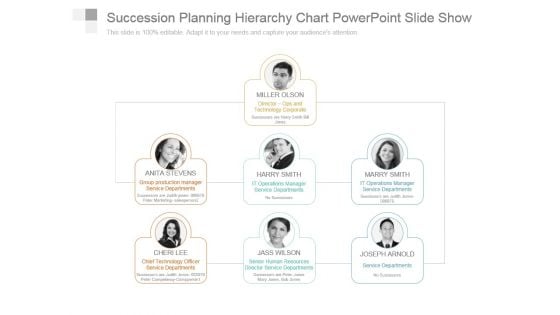
Succession Planning Hierarchy Chart Powerpoint Slide Show
This is a succession planning hierarchy chart powerpoint slide show. This is a three stage process. The stages in this process are miller olson director ops and technology corporate, anita stevens group production manager service departments, harry smith it operations manager service departments, marry smith it operations manager service departments, cheri lee chief technology officer service departments, jass wilson senior human resources director service departments, joseph arnold service departments.
Bar Chart Ppt PowerPoint Presentation Icon Information
This is a bar chart ppt powerpoint presentation icon information. This is a one stage process. The stages in this process are product, sales in percentage, financial years, bar graph, growth.
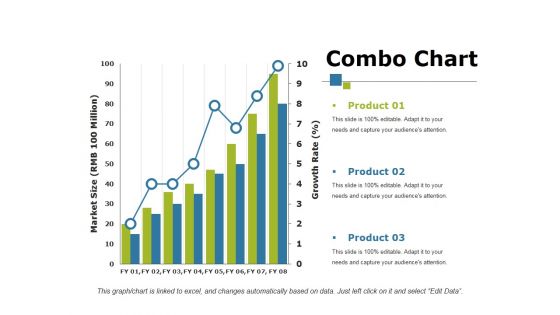
Combo Chart Ppt PowerPoint Presentation Show Influencers
This is a combo chart ppt powerpoint presentation show influencers. This is a three stage process. The stages in this process are product, bar graph, growth, growth rate, market size.
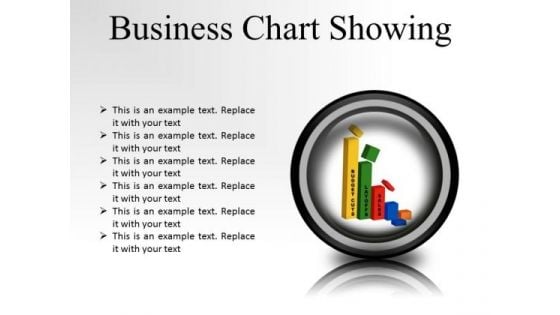
Business Chart Success PowerPoint Presentation Slides Cc
Microsoft Powerpoint Slides and Backgrounds with budget cuts layoffs and dropped sales business model Our Business Chart Success PowerPoint Presentation Slides Cc are really captivating. The audience will not take their eyes off you.
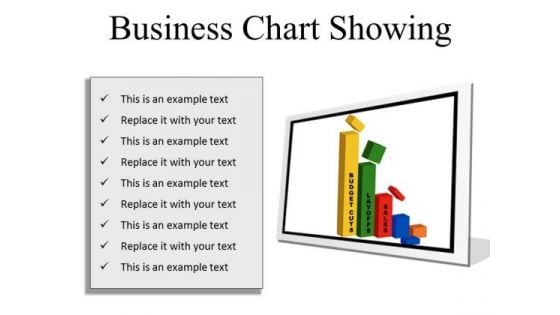
Business Chart Success PowerPoint Presentation Slides F
Microsoft Powerpoint Slides and Backgrounds with budget cuts layoffs and dropped sales business model Our Business Chart Success PowerPoint Presentation Slides F give exceptional value. You will be amazed at the awesome returns.
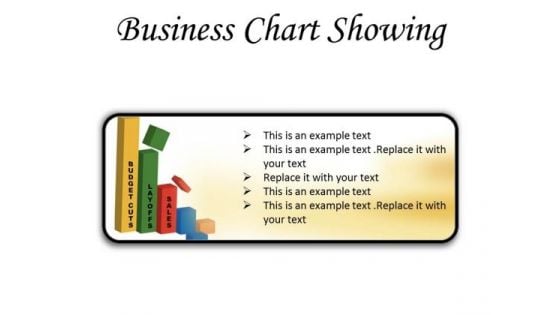
Business Chart Success PowerPoint Presentation Slides R
Microsoft Powerpoint Slides and Backgrounds with budget cuts layoffs and dropped sales business model Our Business Chart Success PowerPoint Presentation Slides R will ensure you make an impressive presentation You will be glad you tried us out.
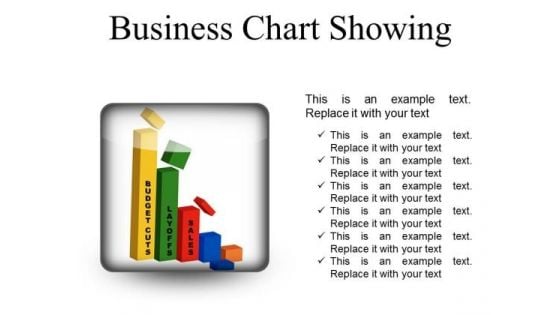
Business Chart Success PowerPoint Presentation Slides S
Microsoft Powerpoint Slides and Backgrounds with budget cuts layoffs and dropped sales business model Your presentations will become famous with our Business Chart Success PowerPoint Presentation Slides S. Dont waste time struggling with PowerPoint. Let us do it for you.
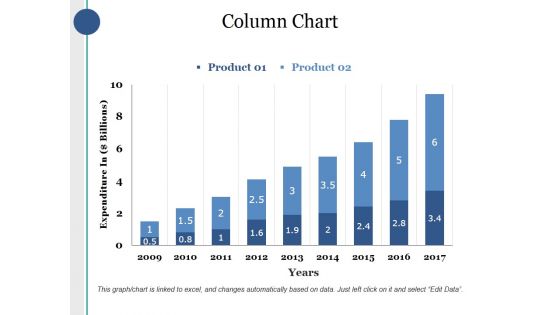
Column Chart Ppt PowerPoint Presentation Infographics Deck
This is a column chart ppt powerpoint presentation infographics deck. This is a two stage process. The stages in this process are product, expenditure in, years, bar graph, growth.
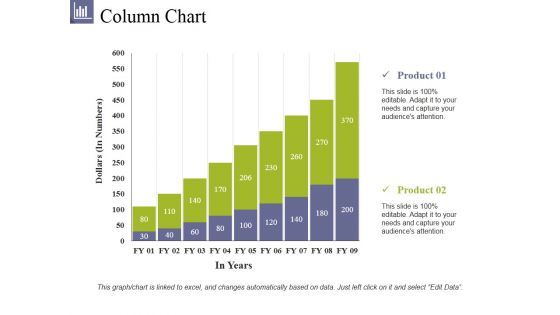
Column Chart Ppt PowerPoint Presentation File Summary
This is a column chart ppt powerpoint presentation file summary. This is a two stage process. The stages in this process are product, dollars, in years, bar graph, growth.
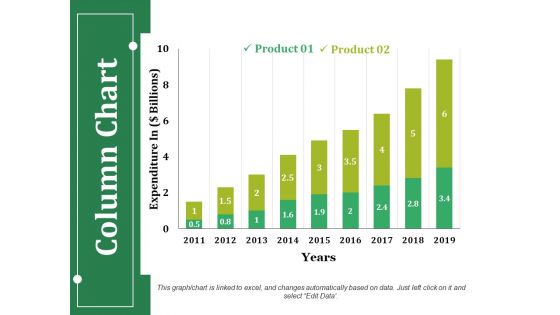
Column Chart Ppt PowerPoint Presentation Infographics Guidelines
This is a column chart ppt powerpoint presentation infographics guidelines. This is a two stage process. The stages in this process are product, expenditure in, years, business, bar graph.
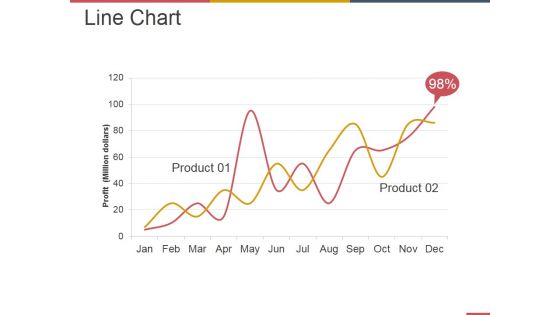
Line Chart Ppt PowerPoint Presentation Summary Information
This is a line chart ppt powerpoint presentation summary information. This is a two stage process. The stages in this process are business, strategy, marketing, analysis, profit million dollars.
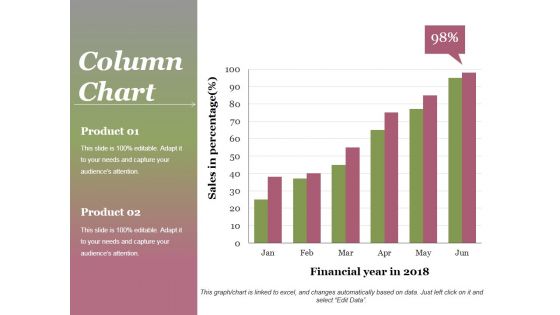
Column Chart Ppt PowerPoint Presentation Gallery Background
This is a column chart ppt powerpoint presentation gallery background. This is a two stage process. The stages in this process are product, sales in percentage, financial year, graph, success.
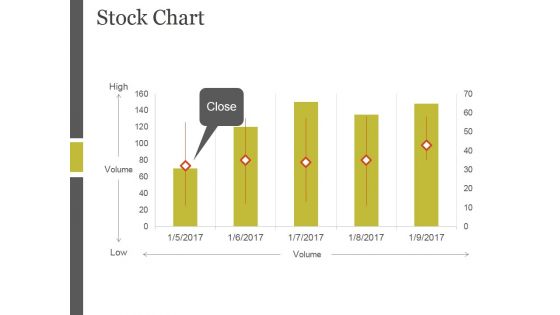
Stock Chart Ppt PowerPoint Presentation Backgrounds
This is a stock chart ppt powerpoint presentation backgrounds. This is a five stage process. The stages in this process are high, volume, low, close.
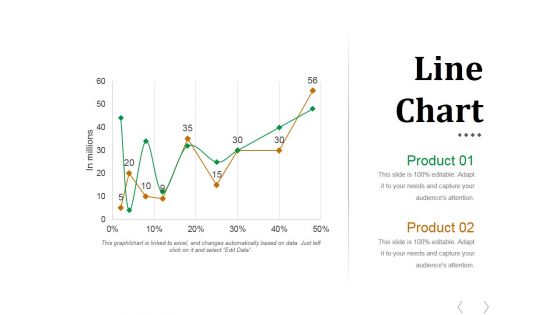
Line Chart Ppt PowerPoint Presentation Styles Outfit
This is a line chart ppt powerpoint presentation styles outfit. This is a two stage process. The stages in this process are business, finance, management, growth, planning.
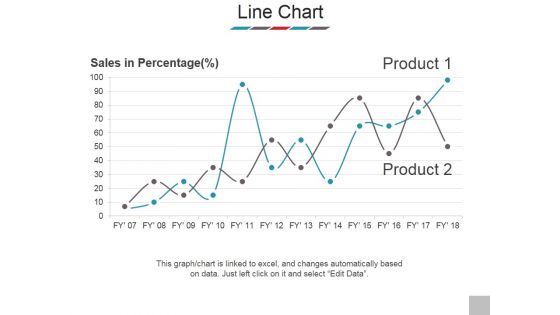
Line Chart Ppt PowerPoint Presentation Outline Samples
This is a line chart ppt powerpoint presentation outline samples. This is a two stage process. The stages in this process are sales in percentage, product, business, marketing, success.
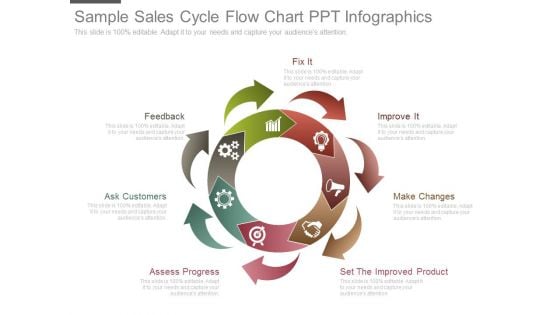
Sample Sales Cycle Flow Chart Ppt Infographics
This is a sample sales cycle flow chart ppt infographics. This is a seven stage process. The stages in this process are fix it, feedback, ask customers, assess progress, set the improved product, make changes, improve it.
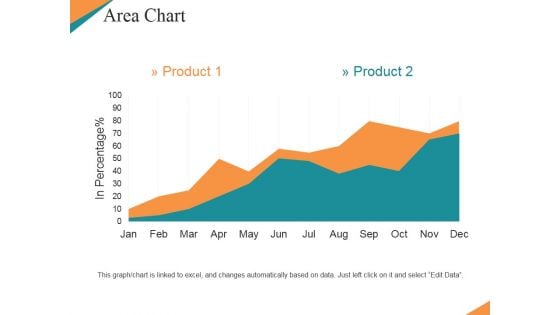
Area Chart Ppt PowerPoint Presentation Summary Templates
This is a area chart ppt powerpoint presentation summary templates. This is a two stage process. The stages in this process are product, in percentage, bar graph, growth, business.
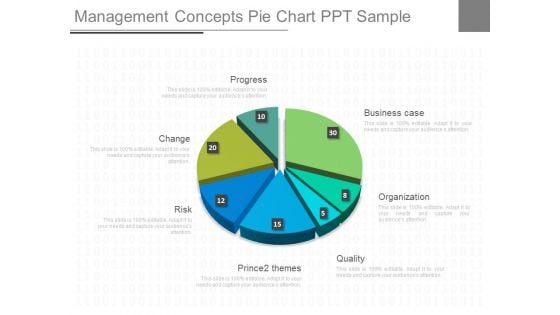
Management Concepts Pie Chart Ppt Sample
This is a management concepts pie chart ppt sample. This is a seven stage process. The stages in this process are business case, organization, quality, prince2 themes, risk, change, progress.
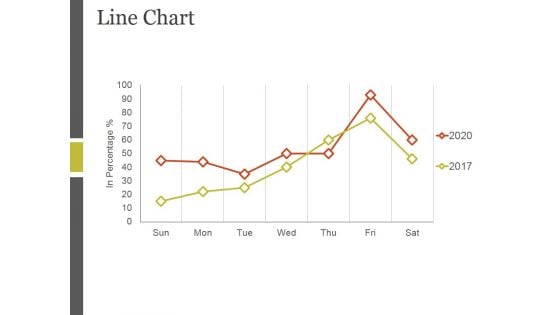
Line Chart Ppt PowerPoint Presentation Ideas Example
This is a line chart ppt powerpoint presentation ideas example. This is a two stage process. The stages in this process are sales in percentage, bar graph, business, marketing, growth.
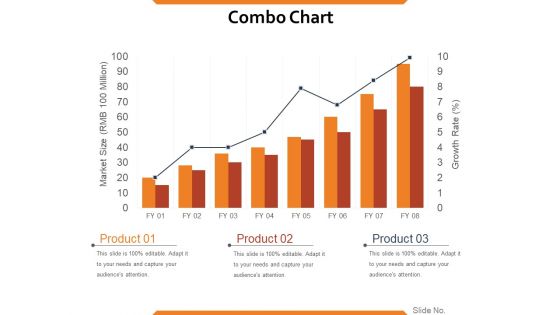
Combo Chart Ppt PowerPoint Presentation Styles Good
This is a combo chart ppt powerpoint presentation styles good. This is a eight stage process. The stages in this process are market size, growth rate, product, growth, strategy, graph, finance.
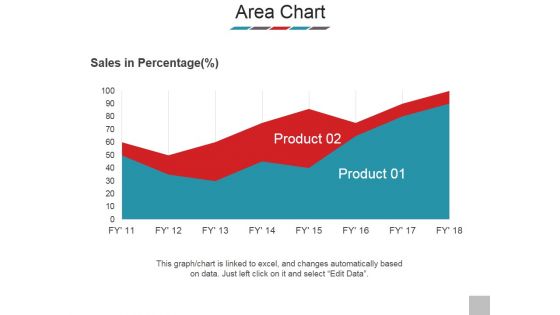
Area Chart Ppt PowerPoint Presentation Styles Images
This is a area chart ppt powerpoint presentation styles images. This is a two stage process. The stages in this process are sales in percentage, product, graph, business, marketing.
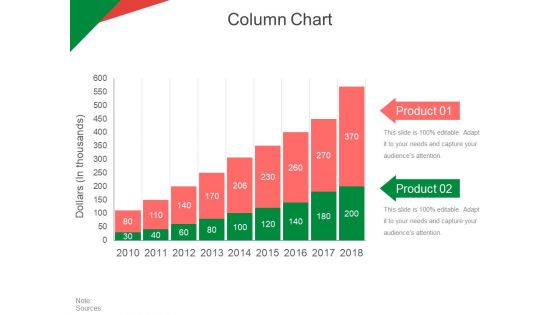
Column Chart Ppt PowerPoint Presentation Gallery Topics
This is a column chart ppt powerpoint presentation gallery topics. This is a two stage process. The stages in this process are dollars in thousands, product, business, marketing, strategy.
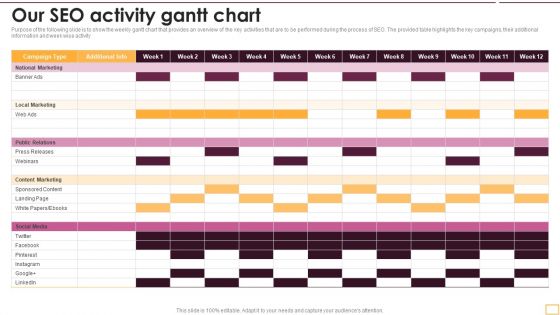
Implementing SEO Strategy To Enhance Business Performance Our SEO Activity Gantt Chart Sample PDF
Purpose of the following slide is to show the weekly gantt chart that provides an overview of the key activities that are to be performed during the process of SEO. The provided table highlights the key campaigns, their additional information and week wise activity. Design a highly optimized project management report using this well-researched Implementing SEO Strategy To Enhance Business Performance Our SEO Activity Gantt Chart Sample PDF. This layout can be used to present the professional details of a task or activity. Showcase the activities allocated to the business executives with this Gantt Chart PowerPoint theme. List down the column tasks in various timeframes and allocate time for each. In addition, also monitor the actual time and make comparisons to interpret the final progress using this innovative Gantt Chart Template. Showcase the work breakdown structure to attract your audience. Download and share it using Google Slides, if it suits your requirement.
PowerPoint Backgrounds Chart Footprints Ppt Theme
PowerPoint Backgrounds Chart Footprints PPT Theme -These high quality powerpoint pre-designed slides and powerpoint templates have been carefully created by our professional team to help you impress your audience. All slides have been created and are 100% editable in powerpoint. Each and every property of any graphic - color, size, orientation, shading, outline etc. can be modified to help you build an effective powerpoint presentation. Any text can be entered at any point in the powerpoint template or slide. Simply DOWNLOAD, TYPE and PRESENT! Market your product with our PowerPoint Backgrounds Chart Footprints Ppt Theme. Download without worries with our money back guaranteee.
PowerPoint Backgrounds Chart Footprints Ppt Presentation
PowerPoint Backgrounds Chart Footprints PPT Presentation -These high quality powerpoint pre-designed slides and powerpoint templates have been carefully created by our professional team to help you impress your audience. All slides have been created and are 100% editable in powerpoint. Each and every property of any graphic - color, size, orientation, shading, outline etc. can be modified to help you build an effective powerpoint presentation. Any text can be entered at any point in the powerpoint template or slide. Simply DOWNLOAD, TYPE and PRESENT! Do not doubt the effect of your plans. Positive outcomes are a fait accompli with our PowerPoint Backgrounds Chart Footprints Ppt Presentation.
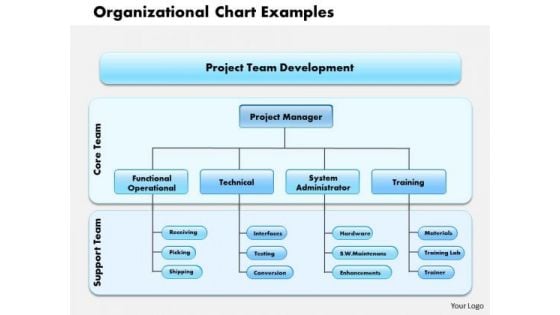
Business Framework Organizational Chart Examples PowerPoint Presentation
This image slide has been designed to display organizational charts. Use this image slide, in your presentations to depict business management. This image slide will enhance the quality of your presentations and will provide professional appearance to your presentations.
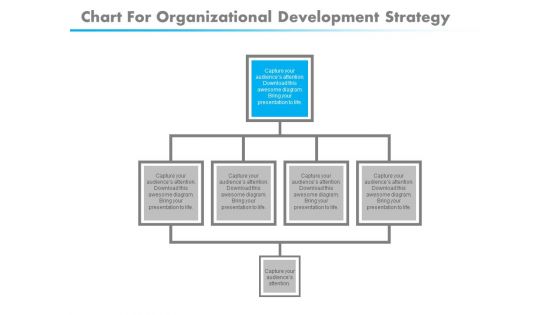
Chart For Organizational Development Strategy Powerpoint Template
Our above slide displays graphics of flow chart. This PowerPoint template may be used to display organizational development strategy. Download this template to leave permanent impression on your audience.

Chart Growth Business PowerPoint Template 1110
3d abstract chart for company presentation Be far sighted with our Chart Growth Business PowerPoint Template 1110. They help you chart out a credible course.
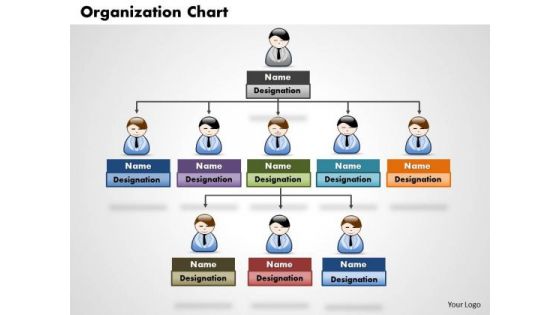
Business Framework Organization Chart PowerPoint Presentation
This image slide has been designed to display sample of organization chart. Use this image slide, in your presentations to depict project development team management. This image slide will enhance the quality of your presentations.
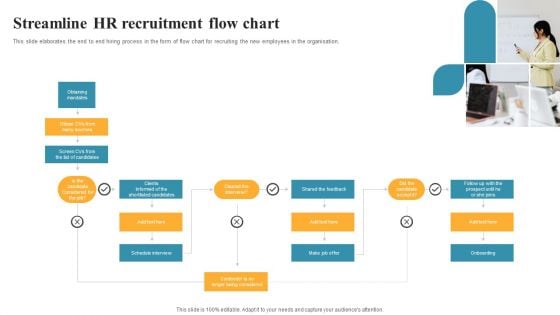
Streamline HR Recruitment Flow Chart Brochure PDF
This slide elaborates the end to end hiring process in the form of flow chart for recruiting the new employees in the organisation. Presenting Streamline HR Recruitment Flow Chart Brochure PDF to dispense important information. This template comprises one stages. It also presents valuable insights into the topics including Streamline Hr, Recruitment Flow Chart. This is a completely customizable PowerPoint theme that can be put to use immediately. So, download it and address the topic impactfully.
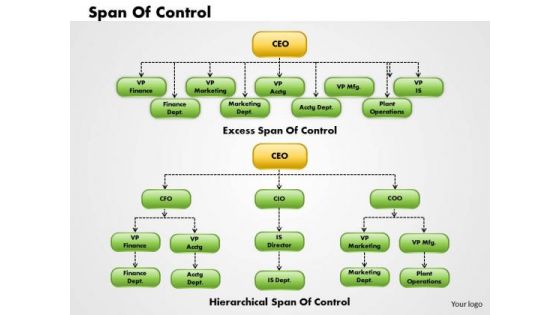
Business Framework Organization Chart 1 PowerPoint Presentation
This image slide has been designed to display span of control flow chart. Use this image slide, in your presentations to depict human resource management in business. This image slide will enhance the quality of your presentations.
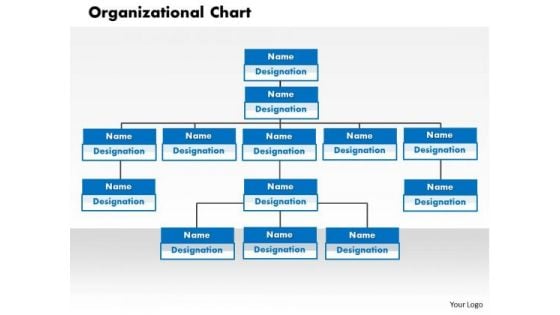
Business Framework Organizational Chart PowerPoint Presentation
This image slide has been designed to display organizational flow chart. Use this image slide, in your presentations to depict human resource management in business designation. This image slide will enhance the quality of your presentations.
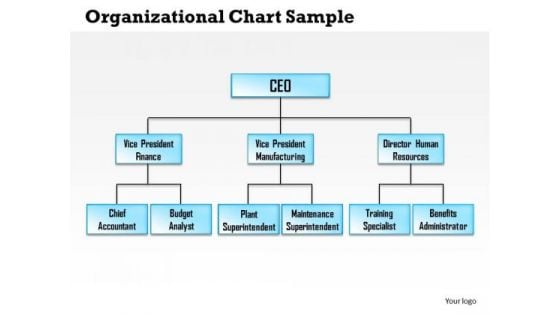
Business Framework Organizational Chart Sample PowerPoint Presentation
This image slide has been designed to display organizational flow chart. Use this image slide, in your presentations to depict higher post management in business. This image slide will enhance the quality of your presentations.
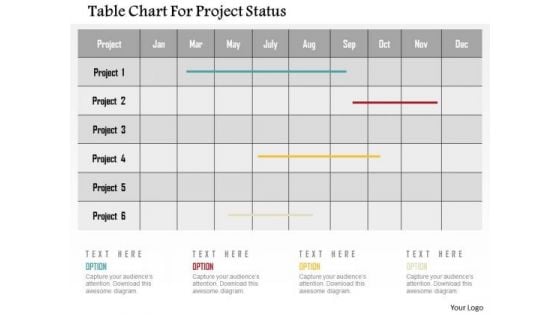
Table Chart For Project Status Presentation Template
This pre-designed slide displays table chart. This slide has been carefully designed with graphics of table chart. Use this chart to display projects status.
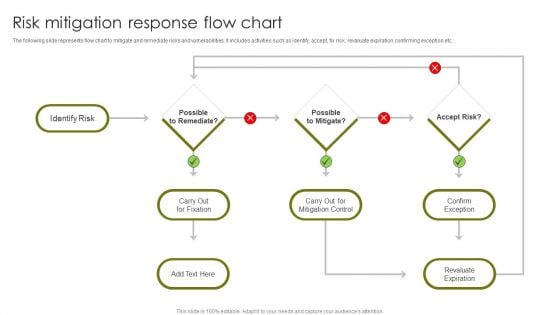
Risk Mitigation Response Flow Chart Introduction PDF
The following slide represents flow chart to mitigate and remediate risks and vulnerabilities. It includes activities such as identify, accept, fix risk, revaluate expiration confirming exception etc. Presenting Risk Mitigation Response Flow Chart Introduction PDF to dispense important information. This template comprises one stages. It also presents valuable insights into the topics including Confirm Exception, Revaluate Expiration, Mitigation Control. This is a completely customizable PowerPoint theme that can be put to use immediately. So, download it and address the topic impactfully.
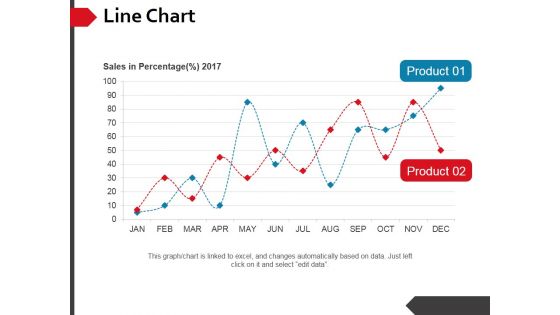
Line Chart Ppt PowerPoint Presentation Inspiration Portfolio
This is a line chart ppt powerpoint presentation inspiration portfolio. This is a two stage process. The stages in this process are business, growth, line chart, analysis, success.
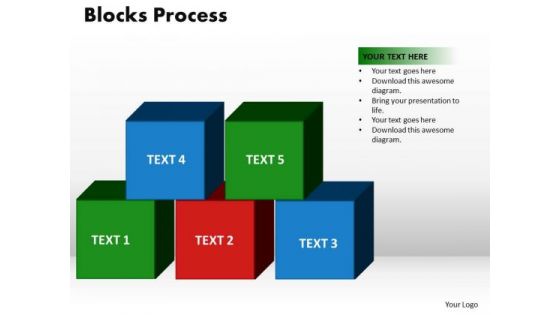
PowerPoint Theme Blocks Process Chart Ppt Backgrounds
PowerPoint Theme blocks process Chart PPT Backgrounds-Use this Diagram to show groups and sub-groups of information, or steps and sub-steps in a task, process, or workflow.-Achievement, action, activity, block, box, building, business, cartoon, challenge, concept, construction, cube, decisions, goal, human, idea, illustration, label, male, meeting, occupation, organization, partnership, people, person, process, progress, puppet, rendering, solution, stack, strategy, success, support, teamwork-PowerPoint Theme blocks process Chart PPT Backgrounds Develop their craving for your creativity. Become a brand name with our PowerPoint Theme Blocks Process Chart Ppt Backgrounds.
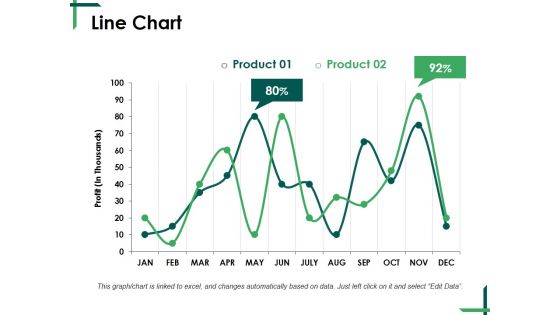
Line Chart Ppt PowerPoint Presentation Model Files
This is a line chart ppt powerpoint presentation model files. This is a two stage process. The stages in this process are line chart, business, management, planning, growth.
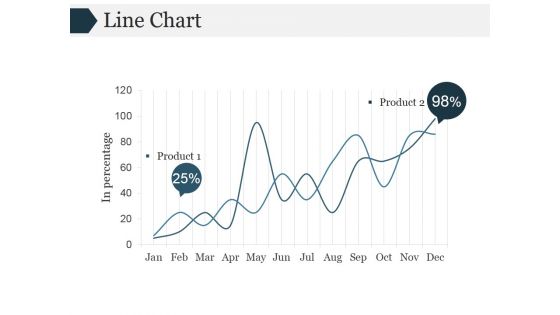
Line Chart Ppt PowerPoint Presentation Clipart
This is a line chart ppt powerpoint presentation clipart. This is a two stage process. The stages in this process are line chart, growth, strategy, analysis, business.
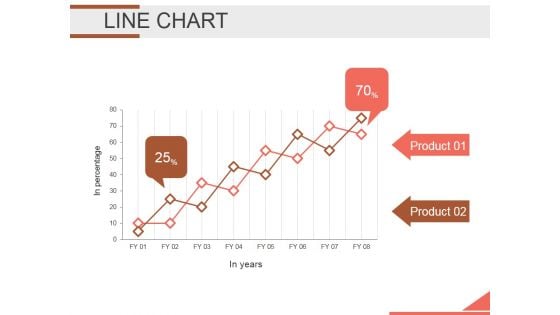
Line Chart Ppt PowerPoint Presentation Slide Download
This is a line chart ppt powerpoint presentation slide download. This is a two stage process. The stages in this process are line chart, finance, growth, strategy, business.
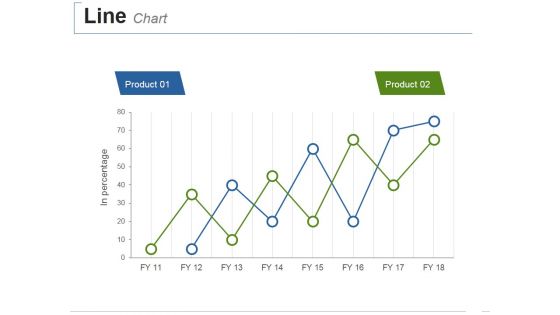
Line Chart Ppt PowerPoint Presentation Ideas Topics
This is a line chart ppt powerpoint presentation ideas topics. This is a two stage process. The stages in this process are business, line chart, growth, strategy, management.

Scatter Chart Ppt PowerPoint Presentation Layouts Show
This is a scatter chart ppt powerpoint presentation layouts show. This is a two stage process. The stages in this process are scatter chart, growth, analysis, strategy, business.
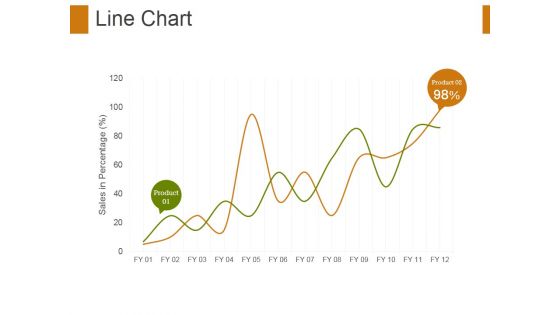
Line Chart Ppt PowerPoint Presentation Ideas Structure
This is a line chart ppt powerpoint presentation ideas structure. This is a two stage process. The stages in this process are line chart, finance, marketing, business, growth.
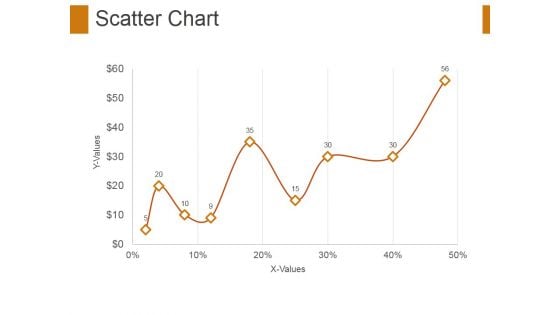
Scatter Chart Ppt PowerPoint Presentation Model Topics
This is a scatter chart ppt powerpoint presentation model topics. This is a one stage process. The stages in this process are scatter chart, growth, analysis, business.


 Continue with Email

 Home
Home


