Progressive Charts
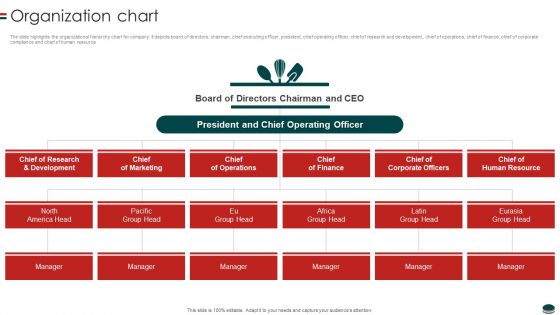
Instant Snacks And Food Firm Details Organization Chart Clipart PDF
The slide highlights the organizational hierarchy chart for company. It depicts board of directors, chairman, chief executing officer, president, chief operating officer, chief of research and development,, chief of operations, chief of finance, chief of corporate compliance and chief of human resource.This is a Instant Snacks And Food Firm Details Organization Chart Clipart PDF template with various stages. Focus and dispense information on one stage using this creative set, that comes with editable features. It contains large content boxes to add your information on topics like Chief Marketing, Chief Operations, Chief Finance You can also showcase facts, figures, and other relevant content using this PPT layout. Grab it now.
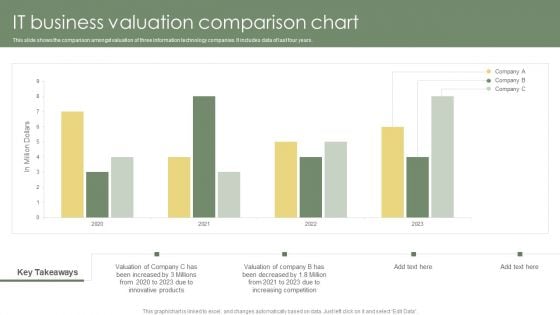
IT Business Valuation Comparison Chart Ppt Model Themes PDF
This slide shows the comparison amongst valuation of three information technology companies. It includes data of last four years. Showcasing this set of slides titled IT Business Valuation Comparison Chart Ppt Model Themes PDF. The topics addressed in these templates are Key Takeaways, Increasing Competition, Innovative Products . All the content presented in this PPT design is completely editable. Download it and make adjustments in color, background, font etc. as per your unique business setting.
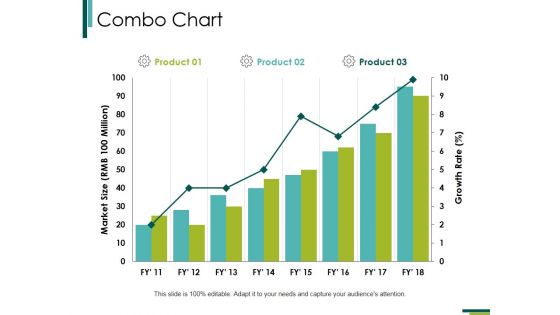
Combo Chart Ppt PowerPoint Presentation Infographic Template Slide Portrait
This is a combo chart ppt powerpoint presentation infographic template slide portrait. This is a three stage process. The stages in this process are combo chart, finance, marketing, strategy, business, growth.
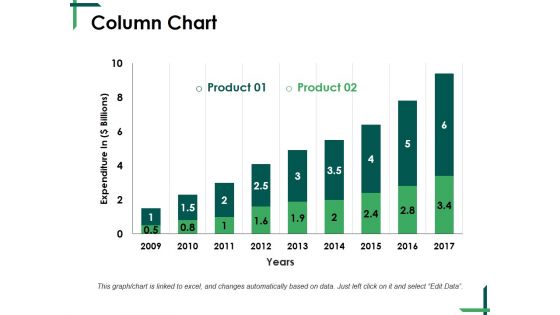
Column Chart Ppt PowerPoint Presentation Gallery Graphics Pictures
This is a column chart ppt powerpoint presentation gallery graphics pictures. This is a two stage process. The stages in this process are column chart, finance, planning, analysis, management, growth.
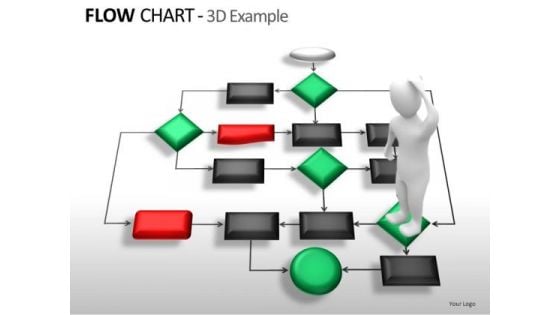
Business Strategy Flow Chart Diagram PowerPoint Templates Ppt Slides
Business Strategy Flow Chart Diagram PowerPoint templates PPT Slides-These high quality powerpoint pre-designed slides and powerpoint templates have been carefully created by our professional team to help you impress your audience. All slides have been created and are 100% editable in powerpoint. Each and every property of any graphic - color, size, orientation, shading, outline etc. can be modified to help you build an effective powerpoint presentation. Any text can be entered at any point in the powerpoint template or slide. Simply DOWNLOAD, TYPE and PRESENT! These PowerPoint presentation slides can be used to represent themes relating to --Business, businessman, chain, chart, communication, community, company, concept, connection, contact, corporate, creativity, data, database, diagram, draw, drawing, education, executive, flow, flowchart, global, graphic, group, illustration, internet, isolated, job, manager, meeting, net, network, networking, office, organization, people, person, plan, presentation, relationship, screen, social, structure, success, team, teamwork, web, white, work, writing-Business Strategy Flow Chart Diagram PowerPoint templates PPT Slides Give our Business Strategy Flow Chart Diagram PowerPoint Templates Ppt Slides catalogue a good look through. You will be enthralled by their appeal.
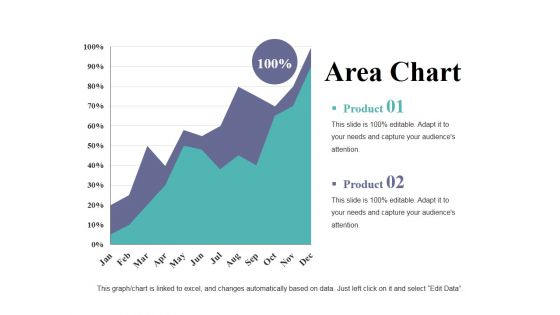
Area Chart Ppt PowerPoint Presentation Professional Graphic Images
This is a area chart ppt powerpoint presentation professional graphic images. This is a two stage process. The stages in this process are area chart, growth, strategy, business, finance, analysis.
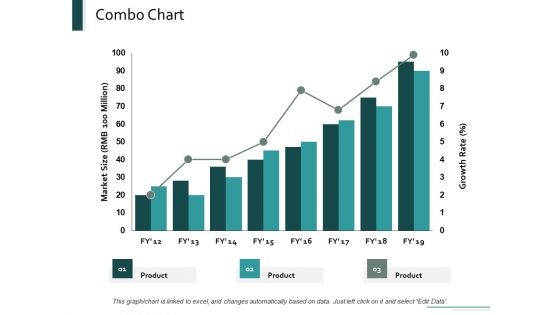
Combo Chart Marketing Ppt Powerpoint Presentation Layouts Designs Download
This is a combo chart marketing ppt powerpoint presentation layouts designs download. This is a three stage process. The stages in this process are combo chart, marketing, growth, product, finance.
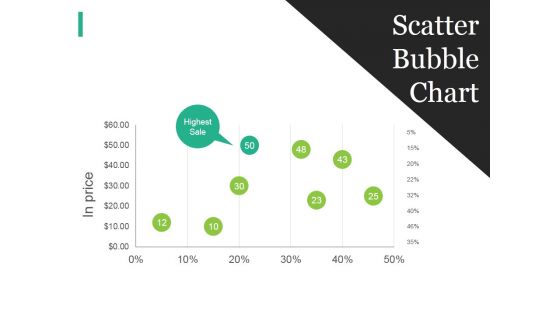
Scatter Bubble Chart Ppt PowerPoint Presentation Summary Mockup
This is a scatter bubble chart ppt powerpoint presentation summary mockup. This is a five stage process. The stages in this process are business, strategy, marketing, analysis, scatter bubble chart.
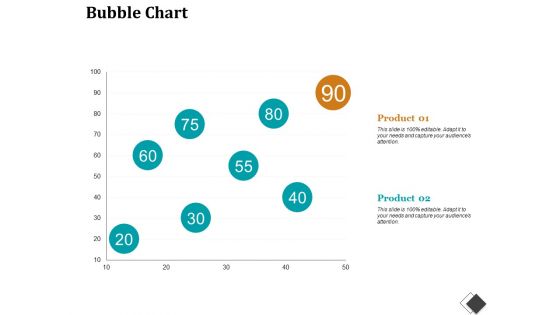
Bubble Chart Enterprise Model Canvas Ppt PowerPoint Presentation File Structure
This is a bubble chart enterprise model canvas ppt powerpoint presentation file structure. This is a two stage process. The stages in this process are bubble chart, finance, marketing, strategy, analysis, investment.
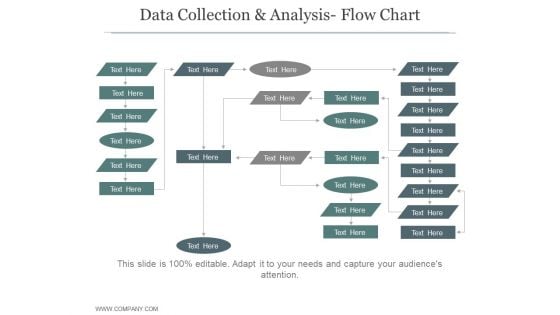
Data Collection And Analysis Flow Chart Ppt PowerPoint Presentation Sample
This is a data collection and analysis flow chart ppt powerpoint presentation sample. This is a five stage process. The stages in this process are business, strategy, marketing, process, growth strategy, finance.
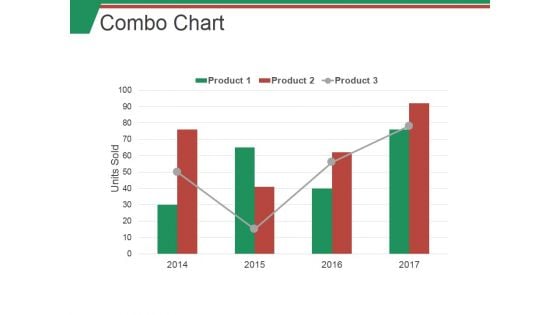
Combo Chart Ppt PowerPoint Presentation Styles Example Topics
This is a combo chart ppt powerpoint presentation styles example topics. This is a four stage process. The stages in this process are bar, success, growth, business, marketing.

Top Business People 3d Man Assembling Pie Chart PowerPoint Slides
We present our top business people 3d man assembling pie chart PowerPoint Slides.Download and present our People PowerPoint Templates because you should once Tap the ingenuity of our PowerPoint Templates and Slides. They are programmed to succeed. Download our Pie Charts PowerPoint Templates because Our PowerPoint Templates and Slides will bullet point your ideas. See them fall into place one by one. Present our Business PowerPoint Templates because Our PowerPoint Templates and Slides will let you Leave a lasting impression to your audiences. They possess an inherent longstanding recall factor. Present our Success PowerPoint Templates because Our PowerPoint Templates and Slides will provide the perfect balance. Your weighty ideas will get the ideal impetus. Download and present our Shapes PowerPoint Templates because Our PowerPoint Templates and Slides will bullet point your ideas. See them fall into place one by one.Use these PowerPoint slides for presentations relating to 3d, abstract, assembling, background, business, cartoon, characters, chart, concepts, corporate, data, diagram, entrepreneurs, executives, graph, graphic, guys, human, illustration, isolated, men, parcel, people, person, pie, piece, portion, professional, proportions, quantitative, rendered, statistics, white . The prominent colors used in the PowerPoint template are Blue, Gray, White. Professionals tell us our top business people 3d man assembling pie chart PowerPoint Slides will save the presenter time. People tell us our chart PowerPoint templates and PPT Slides provide you with a vast range of viable options. Select the appropriate ones and just fill in your text. We assure you our top business people 3d man assembling pie chart PowerPoint Slides are specially created by a professional team with vast experience. They diligently strive to come up with the right vehicle for your brilliant Ideas. Presenters tell us our background PowerPoint templates and PPT Slides provide you with a vast range of viable options. Select the appropriate ones and just fill in your text. We assure you our top business people 3d man assembling pie chart PowerPoint Slides are designed by a team of presentation professionals. PowerPoint presentation experts tell us our chart PowerPoint templates and PPT Slides are second to none. Our Top Business People 3d Man Assembling Pie Chart PowerPoint Slides are definitely new age. Ring in overdue changes with your ideas.

Ppt Templates Flow Chart Example Ppt Diagram Templates
PPT templates Flow Chart Example PPT Diagram Templates-These high quality powerpoint pre-designed slides and powerpoint templates have been carefully created by our professional team to help you impress your audience. All slides have been created and are 100% editable in powerpoint. Each and every property of any graphic - color, size, orientation, shading, outline etc. can be modified to help you build an effective powerpoint presentation. Any text can be entered at any point in the powerpoint template or slide. Simply DOWNLOAD, TYPE and PRESENT! These PowerPoint presentation slides can be used to represent themes relating to --Business, businessman, chain, chart, communication, community, company, concept, connection, contact, corporate, creativity, data, database, diagram, draw, drawing, education, executive, flow, flowchart, global, graphic, group, illustration, internet, isolated, job, manager, meeting, net, network, networking, office, organization, people, person, plan, presentation, relationship, screen, social, structure, success, team, teamwork, web, white, work, writing-PPT templates Flow Chart Example PPT Diagram Templates Tabulate goals with our Ppt Templates Flow Chart Example Ppt Diagram Templates. Download without worries with our money back guaranteee.
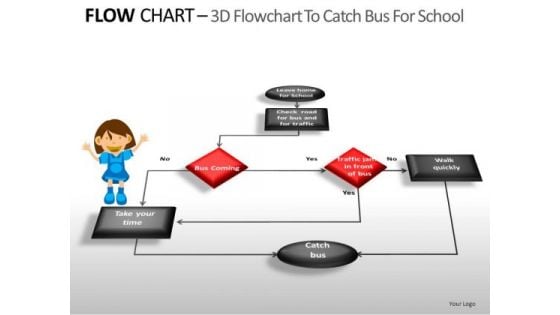
Education Flow Chart Diagram PowerPoint Slides Ppt Templates
Education Flow Chart Diagram PowerPoint slides PPT templates-These high quality powerpoint pre-designed slides and powerpoint templates have been carefully created by our professional team to help you impress your audience. All slides have been created and are 100% editable in powerpoint. Each and every property of any graphic - color, size, orientation, shading, outline etc. can be modified to help you build an effective powerpoint presentation. Any text can be entered at any point in the powerpoint template or slide. Simply DOWNLOAD, TYPE and PRESENT! These PowerPoint presentation slides can be used to represent themes relating to --Business, businessman, chain, chart, communication, community, company, concept, connection, contact, corporate, creativity, data, database, diagram, draw, drawing, education, executive, flow, flowchart, global, graphic, group, illustration, internet, isolated, job, manager, meeting, net, network, networking, office, organization, people, person, plan, presentation, relationship, screen, social, structure, success, team, teamwork, web, white, work, writing-Education Flow Chart Diagram PowerPoint slides PPT templates Our Education Flow Chart Diagram PowerPoint Slides Ppt Templates will leave your audience truly enraptured. They will definitely take a fancy to you.
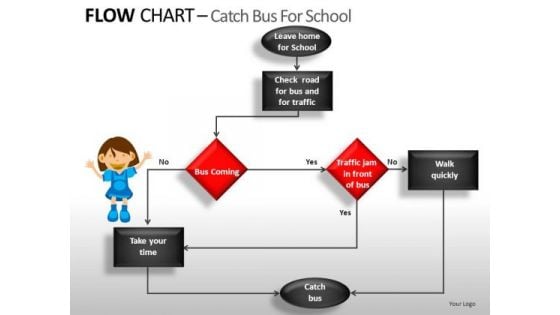
Flow Chart Algorithm PowerPoint Templates Editable Ppt Slides
Flow Chart Algorithm PowerPoint templates Editable PPT slides-These high quality powerpoint pre-designed slides and powerpoint templates have been carefully created by our professional team to help you impress your audience. All slides have been created and are 100% editable in powerpoint. Each and every property of any graphic - color, size, orientation, shading, outline etc. can be modified to help you build an effective powerpoint presentation. Any text can be entered at any point in the powerpoint template or slide. Simply DOWNLOAD, TYPE and PRESENT! These PowerPoint presentation slides can be used to represent themes relating to --Business, businessman, chain, chart, communication, community, company, concept, connection, contact, corporate, creativity, data, database, diagram, draw, drawing, education, executive, flow, flowchart, global, graphic, group, illustration, internet, isolated, job, manager, meeting, net, network, networking, office, organization, people, person, plan, presentation, relationship, screen, social, structure, success, team, teamwork, web, white, work, writing-Flow Chart Algorithm PowerPoint templates Editable PPT slides Play your cards well with our Flow Chart Algorithm PowerPoint Templates Editable Ppt Slides. Give your thoughts a good deal.
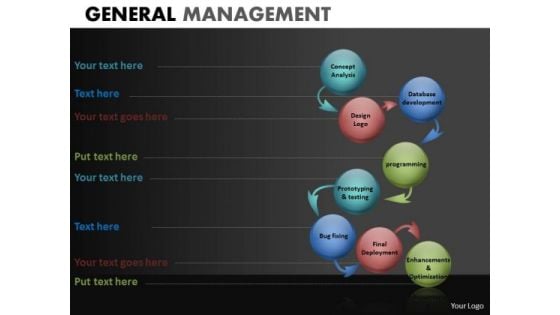
Snake Process Diagram Chart PowerPoint Slides Ppt Templates
Snake Process Diagram Chart PowerPoint Slides PPT templates-These high quality powerpoint pre-designed slides and powerpoint templates have been carefully created by our professional team to help you impress your audience. All slides have been created and are 100% editable in powerpoint. Each and every property of any graphic - color, size, orientation, shading, outline etc. can be modified to help you build an effective powerpoint presentation. Any text can be entered at any point in the powerpoint template or slide. Simply DOWNLOAD, TYPE and PRESENT!-These PowerPoint presentation slides can be used to represent concepts relating to--Abstract, action, analysis, blank, business, chart, clipart, commerce, concept, conceptual, design, diagram, direction, flow, generic, goals, guide, guidelines, heirarchy, icon, idea, illustration, lingakes, links, manage, management, mba, model, organization, performance, plan, process, project, relationship, representation, resource, steps, strategy, success, tactics, theoretical, theory, tool, workflow-Snake Process Diagram Chart PowerPoint Slides PPT templates Heal the misdirected with our Snake Process Diagram Chart PowerPoint Slides Ppt Templates. Try us out and see what a difference our templates make.
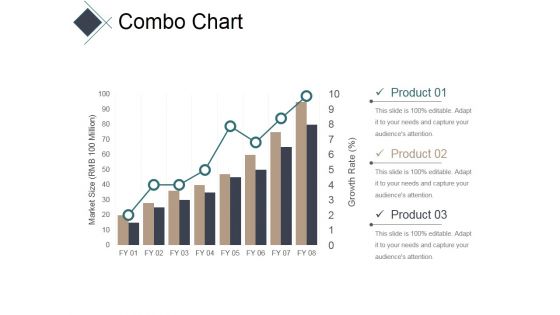
Combo Chart Ppt PowerPoint Presentation Ideas Graphic Images
This is a combo chart ppt powerpoint presentation ideas graphic images. This is a eight stage process. The stages in this process are bar, finance, business, marketing, success.
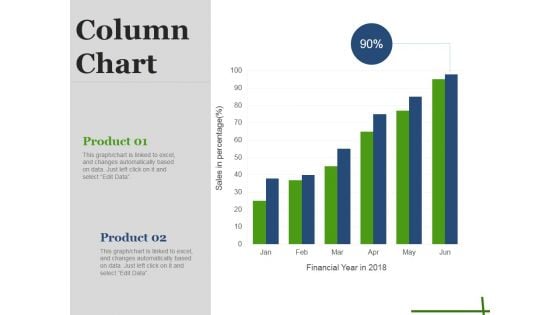
Column Chart Ppt PowerPoint Presentation Pictures Background Images
This is a column chart ppt powerpoint presentation pictures background images. This is a six stage process. The stages in this process are business, marketing, strategy, bar, success.
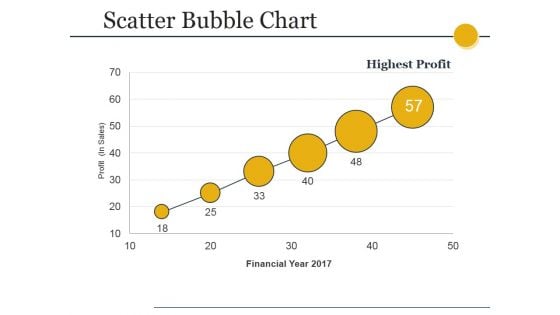
Scatter Bubble Chart Ppt PowerPoint Presentation Ideas Brochure
This is a scatter bubble chart ppt powerpoint presentation ideas brochure. This is a six stage process. The stages in this process are business, marketing, graph, growth, success.
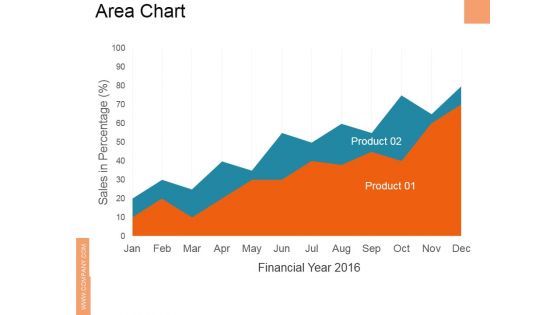
Area Chart Ppt PowerPoint Presentation Ideas Designs Download
This is a area chart ppt powerpoint presentation ideas designs download. This is a twelve stage process. The stages in this process are business, marketing, success, growth, area.

Organization Chart Customer Retention And Engagement Strategy Inspiration PDF
Presenting organization chart customer retention and engagement strategy inspiration pdf to provide visual cues and insights. Share and navigate important information on five stages that need your due attention. This template can be used to pitch topics like director, developer, designer, editor. In addtion, this PPT design contains high resolution images, graphics, etc, that are easily editable and available for immediate download.
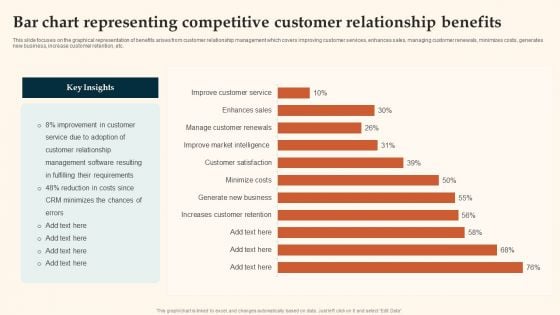
Bar Chart Representing Competitive Customer Relationship Benefits Demonstration PDF
This slide focuses on the graphical representation of benefits arises from customer relationship management which covers improving customer services, enhances sales, managing customer renewals, minimizes costs, generates new business, increase customer retention, etc. Showcasing this set of slides titled Bar Chart Representing Competitive Customer Relationship Benefits Demonstration PDF. The topics addressed in these templates are Management Software, Customer Relationship, Costs Since. All the content presented in this PPT design is completely editable. Download it and make adjustments in color, background, font etc. as per your unique business setting.
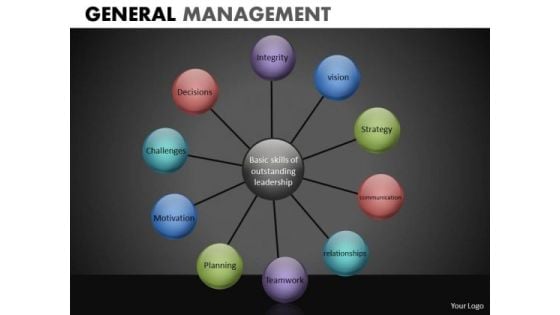
Wheel Chart With 10 Stages PowerPoint Slides Ppt Designs
Wheel Chart with 10 Stages PowerPoint Slides PPT Designs-These high quality powerpoint pre-designed slides and powerpoint templates have been carefully created by our professional team to help you impress your audience. All slides have been created and are 100% editable in powerpoint. Each and every property of any graphic - color, size, orientation, shading, outline etc. can be modified to help you build an effective powerpoint presentation. Any text can be entered at any point in the powerpoint template or slide. Simply DOWNLOAD, TYPE and PRESENT!-These PowerPoint presentation slides can be used to represent concepts relating to--Abstract, action, analysis, blank, business, chart, clipart, commerce, concept, conceptual, design, diagram, direction, flow, generic, goals, guide, guidelines, heirarchy, icon, idea, illustration, lingakes, links, manage, management, mba, model, organization, performance, plan, process, project, relationship, representation, resource, steps, strategy, success, tactics, theoretical, theory, tool, workflow-Wheel Chart with 10 Stages PowerPoint Slides PPT Designs Get a close look at our excellent Wheel Chart With 10 Stages PowerPoint Slides Ppt Designs. Just ask your mouse to 'go fetch 'em'.
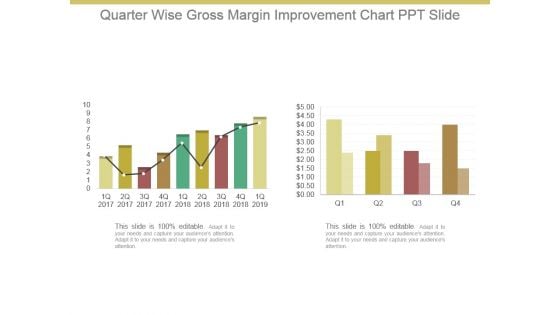
Quarter Wise Gross Margin Improvement Chart Ppt Slide
This is a quarter wise gross margin improvement chart ppt slide. This is a two stage process. The stages in this process are graph, business, growth, marketing.

Rational Perspectives On Decision Making Chart Ppt Slides
This is a rational perspectives on decision making chart ppt slides. This is a six stage process. The stages in this process are recognition of decision requirement, diagnosis and analysis of causes, development of alternatives, selection of desired alternative, implementation of chosen alternative, evaluation and feedback, decision making process.
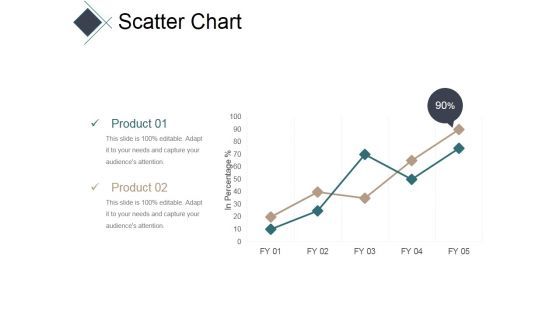
Scatter Chart Ppt PowerPoint Presentation Pictures Slide Portrait
This is a scatter chart ppt powerpoint presentation pictures slide portrait. This is a two stage process. The stages in this process are business, line, graph, success, finance.
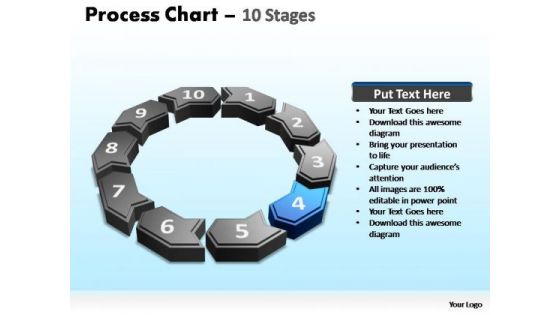
PowerPoint Slidelayout Editable Process Chart Ppt Presentation Designs
PowerPoint_Slidelayout_Editable_process_chart_PPT_Presentation_Designs-The Circle of Life - a concept emmbedded in our minds and hence easy to comprehend. Life and Business is made up of processes comprising stages that flow from one to another. An excellent graphic to attract the attention of and understanding by your audience to improve earnings. Make a grand entry with your ideas. Our PowerPoint Slidelayout Editable Process Chart Ppt Presentation Designs will trumpet your words.
Hierarchal Growth Chart Of Worker Roles And Responsibilities Icons PDF
This slide represents the hierarchy flowchart of employee roles and responsibilities in an organisation. It includes director, vice president of product and sales and design, development manager. Persuade your audience using this Hierarchal Growth Chart Of Worker Roles And Responsibilities Icons PDF. This PPT design covers seven stages, thus making it a great tool to use. It also caters to a variety of topics including Director, Manager Development, Manager Support. Download this PPT design now to present a convincing pitch that not only emphasizes the topic but also showcases your presentation skills.
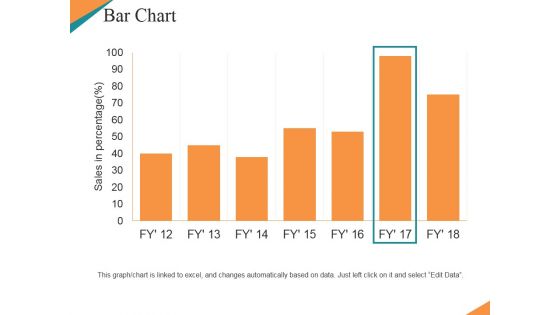
Bar Chart Ppt PowerPoint Presentation Ideas Graphic Tips
This is a bar chart ppt powerpoint presentation ideas graphic tips. This is a seven stage process. The stages in this process are sales in percentage, bar chart, growth, business, marketing.
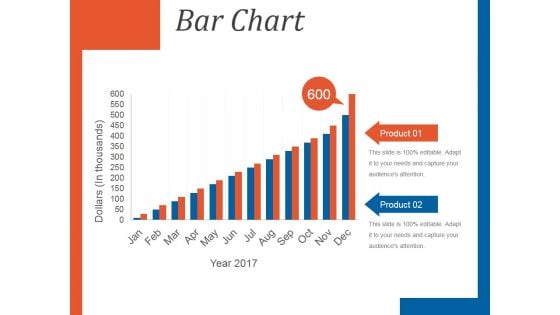
Bar Chart Template 1 Ppt PowerPoint Presentation Background Images
This is a bar chart template 1 ppt powerpoint presentation background images. This is a twelve stage process. The stages in this process are product, bar chart, dollars, year.
Combo Chart Ppt PowerPoint Presentation Icon Format Ideas
This is a combo chart ppt powerpoint presentation icon format ideas. This is a three stage process. The stages in this process are bar, marketing, strategy, planning, growth.
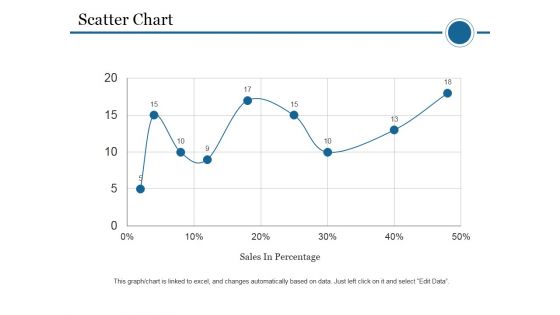
Scatter Chart Template 1 Ppt PowerPoint Presentation Outline Gridlines
This is a scatter chart template 1 ppt powerpoint presentation outline gridlines. This is a one stage process. The stages in this process are scatter chart, sales in percentage, business, marketing, growth.
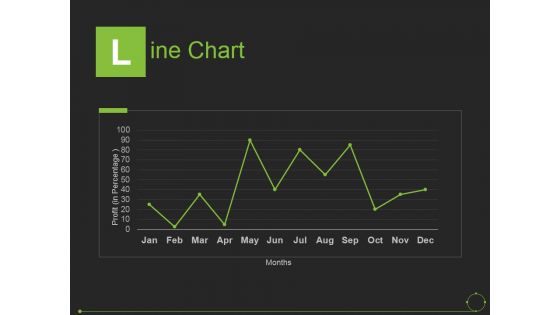
Line Chart Ppt PowerPoint Presentation File Graphics Tutorials
This is a line chart ppt powerpoint presentation file graphics tutorials. This is a one stage process. The stages in this process are months, line chart, bar graph, business, marketing.
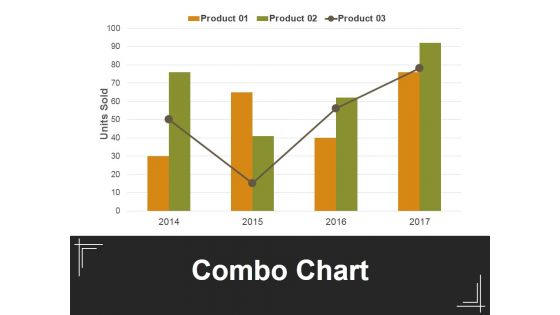
Combo Chart Ppt PowerPoint Presentation Outline Background Image
This is a combo chart ppt powerpoint presentation outline background image. This is a four stage process. The stages in this process are combo chart, units sold, bar graph, business, marketing.
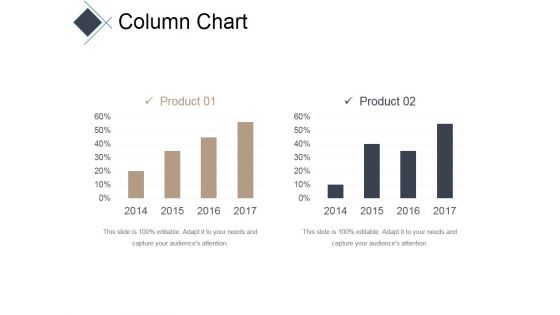
Column Chart Ppt PowerPoint Presentation Infographic Template Inspiration
This is a column chart ppt powerpoint presentation infographic template inspiration. This is a two stage process. The stages in this process are bar, years, business, marketing, success.
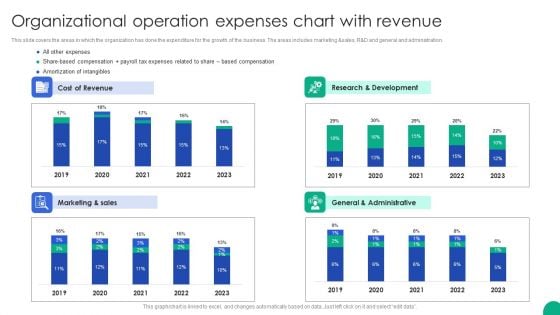
Organizational Operation Expenses Chart With Revenue Microsoft PDF
This slide covers the areas in which the organization has done the expenditure for the growth of the business. The areas includes marketing sales, R D and general and administration.Pitch your topic with ease and precision using this Organizational Operation Expenses Chart With Revenue Microsoft PDF. This layout presents information on Cost Revenue, Research Development, General Administrative. It is also available for immediate download and adjustment. So, changes can be made in the color, design, graphics or any other component to create a unique layout.
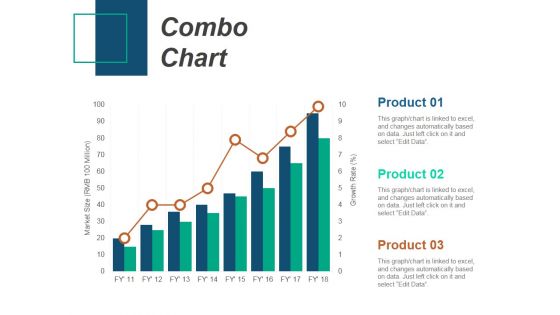
Combo Chart Ppt PowerPoint Presentation Summary Background Image
This is a combo chart ppt powerpoint presentation summary background image. This is a three stage process. The stages in this process are combo chart, product, growth rate, market size.
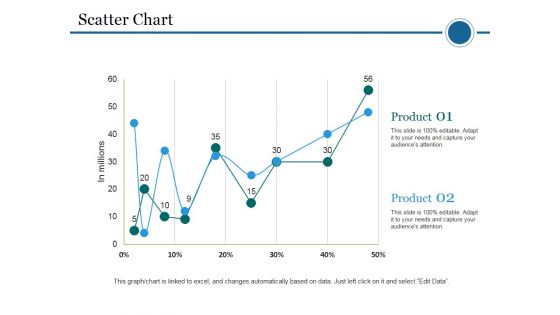
Scatter Chart Template 2 Ppt PowerPoint Presentation Portfolio Skills
This is a scatter chart template 2 ppt powerpoint presentation portfolio skills. This is a two stage process. The stages in this process are scatter chart, in millions, product, business, marketing.
Line Chart Ppt PowerPoint Presentation Icon Graphic Images
This is a line chart ppt powerpoint presentation icon graphic images. This is a twelve stage process. The stages in this process are business, marketing, strategy, finance, growth.

Area Chart Ppt PowerPoint Presentation Visual Aids Show
This is a area chart ppt powerpoint presentation visual aids show. This is a two stage process. The stages in this process are area chart, growth, strategy, finance, business.
Area Chart Ppt PowerPoint Presentation Icon Layout Ideas
This is a area chart ppt powerpoint presentation icon layout ideas. This is a two stage process. The stages in this process are area chart, sales in percentage, years, planning, business.
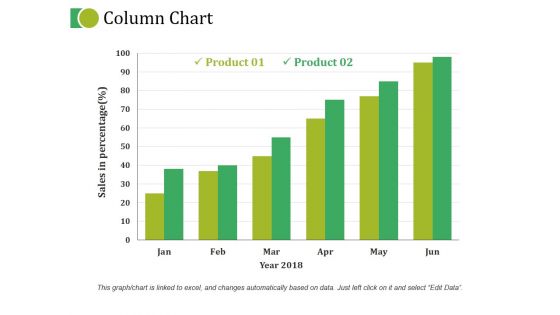
Column Chart Ppt PowerPoint Presentation Gallery File Formats
This is a column chart ppt powerpoint presentation gallery file formats. This is a six stage process. The stages in this process are growth, marketing, strategy, planning, finance.
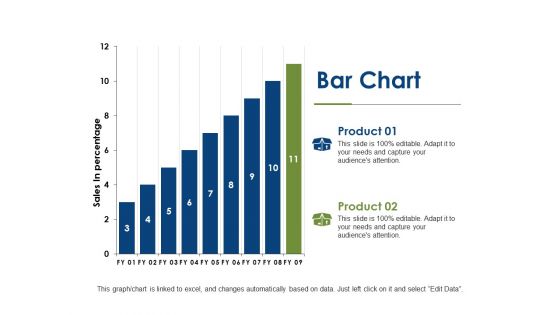
Bar Chart Growth Ppt PowerPoint Presentation Gallery Graphics
This is a bar chart growth ppt powerpoint presentation gallery graphics. This is a two stage process. The stages in this process are analysis, business, finance, investment, strategy.
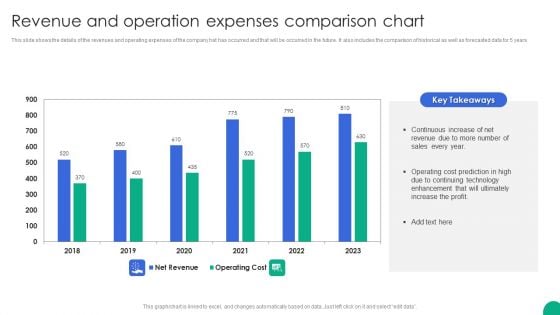
Revenue And Operation Expenses Comparison Chart Slides PDF
This slide shows the details of the revenues and operating expenses of the company hat has occurred and that will be occurred in the future. It also includes the comparison of historical as well as forecasted data for 5 years.Showcasing this set of slides titled Revenue And Operation Expenses Comparison Chart Slides PDF. The topics addressed in these templates are Continuous Increase, Operating Cost, Enhancement Ultimately. All the content presented in this PPT design is completely editable. Download it and make adjustments in color, background, font etc. as per your unique business setting.
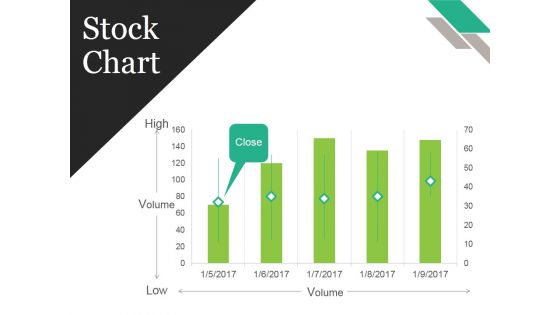
Stock Chart Ppt PowerPoint Presentation Show Graphics Design
This is a stock chart ppt powerpoint presentation show graphics design. This is a five stage process. The stages in this process are business, strategy, marketing, analysis, growth.
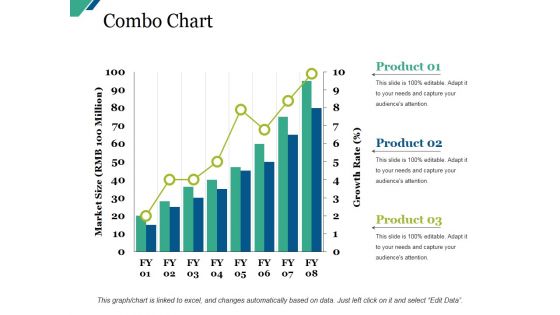
Combo Chart Ppt PowerPoint Presentation Visual Aids Outline
This is a combo chart ppt powerpoint presentation visual aids outline. This is a three stage process. The stages in this process are business, marketing, strategy, finance, growth.
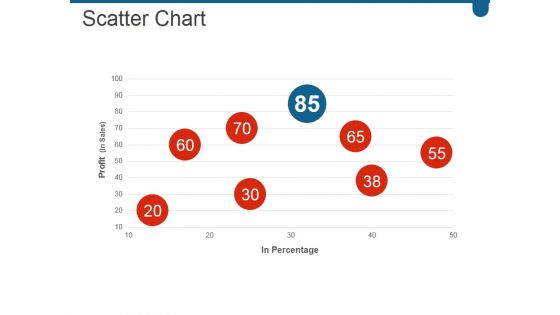
Scatter Chart Ppt PowerPoint Presentation Visual Aids Deck
This is a scatter chart ppt powerpoint presentation visual aids deck. This is a five stage process. The stages in this process are scatter, business, marketing, success, growth.
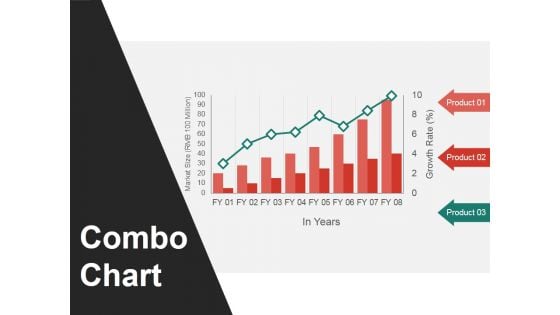
Combo Chart Ppt PowerPoint Presentation Gallery Visual Aids
This is a combo chart ppt powerpoint presentation gallery visual aids. This is a three stage process. The stages in this process are combo chart, in years, market size, product.
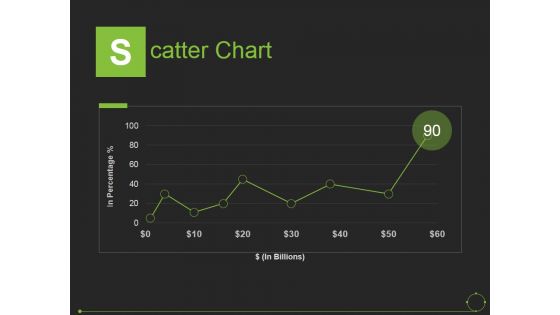
Scatter Chart Ppt PowerPoint Presentation Show Graphic Images
This is a scatter chart ppt powerpoint presentation show graphic images. This is a one stage process. The stages in this process are in percentage, in billions, scatter chart.
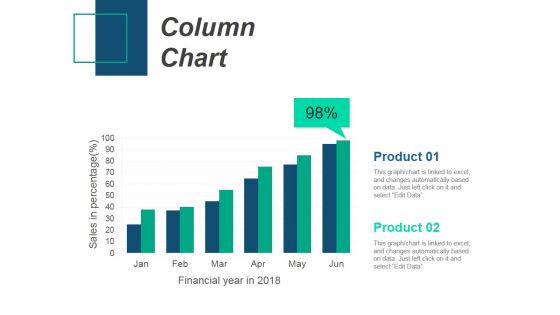
Column Chart Ppt PowerPoint Presentation Gallery Design Inspiration
This is a column chart ppt powerpoint presentation gallery design inspiration. This is a two stage process. The stages in this process are column chart, product, sales in percentage, financial years.
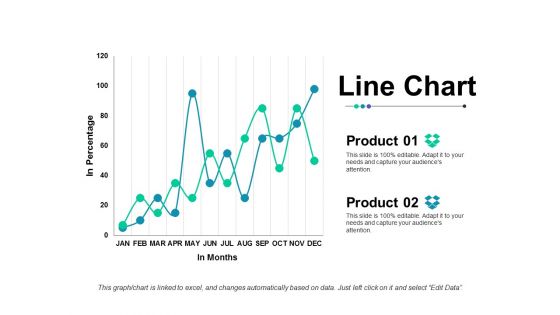
Line Chart Ppt Powerpoint Presentation Outline Slide Portrait
This is a line chart ppt powerpoint presentation outline slide portrait. This is a two stage process. The stages in this process are line chart, finance, strategy, business, analysis.
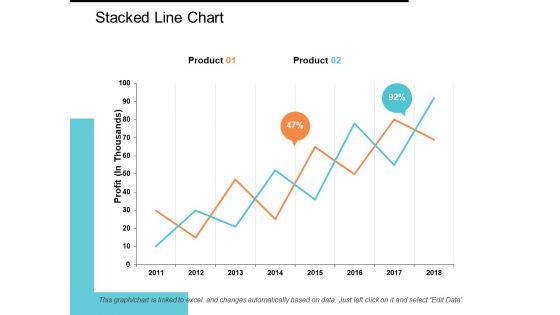
Stacked Line Chart Ppt PowerPoint Presentation Model Show
This is a stacked line chart ppt powerpoint presentation model show. This is a two stage process. The stages in this process are stacked line chart, product, profit, percentage, growth.
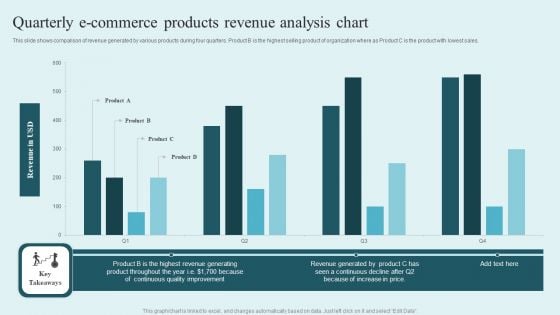
Quarterly E Commerce Products Revenue Analysis Chart Guidelines PDF
This slide shows comparison of revenue generated by various products during four quarters. Product B is the highest selling product of organization where as Product C is the product with lowest sales. Showcasing this set of slides titled Quarterly E Commerce Products Revenue Analysis Chart Guidelines PDF. The topics addressed in these templates are Revenue USD, Product, Continuous Quality Improvement. All the content presented in this PPT design is completely editable. Download it and make adjustments in color, background, font etc. as per your unique business setting.

Column Chart Finance Ppt PowerPoint Presentation Styles Backgrounds
This is a column chart finance ppt powerpoint presentation styles backgrounds. This is a three stage process. The stages in this process are finance, marketing, management, investment, analysis.
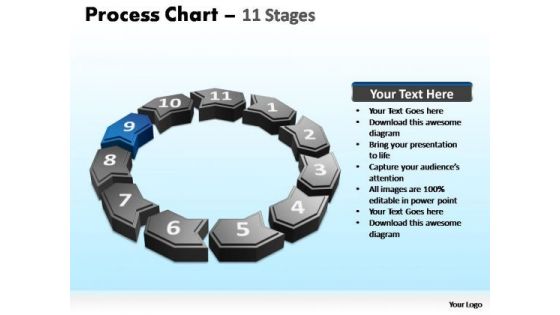
PowerPoint Slide Designs Strategy Process Chart Ppt Design Slides
PowerPoint_Slide_Designs_Strategy_process_chart_PPT_Design_Slides-The Circle of Life - a concept emmbedded in our minds and hence easy to comprehend. Life and Business is made up of processes comprising stages that flow from one to another. An excellent graphic to attract the attention of and understanding by your audience to improve earnings. Continue on your path to success with our PowerPoint Slide Designs Strategy Process Chart Ppt Design Slides. You will come out on top.
Six Months Business Valuation Chart Ppt Styles Icons PDF
This slide shows the 6 months graph to measure company valuation. It is representing that highest valuation of company was calculated in the month of June due to increase in sales. Pitch your topic with ease and precision using this Six Months Business Valuation Chart Ppt Styles Icons PDF. This layout presents information on Increase Sales, Company Valuation. It is also available for immediate download and adjustment. So, changes can be made in the color, design, graphics or any other component to create a unique layout.
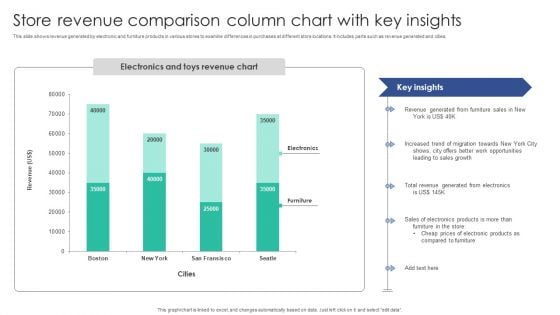
Store Revenue Comparison Column Chart With Key Insights Themes PDF
This slide shows revenue generated by electronic and furniture products in various stores to examine differences in purchases at different store locations. It includes parts such as revenue generated and cities. Showcasing this set of slides titled Store Revenue Comparison Column Chart With Key Insights Themes PDF. The topics addressed in these templates are Revenue Generated, Furniture Sales, Increased Trend. All the content presented in this PPT design is completely editable. Download it and make adjustments in color, background, font etc. as per your unique business setting.
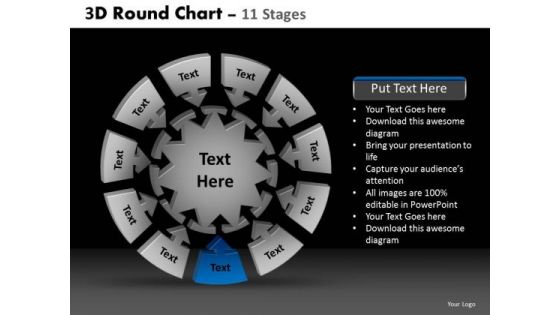
PowerPoint Presentation Designs Diagram Round Chart Ppt Layouts
PowerPoint Presentation Designs Diagram Round Chart PPT Layouts-These high quality, editable pre-designed powerpoint slides have been carefully created by our professional team to help you impress your audience. Each graphic in every slide is vector based and is 100% editable in powerpoint. Each and every property of any slide - color, size, shading etc can be modified to build an effective powerpoint presentation. Use these slides to convey complex business concepts in a simplified manner. Any text can be entered at any point in the powerpoint slide. Simply DOWNLOAD, TYPE and PRESENT! Arrive at a complete consensus with our PowerPoint Presentation Designs Diagram Round Chart Ppt Layouts. The audience will put all differences aside.
Target Vs Accomplishment Evaluation Chart Of Sales Representatives Icons PDF
This slide showcases sales targets and achievements of sales presentative which helps track employee efficiency. It provides information regarding set targets for sales representatives which strategies and success factors. Showcasing this set of slides titled Target Vs Accomplishment Evaluation Chart Of Sales Representatives Icons PDF. The topics addressed in these templates are Effective Communication, Manage Sales Targets, Set Activity Goals. All the content presented in this PPT design is completely editable. Download it and make adjustments in color, background, font etc. as per your unique business setting.
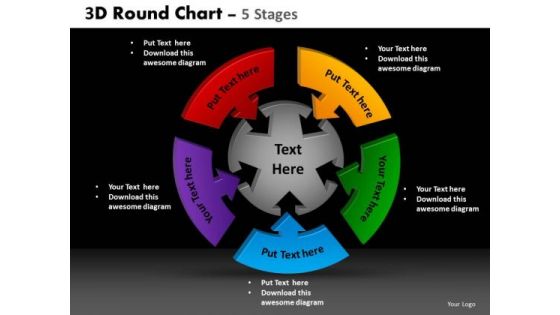
PowerPoint Design Slides Sales Round Chart Ppt Slide
PowerPoint Design Slides Sales Round Chart PPT Slide-These high quality, editable pre-designed powerpoint slides have been carefully created by our professional team to help you impress your audience. Each graphic in every slide is vector based and is 100% editable in powerpoint. Each and every property of any slide - color, size, shading etc can be modified to build an effective powerpoint presentation. Use these slides to convey complex business concepts in a simplified manner. Any text can be entered at any point in the powerpoint slide. Simply DOWNLOAD, TYPE and PRESENT! Hammer out any doubts with our PowerPoint Design Slides Sales Round Chart Ppt Slide. Try us out and see what a difference our templates make.


 Continue with Email

 Home
Home


