Progressive Charts
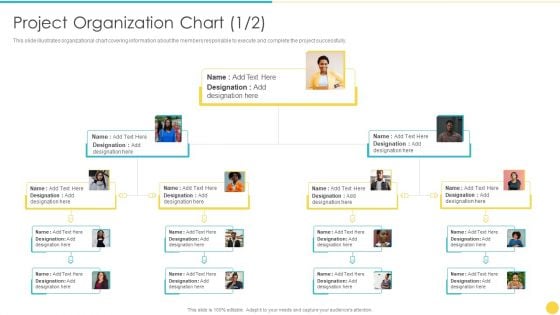
Project Management Professional Toolset IT Project Organization Chart Execute Introduction PDF
Following slide portrays organizational chart covering information about the members responsible to execute and complete the project successfully. Presenting project management professional toolset it project organization chart execute introduction pdf to provide visual cues and insights. Share and navigate important information on two stages that need your due attention. This template can be used to pitch topics like project organization chart. In addtion, this PPT design contains high resolution images, graphics, etc, that are easily editable and available for immediate download.

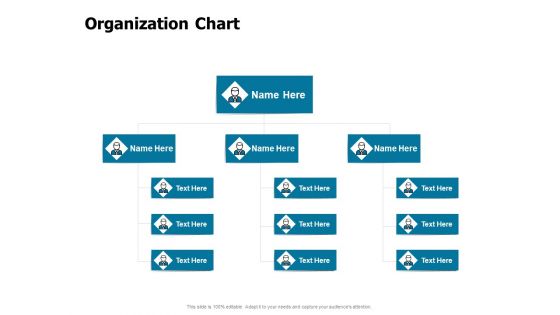
Best Practices For Increasing Lead Conversion Rates Organization Chart Ppt Gallery Graphic Images PDF
Presenting this set of slides with name best practices for increasing lead conversion rates organization chart ppt gallery graphic images pdf. This is a three stage process. The stages in this process are organization chart. This is a completely editable PowerPoint presentation and is available for immediate download. Download now and impress your audience.
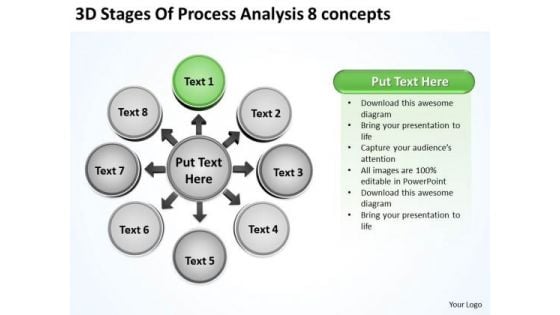
3d Stages Of Process Analysis 8 Concepts Cycle Spoke Chart PowerPoint Templates
We present our 3d stages of process analysis 8 concepts Cycle Spoke Chart PowerPoint templates.Present our Business PowerPoint Templates because infrastructure growth is an obvious requirement of today.inform your group on how exactly this potential is tailor made for you. Download and present our Circle Charts PowerPoint Templates because you can Unravel the desired and essential elements of your overall strategy. Present our Shapes PowerPoint Templates because Our PowerPoint Templates and Slides are specially created by a professional team with vast experience. They diligently strive to come up with the right vehicle for your brilliant Ideas. Download our Process and Flows PowerPoint Templates because you can Break it all down to Key Result Areas. Download and present our Success PowerPoint Templates because your quest has taken you well onto the path of success.Use these PowerPoint slides for presentations relating to Achieve, act, actions, around, arrows,assess, assessment, business, circle,concept, cycle, decide, decision,direction, illustration, isolated, plan,process, steps, strategy, succeed,symbol, isolated, isometric, market,motion, movement, organization, p perspective, presentation,process, processchart, recycle, report,ring, sign, step, stock. The prominent colors used in the PowerPoint template are Green dark , Gray, White. The feedback we get is that our 3d stages of process analysis 8 concepts Cycle Spoke Chart PowerPoint templates are designed by professionals The feedback we get is that our assessment PowerPoint templates and PPT Slides are Pretty. Presenters tell us our 3d stages of process analysis 8 concepts Cycle Spoke Chart PowerPoint templates are Royal. The feedback we get is that our actions PowerPoint templates and PPT Slides are Chic. PowerPoint presentation experts tell us our 3d stages of process analysis 8 concepts Cycle Spoke Chart PowerPoint templates are Nice. Customers tell us our arrows PowerPoint templates and PPT Slides are Nice. Import ideas with our 3d Stages Of Process Analysis 8 Concepts Cycle Spoke Chart PowerPoint Templates. Download without worries with our money back guaranteee.
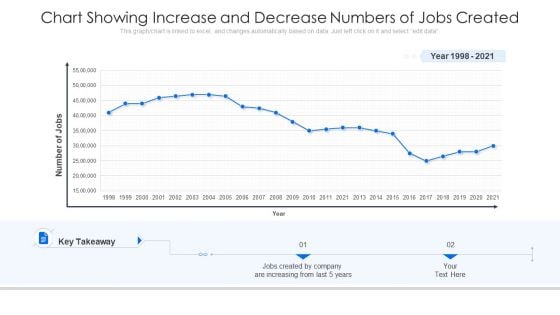
Chart Showing Increase And Decrease Numbers Of Jobs Created Ppt Visual Aids Model PDF
Pitch your topic with ease and precision using this chart showing increase and decrease numbers of jobs created ppt visual aids model pdf. This layout presents information on chart showing increase and decrease numbers of jobs created. It is also available for immediate download and adjustment. So, changes can be made in the color, design, graphics or any other component to create a unique layout.
Developing Implementing Strategic HRM Plans Organization Chart Ppt Infographic Template Diagrams PDF
Presenting this set of slides with name developing implementing strategic hrm plans organization chart ppt infographic template diagrams pdf. This is a five stage process. The stages in this process are organization chart. This is a completely editable PowerPoint presentation and is available for immediate download. Download now and impress your audience.
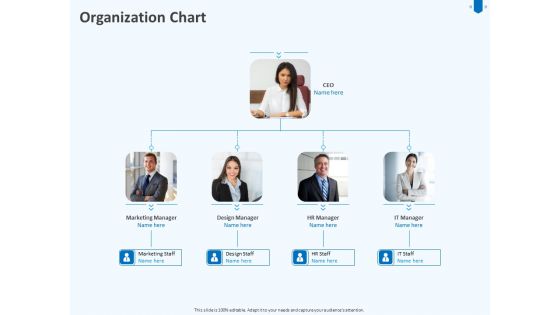
Developing And Implementing Corporate Partner Action Plan Organization Chart Demonstration PDF
Presenting developing and implementing corporate partner action plan organization chart demonstration pdf to provide visual cues and insights. Share and navigate important information on three stages that need your due attention. This template can be used to pitch topics like organization chart. In addtion, this PPT design contains high resolution images, graphics, etc, that are easily editable and available for immediate download.

Developing Work Force Management Plan Model Organization Chart Ppt Inspiration Portfolio PDF
Presenting developing work force management plan model organization chart ppt inspiration portfolio pdf to provide visual cues and insights. Share and navigate important information on four stages that need your due attention. This template can be used to pitch topics like organization chart. In addition, this PPT design contains high-resolution images, graphics, etc, that are easily editable and available for immediate download.
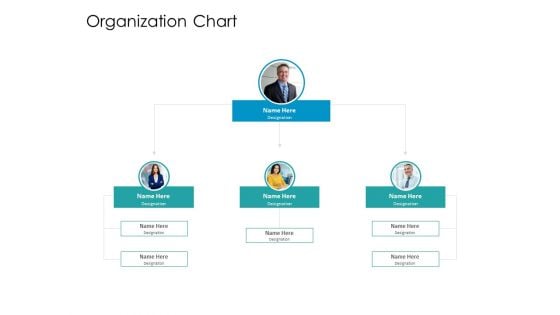
Developing New Sales And Marketing Strategic Approach Organization Chart Ppt PowerPoint Presentation Layouts Design Templates PDF
Presenting this set of slides with name developing new sales and marketing strategic approach organization chart ppt powerpoint presentation layouts design templates pdf. This is a four stage process. The stages in this process are organization chart. This is a completely editable PowerPoint presentation and is available for immediate download. Download now and impress your audience.
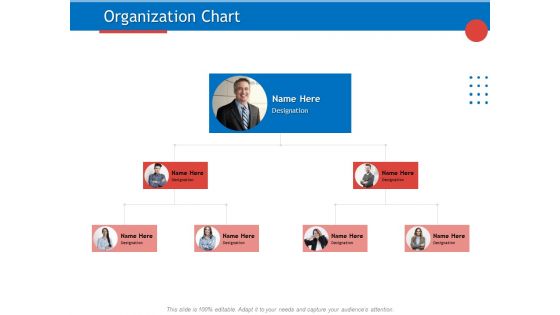
Developing Product Planning Strategies Organization Chart Ppt PowerPoint Presentation Portfolio Samples PDF
Presenting this set of slides with name developing product planning strategies organization chart ppt powerpoint presentation portfolio samples pdf. This is a three stage process. The stages in this process are organization chart. This is a completely editable PowerPoint presentation and is available for immediate download. Download now and impress your audience.
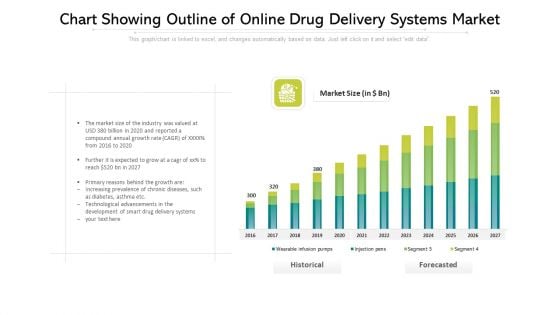
Chart Showing Outline Of Online Drug Delivery Systems Market Ppt PowerPoint Presentation File Clipart PDF
This graph or chart is linked to excel, and changes automatically based on data. Just left click on it and select edit data. Showcasing this set of slides titled chart showing outline of online drug delivery systems market ppt powerpoint presentation file clipart pdf. The topics addressed in these templates are technological, development, growth. All the content presented in this PPT design is completely editable. Download it and make adjustments in color, background, font etc. as per your unique business setting.
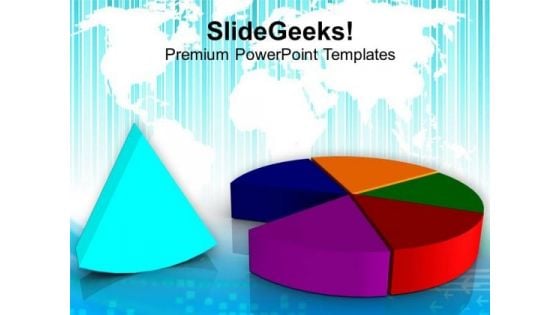
Representation Of Pie Chart Market Growth PowerPoint Templates Ppt Backgrounds For Slides 0413
Duct it through with our Representation Of Pie Chart Market Growth PowerPoint Templates PPT Backgrounds For Slides 0413. Your ideas will reach into their minds intact. Recieve your due with our Representation Of Pie Chart Market Growth PowerPoint Templates PPT Backgrounds For Slides 0413. Your audience will display their admiration for you. Enthuse your audience with our Representation Of Pie Chart Market Growth PowerPoint Templates Ppt Backgrounds For Slides 0413. You will come out on top.
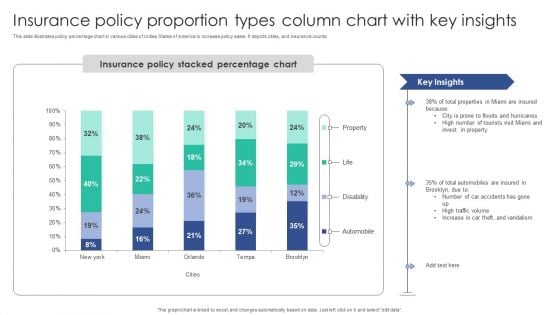
Insurance Policy Proportion Types Column Chart With Key Insights Ideas PDF
This slide illustrates policy percentage chart in various cities of Unites States of America to increase policy sales. It depicts cities, and insurance counts Showcasing this set of slides titled Insurance Policy Proportion Types Column Chart With Key Insights Ideas PDF. The topics addressed in these templates are Floods Hurricanes, Tourists Visit, Invest Property. All the content presented in this PPT design is completely editable. Download it and make adjustments in color, background, font etc. as per your unique business setting.
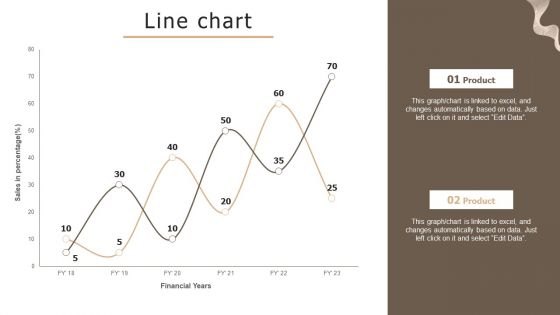
Designing Strategies For Company Growth And Success Line Chart Designs PDF
Find a pre designed and impeccable Designing Strategies For Company Growth And Success Line Chart Designs PDF. The templates can ace your presentation without additional effort. You can download these easy to edit presentation templates to make your presentation stand out from others. So, what are you waiting for Download the template from Slidegeeks today and give a unique touch to your presentation.
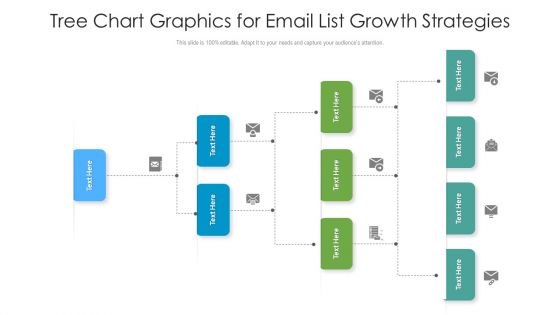
Tree Chart Graphics For Email List Growth Strategies Ppt PowerPoint Presentation File Images PDF
Persuade your audience using this tree chart graphics for email list growth strategies ppt powerpoint presentation file images pdf. This PPT design covers four stages, thus making it a great tool to use. It also caters to a variety of topics including tree chart graphics for email list growth strategies. Download this PPT design now to present a convincing pitch that not only emphasizes the topic but also showcases your presentation skills.
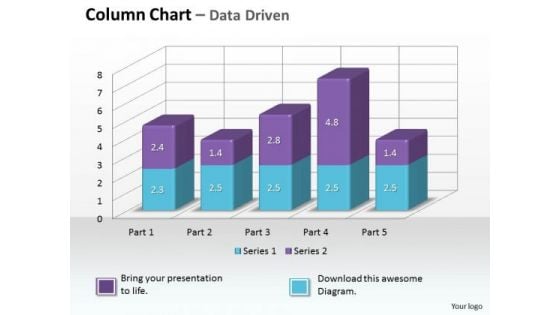
Data Analysis On Excel 3d Chart To Monitor Business Process PowerPoint Templates
Make Some Dough With Our data analysis on excel 3d chart to monitor business process Powerpoint Templates . Your Assets Will Rise Significantly.
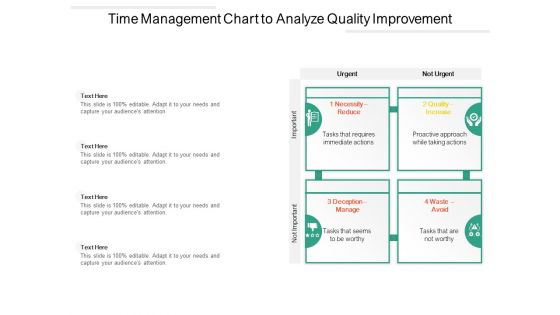
Time Management Chart To Analyze Quality Improvement Ppt Powerpoint Presentation Show Samples Pdf
Persuade your audience using this time management chart to analyze quality improvement ppt powerpoint presentation show samples pdf. This PPT design covers four stages, thus making it a great tool to use. It also caters to a variety of topics including time management chart to analyze quality improvement. Download this PPT design now to present a convincing pitch that not only emphasizes the topic but also showcases your presentation skills
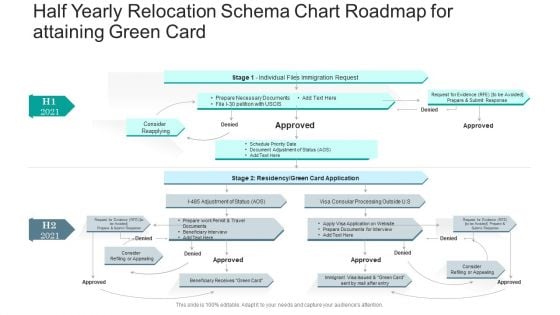
Half Yearly Relocation Schema Chart Roadmap For Attaining Green Card Mockup
Introducing our half yearly relocation schema chart roadmap for attaining green card mockup. This PPT presentation is Google Slides compatible, therefore, you can share it easily with the collaborators for measuring the progress. Also, the presentation is available in both standard screen and widescreen aspect ratios. So edit the template design by modifying the font size, font type, color, and shapes as per your requirements. As this PPT design is fully editable it can be presented in PDF, JPG and PNG formats.
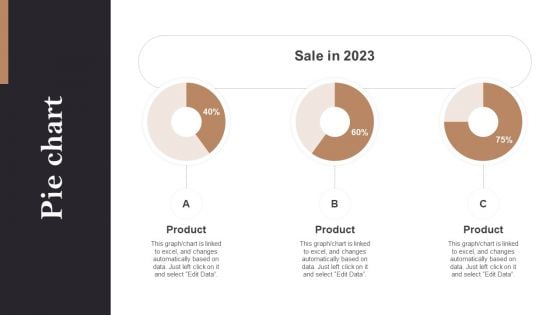
Pie Chart Opening Retail Store In Untapped Industry For Sales Growth Information PDF
Do you have an important presentation coming up Are you looking for something that will make your presentation stand out from the rest Look no further than Pie Chart Opening Retail Store In Untapped Industry For Sales Growth Information PDF. With our professional designs, you can trust that your presentation will pop and make delivering it a smooth process. And with Slidegeeks, you can trust that your presentation will be unique and memorable. So why wait Grab Pie Chart Opening Retail Store In Untapped Industry For Sales Growth Information PDF today and make your presentation stand out from the rest.
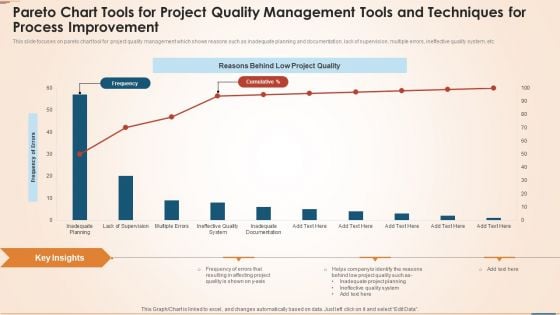
Pareto Chart Tools For Project Quality Management Tools And Techniques For Process Improvement Elements PDF
This slide focuses on pareto chart tool for project quality management which shows reasons such as inadequate planning and documentation, lack of supervision, multiple errors, ineffective quality system, etc. Pitch your topic with ease and precision using this pareto chart tools for project quality management tools and techniques for process improvement elements pdf. This layout presents information on frequency, reasons behind low project quality, frequency of errors, planning. It is also available for immediate download and adjustment. So, changes can be made in the color, design, graphics or any other component to create a unique layout.
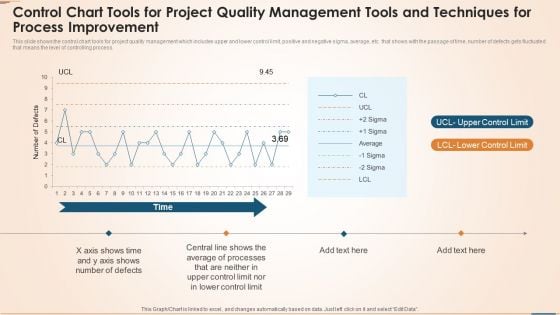
Control Chart Tools For Project Quality Management Tools And Techniques For Process Improvement Topics PDF
This slide shows the control chart tools for project quality management which includes upper and lower control limit, positive and negative sigma, average, etc. that shows with the passage of time, number of defects gets fluctuated that means the level of controlling process. Pitch your topic with ease and precision using this control chart tools for project quality management tools and techniques for process improvement topics pdf. This layout presents information on time, upper control limit, lower control limit. It is also available for immediate download and adjustment. So, changes can be made in the color, design, graphics or any other component to create a unique layout.
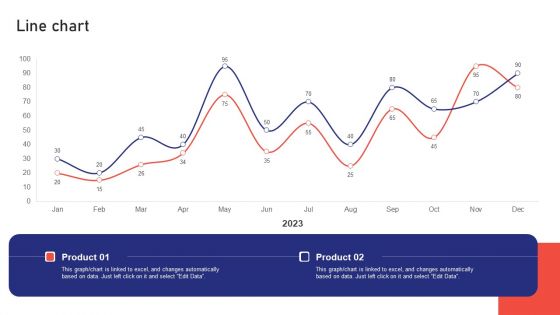
Sales Risk Assessment Profit Maximization Team Performance Enhancement Line Chart Information PDF
Slidegeeks is here to make your presentations a breeze with Sales Risk Assessment Profit Maximization Team Performance Enhancement Line Chart Information PDF With our easy to use and customizable templates, you can focus on delivering your ideas rather than worrying about formatting. With a variety of designs to choose from, you are sure to find one that suits your needs. And with animations and unique photos, illustrations, and fonts, you can make your presentation pop. So whether you are giving a sales pitch or presenting to the board, make sure to check out Slidegeeks first.
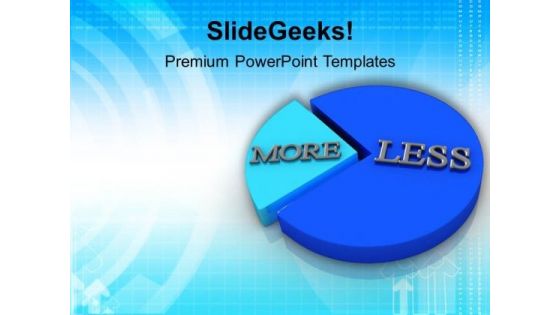
More And Less Parts Of Pie Chart PowerPoint Templates Ppt Backgrounds For Slides 0113
We present our More And Less Parts of Pie Chart PowerPoint Templates PPT Backgrounds For Slides 0113.Download and present our Pie Charts PowerPoint Templates because Our PowerPoint Templates and Slides are focused like a searchlight beam. They highlight your ideas for your target audience. Download our Business PowerPoint Templates because You will get more than you ever bargained for. Download and present our Marketing PowerPoint Templates because It will get your audience in sync. Present our Shapes PowerPoint Templates because Our PowerPoint Templates and Slides will provide weight to your words. They will bring out the depth of your thought process. Present our Future PowerPoint Templates because It will mark the footprints of your journey. Illustrate how they will lead you to your desired destination.Use these PowerPoint slides for presentations relating to Pie chart representing less and more, pie chart, business, future, shapes, marketing. The prominent colors used in the PowerPoint template are Blue, Gray, Blue light. PowerPoint presentation experts tell us our More And Less Parts of Pie Chart PowerPoint Templates PPT Backgrounds For Slides 0113 will save the presenter time. People tell us our more PowerPoint templates and PPT Slides are readymade to fit into any presentation structure. Presenters tell us our More And Less Parts of Pie Chart PowerPoint Templates PPT Backgrounds For Slides 0113 help you meet deadlines which are an element of today's workplace. Just browse and pick the slides that appeal to your intuitive senses. The feedback we get is that our representing PowerPoint templates and PPT Slides provide you with a vast range of viable options. Select the appropriate ones and just fill in your text. Customers tell us our More And Less Parts of Pie Chart PowerPoint Templates PPT Backgrounds For Slides 0113 will help you be quick off the draw. Just enter your specific text and see your points hit home. People tell us our business PowerPoint templates and PPT Slides effectively help you save your valuable time. Design excellent slides with our More And Less Parts Of Pie Chart PowerPoint Templates Ppt Backgrounds For Slides 0113. Dont pass up this opportunity to shine.
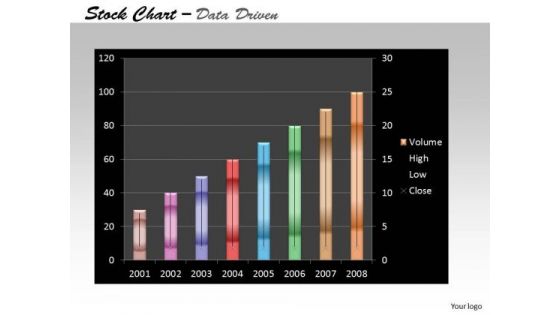
Data Analysis On Excel Driven Stock Chart For Business Growth PowerPoint Slides Templates
Add Some Dramatization To Your Thoughts. Our data analysis on excel driven stock chart for business growth powerpoint slides Templates Make Useful Props.
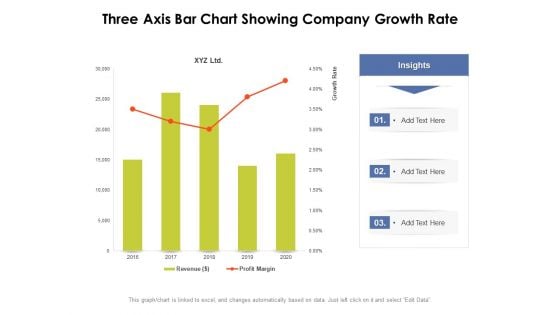
Three Axis Bar Chart Showing Company Growth Rate Ppt PowerPoint Presentation Summary Graphics Pictures PDF
Presenting this set of slides with name three axis bar chart showing company growth rate ppt powerpoint presentation summary graphics pictures pdf. The topics discussed in these slides are insights, growth rate, revenue, profit margin, 2016 to 2020. This is a completely editable PowerPoint presentation and is available for immediate download. Download now and impress your audience.
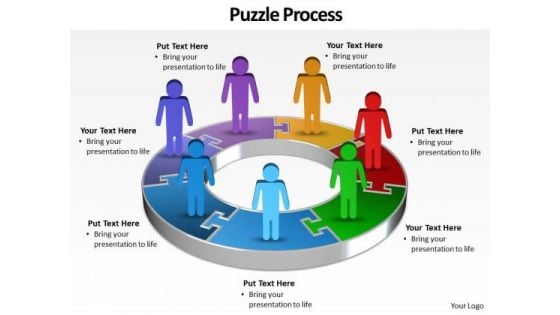
Ppt Group Of World Business PowerPoint Slide Text People With 3d Pie Chart Templates
PPT group of world business powerpoint slide text people with 3d pie chart Templates-This 3D Business PowerPoint Diagram consists of group of people standing on circle representing the growth percentage of individual Business perspective. This Diagram will fit for Business Presentations.-PPT group of world business powerpoint slide text people with 3d pie chart Templates-Abstract, Arrow, Art, Artistic, Background, Business, Colorful, Communication, Computer-Graphics, Concept, Creation, Data, Decoration, Decorative, Design, Design-Element, Digital, Direction, Effect, Elegance, Element, Energy, Flow, Go, Idea, Illustration, Modern, Movement, Network, Symbol Some in your community may have fallen on bad times. Comfort them with our Ppt Group Of World Business PowerPoint Slide Text People With 3d Pie Chart Templates.

Business Chart Showing Economic Growth Trend Ppt PowerPoint Presentation Infographic Template Format
Presenting this set of slides with name business chart showing economic growth trend ppt powerpoint presentation infographic template format. The topics discussed in these slides are gdp growth rate, percentage. This is a completely editable PowerPoint presentation and is available for immediate download. Download now and impress your audience.
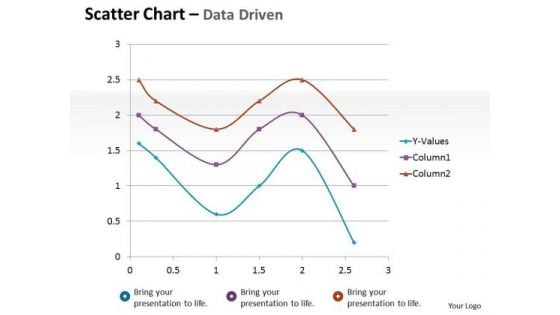
Financial Data Analysis Driven Scatter Chart Mathematical Diagram PowerPoint Slides Templates
Dominate Proceedings With Your Ideas. Our financial data analysis driven scatter chart mathematical diagram powerpoint slides Templates Will Empower Your Thoughts.
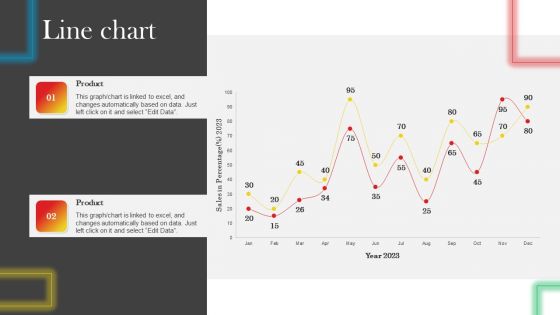
Line Chart Data Driven Promotional Guide To Increase Return On Investment Slides PDF
Find highly impressive Line Chart Data Driven Promotional Guide To Increase Return On Investment Slides PDF on Slidegeeks to deliver a meaningful presentation. You can save an ample amount of time using these presentation templates. No need to worry to prepare everything from scratch because Slidegeeks experts have already done a huge research and work for you. You need to download Line Chart Data Driven Promotional Guide To Increase Return On Investment Slides PDF for your upcoming presentation. All the presentation templates are 100 percent editable and you can change the color and personalize the content accordingly. Download now
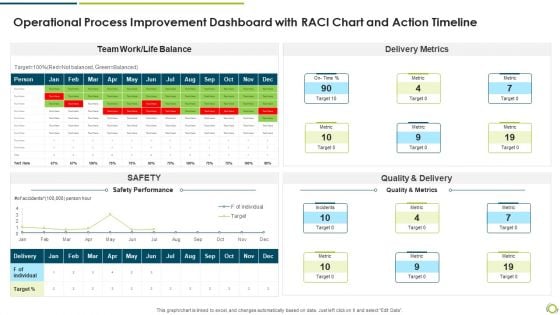
Operational Process Improvement Dashboard With RACI Chart And Action Timeline Themes PDF
Deliver an awe inspiring pitch with this creative operational process improvement dashboard with raci chart and action timeline themes pdf bundle. Topics like quality and delivery, delivery metrics, safety performance can be discussed with this completely editable template. It is available for immediate download depending on the needs and requirements of the user.
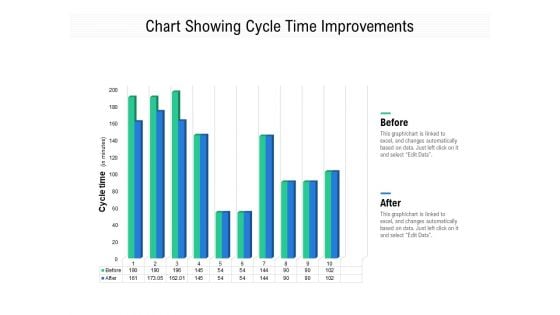
Chart Showing Cycle Time Improvements Ppt PowerPoint Presentation Infographic Template Rules PDF
Pitch your topic with ease and precision using this chart showing cycle time improvements ppt powerpoint presentation infographic template rules pdf. This layout presents information on before, after. It is also available for immediate download and adjustment. So, changes can be made in the color, design, graphics or any other component to create a unique layout.
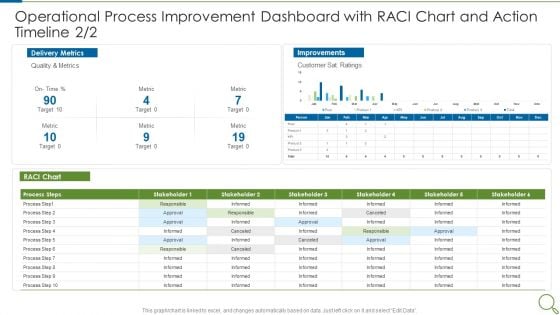
Operational Process Improvement Dashboard With RACI Chart And Action Timeline Metric Designs PDF
Deliver an awe inspiring pitch with this creative operational process improvement dashboard with raci chart and action timeline metric designs pdf bundle. Topics like metric, target, quality, customer can be discussed with this completely editable template. It is available for immediate download depending on the needs and requirements of the user.
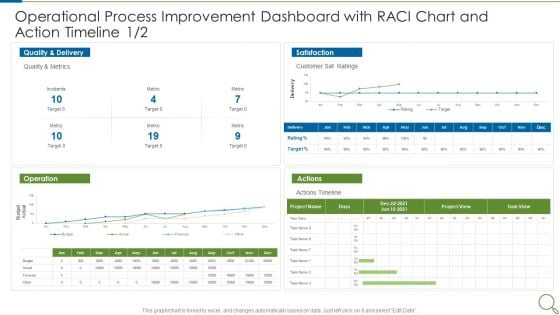
Operational Process Improvement Dashboard With RACI Chart And Action Timeline Target Summary PDF
Deliver and pitch your topic in the best possible manner with this operational process improvement dashboard with raci chart and action timeline target summary pdf. Use them to share invaluable insights on quality, metrics, customer and impress your audience. This template can be altered and modified as per your expectations. So, grab it now.
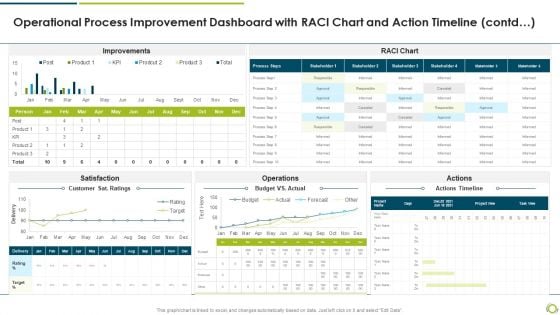
Operational Process Improvement Dashboard With RACI Chart And Action Timeline Contd Mockup PDF
Deliver and pitch your topic in the best possible manner with this operational process improvement dashboard with raci chart and action timeline contd mockup pdf. Use them to share invaluable insights on Satisfaction, operations, actions and impress your audience. This template can be altered and modified as per your expectations. So, grab it now.
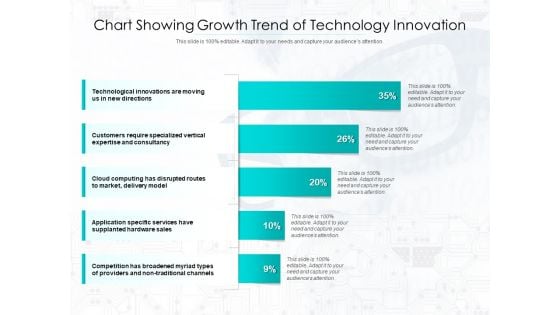
Chart Showing Growth Trend Of Technology Innovation Ppt PowerPoint Presentation File Slideshow PDF
Presenting this set of slides with name chart showing growth trend of technology innovation ppt powerpoint presentation file slideshow pdf. The topics discussed in these slides are sales, services, technological. This is a completely editable PowerPoint presentation and is available for immediate download. Download now and impress your audience.
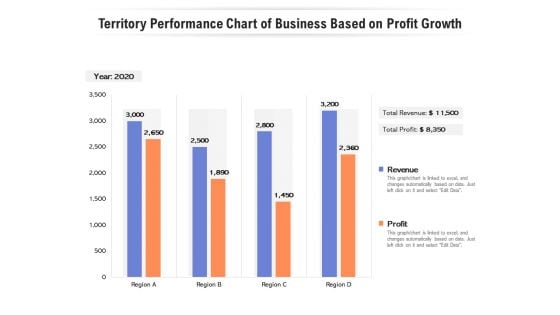
Territory Performance Chart Of Business Based On Profit Growth Ppt PowerPoint Presentation Show Aids PDF
Presenting this set of slides with name territory performance chart of business based on profit growth ppt powerpoint presentation show aids pdf. The topics discussed in these slides are revenue, profit, 2020. This is a completely editable PowerPoint presentation and is available for immediate download. Download now and impress your audience.
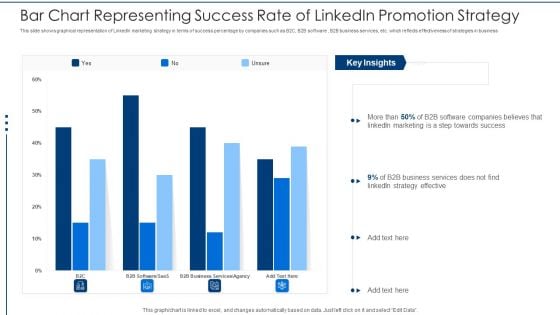
Bar Chart Representing Success Rate Of Linkedin Promotion Strategy Rules PDF
This slide shows graphical representation of LinkedIn marketing strategy in terms of success percentage by companies such as B2C, B2B software , B2B business services, etc. which reflects effectiveness of strategies in business Pitch your topic with ease and precision using this bar chart representing success rate of linkedin promotion strategy rules pdf. This layout presents information on bar chart representing success rate of linkedin promotion strategy. It is also available for immediate download and adjustment. So, changes can be made in the color, design, graphics or any other component to create a unique layout.
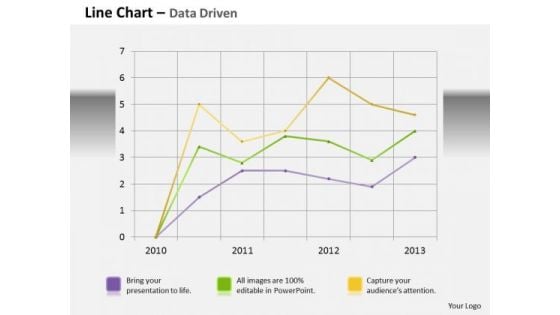
Data Analysis Template Driven Line Chart Business Graph PowerPoint Slides Templates
Bottle Your Thoughts In Our data analysis template driven line chart business graph powerpoint slides Templates . Pass It Around For Your Audience To Sip.

Pie Chart Showing Factors Impacting Elements Of Successful Project And Failure Graphics PDF
The following slide depicts the major reasons for project failure to avoid future reoccurrence. It includes elements such as ineffective management practices, poorly defined objectives, technical glitches etc. Showcasing this set of slides titled Pie Chart Showing Factors Impacting Elements Of Successful Project And Failure Graphics PDF. The topics addressed in these templates are Pie Chart Showing Factors, Impacting Elements, Successful Project And Failure. All the content presented in this PPT design is completely editable. Download it and make adjustments in color, background, font etc. as per your unique business setting.
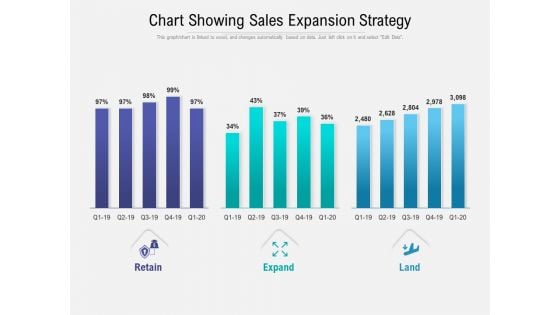
Chart Showing Sales Expansion Strategy Ppt PowerPoint Presentation Styles Professional PDF
Presenting this set of slides with name chart showing sales expansion strategy ppt powerpoint presentation styles professional pdf. The topics discussed in these slides are retain, expand, land. This is a completely editable PowerPoint presentation and is available for immediate download. Download now and impress your audience.
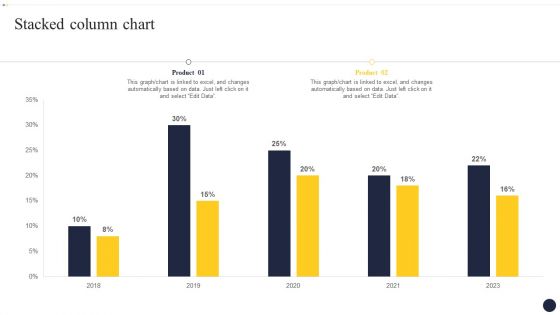
Integrating Naas Service Model To Enhance Stacked Column Chart Infographics PDF
Find highly impressive Integrating Naas Service Model To Enhance Stacked Column Chart Infographics PDF on Slidegeeks to deliver a meaningful presentation. You can save an ample amount of time using these presentation templates. No need to worry to prepare everything from scratch because Slidegeeks experts have already done a huge research and work for you. You need to download Integrating Naas Service Model To Enhance Stacked Column Chart Infographics PDF for your upcoming presentation. All the presentation templates are 100 percent editable and you can change the color and personalize the content accordingly. Download now.
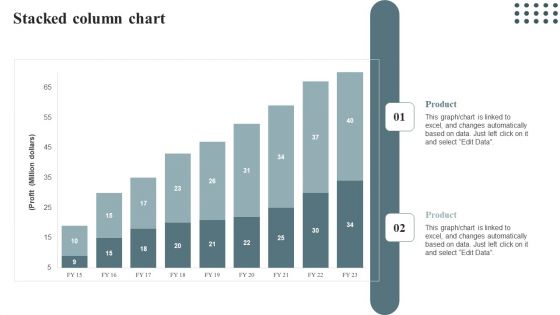
Stacked Column Chart Techniques For Enhancing Buyer Acquisition Approach Ideas PDF
Get a simple yet stunning designed Stacked Column Chart Techniques For Enhancing Buyer Acquisition Approach Ideas PDF. It is the best one to establish the tone in your meetings. It is an excellent way to make your presentations highly effective. So, download this PPT today from Slidegeeks and see the positive impacts. Our easy-to-edit Stacked Column Chart Techniques For Enhancing Buyer Acquisition Approach Ideas PDF can be your go-to option for all upcoming conferences and meetings. So, what are you waiting for Grab this template today.
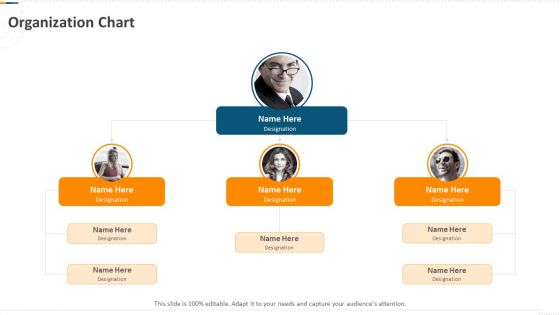
Developing Action Plan For Gaining Market Advantage Organization Chart Ppt PowerPoint Presentation Model File Formats PDF
This is a developing action plan for gaining market advantage organization chart ppt powerpoint presentation model file formats pdf template with various stages. Focus and dispense information on four stages using this creative set, that comes with editable features. It contains large content boxes to add your information on topics like organization chart. You can also showcase facts, figures, and other relevant content using this PPT layout. Grab it now.

Developing A Right Pricing Strategy For Business Organization Chart Ppt Pictures Portrait PDF
Presenting developing a right pricing strategy for business organization chart ppt pictures portrait pdf to provide visual cues and insights. Share and navigate important information on four stages that need your due attention. This template can be used to pitch topics like organization chart, department head, manager. In addtion, this PPT design contains high-resolution images, graphics, etc, that are easily editable and available for immediate download.
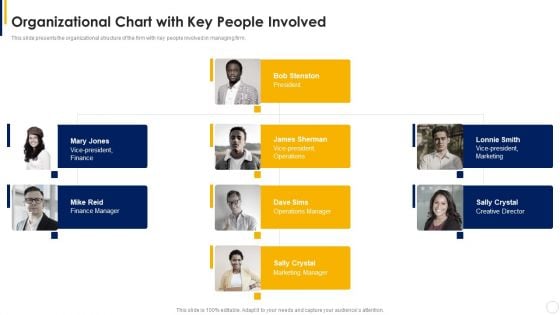
Manual To Develop Strawman Proposal Organizational Chart With Key People Involved Professional PDF
Presenting Manual To Develop Strawman Proposal Organizational Chart With Key People Involved Professional PDF to provide visual cues and insights. Share and navigate important information on three stages that need your due attention. This template can be used to pitch topics like Organizational Chart, Marketing Manager, Finance Manager. In addtion, this PPT design contains high resolution images, graphics, etc, that are easily editable and available for immediate download.
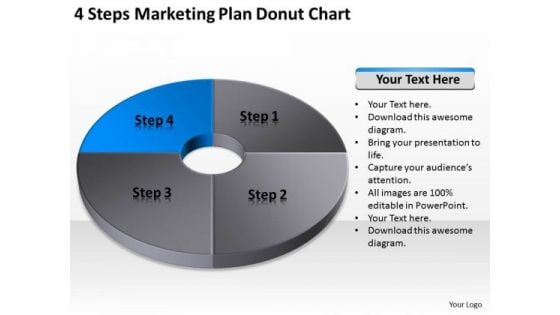
4 Steps Marketing Plan Donut Chart Ppt Fill The Blank Business PowerPoint Templates
We present our 4 steps marketing plan donut chart ppt fill the blank business PowerPoint templates.Use our Circle Charts PowerPoint Templates because Our PowerPoint Templates and Slides will Activate the energies of your audience. Get their creative juices flowing with your words. Download our Shapes PowerPoint Templates because Timeline crunches are a fact of life. Meet all deadlines using our PowerPoint Templates and Slides. Download our Business PowerPoint Templates because Our PowerPoint Templates and Slides will give you great value for your money. Be assured of finding the best projection to highlight your words. Use our Signs PowerPoint Templates because It will get your audience in sync. Present our Success PowerPoint Templates because Our PowerPoint Templates and Slides will give you great value for your money. Be assured of finding the best projection to highlight your words. Use these PowerPoint slides for presentations relating to flow, icon, chart, life, flowchart, career, pdca, job, network, isolated, business plane, loop, business loop, system management, green, refresh, future, red, arrow, yellow, sign, rotation, recycling, symbol, diagram, circle system, circle, wealth, ring, recycle, graph, cycle, illustration, business education, connection, cmyk, money, success concept, direction, blue, motion, successful business, illness, education, business structure, contrast, work, business plan, for success, business wheel. The prominent colors used in the PowerPoint template are Blue, Gray, Black. Melt their hearts with our 4 Steps Marketing Plan Donut Chart Ppt Fill The Blank Business PowerPoint Templates. You will be at the top of your game.
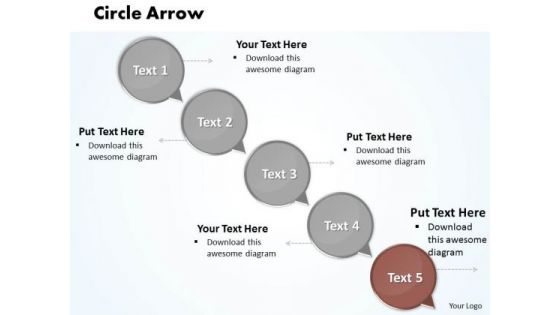
Ppt Circular Arrow Pie PowerPoint Presentation Chart Ks2 Of 5 Step Templates
PPT circular arrow pie powerpoint presentation chart ks2 of 5 step Templates-This Business Oriented Chart will definitely help you to be more Successful. Use this graphics as key element in streamlining your plans. It consists of Circular Bubbles connected together to form a complete game.-PPT circular arrow pie powerpoint presentation chart ks2 of 5 step Templates-Add, Aqua, Arrows, Badges, Bar, Blend, Blue, Bright, Bubbles, Buttons, Caution, Circle, Drop, Elements, Glossy, Glowing, Graphic, Heart, Help, Icons, Idea, Illustration, Navigation, Oblong, Plus, Round, Service, Shadow, Shiny, Sign, Speech, Squares Deliver your address to your congregation. Give them a glimpse of the divine with our Ppt Circular Arrow Pie PowerPoint Presentation Chart Ks2 Of 5 Step Templates.
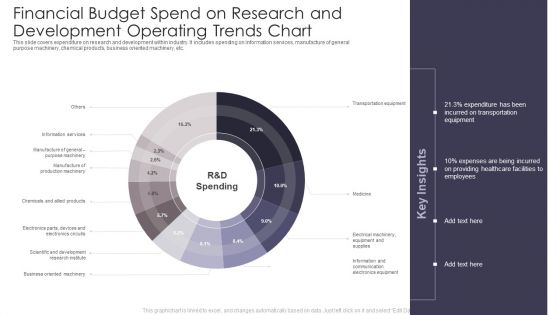
Financial Budget Spend On Research And Development Operating Trends Chart Professional PDF
This slide covers expenditure on research and development within industry. It includes spending on information services, manufacture of general purpose machinery, chemical products, business oriented machinery, etc. Pitch your topic with ease and precision using this Financial Budget Spend On Research And Development Operating Trends Chart Professional PDF. This layout presents information on Transportation Equipment, Healthcare Facilities, Trends Chart. It is also available for immediate download and adjustment. So, changes can be made in the color, design, graphics or any other component to create a unique layout.
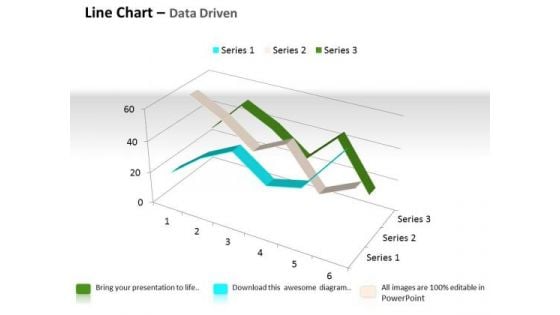
Quantitative Data Analysis 3d Line Chart For Comparison Of PowerPoint Templates
Touch Base With Our quantitative data analysis 3d line chart for comparison of Powerpoint Templates . Review Your Growth With Your Audience.
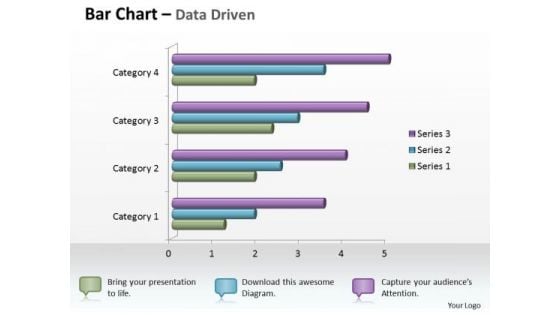
Data Analysis In Excel 3d Bar Chart For Business Statistics PowerPoint Templates
Knock On The Door To Success With Our data analysis in excel 3d bar chart for business statistics Powerpoint Templates . Be Assured Of Gaining Entry.
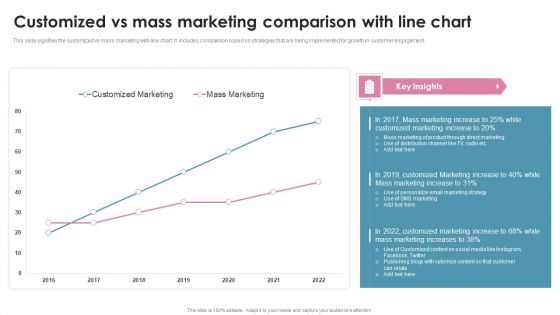
Customized Vs Mass Marketing Comparison With Line Chart Ppt PowerPoint Presentation File Ideas PDF
This slide signifies the customized vs mass marketing with line chart. It includes comparison based on strategies that are being implemented for growth in customer engagement. Pitch your topic with ease and precision using this Customized Vs Mass Marketing Comparison With Line Chart Ppt PowerPoint Presentation File Ideas PDF. This layout presents information on Customized Marketing, Mass Marketing, 2016 To 2022. It is also available for immediate download and adjustment. So, changes can be made in the color, design, graphics or any other component to create a unique layout.
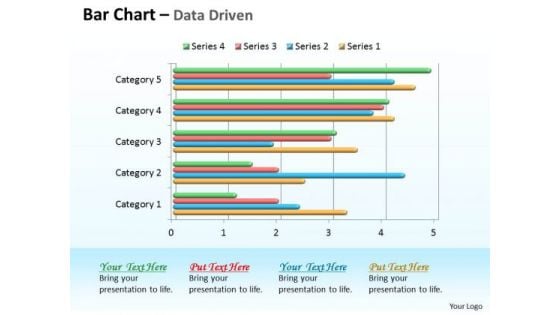
Data Analysis In Excel 3d Bar Chart For Comparison Of Time Series PowerPoint Templates
Double Your Chances With Our data analysis in excel 3d bar chart for comparison of time series Powerpoint Templates . The Value Of Your Thoughts Will Increase Two-Fold.
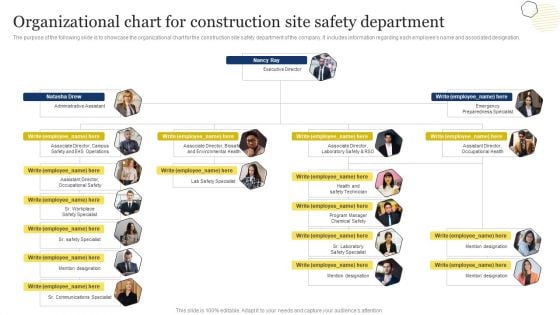
Improvement Of Safety Performance At Construction Site Organizational Chart For Construction Slides PDF
The purpose of the following slide is to showcase the organizational chart for the construction site safety department of the company. It includes information regarding each employees name and associated designation. This Improvement Of Safety Performance At Construction Site Organizational Chart For Construction Slides PDF is perfect for any presentation, be it in front of clients or colleagues. It is a versatile and stylish solution for organizing your meetings. The Improvement Of Safety Performance At Construction Site Organizational Chart For Construction Slides PDF features a modern design for your presentation meetings. The adjustable and customizable slides provide unlimited possibilities for acing up your presentation. Slidegeeks has done all the homework before launching the product for you. So, dont wait, grab the presentation templates today
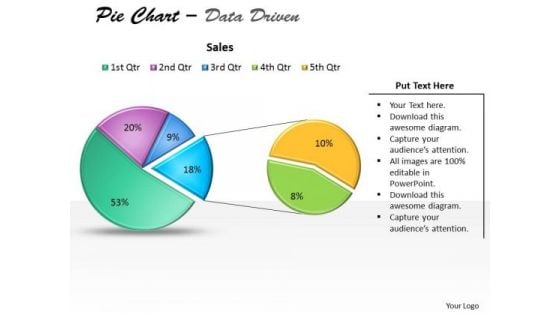
Data Analysis Excel Driven Pie Chart For Business Stratregy PowerPoint Slides Templates
Open Up Doors That Lead To Success. Our data analysis excel driven pie chart for business stratregy powerpoint slides Templates Provide The Handles.
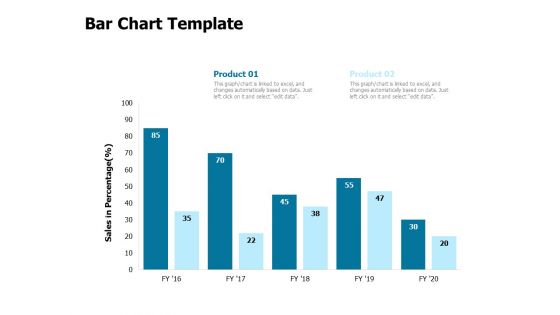
Developing Implementing Strategic HRM Plans Bar Chart Template Ppt File Slides PDF
Presenting this set of slides with name developing implementing strategic hrm plans bar chart template ppt file slides pdf. The topics discussed in these slides are product 1, product 2. This is a completely editable PowerPoint presentation and is available for immediate download. Download now and impress your audience.
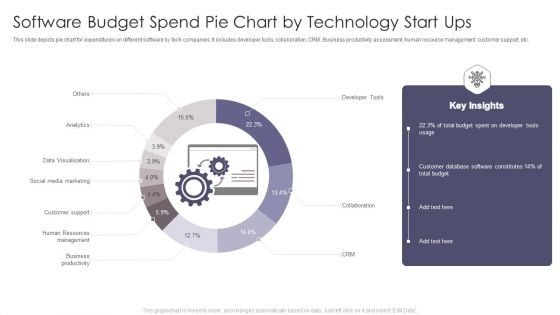
Software Budget Spend Pie Chart By Technology Start Ups Designs PDF
This slide depicts pie chart for expenditures on different software by tech companies. It includes developer tools, collaboration, CRM, Business productivity assessment, human resource management, customer support, etc. Showcasing this set of slides titled Software Budget Spend Pie Chart By Technology Start Ups Designs PDF. The topics addressed in these templates are Total Budget, Developer Tools, Total Budget. All the content presented in this PPT design is completely editable. Download it and make adjustments in color, background, font etc. as per your unique business setting.
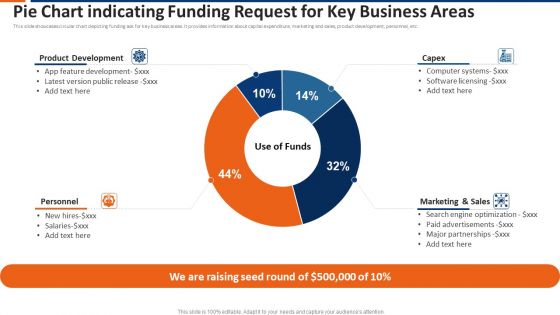
Pie Chart Indicating Funding Request For Key Business Areas Ppt Show Topics PDF
This slide showcases circular chart depicting funding ask for key business areas. It provides information about capital expenditure, marketing and sales, product development, personnel, etc. Pitch your topic with ease and precision using this pie chart indicating funding request for key business areas ppt show topics pdf. This layout presents information on product development, capex, marketing and sales, personnel. It is also available for immediate download and adjustment. So, changes can be made in the color, design, graphics or any other component to create a unique layout.
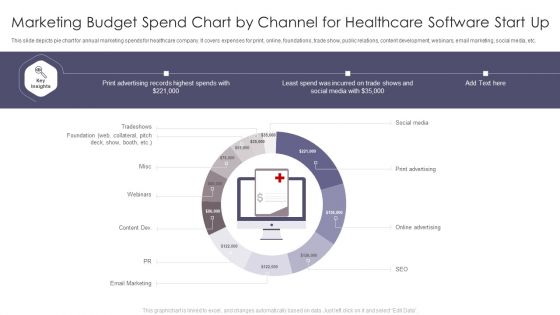
Marketing Budget Spend Chart By Channel For Healthcare Software Start Up Summary PDF
This slide depicts pie chart for annual marketing spends for healthcare company. It covers expenses for print, online, foundations, trade show, public relations, content development, webinars, email marketing, social media, etc. Showcasing this set of slides titled Marketing Budget Spend Chart By Channel For Healthcare Software Start Up Summary PDF. The topics addressed in these templates areTradeshows, Social Media, Print Advertising. All the content presented in this PPT design is completely editable. Download it and make adjustments in color, background, font etc. as per your unique business setting.
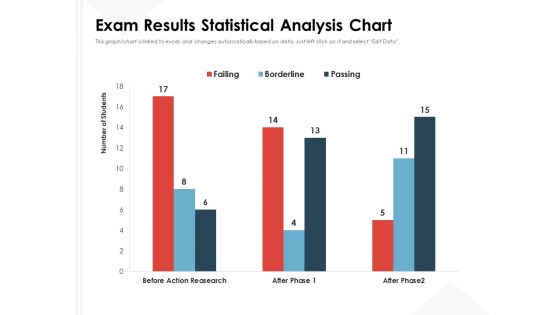
Exam Results Statistical Analysis Chart Ppt PowerPoint Presentation Inspiration Slide Download
Presenting this set of slides with name exam results statistical analysis chart ppt powerpoint presentation inspiration slide download. The topics discussed in these slides are failing, borderline, passing. This is a completely editable PowerPoint presentation and is available for immediate download. Download now and impress your audience.
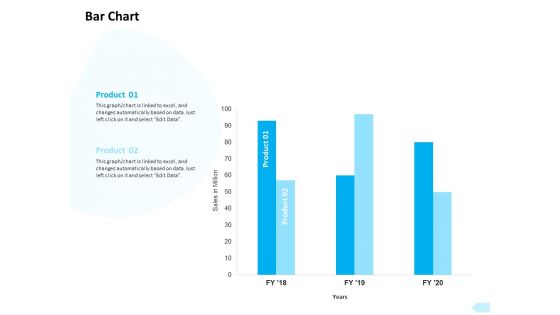
API Integration Software Development Bar Chart Ppt Gallery Graphic Tips PDF
Presenting this set of slides with name api integration software development bar chart ppt gallery graphic tips pdf. The topics discussed in these slides are product 1, product 2. This is a completely editable PowerPoint presentation and is available for immediate download. Download now and impress your audience.
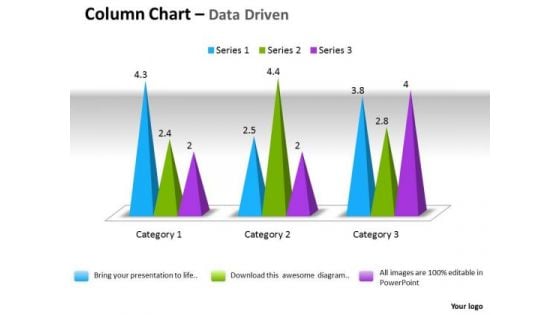
Microsoft Excel Data Analysis 3d Change In Business Process Chart PowerPoint Templates
Double Your Chances With Our microsoft excel data analysis 3d change in business process chart Powerpoint Templates . The Value Of Your Thoughts Will Increase Two-Fold.


 Continue with Email

 Home
Home


