Progressive Charts
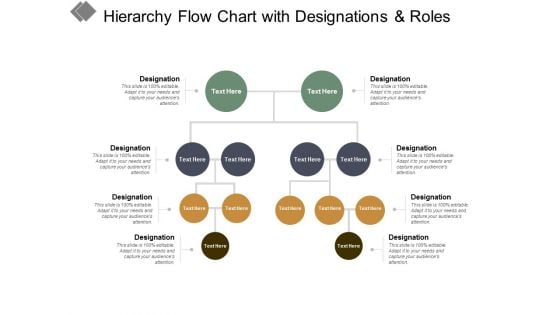
Hierarchy Flow Chart With Designations And Roles Ppt PowerPoint Presentation Styles Format Ideas
This is a hierarchy flow chart with designations and roles ppt powerpoint presentation styles format ideas. This is a four stage process. The stages in this process are business ownership, family business, owned business.
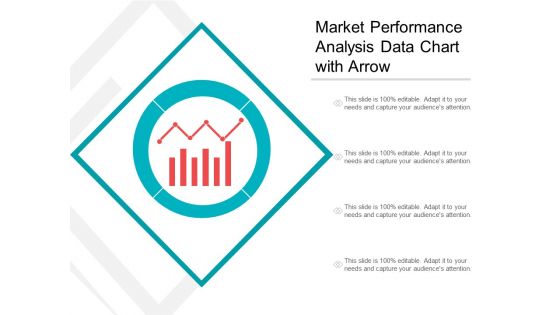
Market Performance Analysis Data Chart With Arrow Ppt PowerPoint Presentation Inspiration Graphics
This is a market performance analysis data chart with arrow ppt powerpoint presentation inspiration graphics. This is a four stage process. The stages in this process are marketing analytics, marketing performance, marketing discovery.
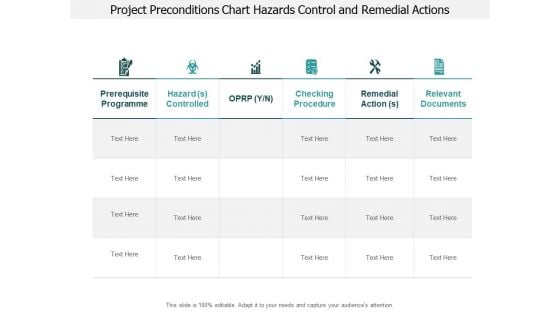
Project Preconditions Chart Hazards Control And Remedial Actions Ppt PowerPoint Presentation Pictures Show
This is a project preconditions chart hazards control and remedial actions ppt powerpoint presentation pictures show. This is a six stage process. The stages in this process are need, requirement, prerequisite.
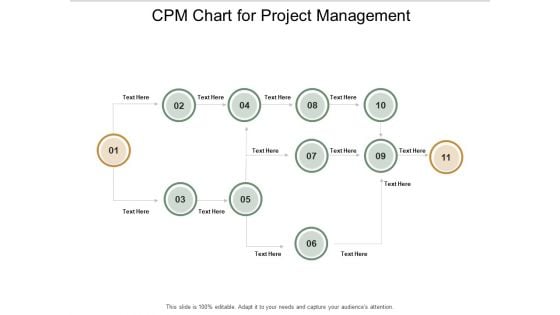
Cpm Chart For Project Management Ppt PowerPoint Presentation Portfolio Background Image
This is a cpm chart for project management ppt powerpoint presentation portfolio background image. This is a eleven stage process. The stages in this process are critical path method, critical path analysis, cpm.
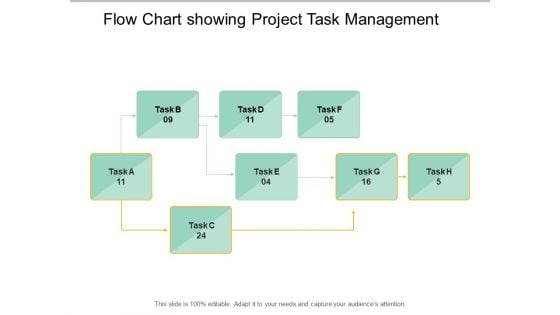
Flow Chart Showing Project Task Management Ppt PowerPoint Presentation Styles Smartart
This is a flow chart showing project task management ppt powerpoint presentation styles smartart. This is a eight stage process. The stages in this process are critical path method, critical path analysis, cpm.
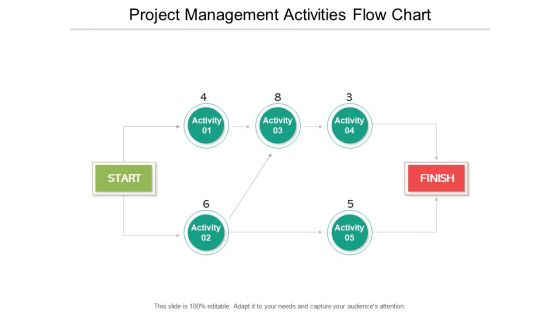
Project Management Activities Flow Chart Ppt PowerPoint Presentation File Example File
This is a project management activities flow chart ppt powerpoint presentation file example file. This is a seven stage process. The stages in this process are critical path method, critical path analysis, cpm.
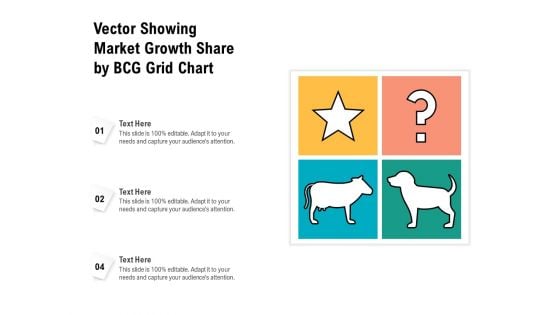
Vector Showing Market Growth Share By BCG Grid Chart Ppt PowerPoint Presentation Gallery Graphic Images PDF
Persuade your audience using this vector showing market growth share by bcg grid chart ppt powerpoint presentation gallery graphic images pdf. This PPT design covers three stages, thus making it a great tool to use. It also caters to a variety of topics including vector showing market growth share by bcg grid chart. Download this PPT design now to present a convincing pitch that not only emphasizes the topic but also showcases your presentation skills.
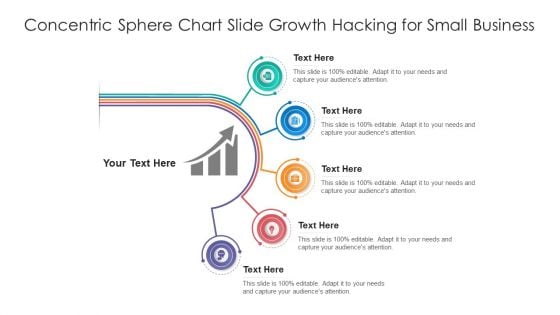
Concentric Sphere Chart Slide Growth Hacking For Small Business Ppt Ideas Designs PDF
Persuade your audience using this concentric sphere chart slide growth hacking for small business ppt ideas designs pdf. This PPT design covers five stages, thus making it a great tool to use. It also caters to a variety of topics including concentric sphere chart slide growth hacking for small business. Download this PPT design now to present a convincing pitch that not only emphasizes the topic but also showcases your presentation skills.
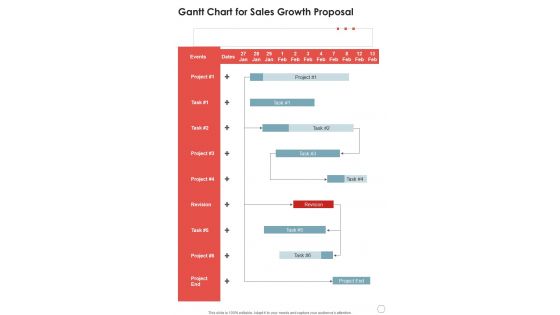
Gantt Chart For Sales Growth Proposal One Pager Sample Example Document
Presenting you an exemplary Gantt Chart For Sales Growth Proposal One Pager Sample Example Document. Our one-pager comprises all the must-have essentials of an inclusive document. You can edit it with ease, as its layout is completely editable. With such freedom, you can tweak its design and other elements to your requirements. Download this Gantt Chart For Sales Growth Proposal One Pager Sample Example Document brilliant piece now.
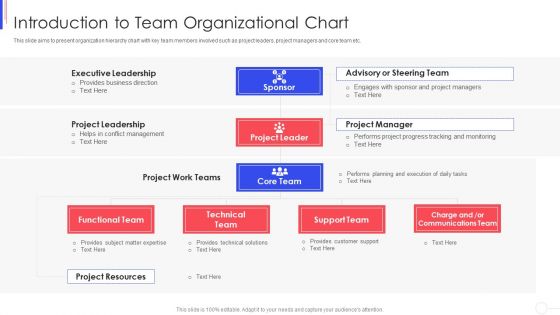
Strategy To Improve Team Proficiency Introduction To Team Organizational Chart Mockup PDF
This slide aims to present organization hierarchy chart with key team members involved such as project leaders, project managers and core team etc. Deliver an awe inspiring pitch with this creative strategy to improve team proficiency introduction to team organizational chart mockup pdf bundle. Topics like functional, team, technical, support, resources can be discussed with this completely editable template. It is available for immediate download depending on the needs and requirements of the user.
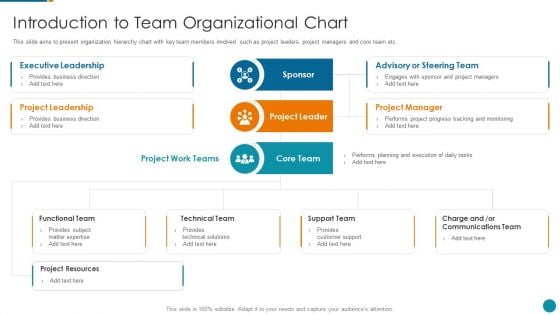
Strategic Procedure To Improve Employee Efficiency Introduction To Team Organizational Chart Download PDF
This slide aims to present organization hierarchy chart with key team members involved such as project leaders, project managers and core team etc.Deliver an awe inspiring pitch with this creative strategic procedure to improve employee efficiency introduction to team organizational chart download pdf bundle. Topics like functional team, technical team, communications team can be discussed with this completely editable template. It is available for immediate download depending on the needs and requirements of the user.
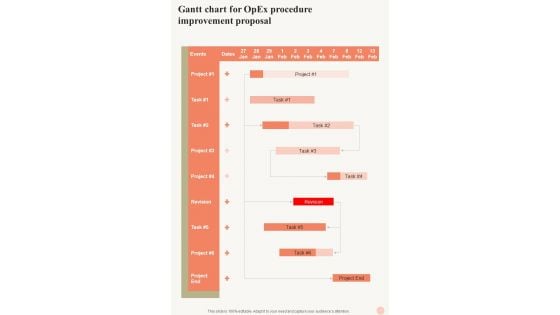
Gantt Chart For Opex Procedure Improvement Proposal One Pager Sample Example Document
Presenting you an exemplary Gantt Chart For Opex Procedure Improvement Proposal One Pager Sample Example Document. Our one pager comprises all the must have essentials of an inclusive document. You can edit it with ease, as its layout is completely editable. With such freedom, you can tweak its design and other elements to your requirements. Download this Gantt Chart For Opex Procedure Improvement Proposal One Pager Sample Example Document brilliant piece now.
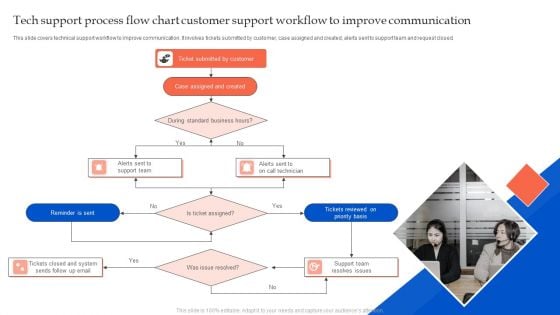
Tech Support Process Flow Chart Customer Support Workflow To Improve Communication Information PDF
This slide covers technical support workflow to improve communication. It involves tickets submitted by customer, case assigned and created, alerts sent to support team and request closed. Presenting six to dispense important information. This template comprises six stages. It also presents valuable insights into the topics including Tickets Reviewed, Priority Basis, Support Team, Resolves Issues. This is a completely customizable PowerPoint theme that can be put to use immediately. So, download it and address the topic impactfully.
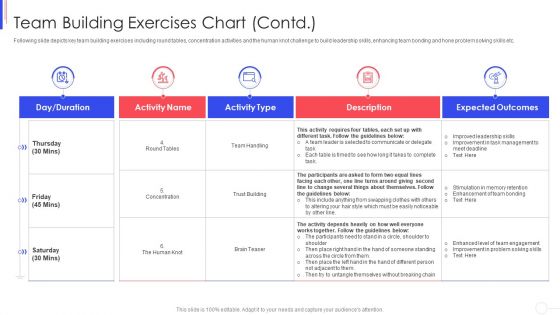
Strategy To Improve Team Proficiency Team Building Exercises Chart Skills Elements PDF
Mentioned slide covers multiple exercises for achieving confident people management and effective implementation of company practices, while aiming to achieve company wide performance objectives and goals. Deliver an awe inspiring pitch with this creative strategy to improve team proficiency team building exercises chart skills elements pdf bundle. Topics like team building exercises chart can be discussed with this completely editable template. It is available for immediate download depending on the needs and requirements of the user.
Blood Sugar Level Eating Chart In Powerpoint And Google Slides Cpb
Presenting our innovatively-designed set of slides titled Blood Sugar Level Eating Chart In Powerpoint And Google Slides Cpb. This completely editable PowerPoint graphic exhibits Blood Sugar Level Eating Chart that will help you convey the message impactfully. It can be accessed with Google Slides and is available in both standard screen and widescreen aspect ratios. Apart from this, you can download this well-structured PowerPoint template design in different formats like PDF, JPG, and PNG. So, click the download button now to gain full access to this PPT design. Our Blood Sugar Level Eating Chart In Powerpoint And Google Slides Cpb are topically designed to provide an attractive backdrop to any subject. Use them to look like a presentation pro.
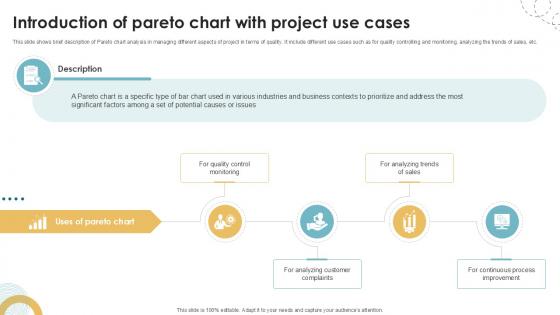
Introduction Of Pareto Chart With Project Use Cases Executing Quality Ppt Slides PM SS V
This slide shows brief description of Pareto chart analysis in managing different aspects of project in terms of quality. It include different use cases such as for quality controlling and monitoring, analyzing the trends of sales, etc. The best PPT templates are a great way to save time, energy, and resources. Slidegeeks have 100 percent editable powerpoint slides making them incredibly versatile. With these quality presentation templates, you can create a captivating and memorable presentation by combining visually appealing slides and effectively communicating your message. Download Introduction Of Pareto Chart With Project Use Cases Executing Quality Ppt Slides PM SS V from Slidegeeks and deliver a wonderful presentation. This slide shows brief description of Pareto chart analysis in managing different aspects of project in terms of quality. It include different use cases such as for quality controlling and monitoring, analyzing the trends of sales, etc.
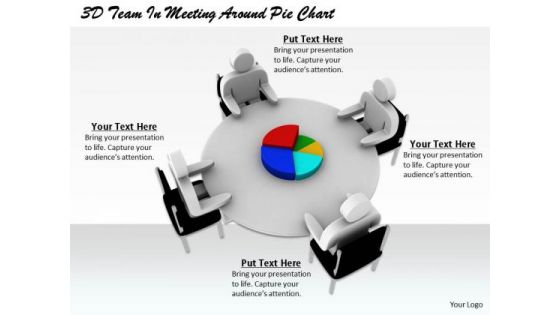
Business Model Strategy 3d Team Meeting Around Pie Chart Character Models
Touch Base With Our Business Model Strategy 3d Team Meeting Around Pie Chart Character Models Powerpoint Templates. Review Your Growth With Your Audience. Take A Deep Dive With Our leadership Powerpoint Templates. Get Into The Nitti Gritty Of It All.
Revenue Cycle Management Flow Chart Ppt PowerPoint Presentation Outline Designs Cpb
Presenting this set of slides with name revenue cycle management flow chart ppt powerpoint presentation outline designs cpb. This is an editable Powerpoint three stages graphic that deals with topics like revenue cycle management flow chart to help convey your message better graphically. This product is a premium product available for immediate download and is 100 percent editable in Powerpoint. Download this now and use it in your presentations to impress your audience.
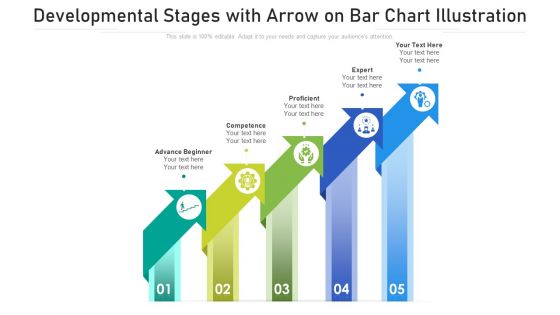
Developmental Stages With Arrow On Bar Chart Illustration Ppt PowerPoint Presentation File Portfolio PDF
Presenting developmental stages with arrow on bar chart illustration ppt powerpoint presentation file portfolio pdf to dispense important information. This template comprises five stages. It also presents valuable insights into the topics including advance beginner, competence, proficient. This is a completely customizable PowerPoint theme that can be put to use immediately. So, download it and address the topic impactfully.
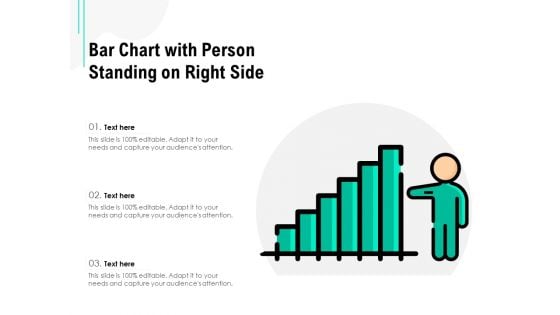
Bar Chart With Person Standing On Right Side Ppt PowerPoint Presentation File Portrait PDF
Persuade your audience using this bar chart with person standing on right side ppt powerpoint presentation file portrait pdf. This PPT design covers three stages, thus making it a great tool to use. It also caters to a variety of topics including bar chart with person standing on right side. Download this PPT design now to present a convincing pitch that not only emphasizes the topic but also showcases your presentation skills.
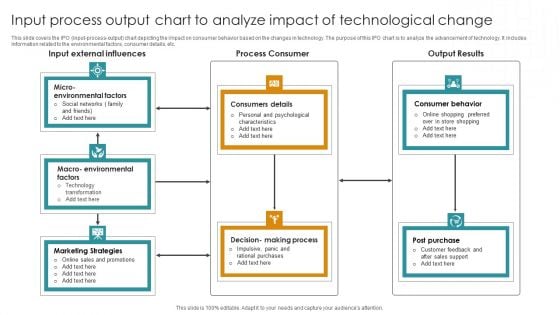
Input Process Output Chart To Analyze Impact Of Technological Change Graphics PDF
This slide covers the IPO input-process-output chart depicting the impact on consumer behavior based on the changes in technology. The purpose of this IPO chart is to analyze the advancement of technology. It includes information related to the environmental factors, consumer details, etc. Pitch your topic with ease and precision using this Input Process Output Chart To Analyze Impact Of Technological Change Graphics PDF. This layout presents information on Input External Influences, Process Consumer, Output Results. It is also available for immediate download and adjustment. So, changes can be made in the color, design, graphics or any other component to create a unique layout.

Stock Photo Develop Business Strategy Compare Data Pie Chart Stock Images
All for one and one for all. Our stock photo develop business strategy compare data pie chart stock images are all for you. Get things done on a war footing. Our marketing are excellent accelerators.
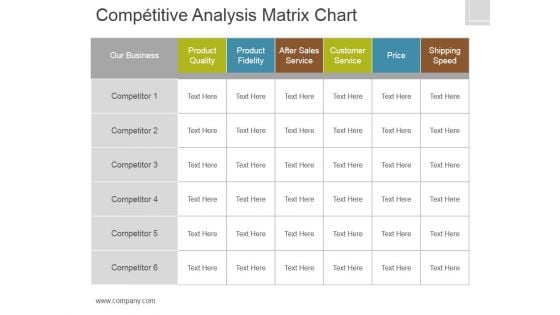
Competitive Analysis Template 8 Matrix Chart Ppt PowerPoint Presentation Designs Download
This is a competitive analysis template 8 matrix chart ppt powerpoint presentation designs download. This is a six stage process. The stages in this process are product quality, product fidelity, after sales service, customer service, price, shipping speed.

Product Expansion And Growth Chart To Improve Market Share Ppt PowerPoint Presentation Model File Formats PDF
Presenting this set of slides with name product expansion and growth chart to improve market share ppt powerpoint presentation model file formats pdf. This is a four stage process. The stages in this process are present products, new markets, market development, diversification invoicing new products and new markets. This is a completely editable PowerPoint presentation and is available for immediate download. Download now and impress your audience.

Person Showing Success Chart Business PowerPoint Themes And PowerPoint Slides 0411
Microsoft PowerPoint Theme and Slide with business hand writes the way from idea to success on flowchart Find favour with the audience for your ideas. Our Person Showing Success Chart Business PowerPoint Themes And PowerPoint Slides 0411 will extract approval.

Business Bar Graph And X Y Chart PowerPoint Templates Ppt Backgrounds For Slides 0613
Give them a dose of your ability. It will go down well with our Business Bar Graph And X Y Chart PowerPoint Templates PPT Backgrounds For Slides. Connect the dots with our Marketing PowerPoint Templates. Watch the whole picture clearly emerge. Dot your thoughts with our Success PowerPoint Templates. Give your demeanour that Propah look. Distill your thoughts with our Business Bar Graph And X Y Chart PowerPoint Templates Ppt Backgrounds For Slides 0613. They will draw outthe essence of it all.
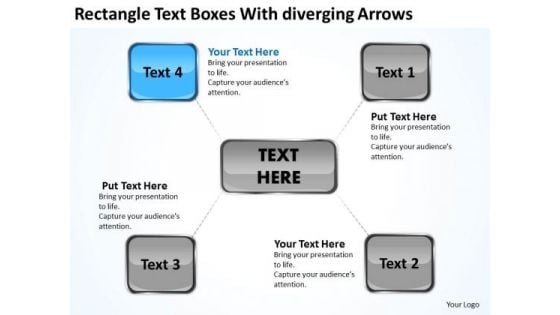
Rectangle Text Boxes With Diverging Arrows Chart Cycle Process PowerPoint Slides
We present our rectangle text boxes with diverging arrows chart Cycle Process PowerPoint Slides.Download our Process and Flows PowerPoint Templates because generation of sales is the core of any business. Use our Business PowerPoint Templates because you have secured a name for yourself in the domestic market. Now the time is right to spread your reach to other countries. Download our Shapes PowerPoint Templates because there is a key aspect to be emphasised. Download and present our Success PowerPoint Templates because your quest has taken you well onto the path of success. Present our Boxes PowerPoint Templates because the foundation stones of many a life.Use these PowerPoint slides for presentations relating to Arrow, Blank, Chart, Diagram, Flow, Flow Chart, Illustration, Plan, Presentation, Process, Process Chart, Scheme. The prominent colors used in the PowerPoint template are Black, Blue, Gray. Professionals tell us our rectangle text boxes with diverging arrows chart Cycle Process PowerPoint Slides are Liberated. Customers tell us our Chart PowerPoint templates and PPT Slides are Wonderful. Use our rectangle text boxes with diverging arrows chart Cycle Process PowerPoint Slides are Youthful. The feedback we get is that our Diagram PowerPoint templates and PPT Slides are Dynamic. Professionals tell us our rectangle text boxes with diverging arrows chart Cycle Process PowerPoint Slides will help you be quick off the draw. Just enter your specific text and see your points hit home. Presenters tell us our Flow PowerPoint templates and PPT Slides are Ritzy. Let new ideas filter in with our Rectangle Text Boxes With Diverging Arrows Chart Cycle Process PowerPoint Slides. They will be acceptable to any audience.
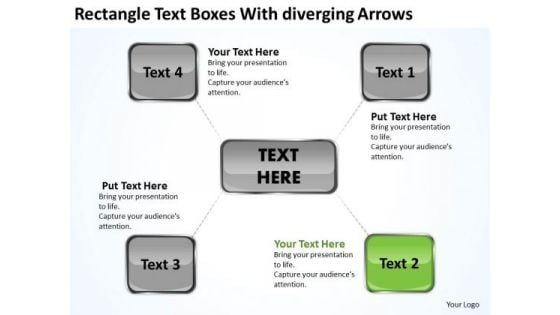
Rectangle Text Boxes With Diverging Arrows Chart Circular Flow Network PowerPoint Templates
We present our rectangle text boxes with diverging arrows chart Circular Flow Network PowerPoint templates.Download our Process and Flows PowerPoint Templates because it is in your DNA to analyse possible causes to the minutest detail. Download and present our Business PowerPoint Templates because you have secured a name for yourself in the domestic market. Now the time is right to spread your reach to other countries. Present our Shapes PowerPoint Templates because you can put down your ideas and present them using our innovative templates. Use our Success PowerPoint Templates because you have come up with a brilliant breakthrough idea. you can also visualise the interest it will generate. Use our Boxes PowerPoint Templates because your findings are here to help arrive at an accurate diagnosis.Use these PowerPoint slides for presentations relating to Arrow, Blank, Chart, Diagram, Flow, Flow Chart, Illustration, Plan, Presentation, Process, Process Chart, Scheme. The prominent colors used in the PowerPoint template are Black, Green, Gray. Professionals tell us our rectangle text boxes with diverging arrows chart Circular Flow Network PowerPoint templates are Fabulous. Customers tell us our Diagram PowerPoint templates and PPT Slides are Magical. Use our rectangle text boxes with diverging arrows chart Circular Flow Network PowerPoint templates will impress their bosses and teams. The feedback we get is that our Chart PowerPoint templates and PPT Slides are designed to make your presentations professional. Professionals tell us our rectangle text boxes with diverging arrows chart Circular Flow Network PowerPoint templates are Youthful. Presenters tell us our Plan PowerPoint templates and PPT Slides will help you be quick off the draw. Just enter your specific text and see your points hit home. Exhibit your talent with our Rectangle Text Boxes With Diverging Arrows Chart Circular Flow Network PowerPoint Templates. Let the audience see your dexterity.

Business Chart Bar Graph PowerPoint Templates Ppt Backgrounds For Slides 0513
Doll up your thoughts with our Business Chart Bar Graph PowerPoint Templates PPT Backgrounds For Slides. They will make a pretty picture. They say a dog is man's best friend. Our Marketing PowerPoint Templates come a close second. Establish the dominance of your ideas. Our ArrowsPowerPoint Templates will put them on top. Earn the esteem of your colleagues with our Business Chart Bar Graph PowerPoint Templates Ppt Backgrounds For Slides 0513. Give your thoughts that something special.

Person Showing Success Chart Business PowerPoint Templates And PowerPoint Backgrounds 0411
Microsoft PowerPoint Template and Background with business hand writes the way from idea to success on flowchart Capture emerging international markets with our Person Showing Success Chart Business PowerPoint Templates And PowerPoint Backgrounds 0411. They will make you look good.

Bar Chart In Motion Business PowerPoint Themes And PowerPoint Slides 0511
Microsoft PowerPoint Theme and Slide with business diagram glass bars in motion building a stair and showing success Our Bar Chart In Motion Business PowerPoint Themes And PowerPoint Slides 0511 have a distinguished appearance. They also project a balanced approach.
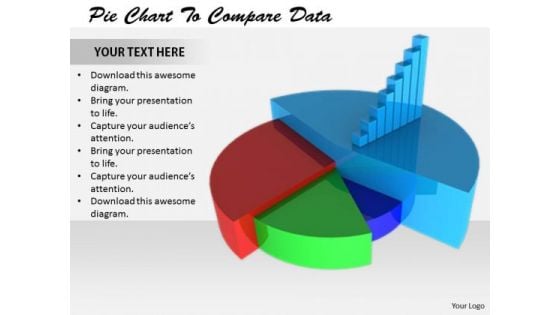
Stock Photo Corporate Business Strategy Pie Chart To Compare Data Best
Our stock photo corporate business strategy pie chart to compare data best ensure the force is with you. They enhance the energy in you. Our marketing help ideas come into force. They encourage the audience to commence action.
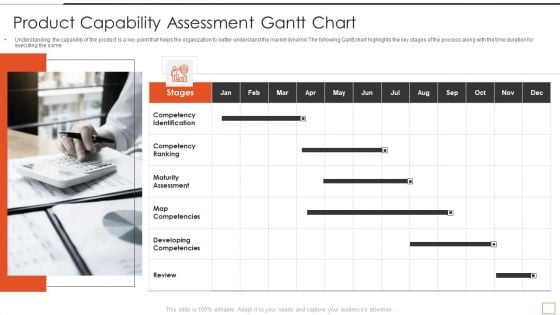
Developing New Product Messaging Canvas Determining Its USP Product Capability Assessment Gantt Chart Information PDF
Understanding the capability of the product is a key point that helps the organization to better understand the market dynamic The following Gantt chart highlights the key stages of the process along with the time duration for executing the same Presenting developing new product messaging canvas determining its usp product capability assessment gantt chart information pdf to provide visual cues and insights. Share and navigate important information on one stages that need your due attention. This template can be used to pitch topics like product capability assessment gantt chart. In addtion, this PPT design contains high resolution images, graphics, etc, that are easily editable and available for immediate download.
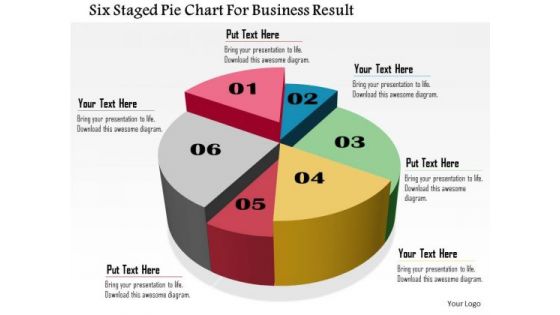
Business Daigram Six Staged Pie Chart For Business Result Presentation Templets
Six staged pie chart is used to design this business slide. Download this diagram to make business and financial reports. Use our above diagram to express information in a visual way.

Business Chart With Arrow Business PowerPoint Templates And PowerPoint Backgrounds 0611
Microsoft PowerPoint Template and Background with white spiral stairs with arrow to success Our Business Chart With Arrow Business PowerPoint Templates And PowerPoint Backgrounds 0611 ensure approval. Your ideas will fit the bill.
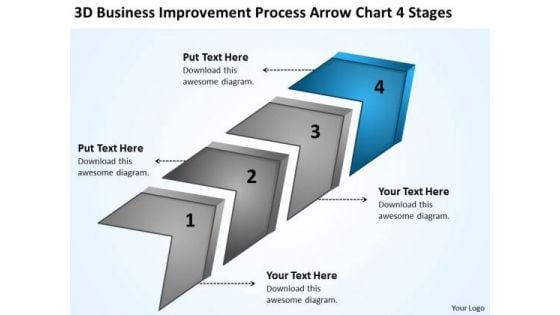
Improvement Process Arrow Chart 4 Stages Ppt Nail Salon Business Plan PowerPoint Templates
We present our improvement process arrow chart 4 stages ppt nail salon business plan PowerPoint templates.Present our Marketing PowerPoint Templates because The marketplace is the merger of your dreams and your ability. Use our Success PowerPoint Templates because you can Help your viewers automatically emphathise with your thoughts. Download our Business PowerPoint Templates because you are sure you have the right people for your plans. Present our Process and Flows PowerPoint Templates because getting it done in time is the key to success. Use our Arrows PowerPoint Templates because your marketing strategies can funnel down to the cone, stage by stage, refining as you go along.Use these PowerPoint slides for presentations relating to Algorithm, Arrow, Arrows, Block, Business, Chart, Connection, Design, Development, Diagram, Direction, Element, Flow, Flowchart, Graph, Kind, Linear, Management, Organization, Process, Program, Section, Segment, Set, Sign, Solution, Strategy, Symbol. The prominent colors used in the PowerPoint template are Blue navy, Gray, Black. We assure you our improvement process arrow chart 4 stages ppt nail salon business plan PowerPoint templates help you meet deadlines which are an element of today's workplace. Just browse and pick the slides that appeal to your intuitive senses. We assure you our Development PowerPoint templates and PPT Slides are incredible easy to use. Customers tell us our improvement process arrow chart 4 stages ppt nail salon business plan PowerPoint templates are Breathtaking. Presenters tell us our Development PowerPoint templates and PPT Slides are Appealing. You can be sure our improvement process arrow chart 4 stages ppt nail salon business plan PowerPoint templates are Radiant. The feedback we get is that our Development PowerPoint templates and PPT Slides effectively help you save your valuable time. Let our Improvement Process Arrow Chart 4 Stages Ppt Nail Salon Business Plan PowerPoint Templates rub off on your thoughts. They will get a dose of the X-factor.
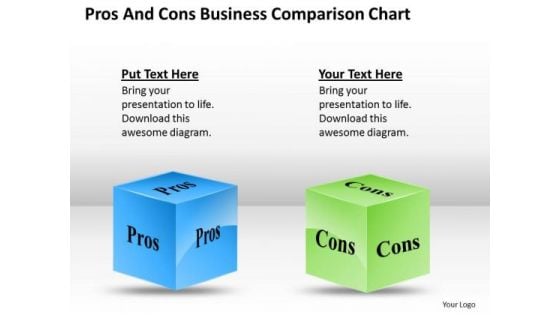
Strategy PowerPoint Template Pros And Cons Business Comparison Chart Ppt Templates
Our strategy powerpoint template pros and cons business comparison chart ppt templates are quick on the draw. They immediately catch the drift of your thoughts. Drink to the success of your campaign. Our Marketing PowerPoint Templates will raise a toast. Pass it around on our Finance PowerPoint Templates. Your audience will lap it up. Get the best backing available. It'll be difficult to beat your thoughts and our Strategy PowerPoint Template Pros And Cons Business Comparison Chart Ppt Templates.
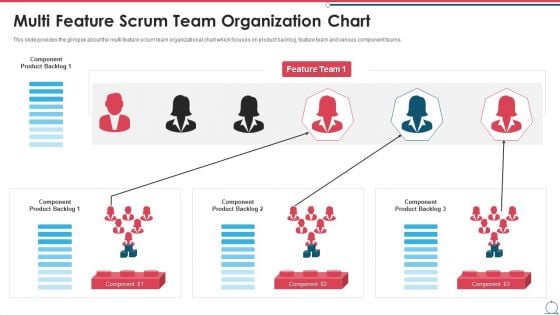
Building An Agile Development Scrum Team Multi Feature Scrum Team Organization Chart Summary PDF
This slide provides the glimpse about the multi feature scrum team organizational chart which focuses on product backlog, feature team and various component teams. This is a building an agile development scrum team multi feature scrum team organization chart summary pdf template with various stages. Focus and dispense information on three stages using this creative set, that comes with editable features. It contains large content boxes to add your information on topics like multi feature scrum team organization chart. You can also showcase facts, figures, and other relevant content using this PPT layout. Grab it now.
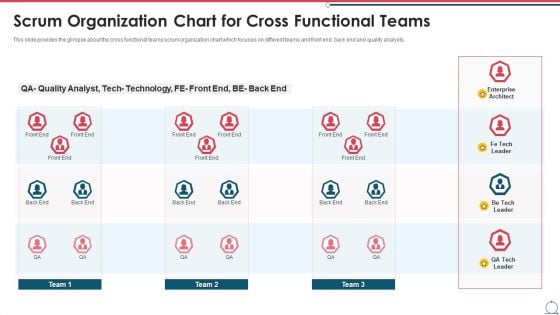
Building An Agile Development Scrum Team Scrum Organization Chart For Cross Functional Teams Mockup PDF
This slide provides the glimpse about the cross functional teams scrum organization chart which focuses on different teams and front end, back end and quality analysts. This is a building an agile development scrum team scrum organization chart for cross functional teams mockup pdf template with various stages. Focus and dispense information on one stages using this creative set, that comes with editable features. It contains large content boxes to add your information on topics like scrum organization chart for cross functional teams. You can also showcase facts, figures, and other relevant content using this PPT layout. Grab it now.

Bar Graphs 2013 Growth Flow Chart PowerPoint Templates Ppt Backgrounds For Slides 1212
We present our Bar Graphs 2013 Growth Flow Chart PowerPoint Templates PPT Backgrounds For Slides 1212.Download and present our Arrows PowerPoint Templates because it helps to inject your values into your group and see them bond to achieve success. Present our Process and flows PowerPoint Templates because this slide depicts the occasion for gifting and giving. Download and present our Marketing PowerPoint Templates because infrastructure growth is an obvious requirement of today.inform your group on how exactly this potential is tailor made for you. Present our Success PowerPoint Templates because iT outlines the entire thought process for the benefit of others. Tell it to the world with your characteristic aplomb. Download and present our Business PowerPoint Templates because this template helps you to grab the attention of your listeners.Use these PowerPoint slides for presentations relating to Year 2013 growth bar graphs chart, process and flows, arrows, marketing, business, success. The prominent colors used in the PowerPoint template are Yellow, Gray, Black. Professionals tell us our Bar Graphs 2013 Growth Flow Chart PowerPoint Templates PPT Backgrounds For Slides 1212 are specially created by a professional team with vast experience. They diligently strive to come up with the right vehicle for your brilliant Ideas. We assure you our bar PowerPoint templates and PPT Slides provide you with a vast range of viable options. Select the appropriate ones and just fill in your text. PowerPoint presentation experts tell us our Bar Graphs 2013 Growth Flow Chart PowerPoint Templates PPT Backgrounds For Slides 1212 are Elevated. Presenters tell us our process PowerPoint templates and PPT Slides are Pleasant. The feedback we get is that our Bar Graphs 2013 Growth Flow Chart PowerPoint Templates PPT Backgrounds For Slides 1212 are Endearing. You can be sure our bar PowerPoint templates and PPT Slides are Royal. Be a change agent with our Bar Graphs 2013 Growth Flow Chart PowerPoint Templates Ppt Backgrounds For Slides 1212. They will make you look good.
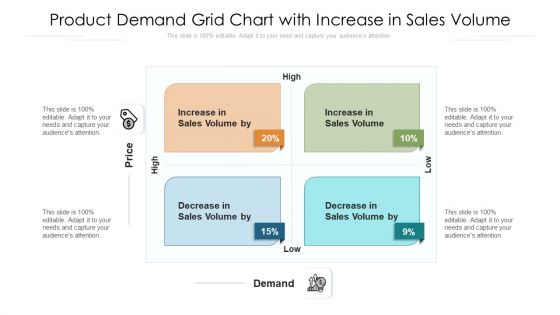
Product Demand Grid Chart With Increase In Sales Volume Ppt Slides Tips PDF
Persuade your audience using this product demand grid chart with increase in sales volume ppt slides tips pdf. This PPT design covers four stages, thus making it a great tool to use. It also caters to a variety of topics including product demand grid chart with increase in sales volume. Download this PPT design now to present a convincing pitch that not only emphasizes the topic but also showcases your presentation skills.
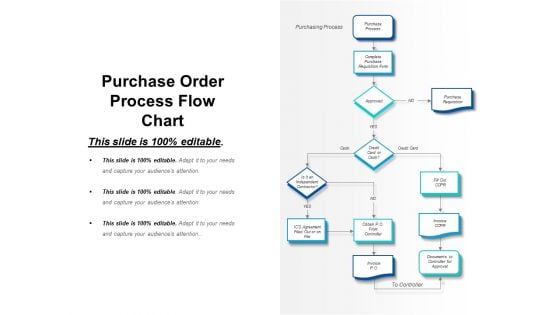
Purchase Order Process Flow Chart Ppt PowerPoint Presentation Professional Slide Download
This is a purchase order process flow chart ppt powerpoint presentation professional slide download. This is a six stage process. The stages in this process are purchasing, procurement, bidding.
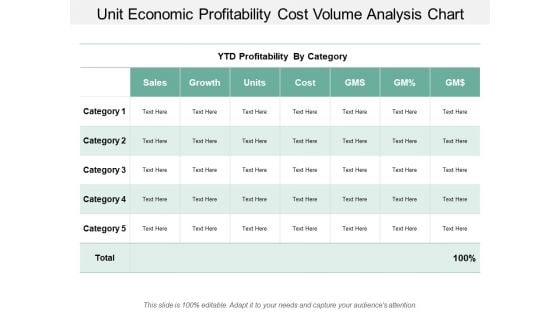
Unit Economic Profitability Cost Volume Analysis Chart Ppt PowerPoint Presentation Styles Graphics Design
This is a unit economic profitability cost volume analysis chart ppt powerpoint presentation styles graphics design. This is a five stage process. The stages in this process are business unit profitability, profitable organization, corporate unit profitability.
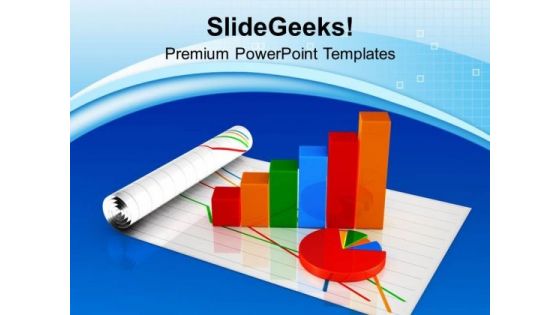
Bar Graph With Pie Chart Sales PowerPoint Templates Ppt Backgrounds For Slides 0613
Open up doors that lead to success. Our Bar Graph With Pie Chart Sales PowerPoint Templates PPT Backgrounds For Slides provide the handles. Oppurtunity will come knocking at your door. Welcome it with our business PowerPoint Templates. Our marketing PowerPoint Templates abhor doodling. They never let the interest flag. Our Bar Graph With Pie Chart Sales PowerPoint Templates Ppt Backgrounds For Slides 0613 pick up on many a fable. They contain the wisdom of business lore.
Business Diagram Pie Chart With Icons For Financial Analysis Presentation Template
This professional business diagram slide has been designed with pie chart and icons. It contains concept of financial analysis. Use this slide to build exclusive presentations for your viewers.
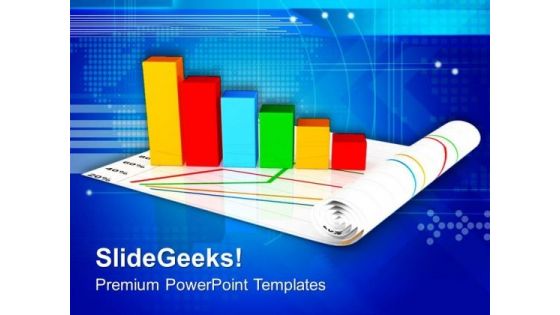
Business Chart Marketing Theme PowerPoint Templates Ppt Backgrounds For Slides 0513
Do the done thing with your thoughts. Uphold custom with our Business Chart Marketing Theme PowerPoint Templates PPT Backgrounds For Slides. Be a donor of great ideas. Display your charity on our arrows powerpoint templates. Make a donation of your ideas. Our success powerpoint templates will convey your charitable attitude. Display your even handedness with our Business Chart Marketing Theme PowerPoint Templates Ppt Backgrounds For Slides 0513. Show them that you make fair assessments.
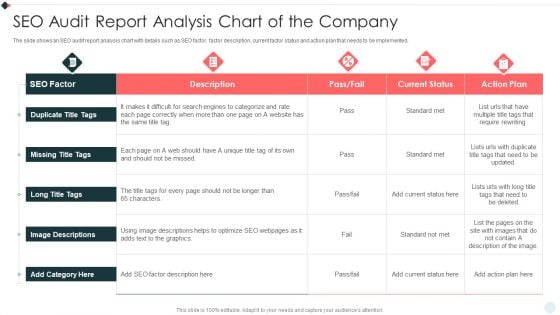
SEO Audit Summary To Increase SEO Audit Report Analysis Chart Of The Company Template PDF
The slide shows an SEO audit report analysis chart with details such as SEO factor, factor description, current factor status and action plan that needs to be implemented. Deliver an awe inspiring pitch with this creative SEO Audit Summary To Increase SEO Audit Report Analysis Chart Of The Company Template PDF bundle. Topics like Current Status, Action Plan, SEO Factor can be discussed with this completely editable template. It is available for immediate download depending on the needs and requirements of the user.

Business Calendar With Growing Chart PowerPoint Templates Ppt Backgrounds For Slides 0613
Open up doors that lead to success. Our Business Calendar With Growing Chart PowerPoint Templates PPT Backgrounds For Slides provide the handles. Oppurtunity will come knocking at your door. Welcome it with our marketing PowerPoint Templates. Our finance PowerPoint Templates abhor doodling. They never let the interest flag. Dosen't matter what the topic. Make it interesting with our Business Calendar With Growing Chart PowerPoint Templates Ppt Backgrounds For Slides 0613. You will be at the top of your game.
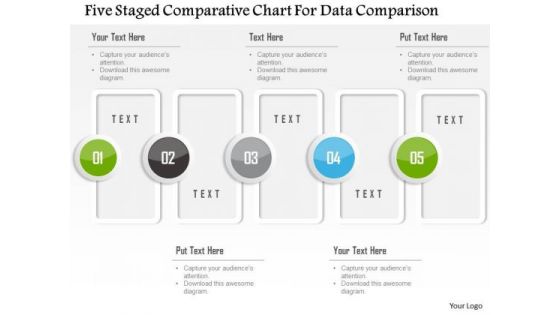
Business Diagram Five Staged Comparative Chart For Data Comparison Presentation Template
Five staged comparative chart has been used to design this power point template. This PPT contains the concept of data comparison. Use this PPT for your business and finance based data comparison in any financial presentation.
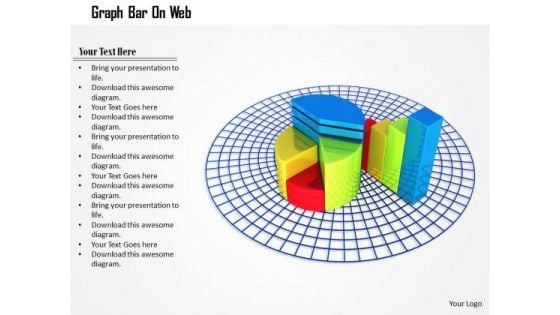
Stock Photo Pie Chart And Bar Graph On Web PowerPoint Slide
This image is designed with pie chart and bar graph on web. Use this diagram to explain your strategy to co-ordinate activities. Deliver amazing presentations to mesmerize your audience.

Business Diagram Business Men With Pie Chart And Percentage Presentation Template
This business diagram has been designed with graphic of business people and pie chart with percentage. This diagram is designed to depict team meeting on financial matter. This diagram offers a way for your audience to visually conceptualize the process.

Business Circular Chart PowerPoint Templates Marketing Home Selling Process Ppt Slides
Business Circular Chart PowerPoint Templates Marketing home selling process PPT Slides-This Marketing Home Selling Diagram summarizes the selling process. It maps all the steps involved in a home sale and their relationships to each other-Business Circular Chart PowerPoint Templates Marketing home selling process PPT Slides-This template can be used for presentations relating to Banners, Business, Buy, Communicate, Communicated, Communicating, Concepts, Conceptual, Display, Displayed, Estate, Home, House, Interested, Interest, Loan, Market, Notice, Over-White, Pend, Pending, Pole, Possible, Post, Posted,Posting, Process, Purchase, Real, Realestate, Realtor, Realty, Residence, Sale, Sell, Showing, Sign, Sold, Success Extract assent with our Business Circular Chart PowerPoint Templates Marketing Home Selling Process Ppt Slides. The audience will become agreeable.
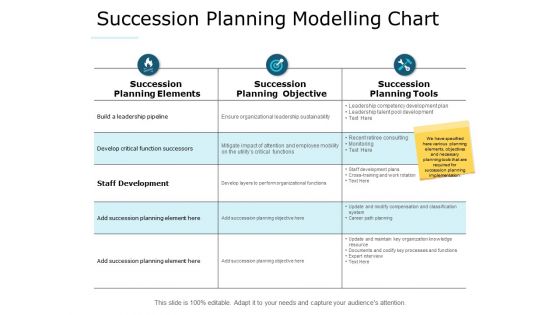
Succession Planning Modelling Chart Ppt PowerPoint Presentation Visual Aids Background Images
This is a succession planning modelling chart ppt powerpoint presentation visual aids background images. This is a three stage process. The stages in this process are compare, marketing, business, management, planning.
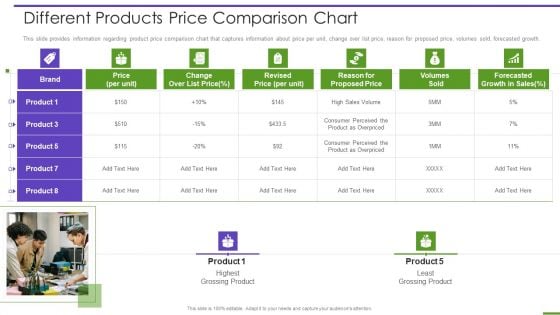
Marketing Playbook To Maximize ROI Different Products Price Comparison Chart Graphics PDF
This slide provides information regarding product price comparison chart that captures information about price per unit, change over list price, reason for proposed price, volumes sold, forecasted growth. This is a marketing playbook to maximize roi different products price comparison chart graphics pdf template with various stages. Focus and dispense information on two stages using this creative set, that comes with editable features. It contains large content boxes to add your information on topics like different products price comparison chart. You can also showcase facts, figures, and other relevant content using this PPT layout. Grab it now.
Decision Making Flow Chart Icon With Arrows Ppt Layouts Graphics Design PDF
Persuade your audience using this Decision Making Flow Chart Icon With Arrows Ppt Layouts Graphics Design PDF. This PPT design covers four stages, thus making it a great tool to use. It also caters to a variety of topics including Decision Making, Flow Chart, Icon With Arrows. Download this PPT design now to present a convincing pitch that not only emphasizes the topic but also showcases your presentation skills.
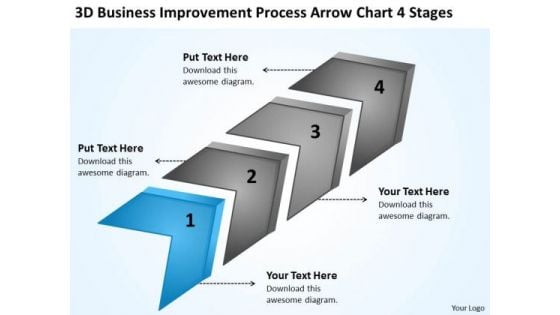
Improvement Process Arrow Chart 4 Stages Franchise Business Plan PowerPoint Templates
We present our improvement process arrow chart 4 stages franchise business plan PowerPoint templates.Use our Marketing PowerPoint Templates because this Diagram pinpoints the critical paths and areas in your process and set the timelines for their completion. Present our Success PowerPoint Templates because iT outlines the entire thought process for the benefit of others. Tell it to the world with your characteristic aplomb. Download and present our Business PowerPoint Templates because this template helps to pierce through the doubts of your audience. Download our Process and Flows PowerPoint Templates because they help to lay the base of your trend of thought. Use our Arrows PowerPoint Templates because this diagram provides trainers a tool to teach the procedure in a highly visual, engaging way.Use these PowerPoint slides for presentations relating to Algorithm, Arrow, Arrows, Block, Business, Chart, Connection, Design, Development, Diagram, Direction, Element, Flow, Flowchart, Graph, Kind, Linear, Management, Organization, Process, Program, Section, Segment, Set, Sign, Solution, Strategy, Symbol. The prominent colors used in the PowerPoint template are Blue, Gray, Black. We assure you our improvement process arrow chart 4 stages franchise business plan PowerPoint templates will make you look like a winner. We assure you our Block PowerPoint templates and PPT Slides are Fun. Customers tell us our improvement process arrow chart 4 stages franchise business plan PowerPoint templates are Chic. Presenters tell us our Development PowerPoint templates and PPT Slides are Attractive. You can be sure our improvement process arrow chart 4 stages franchise business plan PowerPoint templates are readymade to fit into any presentation structure. The feedback we get is that our Design PowerPoint templates and PPT Slides are Striking. Get noticed immediately with our Improvement Process Arrow Chart 4 Stages Franchise Business Plan PowerPoint Templates. Dont waste time struggling with PowerPoint. Let us do it for you.
Business Intelligence Strategy 3d People Sitting Around Pie Chart Basic Concepts
Deliver The Right Dose With Our Business Intelligence Strategy 3d People Sitting Around Pie Chart Basic Concepts Powerpoint Templates. Your Ideas Will Get The Correct Illumination. Your Abilities Have Been Lying Dormant. Awaken Them With Our Business Powerpoint Templates.
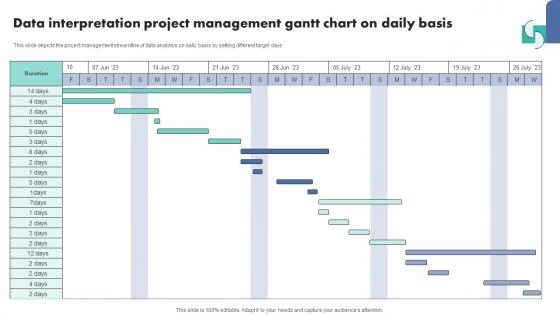
Data Interpretation Project Management Gantt Chart On Daily Basis Template Pdf
Showcasing this set of slides titled Data Interpretation Project Management Gantt Chart On Daily Basis Template Pdf The topics addressed in these templates are Data Interpretation Icon, Measure Business Growth All the content presented in this PPT design is completely editable. Download it and make adjustments in color, background, font etc. as per your unique business setting. Our Data Interpretation Project Management Gantt Chart On Daily Basis Template Pdf are topically designed to provide an attractive backdrop to any subject. Use them to look like a presentation pro.

Ppt Five Text Boxes PowerPoint Template Connections Travel With Circle Chart Templates
PPT five text boxes powerpoint template connections travel with circle Chart Templates-Use this Circular Process with five text Boxes to represent a continuing sequence of stages, tasks, or events in a circular flow and emphasize the connection between all components. You can change color, size and orientation of any icon to your liking.-PPT five text boxes powerpoint template connections travel with circle Chart Templates Enhance connectivity with our Ppt Five Text Boxes PowerPoint Template Connections Travel With Circle Chart Templates. They will always keep you in touch.
Manager Analyzing Trends From Financial Modelling Chart Vector Icon Portrait PDF
Persuade your audience using this manager analyzing trends from financial modelling chart vector icon portrait pdf. This PPT design covers three stages, thus making it a great tool to use. It also caters to a variety of topics including manager analyzing trends from financial modelling chart vector icon. Download this PPT design now to present a convincing pitch that not only emphasizes the topic but also showcases your presentation skills.


 Continue with Email

 Home
Home


