Project Budget
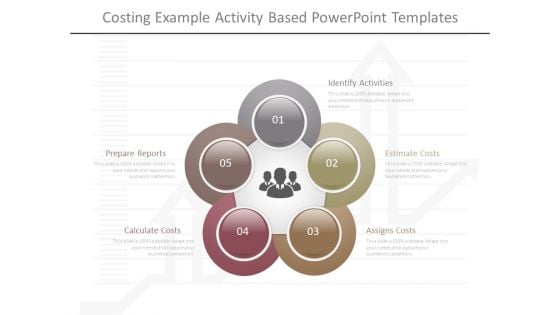
Costing Example Activity Based Powerpoint Templates
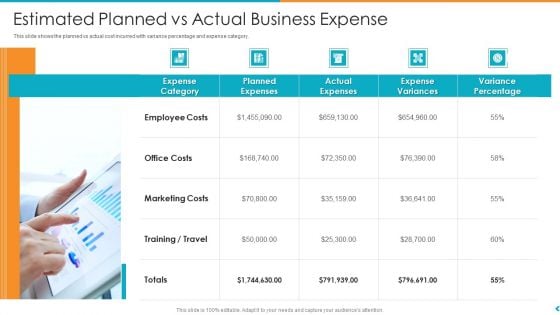
Fund Outsourcing Upgrade Efficiency Efficacy Fund Function Estimated Planned Vs Actual Business Expense Ppt Portfolio Deck
This slide shows the planned vs actual cost incurred with variance percentage and expense category. This is a fund outsourcing upgrade efficiency efficacy fund function estimated planned vs actual business expense ppt portfolio deck template with various stages. Focus and dispense information on five stages using this creative set, that comes with editable features. It contains large content boxes to add your information on topics like employee costs, office costs, marketing costs, training or travel. You can also showcase facts, figures, and other relevant content using this PPT layout. Grab it now.
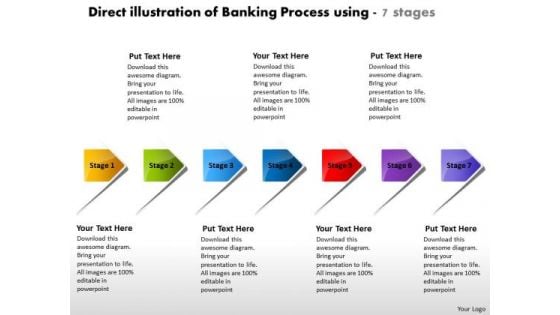
Direct Illustration Of Banking Process Using 7 Stages Electrical Design PowerPoint Slides
We present our direct illustration of banking process using 7 stages electrical design PowerPoint Slides.Use our Business PowerPoint Templates because,The fruits of your labour are beginning to show.Enlighten them on the great plans you have for their enjoyment Use our Shapes PowerPoint Templates because, You have a great plan to put the pieces together, getting all the various contributors to gel for a successful completion. Use our Signs PowerPoint Templates because,our creative template will lay down your views. Use our Arrows PowerPoint Templates because,You can Trigger audience minds with your interesting ideas. Use our Process and Flows PowerPoint Templates because,This diagram helps to reaffirm to your team your faith in maintaining the highest ethical standards.Use these PowerPoint slides for presentations relating to account, arrow, arrows, away, box, business, chart, choice, concept, concepts, consultation, corporate, design, diagram, direction, elements, flow, follow, follows, future, group, grow, increase, lines, many, month, move, past, period, phase, project, report, rise, row, step, success, text, time, timeline, work, year. The prominent colors used in the PowerPoint template are Yellow, Green, Blue. People tell us our direct illustration of banking process using 7 stages electrical design PowerPoint Slides will generate and maintain the level of interest you desire. They will create the impression you want to imprint on your audience. The feedback we get is that our away PowerPoint templates and PPT Slides are Perfect. People tell us our direct illustration of banking process using 7 stages electrical design PowerPoint Slides are Multicolored. Presenters tell us our concept PowerPoint templates and PPT Slides are effectively colour coded to prioritise your plans They automatically highlight the sequence of events you desire. The feedback we get is that our direct illustration of banking process using 7 stages electrical design PowerPoint Slides are Vintage. Professionals tell us our away PowerPoint templates and PPT Slides will make the presenter look like a pro even if they are not computer savvy. If you have doubts about the effort required? Be assured our Direct Illustration Of Banking Process Using 7 Stages Electrical Design PowerPoint Slides will make it fairly easy.
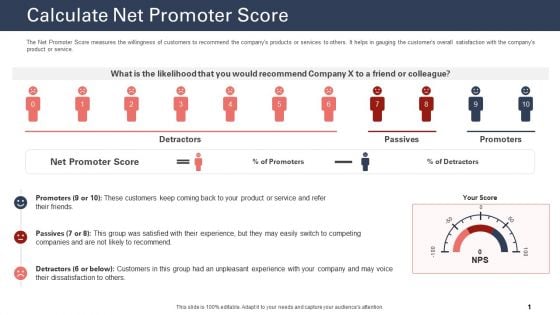
Techniques To Increase Customer Satisfaction Calculate Net Promoter Score Diagrams PDF
The Net Promoter Score measures the willingness of customers to recommend the companys products or services to others. It helps in gauging the customers overall satisfaction with the companys product or service. Deliver an awe inspiring pitch with this creative techniques to increase customer satisfaction calculate net promoter score diagrams pdf bundle. Topics like calculate net promoter score, product or service, net promoter score can be discussed with this completely editable template. It is available for immediate download depending on the needs and requirements of the user.
Calculation Of IBN Outsourcing Company Customer Attrition Rate In 2021 Ppt Slides Icons PDF
This slide shows current Customer Attrition Rate of IBN Outsourcing Company. Additionally, this slide provides information on number of Customers at End of Period and Customers at Start of Period along with the formula for calculation of CAR Customer Attrition Rate using these variables.Deliver and pitch your topic in the best possible manner with this calculation of ibn outsourcing company customer attrition rate in 2021 ppt slides icons pdf. Use them to share invaluable insights on customer attrition rate, customers at beginning of the period and impress your audience. This template can be altered and modified as per your expectations. So, grab it now.
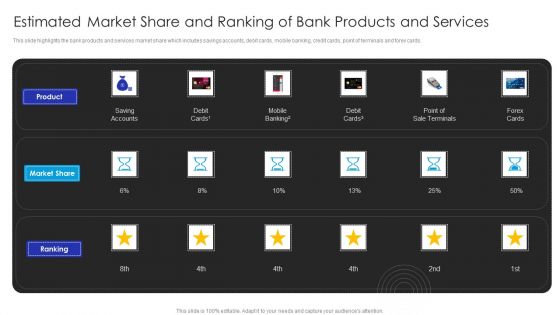
Operational Innovation In Banking Estimated Market Share And Ranking Of Bank Products Diagrams PDF
This slide highlights the bank products and services market share which includes savings accounts, debit cards, mobile banking, credit cards, point of terminals and forex cards. Slidegeeks is here to make your presentations a breeze with Operational Innovation In Banking Estimated Market Share And Ranking Of Bank Products Diagrams PDF With our easy-to-use and customizable templates, you can focus on delivering your ideas rather than worrying about formatting. With a variety of designs to choose from, youre sure to find one that suits your needs. And with animations and unique photos, illustrations, and fonts, you can make your presentation pop. So whether youre giving a sales pitch or presenting to the board, make sure to check out Slidegeeks first.
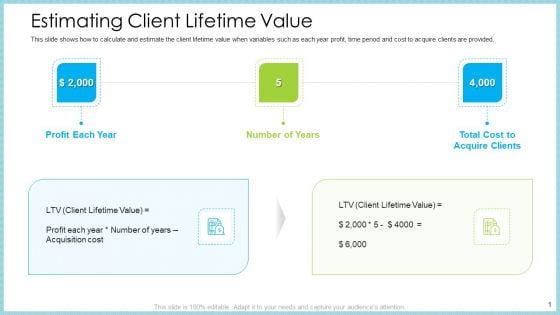
Customer Acquiring Price For Retaining New Clients Estimating Client Lifetime Value Diagrams PDF
This slide shows how to calculate and estimate the client lifetime value when variables such as each year profit, time period and cost to acquire clients are provided. This is a customer acquiring price for retaining new clients estimating client lifetime value diagrams pdf template with various stages. Focus and dispense information on three stages using this creative set, that comes with editable features. It contains large content boxes to add your information on topics like estimating client lifetime value. You can also showcase facts, figures, and other relevant content using this PPT layout. Grab it now.
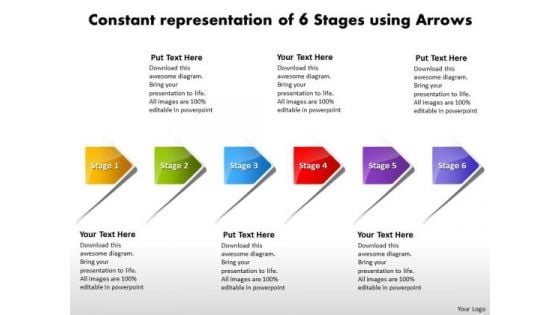
Constant Representation Of 6 Stages Using Arrows Vision Flowchart Templates PowerPoint Slides
We present our constant representation of 6 stages using arrows vision flowchart templates PowerPoint Slides.Use our Business PowerPoint Templates because,A lot of dissimilar elements needing to gel to strike the deal. Use our Arrows PowerPoint Templates because,This diagram provides multiple options for taking in and making sense of information. Use our Shapes PowerPoint Templates because, You have it all down to a nicety, slice by slice, layer by layer. Use our Marketing PowerPoint Templates because,they will help you to organise the logic of your views. Use our Success PowerPoint Templates because, You have some exciting plans to spread goodwill among the underprivileged, Expound on your ideas and show to your colleagues how they can help others and in the process increase your Brand value.Use these PowerPoint slides for presentations relating to business, chart, clipart, commerce, concept, corporate, design, diagram, goals, guidelines, hierarchy, icon, idea, management, market, marketing, mission, organization, performance, plans, price, process, product, project, promotion, representation, sales, strategy, success, target. The prominent colors used in the PowerPoint template are Yellow, Green, Blue. People tell us our constant representation of 6 stages using arrows vision flowchart templates PowerPoint Slides are Fancy. The feedback we get is that our corporate PowerPoint templates and PPT Slides are Endearing. People tell us our constant representation of 6 stages using arrows vision flowchart templates PowerPoint Slides are Exuberant. Presenters tell us our design PowerPoint templates and PPT Slides are Energetic. The feedback we get is that our constant representation of 6 stages using arrows vision flowchart templates PowerPoint Slides are Royal. Professionals tell us our corporate PowerPoint templates and PPT Slides are Radiant. Modify plans with our Constant Representation Of 6 Stages Using Arrows Vision Flowchart Templates PowerPoint Slides. Download without worries with our money back guaranteee.

In Business PowerPoint Templates Free Download Process Radial Diagram Slides
We present our in business powerpoint templates free download process Radial Diagram Slides.Present our Arrows PowerPoint Templates because you are the star of your enlightened team. Download our Business PowerPoint Templates because the majestic tiger lord of all it surveys.It exudes power even when it is in repose. Use our Signs PowerPoint Templates because It will mark the footprints of your journey. Illustrate how they will lead you to your desired destination. Use our Shapes PowerPoint Templates because it illustrates the symbols of human growth. Download and present our Spheres PowerPoint Templates because you can Show them how you can save the day.Use these PowerPoint slides for presentations relating to Arrows, Business, Chart, Circular, Commerce, Concept, Contribution, Cycle, Development, Diagram, Global, Idea, Informative, Internet, Join, Making, Manage, Management, Market, Marketing, Partner, Paying, Performance, Plans, Process, Productive, Productivity, Profit, Profitable, Project. The prominent colors used in the PowerPoint template are Yellow, Black, Gray. Professionals tell us our in business powerpoint templates free download process Radial Diagram Slides are Magnificent. You can be sure our Development PowerPoint templates and PPT Slides are Ritzy. Customers tell us our in business powerpoint templates free download process Radial Diagram Slides are Majestic. Professionals tell us our Contribution PowerPoint templates and PPT Slides are Dynamic. People tell us our in business powerpoint templates free download process Radial Diagram Slides are Tasteful. People tell us our Circular PowerPoint templates and PPT Slides are Magnificent. Illustrate goals with our In Business PowerPoint Templates Free Download Process Radial Diagram Slides. Download without worries with our money back guaranteee.
Sustainability Calculation With KPI Cash Flow Dashboard Cash Designs PDF Rules PDF
Deliver an awe inspiring pitch with this creative sustainability calculation with kpi customer satisfaction dashboard target professional pdf bundle. Topics like customer satisfaction dashboard can be discussed with this completely editable template. It is available for immediate download depending on the needs and requirements of the user.
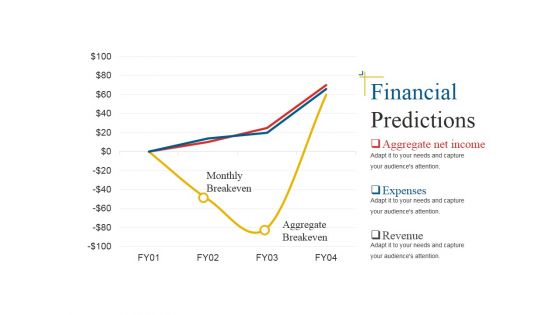
Financial Predictions Template 1 Ppt PowerPoint Presentation Summary Deck
This is a financial predictions template 1 ppt powerpoint presentation summary deck. This is a three stage process. The stages in this process are monthly breakeven, aggregate breakeven.
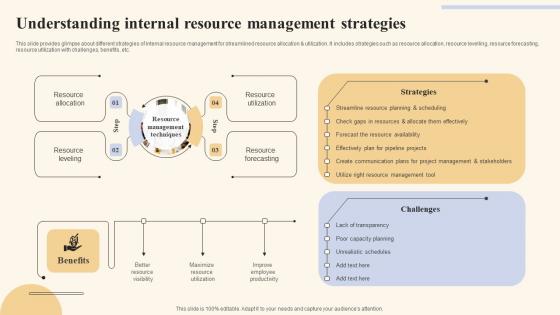
Understanding Internal Resource Holistic Marketing Strategies To Optimize Background Pdf
This slide provides glimpse about different strategies of internal resource management for streamlined resource allocation and utilization. It includes strategies such as resource allocation, resource levelling, resource forecasting, resource utilization with challenges, benefits, etc. Create an editable Understanding Internal Resource Holistic Marketing Strategies To Optimize Background Pdf that communicates your idea and engages your audience. Whether you are presenting a business or an educational presentation, pre designed presentation templates help save time. Understanding Internal Resource Holistic Marketing Strategies To Optimize Background Pdf is highly customizable and very easy to edit, covering many different styles from creative to business presentations. Slidegeeks has creative team members who have crafted amazing templates. So, go and get them without any delay. This slide provides glimpse about different strategies of internal resource management for streamlined resource allocation and utilization. It includes strategies such as resource allocation, resource levelling, resource forecasting, resource utilization with challenges, benefits, etc.
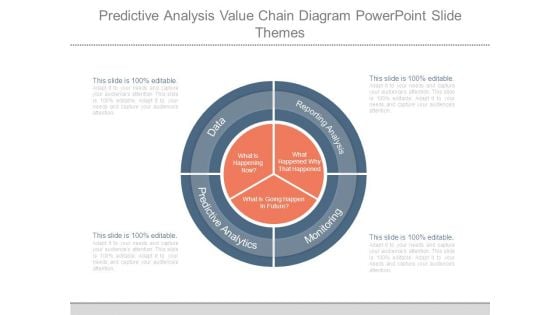
Predictive Analysis Value Chain Diagram Powerpoint Slide Themes
This is a predictive analysis value chain diagram powerpoint slide themes. This is a four stage process. The stages in this process are what is happening now, what is going happen in future, what happened why that happened, data, predictive analytics, reporting analysis, monitoring.
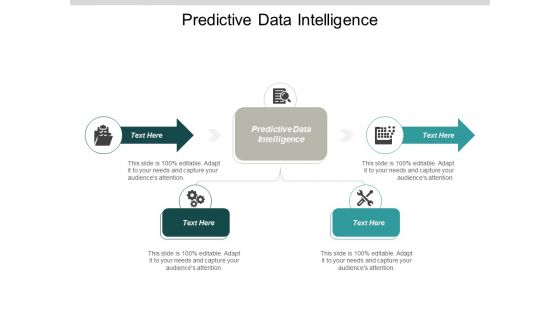
Predictive Data Intelligence Ppt PowerPoint Presentation Inspiration Slide Cpb
Presenting this set of slides with name predictive data intelligence ppt powerpoint presentation inspiration slide cpb. The topics discussed in these slides are predictive data intelligence. This is a completely editable PowerPoint presentation and is available for immediate download. Download now and impress your audience.
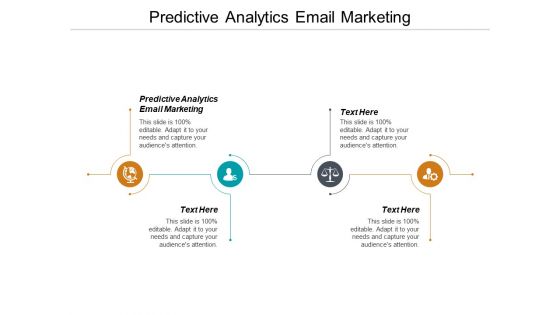
Predictive Analytics Email Marketing Ppt PowerPoint Presentation Pictures Structure Cpb
Presenting this set of slides with name predictive analytics email marketing ppt powerpoint presentation pictures structure cpb. This is a four stage process. The stages in this process are predictive analytics email marketing. This is a completely editable PowerPoint presentation and is available for immediate download. Download now and impress your audience.

Predictive Statistical Models Ppt PowerPoint Presentation File Background Image Cpb
Presenting this set of slides with name predictive statistical models ppt powerpoint presentation file background image cpb. This is a three stage process. The stages in this process are predictive statistical models. This is a completely editable PowerPoint presentation and is available for immediate download. Download now and impress your audience.

Two Paths Diverge Prediction Reality Ppt PowerPoint Presentation Complete Deck
Presenting this set of slides with name two paths diverge prediction reality ppt powerpoint presentation complete deck. The topics discussed in these slides are prediction, reality, evaluation, roads, two crossroads diverging. This is a completely editable PowerPoint presentation and is available for immediate download. Download now and impress your audience.
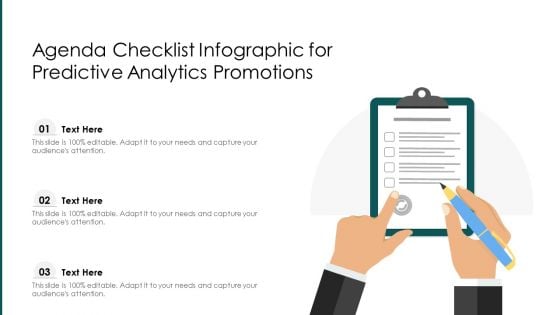
Agenda Checklist Infographic For Predictive Analytics Promotions Infographics PDF
Presenting agenda checklist infographic for predictive analytics promotions infographics pdf to dispense important information. This template comprises three stages. It also presents valuable insights into the topics including agenda checklist infographic for predictive analytics promotions. This is a completely customizable PowerPoint theme that can be put to use immediately. So, download it and address the topic impactfully.
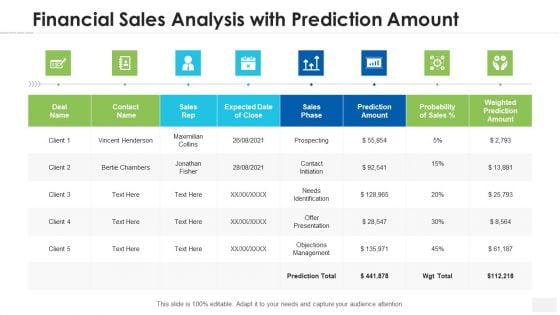
Financial Sales Analysis With Prediction Amount Pictures PDF
Pitch your topic with ease and precision using this financial sales analysis with prediction amount pictures pdf. This layout presents information on financial sales analysis with prediction amount. It is also available for immediate download and adjustment. So, changes can be made in the color, design, graphics or any other component to create a unique layout.
Icon Depicting Sales Prediction Through Financial Report Background PDF
Showcasing this set of slides titled icon depicting sales prediction through financial report background pdf. The topics addressed in these templates are icon depicting sales prediction through financial report. All the content presented in this PPT design is completely editable. Download it and make adjustments in color, background, font etc. as per your unique business setting.
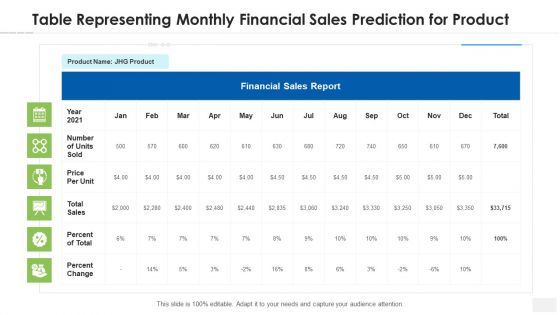
Table Representing Monthly Financial Sales Prediction For Product Pictures PDF
Showcasing this set of slides titled table representing monthly financial sales prediction for product pictures pdf. The topics addressed in these templates are table representing monthly financial sales prediction for product. All the content presented in this PPT design is completely editable. Download it and make adjustments in color, background, font etc. as per your unique business setting.
Business Demand Predictive Dashboard Icon Ppt Summary Graphics Pictures PDF
Presenting business demand predictive dashboard icon ppt summary graphics pictures pdf to dispense important information. This template comprises one stages. It also presents valuable insights into the topics including business demand predictive dashboard icon. This is a completely customizable PowerPoint theme that can be put to use immediately. So, download it and address the topic impactfully.
Business Sales Predictive Report Icon Ppt Ideas Portrait PDF
Presenting business sales predictive report icon ppt ideas portrait pdf to dispense important information. This template comprises one stages. It also presents valuable insights into the topics including business sales predictive report icon. This is a completely customizable PowerPoint theme that can be put to use immediately. So, download it and address the topic impactfully.
Predictive Analysis With Growth Business Trend Icon Portrait PDF
Presenting Predictive Analysis With Growth Business Trend Icon Portrait PDF to dispense important information. This template comprises Four stages. It also presents valuable insights into the topics including Predictive Analysis, Growth Business, Trend Icon This is a completely customizable PowerPoint theme that can be put to use immediately. So, download it and address the topic impactfully.
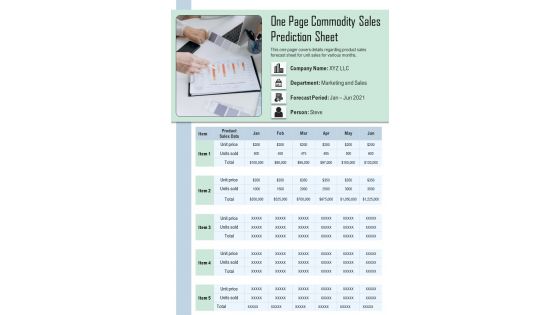
One Page Commodity Sales Prediction Sheet PDF Document PPT Template
Heres a predesigned One Page Commodity Sales Prediction Sheet PDF Document PPT Template for you. Built on extensive research and analysis, this one-pager template has all the centerpieces of your specific requirements. This temple exudes brilliance and professionalism. Being completely editable, you can make changes to suit your purpose. Get this One Page Commodity Sales Prediction Sheet PDF Document PPT Template Download now.
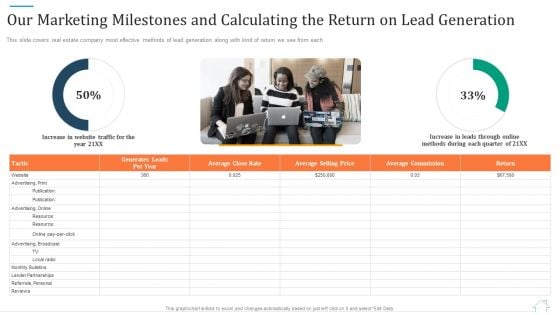
Our Marketing Milestones And Calculating The Return On Lead Generation Professional PDF
This slide covers real estate company most effective methods of lead generation along with kind of return we see from each. Deliver an awe inspiring pitch with this creative our marketing milestones and calculating the return on lead generation professional pdf bundle. Topics like average, price, rate, methods can be discussed with this completely editable template. It is available for immediate download depending on the needs and requirements of the user.
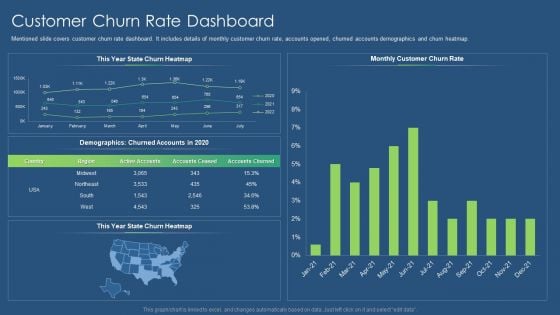
Sustainability Calculation With KPI Customer Churn Rate Dashboard Mockup PDF Mockup PDF
Mentioned slide covers cash flow dashboard. It shows detailed cash flow status in a 12 months format and working capital with accounts receivable and payable details. Deliver and pitch your topic in the best possible manner with this sustainability calculation with kpi cash flow dashboard liquidity ratio inspiration pdf. Use them to share invaluable insights on cash flow dashboard and impress your audience. This template can be altered and modified as per your expectations. So, grab it now.
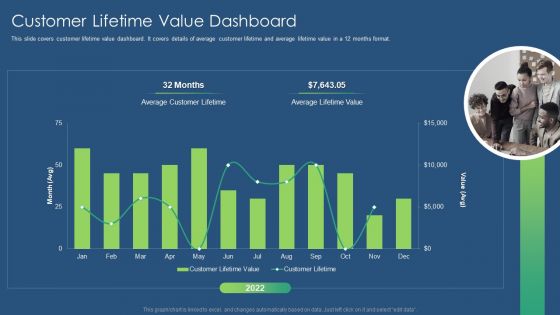
Sustainability Calculation With KPI Customer Lifetime Value Dashboard Formats PDF Professional PDF
Mentioned slide covers customer churn rate dashboard. It includes details of monthly customer churn rate, accounts opened, churned accounts demographics and churn heatmap. Deliver an awe inspiring pitch with this creative sustainability calculation with kpi customer churn rate dashboard mockup pdf bundle. Topics like customer churn rate dashboard can be discussed with this completely editable template. It is available for immediate download depending on the needs and requirements of the user.
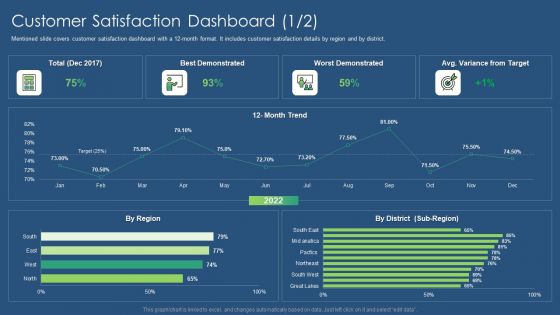
Sustainability Calculation With KPI Customer Satisfaction Dashboard Target Professional PDF Structure PDF
This slide covers customer lifetime value dashboard. It covers details of average customer lifetime and average lifetime value in a 12 months format. Deliver and pitch your topic in the best possible manner with this sustainability calculation with kpi customer lifetime value dashboard formats pdf. Use them to share invaluable insights on customer lifetime value dashboard and impress your audience. This template can be altered and modified as per your expectations. So, grab it now.
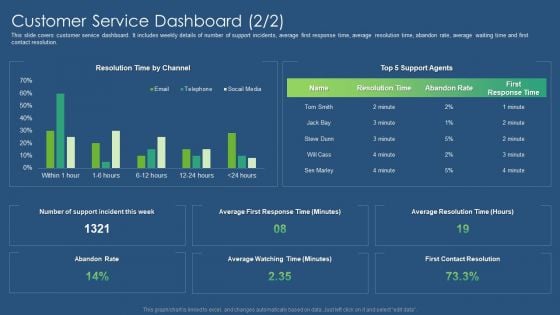
Sustainability Calculation With KPI Customer Service Dashboard Microsoft PDF Slides PDF
This slide covers customer service dashboard. It includes weekly details of number of support incidents, average first response time, average resolution time, abandon rate, average waiting time and first contact resolution. Deliver an awe inspiring pitch with this creative sustainability calculation with kpi customer service dashboard revenue ideas pdf bundle. Topics like customer service dashboard can be discussed with this completely editable template. It is available for immediate download depending on the needs and requirements of the user.
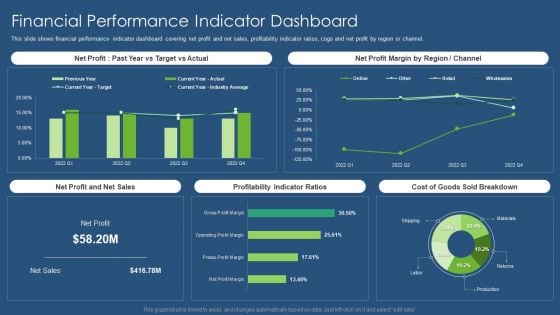
Sustainability Calculation With KPI Financial Performance Indicator Dashboard Infographics PDF Template PDF
This slide shows financial performance indicator dashboard covering net profit and net sales, profitability indicator ratios, cogs and net profit by region or channel. Deliver an awe inspiring pitch with this creative sustainability calculation with kpi financial performance indicator dashboard infographics pdf bundle. Topics like net profit margin, net profit and net sales, profitability indicator ratios, sold breakdown can be discussed with this completely editable template. It is available for immediate download depending on the needs and requirements of the user.
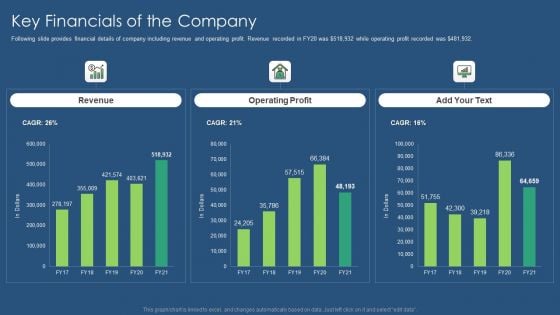
Sustainability Calculation With KPI Key Financials Of The Company Structure PDF Themes PDF
Following slide provides financial details of company including revenue and operating profit. Revenue recorded in FY20 was dollor518,932 while operating profit recorded was dollor481,932. Deliver and pitch your topic in the best possible manner with this sustainability calculation with kpi key financials of the company structure pdf. Use them to share invaluable insights on revenue, operating profit and impress your audience. This template can be altered and modified as per your expectations. So, grab it now.
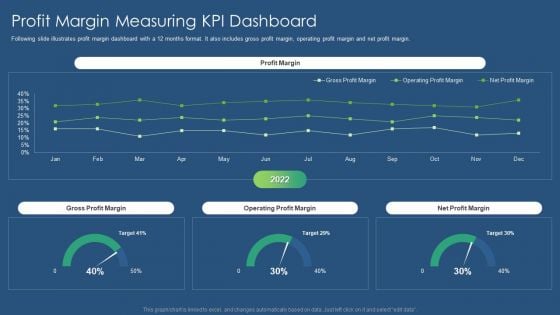
Sustainability Calculation With KPI Profit Margin Measuring Kpi Dashboard Inspiration PDF Topics PDF
Following slide illustrates profit margin dashboard with a 12 months format. It also includes gross profit margin, operating profit margin and net profit margin. Deliver and pitch your topic in the best possible manner with this sustainability calculation with kpi profit margin measuring kpi dashboard inspiration pdf. Use them to share invaluable insights on net profit margin, operating profit margin, gross profit margin and impress your audience. This template can be altered and modified as per your expectations. So, grab it now.
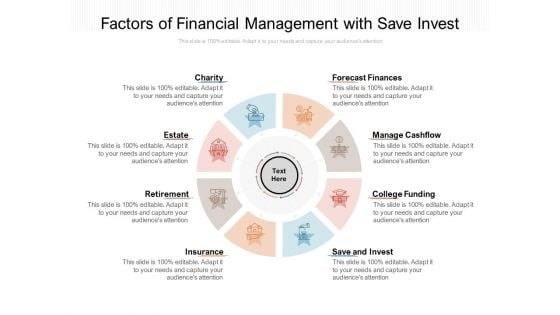
Factors Of Financial Management With Save Invest Ppt PowerPoint Presentation Outline Graphics Download
Presenting this set of slides with name factors of financial management with save invest ppt powerpoint presentation outline graphics download. This is a eight stage process. The stages in this process are charity, estate, retirement, insurance, save and invest, college funding, manage cashflow, forecast finances. This is a completely editable PowerPoint presentation and is available for immediate download. Download now and impress your audience.
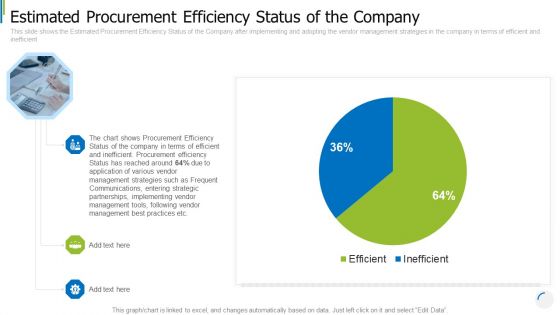
Estimated Procurement Efficiency Status Of The Company Download PDF
This slide shows the Estimated Procurement Efficiency Status of the Company after implementing and adopting the vendor management strategies in the company in terms of efficient and inefficient. Deliver an awe inspiring pitch with this creative estimated procurement efficiency status of the company download pdf bundle. Topics like estimated procurement efficiency status of the company can be discussed with this completely editable template. It is available for immediate download depending on the needs and requirements of the user.
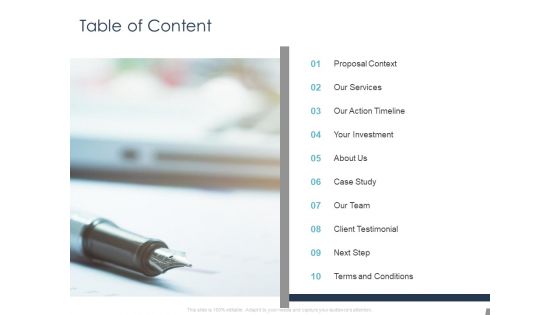
Job Estimate Table Of Content Ppt Layouts Model PDF
Presenting this set of slides with name job estimate table of content ppt layouts model pdf. This is a ten stage process. The stages in this process are our services, investment, our team, client testimonial, our action timeline. This is a completely editable PowerPoint presentation and is available for immediate download. Download now and impress your audience.
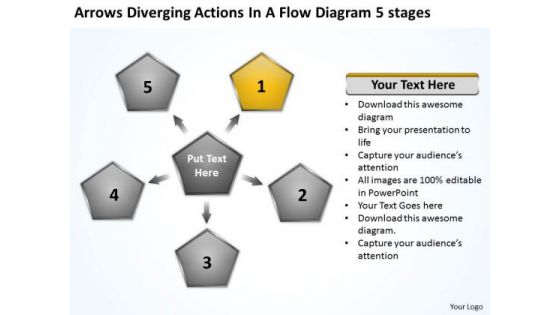
Actions In Flow Diagram 5 Stages Business Circular Layout Network PowerPoint Templates
We present our actions in flow diagram 5 stages business Circular Layout Network PowerPoint templates.Use our Ring Charts PowerPoint Templates because they are Designed to attract the attention of your audience. Download our Business PowerPoint Templates because the fruits of your labour are beginning to show.Enlighten them on the great plans you have for their enjoyment. Present our Future PowerPoint Templates because let this slide illustrates others piggyback on you to see well over the horizon. Present our Process and Flows PowerPoint Templates because with the help of our Slides you can Illustrate your plans to your listeners with the same accuracy. Use our Marketing PowerPoint Templates because The marketplace is the merger of your dreams and your ability. Use these PowerPoint slides for presentations relating to Abstract, action, analysis, blank,business, chart, clipart, commerce,concept, conceptual, design, diagram,direction, flow, generic, goals, guide,guidelines, heirarchy, icon, idea,illustration, lingakes, links, manage,management, mba, model, organization,performance, plan, process, project,representation, resource,steps, strategy, success. The prominent colors used in the PowerPoint template are Black, Yellow, Gray. You can be sure our actions in flow diagram 5 stages business Circular Layout Network PowerPoint templates are effectively colour coded to prioritise your plans They automatically highlight the sequence of events you desire. Professionals tell us our analysis PowerPoint templates and PPT Slides are Versatile. PowerPoint presentation experts tell us our actions in flow diagram 5 stages business Circular Layout Network PowerPoint templates help you meet deadlines which are an element of today's workplace. Just browse and pick the slides that appeal to your intuitive senses. You can be sure our clipart PowerPoint templates and PPT Slides are Magnificent. You can be sure our actions in flow diagram 5 stages business Circular Layout Network PowerPoint templates are Nostalgic. The feedback we get is that our analysis PowerPoint templates and PPT Slides are Magical. Earn a fortune with our Actions In Flow Diagram 5 Stages Business Circular Layout Network PowerPoint Templates. Dont waste time struggling with PowerPoint. Let us do it for you.
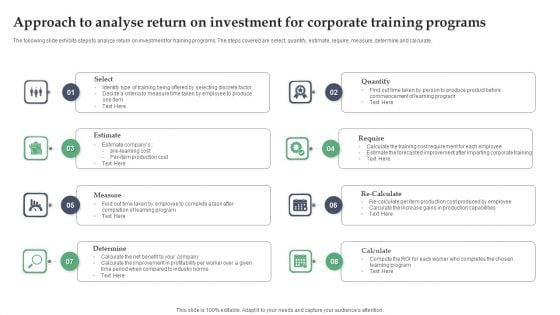
Approach To Analyse Return On Investment For Corporate Training Programs Ppt Slides Gallery PDF
The following slide exhibits steps to analyze return on investment for training programs. The steps covered are select, quantify, estimate, require, measure, determine and calculate. Presenting Approach To Analyse Return On Investment For Corporate Training Programs Ppt Slides Gallery PDF to dispense important information. This template comprises eight stages. It also presents valuable insights into the topics including Estimate, Measure, Determine, Calculate, Require. This is a completely customizable PowerPoint theme that can be put to use immediately. So, download it and address the topic impactfully.
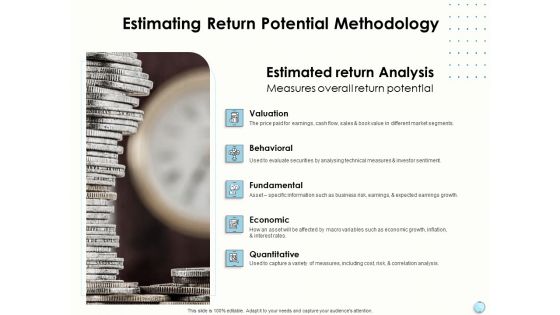
Fiscal Management Estimating Return Potential Methodology Ppt Styles Graphics PDF
Presenting fiscal management estimating return potential methodology ppt styles graphics pdf to provide visual cues and insights. Share and navigate important information on five stages that need your due attention. This template can be used to pitch topics like valuation, behavioral, fundamental, economic, quantitative. In addtion, this PPT design contains high resolution images, graphics, etc, that are easily editable and available for immediate download.
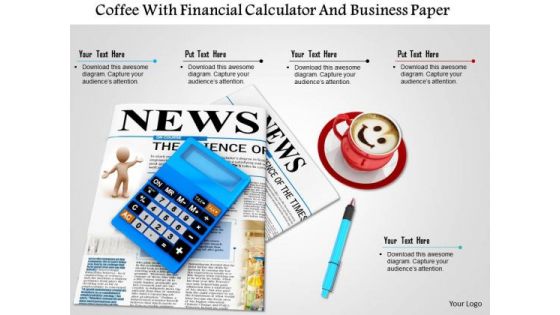
Stock Photo Coffee With Financial Calculator And Business Paper PowerPoint Slide
This image slide is designed with graphic of financial calculator with coffee cup and news paper. This image explains the concept of workplace and coffee break with its suitable graphics. Use this image to make business presentations.
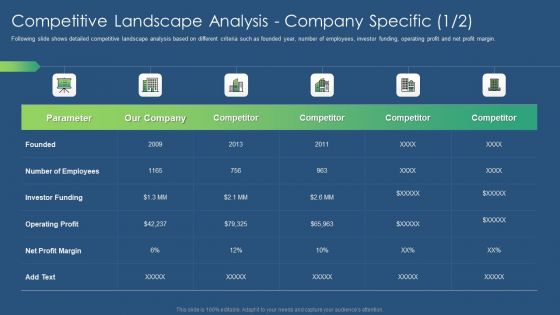
Sustainability Calculation With KPI Competitive Landscape Analysis Ppt PowerPoint Presentation Gallery Example Introduction PDF
Following slide shows detailed competitive landscape analysis based on different criteria such as founded year, number of employees, investor funding, operating profit and net profit margin. Deliver an awe inspiring pitch with this creative sustainability calculation with kpi competitive landscape analysis ppt powerpoint presentation gallery example introduction pdf bundle. Topics like operating profit, net profit margin, investor funding can be discussed with this completely editable template. It is available for immediate download depending on the needs and requirements of the user.

Procedure Land Estimation Examination Real Estate Valuation In Different Approaches Elements PDF
This slide shows the real estate calculated values in different approach such as income-market methodology, DRC approach, Income-contract method, etc. Deliver and pitch your topic in the best possible manner with this procedure land estimation examination real estate valuation in different approaches elements pdf. Use them to share invaluable insights on methodology, property value, valuation and impress your audience. This template can be altered and modified as per your expectations. So, grab it now.
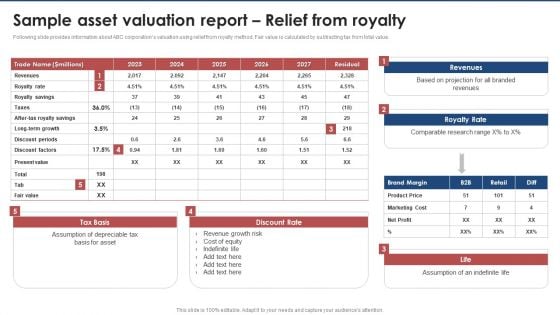
Sample Asset Valuation Report Relief From Royalty Brand Value Estimation Guide Background PDF
Following slide provides information about ABC corporations valuation using relief from royalty method. Fair value is calculated by subtracting tax from total value.There are so many reasons you need a Sample Asset Valuation Report Relief From Royalty Brand Value Estimation Guide Background PDF. The first reason is you can not spend time making everything from scratch, Thus, Slidegeeks has made presentation templates for you too. You can easily download these templates from our website easily.
Calculate Net Promoter Score Steps To Improve Customer Engagement For Business Development Icons PDF
The Net Promoter Score measures the willingness of customers to recommend the companys products or services to others. It helps in gauging the customers overall satisfaction with the companys product or service.Deliver an aweinspiring pitch with this creative calculate net promoter score steps to improve customer engagement for business development icons pdf bundle. Topics like detractors, passives, promoters, net promoter score can be discussed with this completely editable template. It is available for immediate download depending on the needs and requirements of the user.
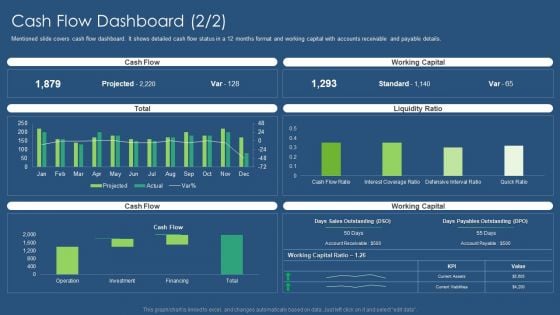
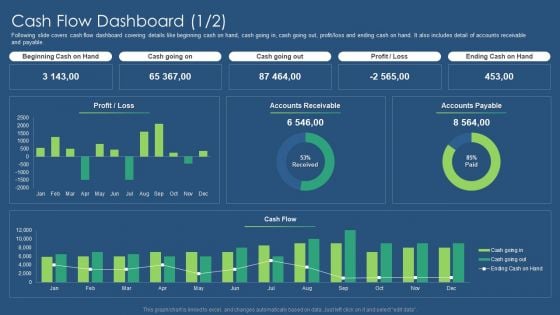
Sustainability Calculation With KPI Cash Flow Dashboard Liquidity Ratio Inspiration PDF Introduction PDF
Following slide covers cash flow dashboard covering details like beginning cash on hand, cash going in, cash going out, profit loss and ending cash on hand. It also includes detail of accounts receivable and payable. Deliver an awe inspiring pitch with this creative sustainability calculation with kpi cash flow dashboard cash designs pdf bundle. Topics like beginning cash on hand, cash going out, profit and loss, ending cash on hand can be discussed with this completely editable template. It is available for immediate download depending on the needs and requirements of the user.
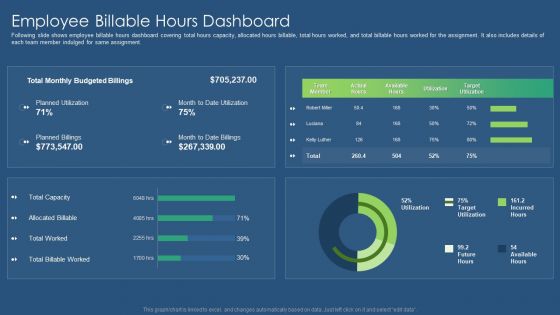
Sustainability Calculation With KPI Employee Billable Hours Dashboard Demonstration PDF Portrait PDF
Following slide shows employee billable hours dashboard covering total hours capacity, allocated hours billable, total hours worked, and total billable hours worked for the assignment. It also includes details of each team member indulged for same assignment. Deliver an awe inspiring pitch with this creative sustainability calculation with kpi employee billable hours dashboard demonstration pdf bundle. Topics like employee billable hours dashboard can be discussed with this completely editable template. It is available for immediate download depending on the needs and requirements of the user.
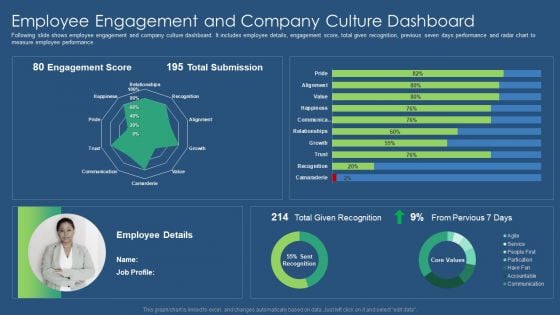
Sustainability Calculation With KPI Employee Engagement And Company Culture Sample PDF Topics PDF
Following slide shows employee engagement and company culture dashboard. It includes employee details, engagement score, total given recognition, previous seven days performance and radar chart to measure employee performance. Deliver and pitch your topic in the best possible manner with this sustainability calculation with kpi employee engagement and company culture sample pdf. Use them to share invaluable insights on employee engagement and company culture dashboard and impress your audience. This template can be altered and modified as per your expectations. So, grab it now.
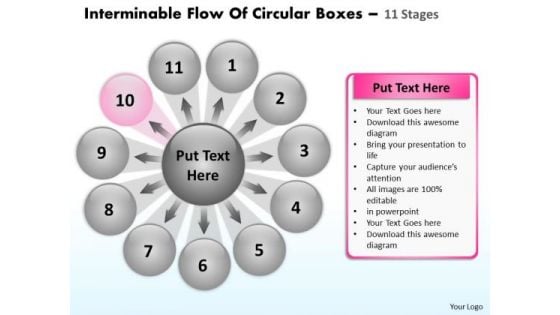
Interminable Flow Of Circular Boxes 11 Stages Ppt Process Diagram PowerPoint Slides
We present our interminable flow of circular boxes 11 stages ppt Process Diagram PowerPoint Slides.Use our Arrows PowerPoint Templates because you have the ideas to develop the teams vision of where they need to be in the future. Download and present our Business PowerPoint Templates because the great Bald headed Eagle embodies your personality. the eagle eye to seize upon the smallest of opportunities. Present our Signs PowerPoint Templates because the structure of our templates allows you to effectively highlight the key issues concerning the growth of your business. Present our Shapes PowerPoint Templates because the plans are in your head, stage by stage, year by year. Use our Spheres PowerPoint Templates because there are a bucketful of brilliant ideas swirling around within your group.Use these PowerPoint slides for presentations relating to Arrows, Business, Chart, Circular, Commerce, Concept, Contribution, Cycle, Development, Diagram, Global, Idea, Informative, Internet, Join, Making, Manage, Management, Market, Marketing, Partner, Paying, Performance, Plans, Process, Productive, Productivity, Profit, Profitable, Project. The prominent colors used in the PowerPoint template are Pink, Black, Gray. Professionals tell us our interminable flow of circular boxes 11 stages ppt Process Diagram PowerPoint Slides are Vintage. You can be sure our Commerce PowerPoint templates and PPT Slides are Nifty. Customers tell us our interminable flow of circular boxes 11 stages ppt Process Diagram PowerPoint Slides are Playful. Professionals tell us our Cycle PowerPoint templates and PPT Slides are the best it can get when it comes to presenting. People tell us our interminable flow of circular boxes 11 stages ppt Process Diagram PowerPoint Slides are Fashionable. People tell us our Development PowerPoint templates and PPT Slides are Dazzling. Bask in the attention our Interminable Flow Of Circular Boxes 11 Stages Ppt Process Diagram PowerPoint Slides attract. Their excellence will rub off on you.
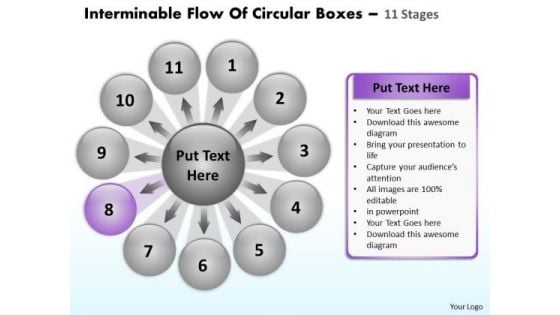
Interminable Flow Of Circular Boxes 11 Stages Venn Process PowerPoint Templates
We present our interminable flow of circular boxes 11 stages Venn Process PowerPoint templates.Download our Arrows PowerPoint Templates because the gears of youthful minds are useful, therefore set them in motion. Download and present our Business PowerPoint Templates because watch the excitement levels rise as they realise their worth. Use our Signs PowerPoint Templates because the vision of being the market leader is clear to you. Download and present our Shapes PowerPoint Templates because it shows to your group how they mesh together to drive the whole. Download and present our Spheres PowerPoint Templates because you can outline your targets to your team.Use these PowerPoint slides for presentations relating to Arrows, Business, Chart, Circular, Commerce, Concept, Contribution, Cycle, Development, Diagram, Global, Idea, Informative, Internet, Join, Making, Manage, Management, Market, Marketing, Partner, Paying, Performance, Plans, Process, Productive, Productivity, Profit, Profitable, Project. The prominent colors used in the PowerPoint template are Purple, Black, Gray. Professionals tell us our interminable flow of circular boxes 11 stages Venn Process PowerPoint templates are Charming. You can be sure our Concept PowerPoint templates and PPT Slides are Charming. Customers tell us our interminable flow of circular boxes 11 stages Venn Process PowerPoint templates are Luxuriant. Professionals tell us our Cycle PowerPoint templates and PPT Slides are Elegant. People tell us our interminable flow of circular boxes 11 stages Venn Process PowerPoint templates are Efficient. People tell us our Commerce PowerPoint templates and PPT Slides are Stunning. Claim your prize with our Interminable Flow Of Circular Boxes 11 Stages Venn Process PowerPoint Templates. You will come out on top.
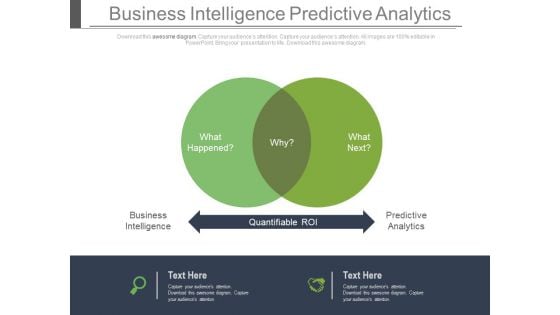
Venn Diagram For Business Intelligence And Predictive Analysis Powerpoint Slides
This power point template has been designed with two steps Venn diagram. Use this Venn diagram for business intelligence and predictive analysis. Illustrate your ideas and imprint them in the minds of your team with this template.
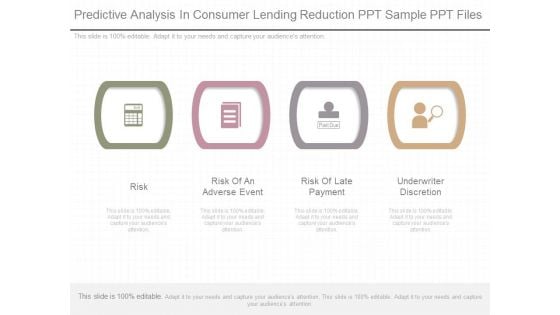
Predictive Analysis In Consumer Lending Reduction Ppt Sample Ppt Files
This is a predictive analysis in consumer lending reduction ppt sample ppt files. This is a four stage process. The stages in this process are risk, risk of an adverse event, risk of late payment, underwriter discretion.
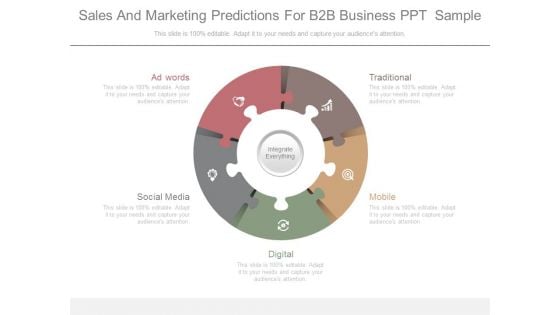
Sales And Marketing Predictions For B2b Business Ppt Sample
This is a sales and marketing predictions for b2b business ppt sample. This is a five stage process. The stages in this process are ad words, traditional, mobile, digital, social media, integrate everything.
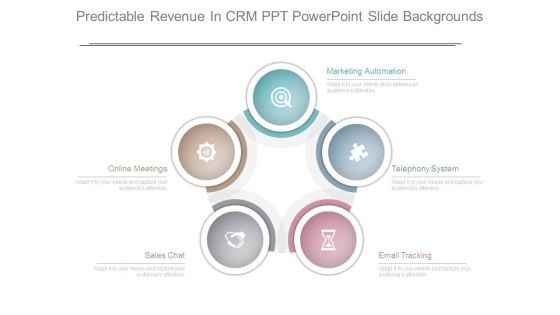
Predictable Revenue In Crm Ppt Powerpoint Slide Backgrounds
This is a predictable revenue in crm ppt powerpoint slide backgrounds. This is a five stage process. The stages in this process are marketing automation, telephony system, email tracking, sales chat, online meetings.
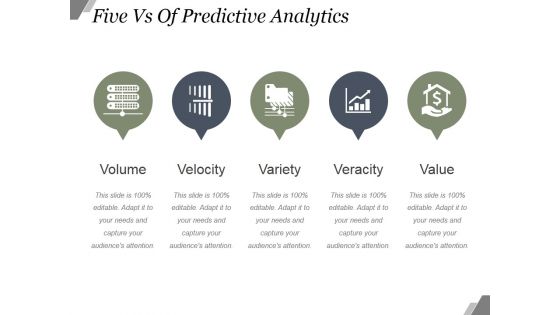
Five Vs Of Predictive Analytics Ppt PowerPoint Presentation Images
This is a five vs of predictive analytics ppt powerpoint presentation images. This is a five stage process. The stages in this process are volume, velocity, variety, veracity, value.
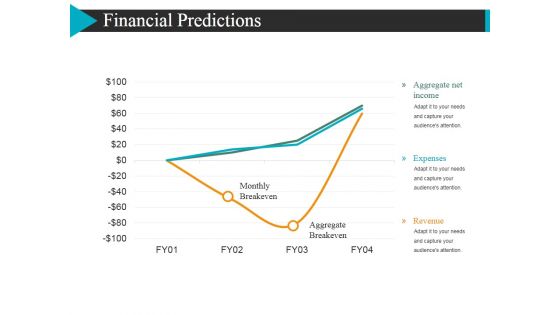
Financial Predictions Template 1 Ppt Powerpoint Presentation Portfolio Example Introduction
This is a financial predictions template 1 ppt powerpoint presentation portfolio example introduction. This is a three stage process. The stages in this process are monthly break even, aggregate net income, expenses.
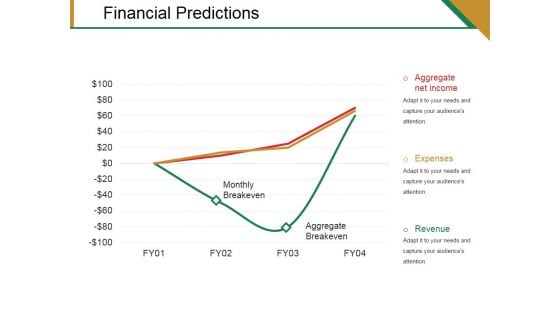
Financial Predictions Template 2 Ppt PowerPoint Presentation Templates
This is a financial predictions template 2 ppt powerpoint presentation templates. This is a three stage process. The stages in this process are monthly breakeven, aggregate breakeven, aggregate net income, expenses, revenue.
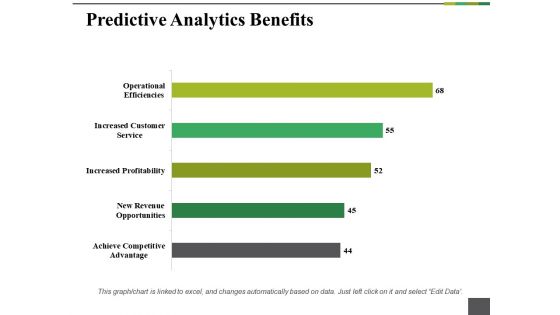
Predictive Analytics Benefits Ppt PowerPoint Presentation Outline File Formats
This is a predictive analytics benefits ppt powerpoint presentation outline file formats. This is a five stage process. The stages in this process are operational efficiency, increased customer service, increase profitability, new revenue opportunities.
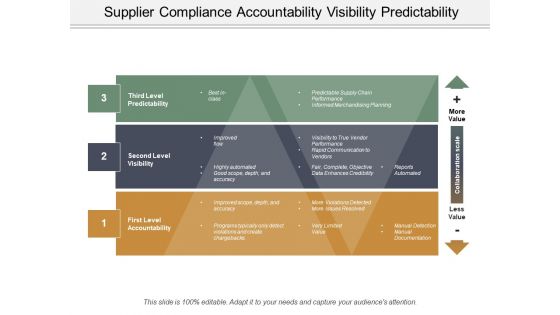
Supplier Compliance Accountability Visibility Predictability Ppt PowerPoint Presentation File Shapes
This is a supplier compliance accountability visibility predictability ppt powerpoint presentation file shapes. This is a three stage process. The stages in this process are vendor management, vendor compliance, supply chain failures.
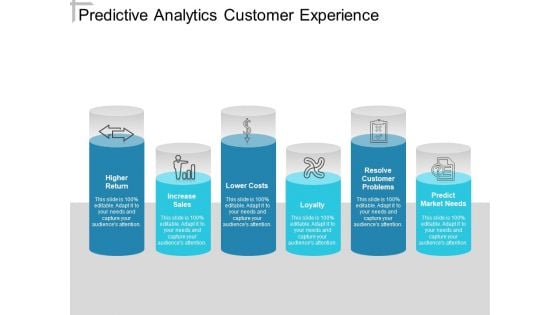
Predictive Analytics Customer Experience Ppt PowerPoint Presentation Professional Sample
This is a predictive analytics customer experience ppt powerpoint presentation professional sample. This is a six stage process. The stages in this process are customer experience, customer insight, consumer insight.
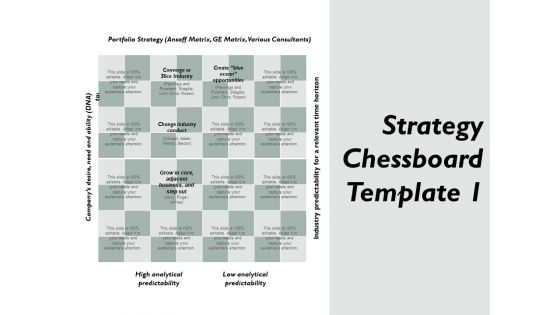
Strategy Chessboard Low Analytical Predictability Ppt PowerPoint Presentation File Themes
This is a strategy chessboard low analytical predictability ppt powerpoint presentation file themes. This is a four stage process. The stages in this process are marketing, business, management, strategy, analysis.


 Continue with Email

 Home
Home


