Project Chart
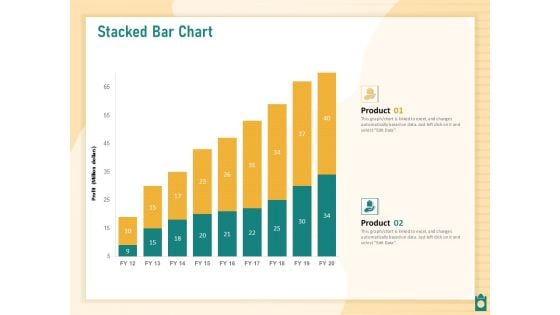
Meet Project Deadlines Through Priority Matrix Stacked Bar Chart Ppt Styles Picture PDF
Presenting this set of slides with name meet project deadlines through priority matrix stacked bar chart ppt styles picture pdf. The topics discussed in these slide is stacked bar chart. This is a completely editable PowerPoint presentation and is available for immediate download. Download now and impress your audience.
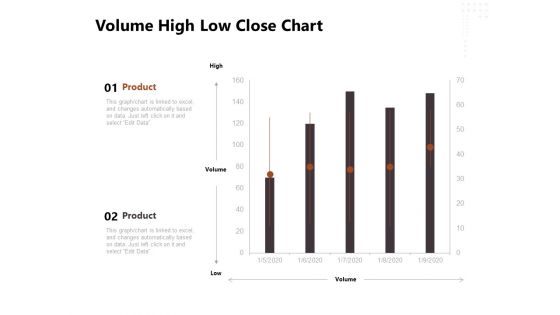
Project Management Timeline Volume High Low Close Chart Ppt Gallery Outfit PDF
Presenting this set of slides with name project management timeline volume high low close chart ppt gallery outfit pdf. The topics discussed in these slide is volume high low close chart. This is a completely editable PowerPoint presentation and is available for immediate download. Download now and impress your audience.
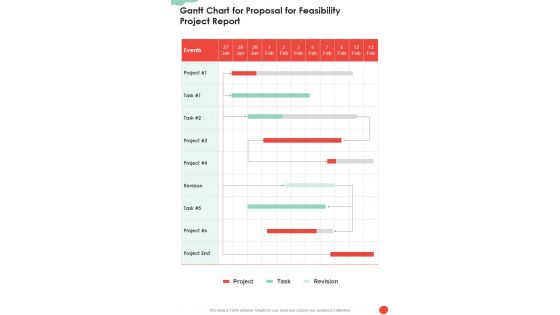
Gantt Chart For Proposal For Feasibility Project Report One Pager Sample Example Document
Presenting you an exemplary Gantt Chart For Proposal For Feasibility Project Report One Pager Sample Example Document. Our one-pager comprises all the must-have essentials of an inclusive document. You can edit it with ease, as its layout is completely editable. With such freedom, you can tweak its design and other elements to your requirements. Download this Gantt Chart For Proposal For Feasibility Project Report One Pager Sample Example Document brilliant piece now.
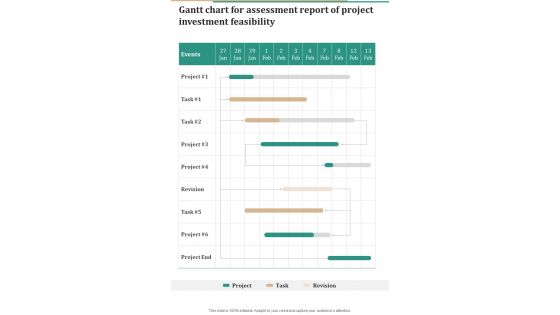
Gantt Chart For Assessment Report Of Project Investment Feasibility One Pager Sample Example Document
Presenting you an exemplary Gantt Chart For Assessment Report Of Project Investment Feasibility One Pager Sample Example Document. Our one-pager comprises all the must-have essentials of an inclusive document. You can edit it with ease, as its layout is completely editable. With such freedom, you can tweak its design and other elements to your requirements. Download this Gantt Chart For Assessment Report Of Project Investment Feasibility One Pager Sample Example Document brilliant piece now.
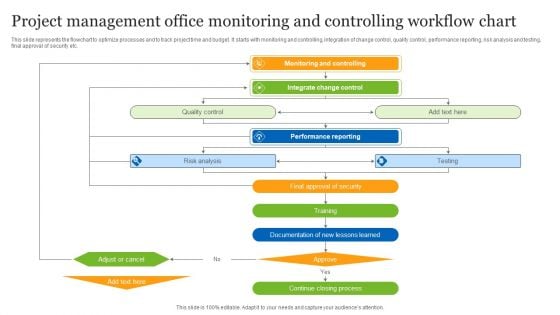
Project Management Office Monitoring And Controlling Workflow Chart Ppt Slides Mockup PDF
This slide represents the flowchart to optimize processes and to track project time and budget. It starts with monitoring and controlling, integration of change control, quality control, performance reporting, risk analysis and testing, final approval of security etc. Presenting Project Management Office Monitoring And Controlling Workflow Chart Ppt Slides Mockup PDF to dispense important information. This template comprises five stages. It also presents valuable insights into the topics including Monitoring And Controlling, Integrate Change Control, Performance Reporting. This is a completely customizable PowerPoint theme that can be put to use immediately. So, download it and address the topic impactfully.

Organization Chart And Corporate Model Transformation Project Roles And Responsibilities After Pictures PDF
This slide covers roles and responsibilities of the team leaders, team members, sub-teams and external resources after the process of restructuring. Deliver an awe inspiring pitch with this creative organization chart and corporate model transformation project roles and responsibilities after pictures pdf bundle. Topics like project leadership, project team members, project sub teams, external resources can be discussed with this completely editable template. It is available for immediate download depending on the needs and requirements of the user.
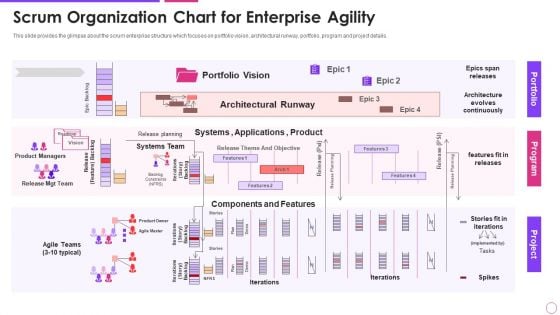
Scrum Organization Chart For Enterprise Agility Agile Project Management Framework Template PDF
This slide provides the glimpse about the scrum enterprise structure which focuses on portfolio vision, architectural runway, portfolio, program and project details. Deliver and pitch your topic in the best possible manner with this scrum organization chart for enterprise agility agile project management framework template pdf. Use them to share invaluable insights on scrum organization chart for enterprise agility and impress your audience. This template can be altered and modified as per your expectations. So, grab it now.
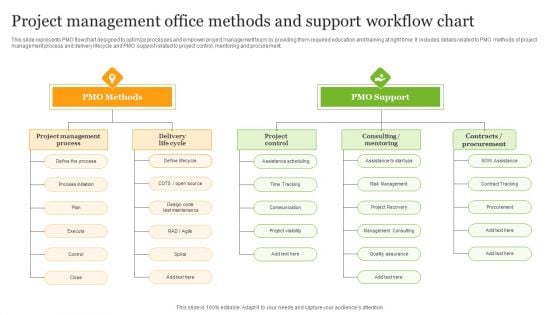
Project Management Office Methods And Support Workflow Chart Ppt Styles Shapes PDF
This slide represents PMO flowchart designed to optimize processes and empower project management team by providing them required education and training at right time. It includes details related to PMO methods of project management process and delivery lifecycle and PMO support related to project control, mentoring and procurement. Persuade your audience using this Project Management Office Methods And Support Workflow Chart Ppt Styles Shapes PDF. This PPT design covers two stages, thus making it a great tool to use. It also caters to a variety of topics including PMO Methods, PMO Support, Project Management Process. Download this PPT design now to present a convincing pitch that not only emphasizes the topic but also showcases your presentation skills.
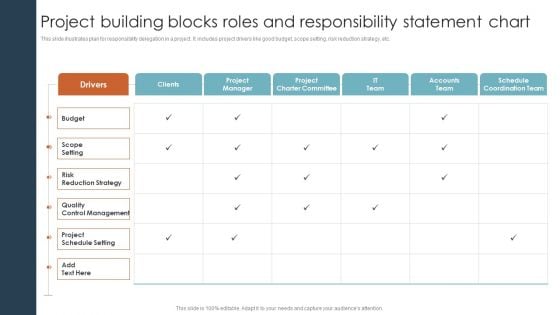
Project Building Blocks Roles And Responsibility Statement Chart Ppt Infographics Ideas PDF
This slide illustrates plan for responsibility delegation in a project. It includes project drivers like good budget, scope setting, risk reduction strategy, etc. Pitch your topic with ease and precision using this Project Building Blocks Roles And Responsibility Statement Chart Ppt Infographics Ideas PDF. This layout presents information on Scope Setting, Risk Reduction Strategy, Quality Control Management. It is also available for immediate download and adjustment. So, changes can be made in the color, design, graphics or any other component to create a unique layout.
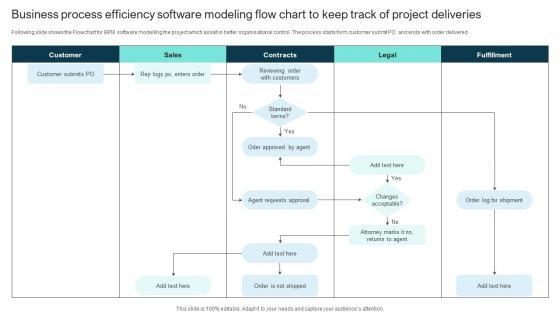
Business Process Efficiency Software Modeling Flow Chart To Keep Track Of Project Deliveries Template Pdf
Following slide shows the Flowchart for BPM software modelling the project which assist in better organisational control. The process starts form customer submit PO and ends with order delivered Showcasing this set of slides titled Business Process Efficiency Software Modeling Flow Chart To Keep Track Of Project Deliveries Template Pdf The topics addressed in these templates are Customer Submits, Business Process, Efficiency Software All the content presented in this PPT design is completely editable. Download it and make adjustments in color, background, font etc. as per your unique business setting. Following slide shows the Flowchart for BPM software modelling the project which assist in better organisational control. The process starts form customer submit PO and ends with order delivered
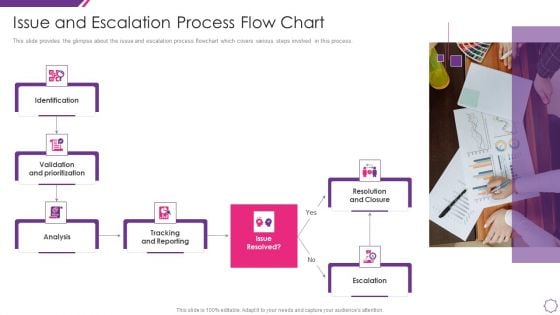
Handle Project Escalations Issue And Escalation Process Flow Chart Ppt Gallery Inspiration PDF
This slide provides the glimpse about the issue and escalation process flowchart which covers various steps involved in this process. Presenting handle project escalations issue and escalation process flow chart ppt gallery inspiration pdf to provide visual cues and insights. Share and navigate important information on seven stages that need your due attention. This template can be used to pitch topics like identification, analysis, escalation, resolution and closure. In addtion, this PPT design contains high resolution images, graphics, etc, that are easily editable and available for immediate download.
How To Intensify Project Threats Issue And Escalation Process Flow Chart Icons PDF
This slide provides the glimpse about the issue and escalation process flowchart which covers various steps involved in this process. Presenting how to intensify project threats issue and escalation process flow chart icons pdf to provide visual cues and insights. Share and navigate important information on seven stages that need your due attention. This template can be used to pitch topics like analysis, validation and prioritization, tracking and reporting, escalation, resolution and closure. In addtion, this PPT design contains high resolution images, graphics, etc, that are easily editable and available for immediate download.
Chart Showing Financial Projection With Various Segments Ppt Professional Icon PDF
Showcasing this set of slides titled chart showing financial projection with various segments ppt professional icon pdf. The topics addressed in these templates are chart showing financial projection with various segments. All the content presented in this PPT design is completely editable. Download it and make adjustments in color, background, font etc. as per your unique business setting.

Trend Arrow Chart Illustrating Business Projection Ppt PowerPoint Presentation Ideas Sample PDF
Presenting trend arrow chart illustrating business projection ppt powerpoint presentation ideas sample pdf to dispense important information. This template comprises three stages. It also presents valuable insights into the topics including trend arrow chart illustrating business projection. This is a completely customizable PowerPoint theme that can be put to use immediately. So, download it and address the topic impactfully.
Project Quality Management Plan Process Tracking With Control Chart Ppt Ideas Background Image PDF
Presenting this set of slides with name project quality management plan process tracking with control chart ppt ideas background image pdf. The topics discussed in these slide is process tracking with control chart. This is a completely editable PowerPoint presentation and is available for immediate download. Download now and impress your audience.
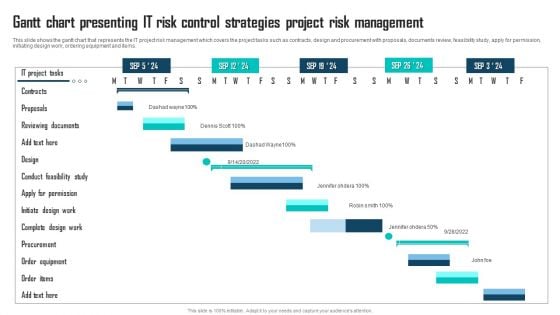
Gantt Chart Presenting IT Risk Control Strategies Project Risk Management Sample PDF
This slide shows the gantt chart that represents the IT project risk management which covers the project tasks such as contracts, design and procurement with proposals, documents review, feasibility study, apply for permission, initiating design work, ordering equipment and items. Showcasing this set of slides titled Gantt Chart Presenting IT Risk Control Strategies Project Risk Management Sample PDF. The topics addressed in these templates are IT Project Tasks, Reviewing Documents, Conduct Feasibility Study. All the content presented in this PPT design is completely editable. Download it and make adjustments in color, background, font etc. as per your unique business setting.
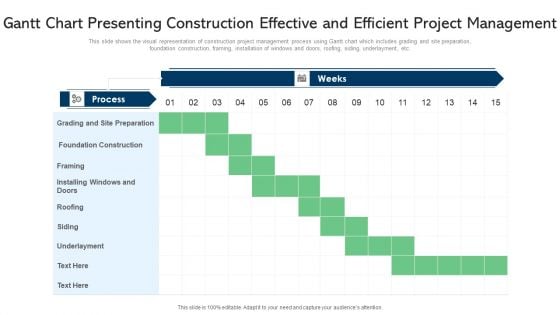
Gantt Chart Presenting Construction Effective And Efficient Project Management Ppt PowerPoint Presentation Gallery Deck PDF
This slide shows the visual representation of construction project management process using Gantt chart which includes grading and site preparation, foundation construction, framing, installation of windows and doors, roofing, siding, underlayment, etc. Showcasing this set of slides titled gantt chart presenting construction effective and efficient project management ppt powerpoint presentation gallery deck pdf. The topics addressed in these templates are process, site preparation, framing. All the content presented in this PPT design is completely editable. Download it and make adjustments in color, background, font etc. as per your unique business setting.
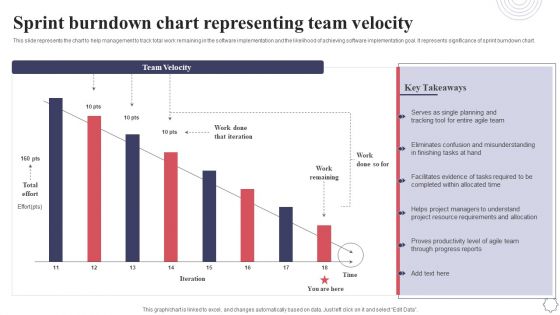
Sprint Burndown Chart Representing Team Velocity Application Deployment Project Plan Ideas PDF
This slide represents the chart to help management to track total work remaining in the software implementation and the likelihood of achieving software implementation goal. It represents significance of sprint burndown chart. Here you can discover an assortment of the finest PowerPoint and Google Slides templates. With these templates, you can create presentations for a variety of purposes while simultaneously providing your audience with an eye catching visual experience. Download Sprint Burndown Chart Representing Team Velocity Application Deployment Project Plan Ideas PDF to deliver an impeccable presentation. These templates will make your job of preparing presentations much quicker, yet still, maintain a high level of quality. Slidegeeks has experienced researchers who prepare these templates and write high quality content for you. Later on, you can personalize the content by editing the Sprint Burndown Chart Representing Team Velocity Application Deployment Project Plan Ideas PDF.
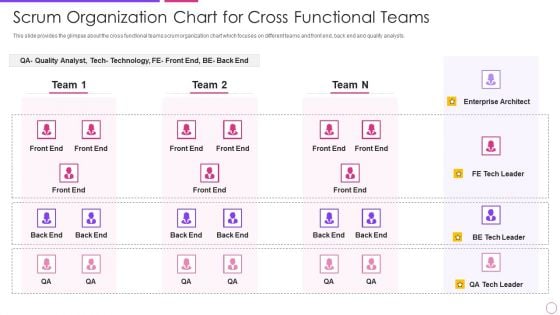
Scrum Organization Chart For Cross Functional Teams Agile Project Management Framework Background PDF
This slide provides the glimpse about the cross functional teams scrum organization chart which focuses on different teams and front end, back end and quality analysts. Deliver an awe inspiring pitch with this creative scrum organization chart for cross functional teams agile project management framework background pdf bundle. Topics like quality analyst, team can be discussed with this completely editable template. It is available for immediate download depending on the needs and requirements of the user.
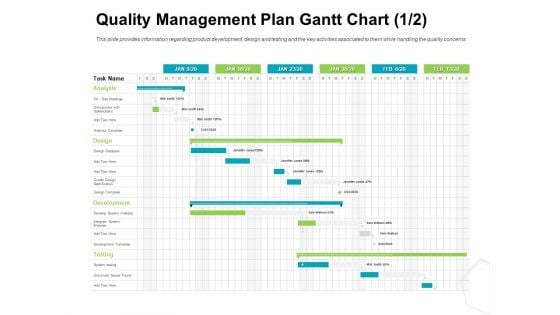
Project Quality Management Plan Quality Management Plan Gantt Chart Design Template PDF
Manage your complex projects and organize them simultaneously with this detailed Gantt Chart PowerPoint Template. Track your milestones, tasks, phases, activities, subtasks amongst other constituents that will give you an updated visual of your project. Reflect your planning horizon and capture your release plan in one view with this Gantt Chart PowerPoint presentation template. You can plot various dependencies directly on this Timeline PowerPoint Presentation Layout to see which tasks are still in the pipeline and how the delays in them are impacting the schedules and deadlines of the project. Apart from this, you can also share this updated visual with your team members and stakeholders, thus making it a resourceful tool to be incorporated in your business structure. Not only this but also the editable layout of this slide helps you to add your data and statistics at your convenience.
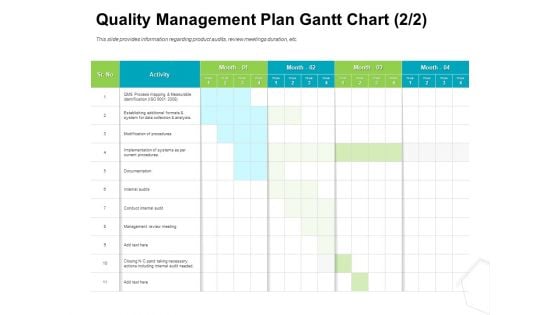
Project Quality Management Plan Quality Management Plan Gantt Chart Graphics PDF
Manage your complex projects and organize them simultaneously with this detailed Gantt Chart PowerPoint Template. Track your milestones, tasks, phases, activities, subtasks amongst other constituents that will give you an updated visual of your project. Reflect your planning horizon and capture your release plan in one view with this Gantt Chart PowerPoint presentation template. You can plot various dependencies directly on this Timeline PowerPoint Presentation Layout to see which tasks are still in the pipeline and how the delays in them are impacting the schedules and deadlines of the project. Apart from this, you can also share this updated visual with your team members and stakeholders, thus making it a resourceful tool to be incorporated in your business structure. Not only this but also the editable layout of this slide helps you to add your data and statistics at your convenience.
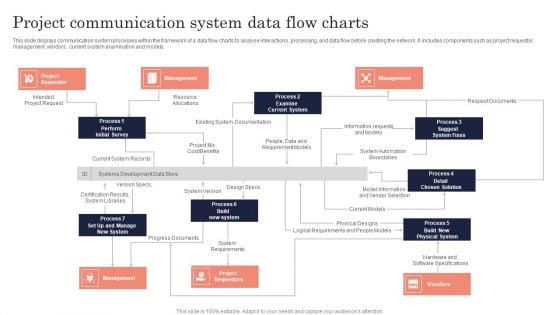
Project Communication System Data Flow Charts Ppt PowerPoint Presentation Gallery Background Images PDF
This slide displays communication system processes within the framework of a data flow charts to analyse interactions, processing, and data flow before creating the network. it includes components such as project requestor, management, vendors, current system examination and models. Presenting Project Communication System Data Flow Charts Ppt PowerPoint Presentation Gallery Background Images PDF to dispense important information. This template comprises six stages. It also presents valuable insights into the topics including Project Requestor, Management, Vendors. This is a completely customizable PowerPoint theme that can be put to use immediately. So, download it and address the topic impactfully.
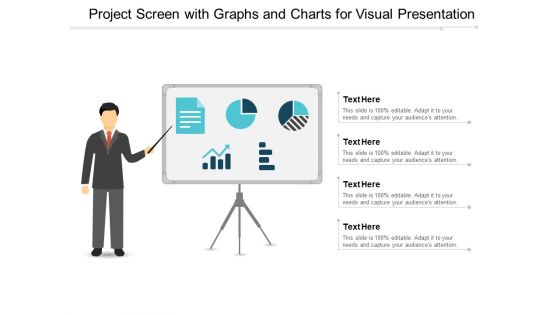
Project Screen With Graphs And Charts For Visual Presentation Ppt PowerPoint Presentation Gallery Design Inspiration
This is a project screen with graphs and charts for visual presentation ppt powerpoint presentation gallery design inspiration. This is a four stage process. The stages in this process are visual aids, communication, business.
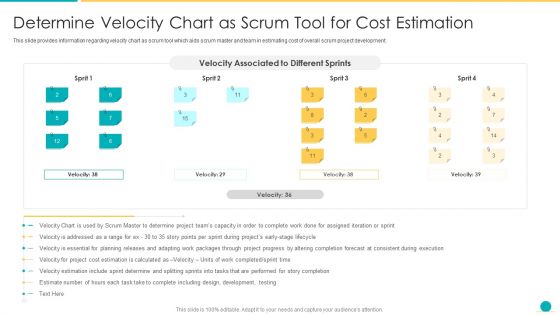
Fundamental Scrum Tools For Agile Project Administration IT Determine Velocity Chart As Scrum Tool For Cost Estimation Ideas PDF
This slide provides information regarding velocity chart as scrum tool which aids scrum master and team in estimating cost of overall scrum project development. Deliver an awe inspiring pitch with this creative fundamental scrum tools for agile project administration it determine velocity chart as scrum tool for cost estimation ideas pdf bundle. Topics like development, performed, planning, cost can be discussed with this completely editable template. It is available for immediate download depending on the needs and requirements of the user.

Pie Chart Showing Factors Impacting Elements Of Successful Project And Failure Graphics PDF
The following slide depicts the major reasons for project failure to avoid future reoccurrence. It includes elements such as ineffective management practices, poorly defined objectives, technical glitches etc. Showcasing this set of slides titled Pie Chart Showing Factors Impacting Elements Of Successful Project And Failure Graphics PDF. The topics addressed in these templates are Pie Chart Showing Factors, Impacting Elements, Successful Project And Failure. All the content presented in this PPT design is completely editable. Download it and make adjustments in color, background, font etc. as per your unique business setting.
Project Quality Planning And Controlling Process Tracking With Control Chart Ppt Infographic Template Clipart Images PDF
Presenting this set of slides with name project quality planning and controlling process tracking with control chart ppt infographic template clipart images pdf. The topics discussed in these slide is process tracking with control chart. This is a completely editable PowerPoint presentation and is available for immediate download. Download now and impress your audience.
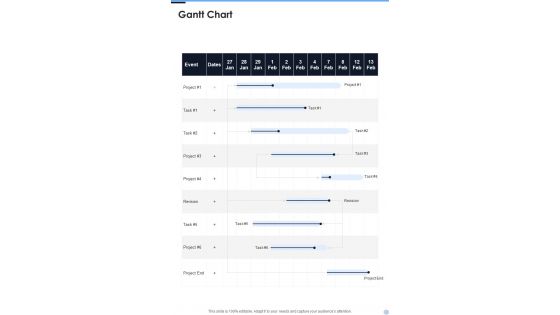
Gantt Chart Proposal For Data Analysis In Research Project One Pager Sample Example Document
Presenting you an exemplary Gantt Chart Proposal For Data Analysis In Research Project One Pager Sample Example Document. Our one-pager comprises all the must-have essentials of an inclusive document. You can edit it with ease, as its layout is completely editable. With such freedom, you can tweak its design and other elements to your requirements. Download this Gantt Chart Proposal For Data Analysis In Research Project One Pager Sample Example Document brilliant piece now.
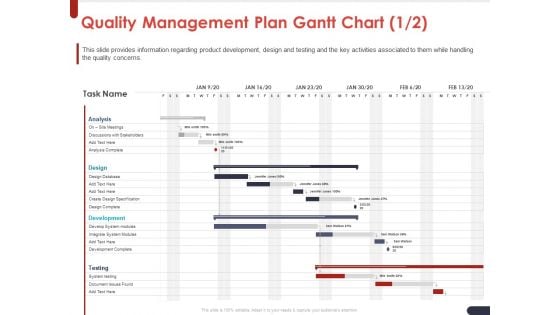
Project Quality Planning And Controlling Quality Management Plan Gantt Chart Design Mockup PDF
Manage your complex projects and organize them simultaneously with this detailed Gantt Chart PowerPoint Template. Track your milestones, tasks, phases, activities, subtasks amongst other constituents that will give you an updated visual of your project. Reflect your planning horizon and capture your release plan in one view with this Gantt Chart PowerPoint presentation template. You can plot various dependencies directly on this Timeline PowerPoint Presentation Layout to see which tasks are still in the pipeline and how the delays in them are impacting the schedules and deadlines of the project. Apart from this, you can also share this updated visual with your team members and stakeholders, thus making it a resourceful tool to be incorporated in your business structure. Not only this but also the editable layout of this slide helps you to add your data and statistics at your convenience.
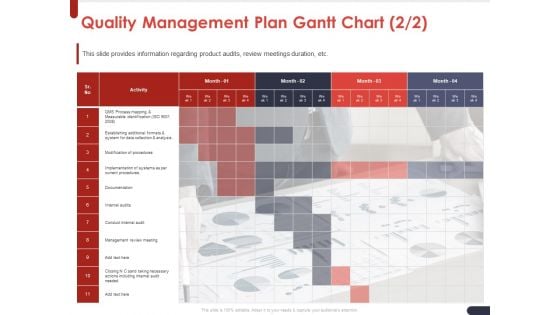
Project Quality Planning And Controlling Quality Management Plan Gantt Chart Mockup PDF
Manage your complex projects and organize them simultaneously with this detailed Gantt Chart PowerPoint Template. Track your milestones, tasks, phases, activities, subtasks amongst other constituents that will give you an updated visual of your project. Reflect your planning horizon and capture your release plan in one view with this Gantt Chart PowerPoint presentation template. You can plot various dependencies directly on this Timeline PowerPoint Presentation Layout to see which tasks are still in the pipeline and how the delays in them are impacting the schedules and deadlines of the project. Apart from this, you can also share this updated visual with your team members and stakeholders, thus making it a resourceful tool to be incorporated in your business structure. Not only this but also the editable layout of this slide helps you to add your data and statistics at your convenience.
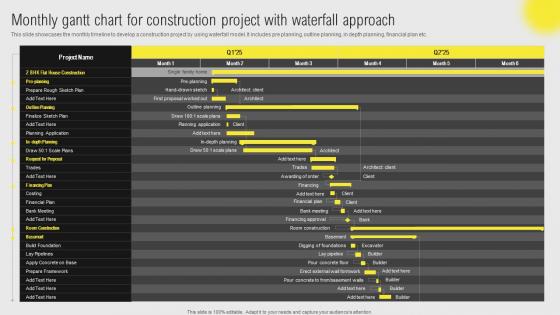
IT Projects Administration Through Waterfall Monthly Gantt Chart For Construction Slides Pdf
This slide showcases the monthly timeline to develop a construction project by using waterfall model. It includes pre planning, outline planning, in depth planning, financial plan etc. Slidegeeks is here to make your presentations a breeze with IT Projects Administration Through Waterfall Monthly Gantt Chart For Construction Slides Pdf With our easy-to-use and customizable templates, you can focus on delivering your ideas rather than worrying about formatting. With a variety of designs to choose from, you are sure to find one that suits your needs. And with animations and unique photos, illustrations, and fonts, you can make your presentation pop. So whether you are giving a sales pitch or presenting to the board, make sure to check out Slidegeeks first. This slide showcases the monthly timeline to develop a construction project by using waterfall model. It includes pre planning, outline planning, in depth planning, financial plan etc.
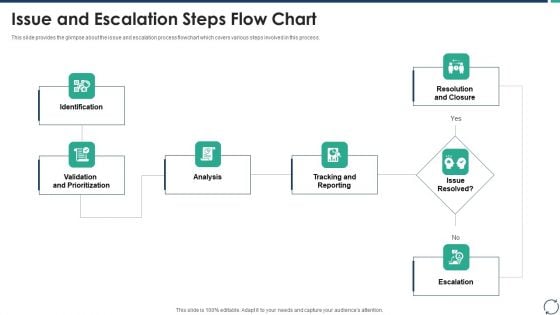
Escalation Steps For Projects Issue And Escalation Steps Flow Chart Clipart PDF
This slide provides the glimpse about the issue and escalation process flowchart which covers various steps involved in this process. Deliver and pitch your topic in the best possible manner with this escalation steps for projects issue and escalation steps flow chart clipart pdf. Use them to share invaluable insights on validation and prioritization, analysis, tracking and reporting and impress your audience. This template can be altered and modified as per your expectations. So, grab it now.
Business Process Flow Chart Example Diagram To Visualize Projects PowerPoint Templates
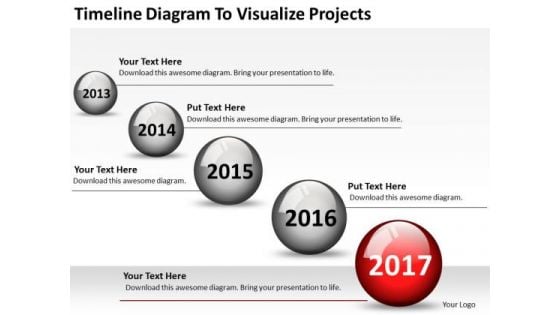
We present our business process flow chart example diagram to visualize projects PowerPoint templates.Download our Circle Charts PowerPoint Templates because Our PowerPoint Templates and Slides have the Brilliant backdrops. Guaranteed to illuminate the minds of your audience. Download our Business PowerPoint Templates because You aspire to touch the sky with glory. Let our PowerPoint Templates and Slides provide the fuel for your ascent. Use our Shapes PowerPoint Templates because Our PowerPoint Templates and Slides are Clear and concise. Use them and dispel any doubts your team may have. Present our Flow Charts PowerPoint Templates because Our PowerPoint Templates and Slides will provide weight to your words. They will bring out the depth of your thought process. Download and present our Process and Flows PowerPoint Templates because You have a driving passion to excel in your field. Our PowerPoint Templates and Slides will prove ideal vehicles for your ideas.Use these PowerPoint slides for presentations relating to Art, beautiful, celebration, circle, color, cottontail, crowd, decoration, design, element, frame, illustration, image, international, isolated, ornament, pattern, precious, present, red, reflection, silhouette, symbol, traditional, white, yellow . The prominent colors used in the PowerPoint template are Red, Gray, White. With our Business Process Flow Chart Example Diagram To Visualize Projects PowerPoint Templates there is no need to exaggerate. They are always brief and accurate.
Project Efficiency Status Dashboard Icon With Graphs And Charts Demonstration PDF
Persuade your audience using this Project Efficiency Status Dashboard Icon With Graphs And Charts Demonstration PDF. This PPT design covers three stages, thus making it a great tool to use. It also caters to a variety of topics including Project Efficiency Status Dashboard Icon WITH Graphs AND Charts. Download this PPT design now to present a convincing pitch that not only emphasizes the topic but also showcases your presentation skills.
Tracking Progress Of Project Management Tasks Ppt PowerPoint Presentation Diagram Graph Charts PDF
The following slide illustrates task management tool for tracking project status. It provides information about requirements, coding, development, knowledge, user acceptance testing, standup meeting, etc. Welcome to our selection of the Tracking Progress Of Project Management Tasks Ppt PowerPoint Presentation Diagram Graph Charts PDF. These are designed to help you showcase your creativity and bring your sphere to life. Planning and Innovation are essential for any business that is just starting out. This collection contains the designs that you need for your everyday presentations. All of our PowerPoints are 100 percent editable, so you can customize them to suit your needs. This multi purpose template can be used in various situations. Grab these presentation templates today.
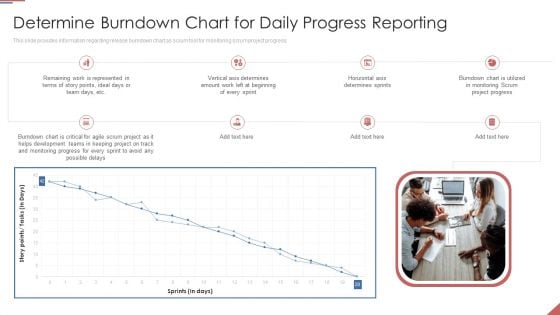
Formulating Plan And Executing Bid Projects Using Agile IT Determine Burndown Chart For Daily Progress Reporting Rules PDF
This slide provides information regarding release burndown chart as scrum tool for monitoring scrum project progress. Deliver an awe inspiring pitch with this creative formulating plan and executing bid projects using agile it determine burndown chart for daily progress reporting rules pdf bundle. Topics like determine burndown chart for daily progress reporting can be discussed with this completely editable template. It is available for immediate download depending on the needs and requirements of the user.
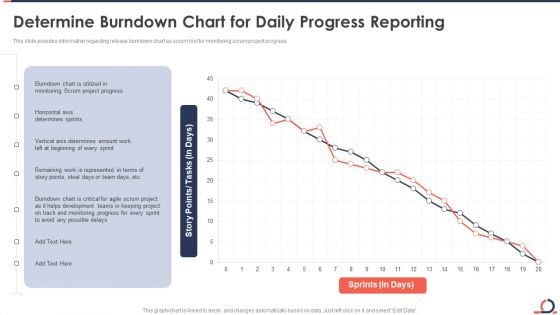
Determine Burndown Chart For Daily Progress Reporting Developing Fixed Bid Projects Using Agile IT Background PDF
This slide provides information regarding release burndown chart as scrum tool for monitoring scrum project progress. Deliver and pitch your topic in the best possible manner with this determine burndown chart for daily progress reporting developing fixed bid projects using agile it background pdf. Use them to share invaluable insights on monitoring, development and impress your audience. This template can be altered and modified as per your expectations. So, grab it now.
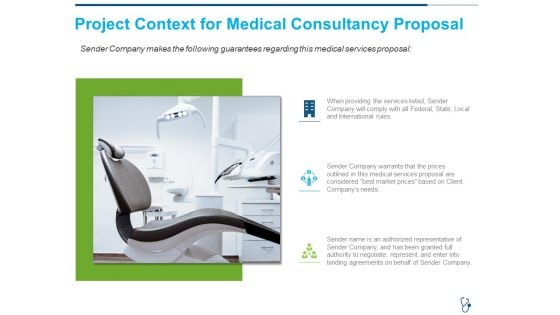
Project Context For Medical Consultancy Proposal Ppt Diagram Graph Charts PDF
Deliver and pitch your topic in the best possible manner with this project context for medical consultancy proposal ppt diagram graph charts pdf. Use them to share invaluable insights on project context for Medical Consultancy and impress your audience. This template can be altered and modified as per your expectations. So, grab it now.
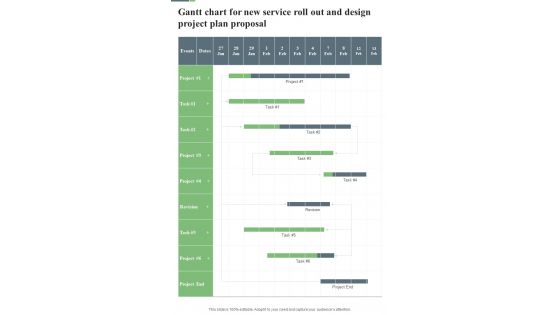
Gantt Chart For New Service Roll Out And Design Project Plan Proposal One Pager Sample Example Document
Presenting you an exemplary Gantt Chart For New Service Roll Out And Design Project Plan Proposal One Pager Sample Example Document. Our one-pager comprises all the must-have essentials of an inclusive document. You can edit it with ease, as its layout is completely editable. With such freedom, you can tweak its design and other elements to your requirements. Download this Gantt Chart For New Service Roll Out And Design Project Plan Proposal One Pager Sample Example Document brilliant piece now.

Project Conclusion Report Performance Analysis Ppt PowerPoint Presentation Diagram Graph Charts
This is a project conclusion report performance analysis ppt powerpoint presentation diagram graph charts. The topics discussed in this diagram are marketing, business, management, planning, strategy This is a completely editable PowerPoint presentation, and is available for immediate download.
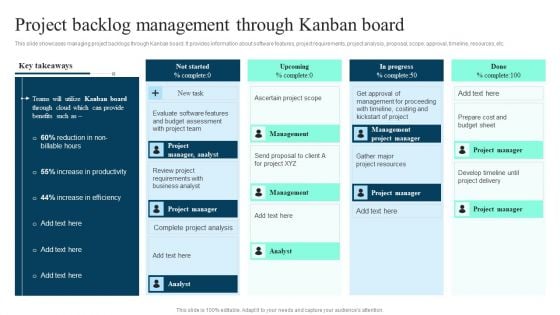
Project Backlog Management Through Kanban Board Ppt PowerPoint Presentation Diagram Graph Charts PDF
This slide showcases managing project backlogs through Kanban board. It provides information about software features, project requirements, project analysis, proposal, scope, approval, timeline, resources, etc. Slidegeeks is here to make your presentations a breeze with Project Backlog Management Through Kanban Board Ppt PowerPoint Presentation Diagram Graph Charts PDF With our easy to use and customizable templates, you can focus on delivering your ideas rather than worrying about formatting. With a variety of designs to choose from, you are sure to find one that suits your needs. And with animations and unique photos, illustrations, and fonts, you can make your presentation pop. So whether you are giving a sales pitch or presenting to the board, make sure to check out Slidegeeks first.
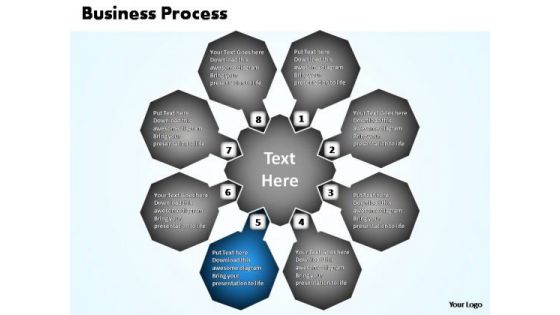
PowerPoint Design Chart Business Process Chart Ppt Backgrounds
PowerPoint Design Chart Business Process Chart PPT Backgrounds-Highlight the key components of your entire manufacturing/ business process. Illustrate how each element flows seamlessly onto the next stage. Emphasise on any critical or key factors within them. Demonstrate how they all combine to form the final product.-PowerPoint Design Chart Business Process Chart PPT Backgrounds Our PowerPoint Design Chart Business Process Chart Ppt Backgrounds have a distinguished appearance. They also project a balanced approach.
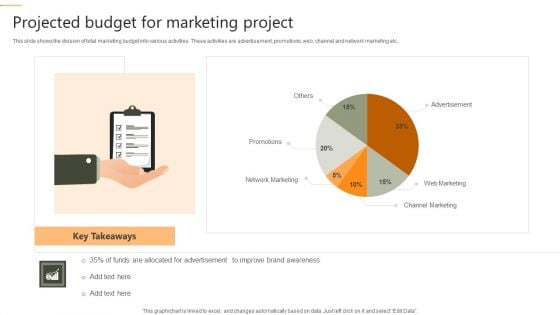
Projected Budget For Marketing Project Demonstration PDF
This slide shows the division of total marketing budget into various activities. These activities are advertisement, promotions, web, channel and network marketing etc. Showcasing this set of slides titled Projected Budget For Marketing Project Demonstration PDF. The topics addressed in these templates are Network Marketing, Advertisement, Network Marketing. All the content presented in this PPT design is completely editable. Download it and make adjustments in color, background, font etc. as per your unique business setting.
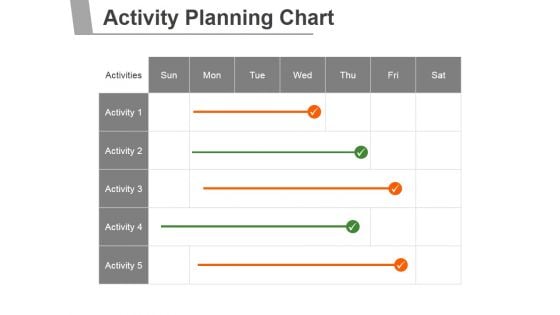
Activity Planning Chart Ppt PowerPoint Presentation Shapes
This is a activity planning chart ppt powerpoint presentation shapes. This is a seven stage process. The stages in this process are business, marketing, management, chart, planning.
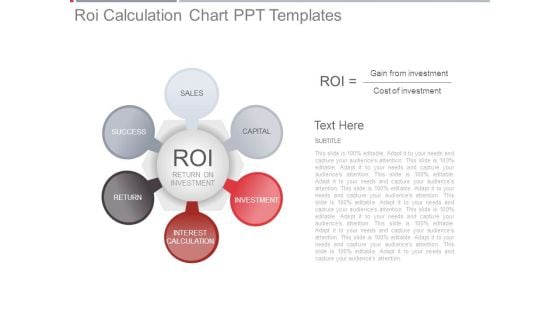
Roi Calculation Chart Ppt Templates
This is a roi calculation chart ppt templates. This is a six stage process. The stages in this process are sales, capital, investment, interest calculation, return, success, return on investment.
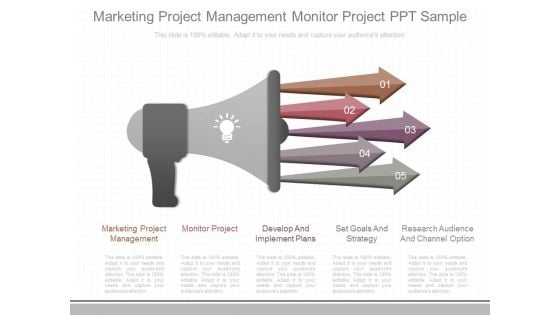
Marketing Project Management Monitor Project Ppt Sample
This is a marketing project management monitor project ppt sample. This is a five stage process. The stages in this process are marketing project management, monitor project, develop and implement plans, set goals and strategy, research audience and channel option.
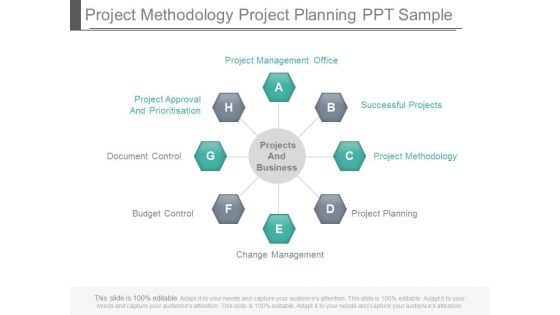
Project Methodology Project Planning Ppt Sample
This is a project methodology project planning ppt sample. This is a eight stage process. The stages in this process are business, marketing, success.
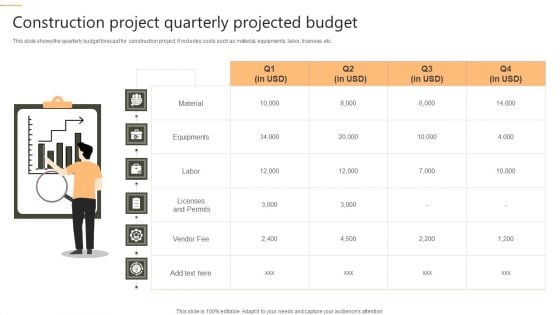
Construction Project Quarterly Projected Budget Topics PDF
This slide shows the quarterly budget forecast for construction project. It includes costs such as material, equipments, labor, licenses, etc. Persuade your audience using this Construction Project Quarterly Projected Budget Topics PDF. This PPT design covers six stages, thus making it a great tool to use. It also caters to a variety of topics including Equipments, Material, Labor. Download this PPT design now to present a convincing pitch that not only emphasizes the topic but also showcases your presentation skills.
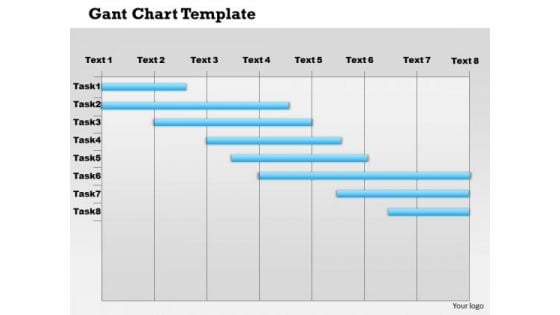
Business Framework Gantt Chart PowerPoint Presentation
A Gantt chart is a type of bar chart, that illustrates a project schedule. Gantt charts illustrate the start and finish dates of the terminal elements and summary elements of a project. Terminal elements and summary elements comprise the work breakdown structure of the project. Use this image slide to depict project management in your presentations.

Project Description Ppt Model
This is a project description ppt model. This is a three stage process. The stages in this process are business, marketing, strategy, icons.
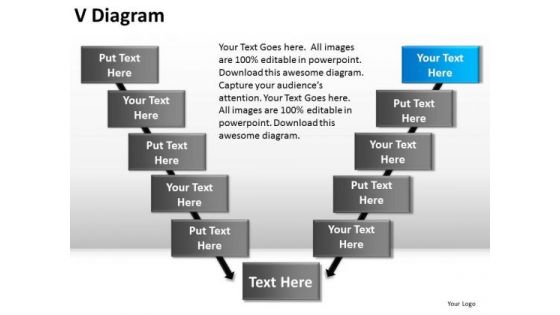
PowerPoint Design Chart V Diagram Ppt Slide
PowerPoint Design Chart V Diagram PPT Slide--Acceptance, Architecture,Chart,Cycle,Deployment, Design, Detail, Detailed, Development, Diagram, Engineering, Function, functional, Implement, Implementation, Management, model, Process, Project,Quality, Requirements, Software, Specification, steps, System, Test, Our PowerPoint Design Chart V Diagram Ppt Slide are great elevators. They will lift the levels of enthusiasm with ease.
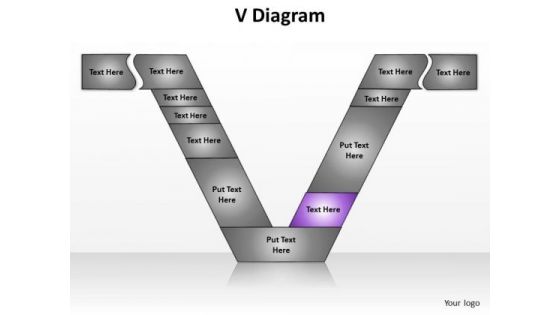
PowerPoint Designs Chart V Diagram Ppt Theme
PowerPoint Designs Chart V Diagram PPT Theme--Acceptance, Architecture,Chart,Cycle,Deployment, Design, Detail, Detailed, Development, Diagram, Engineering, Function, functional, Implement, Implementation, Management, model, Process, Project,Quality, Requirements, Software, Specification, steps, System, Test, Achieve any feat you desire to. Our PowerPoint Designs Chart V Diagram Ppt Theme are extremely facilitating.
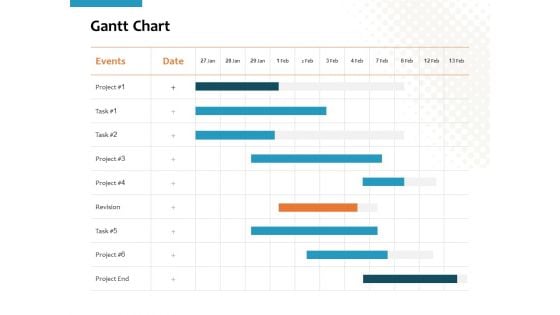
Gantt Chart Ppt PowerPoint Presentation Slides Themes
Make a highly optimized project management report using this content-ready Gantt Chart PPT Diagram. Effortless yet very clear, this layout proves a useful tool to present the professional details of a task or activity. Showcase the activities and allotted time to the business executives with this Gantt Chart PowerPoint theme. List down the column tasks in various timeframes and the activities associated with each of them here. Further, plot time allocation for various tasks, monitor their actual time and make comparisons to interpret the final progress with this well-structured Gantt Chart Excel Template. You can add all the significant details of a particular project in this chart and showcase it to all the project members so that they can participate in the overall development. Not only this but also our PPT template can help you showcase the work breakdown structure of your project.
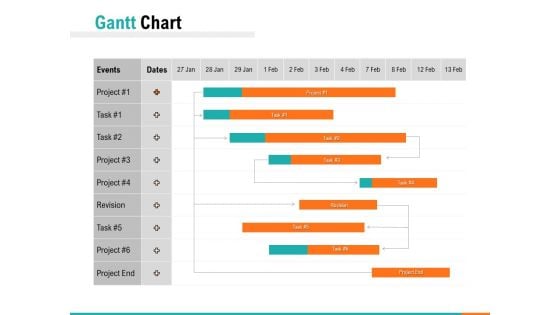
Gantt Chart Ppt PowerPoint Presentation Portfolio Clipart
Make a highly optimized project management report using this content-ready Gantt Chart PPT Diagram. Effortless yet very clear, this layout proves a useful tool to present the professional details of a task or activity. Showcase the activities and allotted time to the business executives with this Gantt Chart PowerPoint theme. List down the column tasks in various timeframes and the activities associated with each of them here. Further, plot time allocation for various tasks, monitor their actual time and make comparisons to interpret the final progress with this well-structured Gantt Chart Excel Template. You can add all the significant details of a particular project in this chart and showcase it to all the project members so that they can participate in the overall development. Not only this but also our PPT template can help you showcase the work breakdown structure of your project.
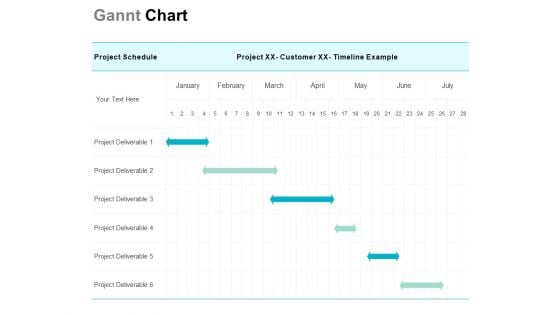
Gannt Chart Ppt PowerPoint Presentation Slides Outfit
Make a highly optimized project management report using this content-ready Gantt Chart PPT Diagram. Effortless yet very clear, this layout proves a useful tool to present the professional details of a task or activity. Showcase the activities and allotted time to the business executives with this Gantt Chart PowerPoint theme. List down the column tasks in various timeframes and the activities associated with each of them here. Further, plot time allocation for various tasks, monitor their actual time and make comparisons to interpret the final progress with this well-structured Gantt Chart Excel Template. You can add all the significant details of a particular project in this chart and showcase it to all the project members so that they can participate in the overall development. Not only this but also our PPT template can help you showcase the work breakdown structure of your project.

Yearly Selling Forecasts Revenue Chart Summary PDF
This slide covers projections for yearly revenue generation from product sales. It includes forecasted revenue for different years and a graph depicting the projected sales revenue growth. Showcasing this set of slides titled Yearly Selling Forecasts Revenue Chart Summary PDF. The topics addressed in these templates are Project Sales Revenue, Forecasts Revenue Chart. All the content presented in this PPT design is completely editable. Download it and make adjustments in color, background, font etc. as per your unique business setting.
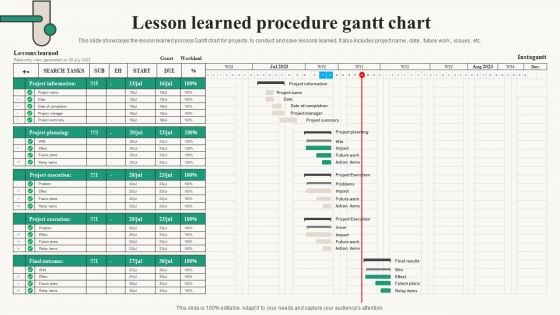
Lesson Learned Procedure Gantt Chart Topics PDF
This slide showcases the lesson learned process Gantt chart for projects, to conduct and save lessons learned. It also includes project name , date , future work , issues , etc. Showcasing this set of slides titled Lesson Learned Procedure Gantt Chart Topics PDF. The topics addressed in these templates are SEARCH TASKS, Gantt, Workload. All the content presented in this PPT design is completely editable. Download it and make adjustments in color, background, font etc. as per your unique business setting.
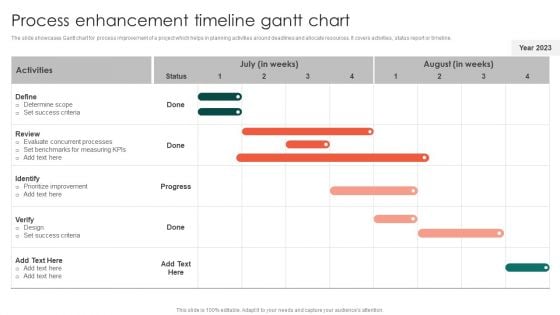
Process Enhancement Timeline Gantt Chart Clipart PDF
The slide showcases Gantt chart for process improvement of a project which helps in planning activities around deadlines and allocate resources. It covers activities, status report or timeline.Pitch your topic with ease and precision using this Process Enhancement Timeline Gantt Chart Clipart PDF. This layout presents information on Concurrent Processes, Prioritize Improvement, Determine Scope. It is also available for immediate download and adjustment. So, changes can be made in the color, design, graphics or any other component to create a unique layout.
PowerPoint Theme Chart Three Stylish Ppt Backgrounds
PowerPoint Theme Chart Three Stylish PPT Backgrounds--These amazing PowerPoint pre-designed slides and PowerPoint templates have been carefully created by our team of experts to help you impress your audience. Our stunning collection of Powerpoint slides are 100% editable and can easily fit in any PowerPoint presentations. By using these animations and graphics in PowerPoint and you can easily make professional presentations. Any text can be entered at any point in the PowerPoint template or slide. Just DOWNLOAD our awesome PowerPoint templates and you are ready to go. Project your views with our PowerPoint Theme Chart Three Stylish Ppt Backgrounds. Download without worries with our money back guaranteee.
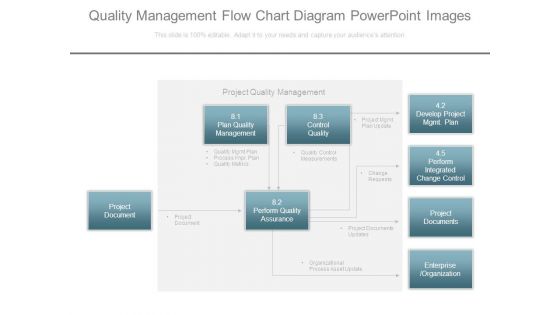
Quality Management Flow Chart Diagram Powerpoint Images
This is a quality management flow chart diagram powerpoint images. This is a four stage process. The stages in this process are project document, project quality management, plan quality management, control quality, perform quality assurance, develop project mgmt. plan, perform integrated, change control, project documents, enterprise, organization, quality mgmt plan, process impr plan, quality metrics, quality control measurements, project mgmt plan update, project document, change requests, project documents updates, organizational process asset update.
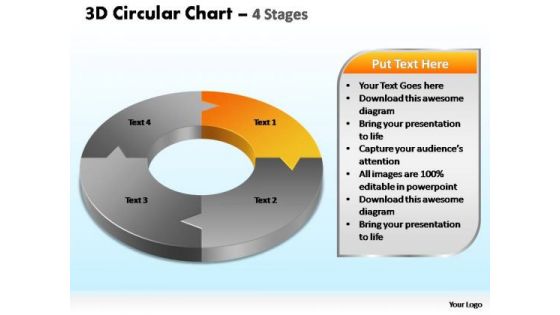
PowerPoint Slides Leadership Circular Chart Ppt Slides
PowerPoint Slides Leadership circular chart PPT Slides-The Circle of Life - a concept emmbedded in our minds and hence easy to comprehend. Life and Business is made up of processes comprising stages that flow from one to another. An excellent graphic to attract the attention of and understanding by your audience to improve earnings.-These amazing PowerPoint pre-designed slides and PowerPoint templates have been carefully created by our team of experts to help you impress your audience. Our stunning collection of Powerpoint slides are 100% editable and can easily fit in any PowerPoint presentations. By using these animations and graphics in PowerPoint and you can easily make professional presentations. Any text can be entered at any point in the PowerPoint template or slide. Just DOWNLOAD our awesome PowerPoint templates and you are ready to go. Disagreements will dwindle with our PowerPoint Slides Leadership Circular Chart Ppt Slides. They project a very convincing demeanour.

 Home
Home