Project Complexity

Pemdas Calculator In Powerpoint And Google Slides Cpb
Introducing our well-designed Pemdas Calculator In Powerpoint And Google Slides Cpb. This PowerPoint design presents information on topics like Pemdas Calculator. As it is predesigned it helps boost your confidence level. It also makes you a better presenter because of its high-quality content and graphics. This PPT layout can be downloaded and used in different formats like PDF, PNG, and JPG. Not only this, it is available in both Standard Screen and Widescreen aspect ratios for your convenience. Therefore, click on the download button now to persuade and impress your audience. Our Pemdas Calculator In Powerpoint And Google Slides Cpb are topically designed to provide an attractive backdrop to any subject. Use them to look like a presentation pro.

Percent Decrease Calculation In Powerpoint And Google Slides Cpb
Introducing our well-designed Percent Decrease Calculation In Powerpoint And Google Slides Cpb. This PowerPoint design presents information on topics like Percent Decrease Calculation. As it is predesigned it helps boost your confidence level. It also makes you a better presenter because of its high-quality content and graphics. This PPT layout can be downloaded and used in different formats like PDF, PNG, and JPG. Not only this, it is available in both Standard Screen and Widescreen aspect ratios for your convenience. Therefore, click on the download button now to persuade and impress your audience. Our Percent Decrease Calculation In Powerpoint And Google Slides Cpb are topically designed to provide an attractive backdrop to any subject. Use them to look like a presentation pro.
Six Sleep Calculator In Powerpoint And Google Slides Cpb
Introducing our well-designed Six Sleep Calculator In Powerpoint And Google Slides Cpb. This PowerPoint design presents information on topics like Six Sleep Calculator. As it is predesigned it helps boost your confidence level. It also makes you a better presenter because of its high-quality content and graphics. This PPT layout can be downloaded and used in different formats like PDF, PNG, and JPG. Not only this, it is available in both Standard Screen and Widescreen aspect ratios for your convenience. Therefore, click on the download button now to persuade and impress your audience. Our Six Sleep Calculator In Powerpoint And Google Slides Cpb are topically designed to provide an attractive backdrop to any subject. Use them to look like a presentation pro.
Myplate Nutrition Calculator In Powerpoint And Google Slides Cpb
Introducing our well designed Myplate Nutrition Calculator In Powerpoint And Google Slides Cpb. This PowerPoint design presents information on topics like Myplate Nutrition Calculator. As it is predesigned it helps boost your confidence level. It also makes you a better presenter because of its high quality content and graphics. This PPT layout can be downloaded and used in different formats like PDF, PNG, and JPG. Not only this, it is available in both Standard Screen and Widescreen aspect ratios for your convenience. Therefore, click on the download button now to persuade and impress your audience. Our Myplate Nutrition Calculator In Powerpoint And Google Slides Cpb are topically designed to provide an attractive backdrop to any subject. Use them to look like a presentation pro.
Most Advanced Financial Calculator In Powerpoint And Google Slides Cpb
Introducing our well-designed Most Advanced Financial Calculator In Powerpoint And Google Slides Cpb. This PowerPoint design presents information on topics like Most Advanced Financial Calculator. As it is predesigned it helps boost your confidence level. It also makes you a better presenter because of its high-quality content and graphics. This PPT layout can be downloaded and used in different formats like PDF, PNG, and JPG. Not only this, it is available in both Standard Screen and Widescreen aspect ratios for your convenience. Therefore, click on the download button now to persuade and impress your audience. Our Most Advanced Financial Calculator In Powerpoint And Google Slides Cpb are topically designed to provide an attractive backdrop to any subject. Use them to look like a presentation pro.
Best Calculators Statistics In Powerpoint And Google Slides Cpb
Introducing our well-designed Best Calculators Statistics In Powerpoint And Google Slides Cpb. This PowerPoint design presents information on topics like Best Calculators Statistics. As it is predesigned it helps boost your confidence level. It also makes you a better presenter because of its high-quality content and graphics. This PPT layout can be downloaded and used in different formats like PDF, PNG, and JPG. Not only this, it is available in both Standard Screen and Widescreen aspect ratios for your convenience. Therefore, click on the download button now to persuade and impress your audience. Our Best Calculators Statistics In Powerpoint And Google Slides Cpb are topically designed to provide an attractive backdrop to any subject. Use them to look like a presentation pro.

Calculate Carrying Capacity In Powerpoint And Google Slides Cpb
Introducing our well-designed Calculate Carrying Capacity In Powerpoint And Google Slides Cpb This PowerPoint design presents information on topics like Calculate Carrying Capacity As it is predesigned it helps boost your confidence level. It also makes you a better presenter because of its high-quality content and graphics. This PPT layout can be downloaded and used in different formats like PDF, PNG, and JPG. Not only this, it is available in both Standard Screen and Widescreen aspect ratios for your convenience. Therefore, click on the download button now to persuade and impress your audience. Our Calculate Carrying Capacity In Powerpoint And Google Slides Cpb are topically designed to provide an attractive backdrop to any subject. Use them to look like a presentation pro.
Conversion Chart Calculator In Powerpoint And Google Slides Cpb
Introducing our well designed Conversion Chart Calculator In Powerpoint And Google Slides Cpb. This PowerPoint design presents information on topics like Conversion Chart Calculator. As it is predesigned it helps boost your confidence level. It also makes you a better presenter because of its high quality content and graphics. This PPT layout can be downloaded and used in different formats like PDF, PNG, and JPG. Not only this, it is available in both Standard Screen and Widescreen aspect ratios for your convenience. Therefore, click on the download button now to persuade and impress your audience. Our Conversion Chart Calculator In Powerpoint And Google Slides Cpb are topically designed to provide an attractive backdrop to any subject. Use them to look like a presentation pro.
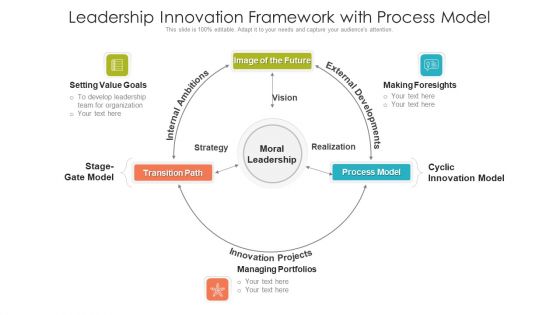
Leadership Innovation Framework With Process Model Ppt Show Layouts PDF
Showcasing this set of slides titled leadership innovation framework with process model ppt show layouts pdf. The topics addressed in these templates are cyclic innovation model, moral leadership, innovation projects. All the content presented in this PPT design is completely editable. Download it and make adjustments in color, background, font etc. as per your unique business setting.
Executing Devops Framework Global Devops Market Share Forecasts Icons PDF
Following slide provide information about the global DevOps market share. It shows the details about DevOps market growth estimation during 2019 to 2024. Deliver an awe inspiring pitch with this creative Executing Devops Framework Global Devops Market Share Forecasts Icons PDF bundle. Topics like IT And Telecommunication, Manufacturing, Government, Healthcare, Retail can be discussed with this completely editable template. It is available for immediate download depending on the needs and requirements of the user.

Analysis Between Actual And Forecasted Financial Budget Infographics PDF
This slide shows the table representing the comparison between actual and forecasted financial budget of an ecommerce company. It includes details related to investments, start and finish date, budget, actual to date, budget remaining, Percent spent, forecast calculated and remaining etc. Showcasing this set of slides titled Analysis Between Actual And Forecasted Financial Budget Infographics PDF. The topics addressed in these templates are External Labor, Budget Remaining, Forecast Remaining. All the content presented in this PPT design is completely editable. Download it and make adjustments in color, background, font etc. as per your unique business setting.
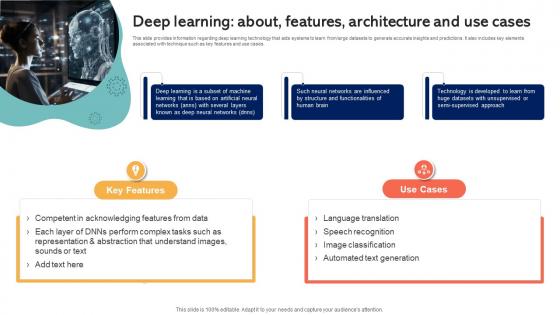
Deep Learning About Features Architecture And Use Cases Emotionally Intelligent Insights Leveraging AI SS V
This slide provides information regarding deep learning technology that aids systems to learn from large datasets to generate accurate insights and predictions. It also includes key elements associated with technique such as key features and use cases. Are you in need of a template that can accommodate all of your creative concepts This one is crafted professionally and can be altered to fit any style. Use it with Google Slides or PowerPoint. Include striking photographs, symbols, depictions, and other visuals. Fill, move around, or remove text boxes as desired. Test out color palettes and font mixtures. Edit and save your work, or work with colleagues. Download Deep Learning About Features Architecture And Use Cases Emotionally Intelligent Insights Leveraging AI SS V and observe how to make your presentation outstanding. Give an impeccable presentation to your group and make your presentation unforgettable. This slide provides information regarding deep learning technology that aids systems to learn from large datasets to generate accurate insights and predictions. It also includes key elements associated with technique such as key features and use cases.
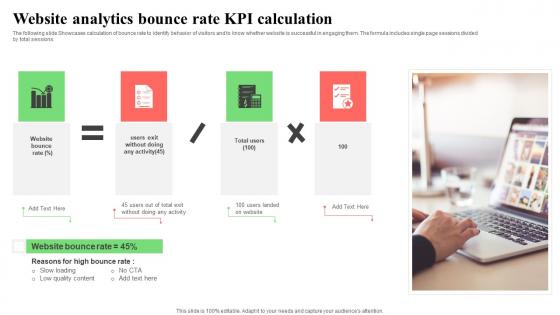
Website Analytics Bounce Rate KPI Calculation Topics Pdf
The following slide Showcases calculation of bounce rate to identify behavior of visitors and to know whether website is successful in engaging them. The formula includes single page sessions divided by total sessions. Pitch your topic with ease and precision using this Website Analytics Bounce Rate KPI Calculation Topics Pdf. This layout presents information on Website Bounce Rate, Slow Loading, Low Quality Content. It is also available for immediate download and adjustment. So, changes can be made in the color, design, graphics or any other component to create a unique layout. The following slide Showcases calculation of bounce rate to identify behavior of visitors and to know whether website is successful in engaging them. The formula includes single page sessions divided by total sessions.
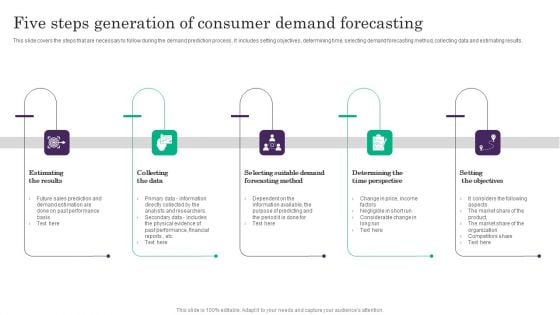
Five Steps Generation Of Consumer Demand Forecasting Designs PDF
This slide covers the steps that are necessary to follow during the demand prediction process . It includes setting objectives, determining time, selecting demand forecasting method, collecting data and estimating results. Persuade your audience using this Five Steps Generation Of Consumer Demand Forecasting Designs PDF. This PPT design covers five stages, thus making it a great tool to use. It also caters to a variety of topics including Determining The Time Perspective, Collecting The Data, Estimating The Results. Download this PPT design now to present a convincing pitch that not only emphasizes the topic but also showcases your presentation skills.
Pay Student Loans Early Calculator In Powerpoint And Google Slides Cpb
Introducing our well-designed Pay Student Loans Early Calculator In Powerpoint And Google Slides Cpb. This PowerPoint design presents information on topics like Pay Student Loans Early Calculator. As it is predesigned it helps boost your confidence level. It also makes you a better presenter because of its high-quality content and graphics. This PPT layout can be downloaded and used in different formats like PDF, PNG, and JPG. Not only this, it is available in both Standard Screen and Widescreen aspect ratios for your convenience. Therefore, click on the download button now to persuade and impress your audience. Our Pay Student Loans Early Calculator In Powerpoint And Google Slides Cpb are topically designed to provide an attractive backdrop to any subject. Use them to look like a presentation pro.
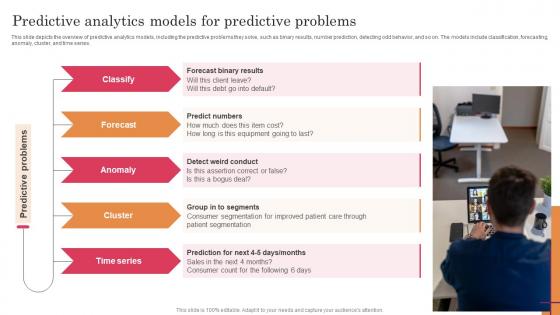
Predictive Analytics Models For Predictive Predictive Analytics For Improved Structure Pdf
This slide depicts the overview of predictive analytics models, including the predictive problems they solve, such as binary results, number prediction, detecting odd behavior, and so on. The models include classification, forecasting, anomaly, cluster, and time series. This Predictive Analytics Models For Predictive Predictive Analytics For Improved Structure Pdf from Slidegeeks makes it easy to present information on your topic with precision. It provides customization options, so you can make changes to the colors, design, graphics, or any other component to create a unique layout. It is also available for immediate download, so you can begin using it right away. Slidegeeks has done good research to ensure that you have everything you need to make your presentation stand out. Make a name out there for a brilliant performance. This slide depicts the overview of predictive analytics models, including the predictive problems they solve, such as binary results, number prediction, detecting odd behavior, and so on. The models include classification, forecasting, anomaly, cluster, and time series.
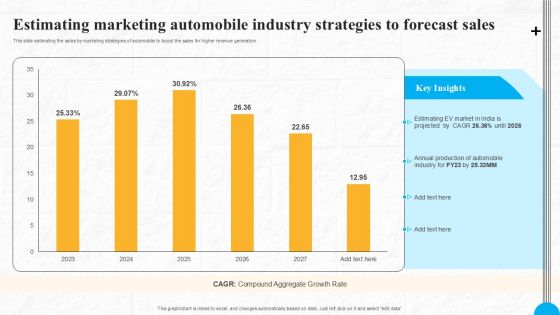
Estimating Marketing Automobile Industry Strategies To Forecast Sales Professional PDF
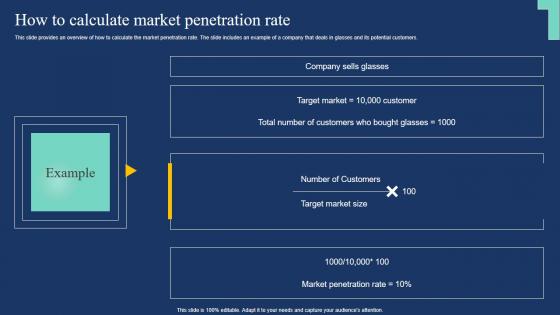
How To Calculate Market Penetration Rate Market Expansion Tactic Introduction Pdf
This slide provides an overview of how to calculate the market penetration rate. The slide includes an example of a company that deals in glasses and its potential customers. Coming up with a presentation necessitates that the majority of the effort goes into the content and the message you intend to convey. The visuals of a PowerPoint presentation can only be effective if it supplements and supports the story that is being told. Keeping this in mind our experts created How To Calculate Market Penetration Rate Market Expansion Tactic Introduction Pdf to reduce the time that goes into designing the presentation. This way, you can concentrate on the message while our designers take care of providing you with the right template for the situation. This slide provides an overview of how to calculate the market penetration rate. The slide includes an example of a company that deals in glasses and its potential customers.

Calculation For Food Servings At Restaurant Strategic Guide To Launching Ppt Slides
This slide represents calculations for food servings at family-style restaurants. It includes details regarding assumptions, batches required, total customers, etc.Create an editable Calculation For Food Servings At Restaurant Strategic Guide To Launching Ppt Slides that communicates your idea and engages your audience. Whether you are presenting a business or an educational presentation, pre-designed presentation templates help save time. Calculation For Food Servings At Restaurant Strategic Guide To Launching Ppt Slides is highly customizable and very easy to edit, covering many different styles from creative to business presentations. Slidegeeks has creative team members who have crafted amazing templates. So, go and get them without any delay. This slide represents calculations for food servings at family-style restaurants. It includes details regarding assumptions, batches required, total customers, etc.
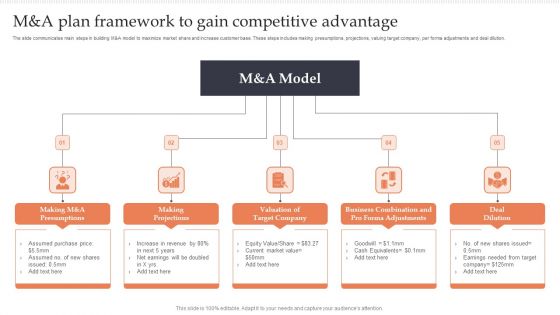
M And A Plan Framework To Gain Competitive Advantage Microsoft PDF
The slide communicates main steps in building MandA model to maximize market share and increase customer base. These steps includes making presumptions, projections, valuing target company, per forma adjustments and deal dilution.Persuade your audience using this M And A Plan Framework To Gain Competitive Advantage Microsoft PDF. This PPT design covers five stages, thus making it a great tool to use. It also caters to a variety of topics including Making Projections, Target Company, Business Combination. Download this PPT design now to present a convincing pitch that not only emphasizes the topic but also showcases your presentation skills.

Import And Export Price Indices To Calculate Strategies For Inflation A Tactical Guide Fin SS V
This slide shows step by step process which can be used to calculate inflation rate by using import and export price indices. It includes stages such as select year, collect data, calculate export and import price index and interpret results. This Import And Export Price Indices To Calculate Strategies For Inflation A Tactical Guide Fin SS V is perfect for any presentation, be it in front of clients or colleagues. It is a versatile and stylish solution for organizing your meetings. The Import And Export Price Indices To Calculate Strategies For Inflation A Tactical Guide Fin SS V features a modern design for your presentation meetings. The adjustable and customizable slides provide unlimited possibilities for acing up your presentation. Slidegeeks has done all the homework before launching the product for you. So, do not wait, grab the presentation templates today This slide shows step by step process which can be used to calculate inflation rate by using import and export price indices. It includes stages such as select year, collect data, calculate export and import price index and interpret results.
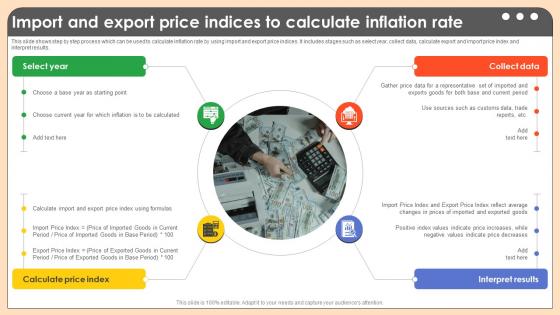
Import And Export Price Indices To Calculate Comprehensive Guide On Inflation Control CM SS V
This slide shows step by step process which can be used to calculate inflation rate by using import and export price indices. It includes stages such as select year, collect data, calculate export and import price index and interpret results. This Import And Export Price Indices To Calculate Comprehensive Guide On Inflation Control CM SS V is perfect for any presentation, be it in front of clients or colleagues. It is a versatile and stylish solution for organizing your meetings. The Import And Export Price Indices To Calculate Comprehensive Guide On Inflation Control CM SS V features a modern design for your presentation meetings. The adjustable and customizable slides provide unlimited possibilities for acing up your presentation. Slidegeeks has done all the homework before launching the product for you. So, do not wait, grab the presentation templates today This slide shows step by step process which can be used to calculate inflation rate by using import and export price indices. It includes stages such as select year, collect data, calculate export and import price index and interpret results.
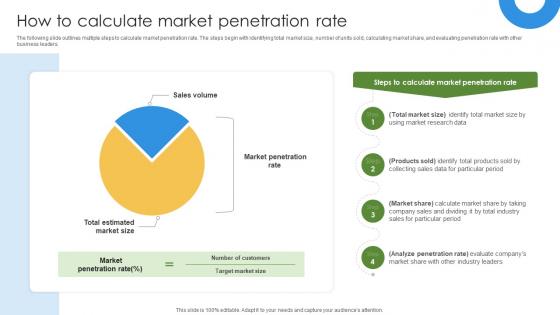
Marketing Growth Strategy How To Calculate Market Penetration Rate Strategy SS V
The following slide outlines multiple steps to calculate market penetration rate. The steps begin with identifying total market size, number of units sold, calculating market share, and evaluating penetration rate with other business leaders. If you are looking for a format to display your unique thoughts, then the professionally designed Marketing Growth Strategy How To Calculate Market Penetration Rate Strategy SS V is the one for you. You can use it as a Google Slides template or a PowerPoint template. Incorporate impressive visuals, symbols, images, and other charts. Modify or reorganize the text boxes as you desire. Experiment with shade schemes and font pairings. Alter, share or cooperate with other people on your work. Download Marketing Growth Strategy How To Calculate Market Penetration Rate Strategy SS V and find out how to give a successful presentation. Present a perfect display to your team and make your presentation unforgettable. The following slide outlines multiple steps to calculate market penetration rate. The steps begin with identifying total market size, number of units sold, calculating market share, and evaluating penetration rate with other business leaders.
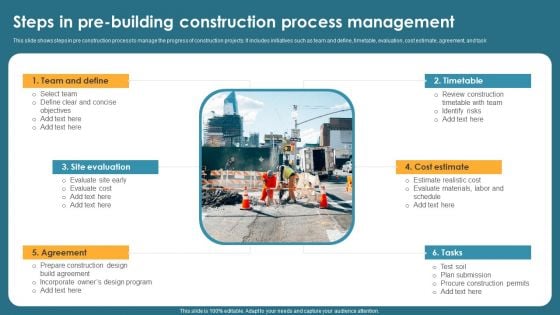
Steps In Pre Building Construction Process Management Rules PDF
This slide shows steps in pre construction process to manage the progress of construction projects. It includes initiatives such as team and define, timetable, evaluation, cost estimate, agreement, and task. Persuade your audience using this Steps In Pre Building Construction Process Management Rules PDF. This PPT design covers six stages, thus making it a great tool to use. It also caters to a variety of topics including Team Define, Agreement, Cost Estimate. Download this PPT design now to present a convincing pitch that not only emphasizes the topic but also showcases your presentation skills.
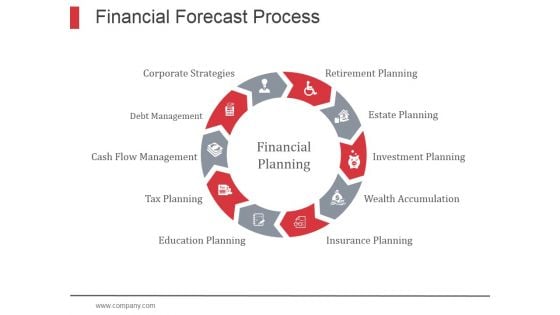
Financial Forecast Process Ppt PowerPoint Presentation Designs
This is a financial forecast process ppt powerpoint presentation designs. This is a ten stage process. The stages in this process are financial, forecast, commercial process, economic process.

Steps To Calculate Inflation Using Asset Price Comprehensive Guide On Inflation Control CM SS V
This slide shows step by step process which can be used to calculate inflation rate by using asset price indices. It includes stages such as select year, identify assets,, collect price data and interpret results. Get a simple yet stunning designed Steps To Calculate Inflation Using Asset Price Comprehensive Guide On Inflation Control CM SS V. It is the best one to establish the tone in your meetings. It is an excellent way to make your presentations highly effective. So, download this PPT today from Slidegeeks and see the positive impacts. Our easy-to-edit Steps To Calculate Inflation Using Asset Price Comprehensive Guide On Inflation Control CM SS V can be your go-to option for all upcoming conferences and meetings. So, what are you waiting for Grab this template today. This slide shows step by step process which can be used to calculate inflation rate by using asset price indices. It includes stages such as select year, identify assets,, collect price data and interpret results.
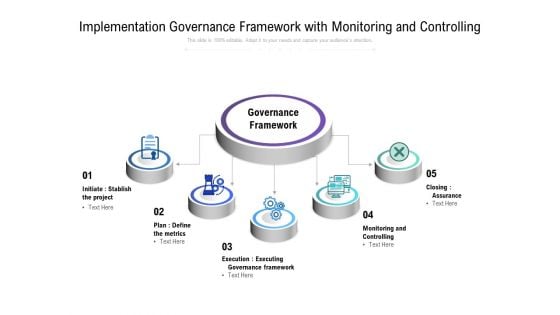
Implementation Governance Framework With Monitoring And Controlling Ppt PowerPoint Presentation Model Design Inspiration PDF
Presenting this set of slides with name implementation governance framework with monitoring and controlling ppt powerpoint presentation model design inspiration pdf. This is a five stage process. The stages in this process are governance framework, initiate stablish the project, plan define the metrics, execution executing governance framework, monitoring and controlling, closing assurance. This is a completely editable PowerPoint presentation and is available for immediate download. Download now and impress your audience.

Six Stage Process To Calculate Inflation Rate By Strategies For Inflation A Tactical Guide Fin SS V
This slide shows step by step process which can be used to calculate inflation rate by using ECI. It includes stages such as select year, collect data, calculate ECI for wages and benefits and interpret results. Get a simple yet stunning designed Six Stage Process To Calculate Inflation Rate By Strategies For Inflation A Tactical Guide Fin SS V. It is the best one to establish the tone in your meetings. It is an excellent way to make your presentations highly effective. So, download this PPT today from Slidegeeks and see the positive impacts. Our easy-to-edit Six Stage Process To Calculate Inflation Rate By Strategies For Inflation A Tactical Guide Fin SS V can be your go-to option for all upcoming conferences and meetings. So, what are you waiting for Grab this template today. This slide shows step by step process which can be used to calculate inflation rate by using ECI. It includes stages such as select year, collect data, calculate ECI for wages and benefits and interpret results.
Cash Flow Icon To Estimating Sales And Expenses Portrait Pdf
Showcasing this set of slides titled Cash Flow Icon To Estimating Sales And Expenses Portrait Pdf. The topics addressed in these templates are Cash Flow Icon, Estimating Sales And Expenses. All the content presented in this PPT design is completely editable. Download it and make adjustments in color, background, font etc. as per your unique business setting. Our Cash Flow Icon To Estimating Sales And Expenses Portrait Pdf are topically designed to provide an attractive backdrop to any subject. Use them to look like a presentation pro.
Estimating Cash Flow Icon For Service Firms Mockup Pdf
Pitch your topic with ease and precision using this Estimating Cash Flow Icon For Service Firms Mockup Pdf. This layout presents information on Estimating Cash Flow, Icon For Service Firms. It is also available for immediate download and adjustment. So, changes can be made in the color, design, graphics or any other component to create a unique layout. Our Estimating Cash Flow Icon For Service Firms Mockup Pdf are topically designed to provide an attractive backdrop to any subject. Use them to look like a presentation pro.

Steps To Calculate Inflation Using Producer Price Index Strategies For Inflation A Tactical Guide Fin SS V
This slide shows step by step process which can be used to calculate inflation rate by using producer price index. It includes stages such as select year, determine goods, gather price data, calculate price index, etc. Slidegeeks is here to make your presentations a breeze with Steps To Calculate Inflation Using Producer Price Index Strategies For Inflation A Tactical Guide Fin SS V With our easy-to-use and customizable templates, you can focus on delivering your ideas rather than worrying about formatting. With a variety of designs to choose from, you are sure to find one that suits your needs. And with animations and unique photos, illustrations, and fonts, you can make your presentation pop. So whether you are giving a sales pitch or presenting to the board, make sure to check out Slidegeeks first This slide shows step by step process which can be used to calculate inflation rate by using producer price index. It includes stages such as select year, determine goods, gather price data, calculate price index, etc.
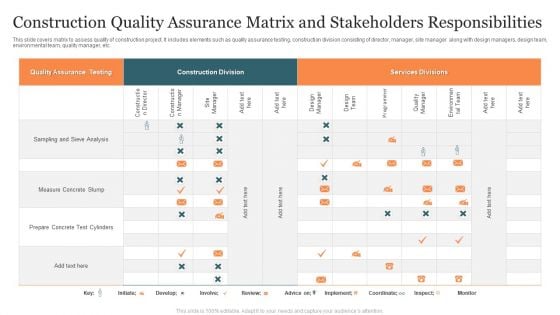
Construction Quality Assurance Matrix And Stakeholders Responsibilities Information PDF
This slide covers matrix to assess quality of construction project. It includes elements such as quality assurance testing, construction division consisting of director, manager, site manager along with design managers, design team, environmental team, quality manager, etc. Showcasing this set of slides titled Construction Quality Assurance Matrix And Stakeholders Responsibilities Information PDF. The topics addressed in these templates are Quality Assurance Testing, Construction Division, Services Divisions. All the content presented in this PPT design is completely editable. Download it and make adjustments in color, background, font etc. as per your unique business setting.
Estimated Average Requirement In Powerpoint And Google Slides Cpb
Introducing our well designed Estimated Average Requirement In Powerpoint And Google Slides Cpb. This PowerPoint design presents information on topics like Estimated Average Requirement. As it is predesigned it helps boost your confidence level. It also makes you a better presenter because of its high quality content and graphics. This PPT layout can be downloaded and used in different formats like PDF, PNG, and JPG. Not only this, it is available in both Standard Screen and Widescreen aspect ratios for your convenience. Therefore, click on the download button now to persuade and impress your audience. Our Estimated Average Requirement In Powerpoint And Google Slides Cpb are topically designed to provide an attractive backdrop to any subject. Use them to look like a presentation pro.

Car Insurance Cost Estimator In Powerpoint And Google Slides Cpb
Introducing our well designed Car Insurance Cost Estimator In Powerpoint And Google Slides Cpb. This PowerPoint design presents information on topics like Car Insurance Cost Estimator. As it is predesigned it helps boost your confidence level. It also makes you a better presenter because of its high quality content and graphics. This PPT layout can be downloaded and used in different formats like PDF, PNG, and JPG. Not only this, it is available in both Standard Screen and Widescreen aspect ratios for your convenience. Therefore, click on the download button now to persuade and impress your audience. Our Car Insurance Cost Estimator In Powerpoint And Google Slides Cpb are topically designed to provide an attractive backdrop to any subject. Use them to look like a presentation pro.
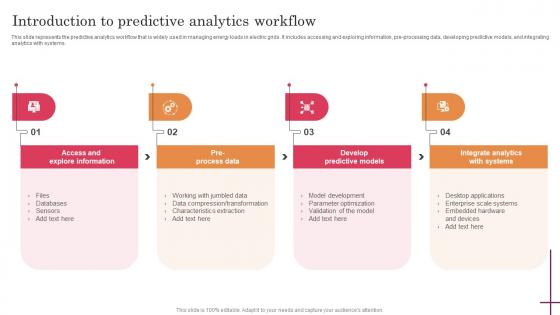
Introduction To Predictive Analytics Workflow Predictive Analytics For Improved Designs Pdf
This slide represents the predictive analytics workflow that is widely used in managing energy loads in electric grids. It includes accessing and exploring information, pre-processing data, developing predictive models, and integrating analytics with systems. Present like a pro with Introduction To Predictive Analytics Workflow Predictive Analytics For Improved Designs Pdf Create beautiful presentations together with your team, using our easy-to-use presentation slides. Share your ideas in real-time and make changes on the fly by downloading our templates. So whether you are in the office, on the go, or in a remote location, you can stay in sync with your team and present your ideas with confidence. With Slidegeeks presentation got a whole lot easier. Grab these presentations today. This slide represents the predictive analytics workflow that is widely used in managing energy loads in electric grids. It includes accessing and exploring information, pre-processing data, developing predictive models, and integrating analytics with systems.
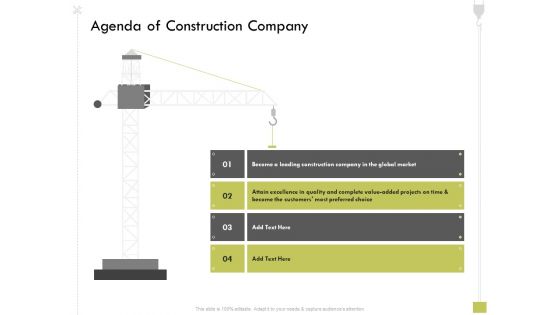
Civil Contractors Agenda Of Construction Company Ppt Model Master Slide PDF
Presenting civil contractors agenda of construction company ppt model master slide pdf to provide visual cues and insights. Share and navigate important information on four stages that need your due attention. This template can be used to pitch topics like leading construction company, global market, attain excellence, quality and complete value added projects, time. In addtion, this PPT design contains high-resolution images, graphics, etc, that are easily editable and available for immediate download.
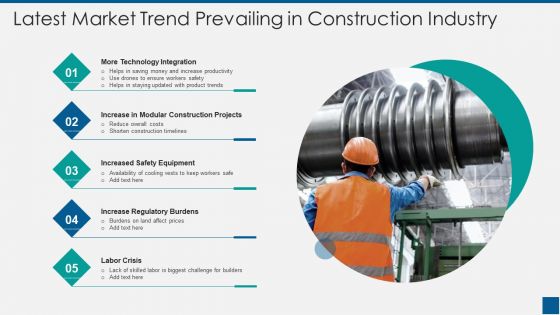
Latest Market Trend Prevailing In Construction Industry Ppt PowerPoint Presentation Gallery Graphic Images PDF
Pitch your topic with ease and precision using this latest market trend prevailing in construction industry ppt powerpoint presentation gallery graphic images pdf. This layout presents information on more technology integration, increase in modular construction projects, increased safety equipment, increase regulatory burdens, labor crisis. It is also available for immediate download and adjustment. So, changes can be made in the color, design, graphics or any other component to create a unique layout.

Website Design Booklet Trifold
Impress your audience with a professional touch using our Website Design Booklet Trifold. You can easily customize the template and make it your own. Our designers have created a visually stunning and easy-to-use template that will save you time and effort. Whether it is a business pitch or a personal project, our template will elevate your presentation game.
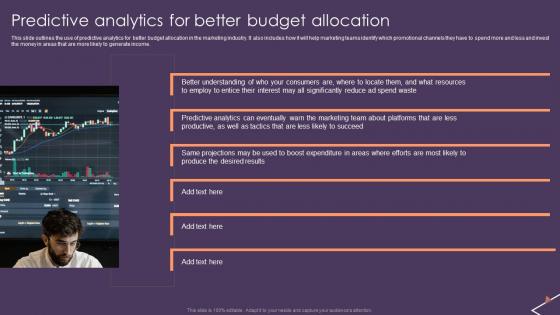
Predictive Analytics For Empowering Predictive Analytics For Better Budget Allocation Elements Pdf
This slide outlines the use of predictive analytics for better budget allocation in the marketing industry. It also includes how it will help marketing teams identify which promotional channels they have to spend more and less and invest the money in areas that are more likely to generate income. Crafting an eye-catching presentation has never been more straightforward. Let your presentation shine with this tasteful yet straightforward Predictive Analytics For Empowering Predictive Analytics For Better Budget Allocation Elements Pdf template. It offers a minimalistic and classy look that is great for making a statement. The colors have been employed intelligently to add a bit of playfulness while still remaining professional. Construct the ideal Predictive Analytics For Empowering Predictive Analytics For Better Budget Allocation Elements Pdf that effortlessly grabs the attention of your audience. Begin now and be certain to wow your customers. This slide outlines the use of predictive analytics for better budget allocation in the marketing industry. It also includes how it will help marketing teams identify which promotional channels they have to spend more and less and invest the money in areas that are more likely to generate income.
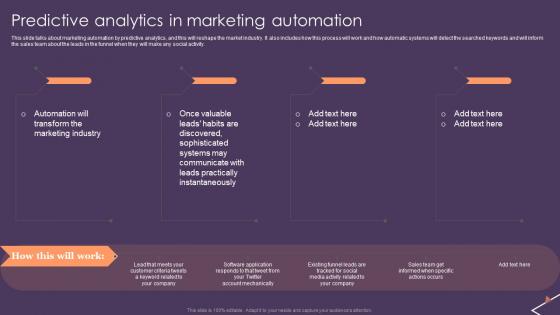
Predictive Analytics For Empowering Predictive Analytics In Marketing Automation Designs Pdf
This slide talks about marketing automation by predictive analytics, and this will reshape the market industry. It also includes how this process will work and how automatic systems will detect the searched keywords and will inform the sales team about the leads in the funnel when they will make any social activity. The best PPT templates are a great way to save time, energy, and resources. Slidegeeks have 100 percent editable powerpoint slides making them incredibly versatile. With these quality presentation templates, you can create a captivating and memorable presentation by combining visually appealing slides and effectively communicating your message. Download Predictive Analytics For Empowering Predictive Analytics In Marketing Automation Designs Pdf from Slidegeeks and deliver a wonderful presentation. This slide talks about marketing automation by predictive analytics, and this will reshape the market industry. It also includes how this process will work and how automatic systems will detect the searched keywords and will inform the sales team about the leads in the funnel when they will make any social activity.

Ethereum Price Prediction In Powerpoint And Google Slides Cpb
Presenting our innovatively-designed set of slides titled Ethereum Price Prediction In Powerpoint And Google Slides Cpb. This completely editable PowerPoint graphic exhibits Ethereum Price Prediction that will help you convey the message impactfully. It can be accessed with Google Slides and is available in both standard screen and widescreen aspect ratios. Apart from this, you can download this well-structured PowerPoint template design in different formats like PDF, JPG, and PNG. So, click the download button now to gain full access to this PPT design. Our Ethereum Price Prediction In Powerpoint And Google Slides Cpb are topically designed to provide an attractive backdrop to any subject. Use them to look like a presentation pro.
Wave Prediction In Powerpoint And Google Slides Cpb
Presenting our innovatively designed set of slides titled Wave Prediction In Powerpoint And Google Slides Cpb. This completely editable PowerPoint graphic exhibits Wave Prediction that will help you convey the message impactfully. It can be accessed with Google Slides and is available in both standard screen and widescreen aspect ratios. Apart from this, you can download this well structured PowerPoint template design in different formats like PDF, JPG, and PNG. So, click the download button now to gain full access to this PPT design. Our Wave Prediction In Powerpoint And Google Slides Cpb are topically designed to provide an attractive backdrop to any subject. Use them to look like a presentation pro.
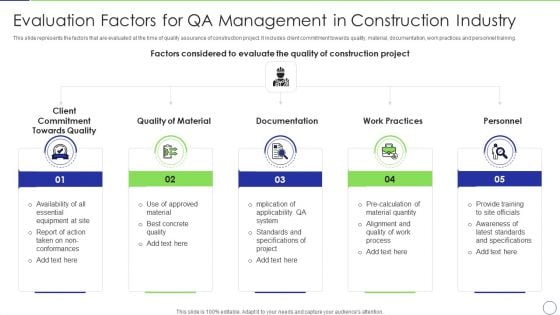
Evaluation Factors For Qa Management In Construction Industry Topics PDF
This slide represents the factors that are evaluated at the time of quality assurance of construction project. It includes client commitment towards quality, material, documentation, work practices and personnel training. Persuade your audience using this evaluation factors for qa management in construction industry topics pdf. This PPT design covers five stages, thus making it a great tool to use. It also caters to a variety of topics including client commitment towards quality, quality of material, documentation, work practices, personnel. Download this PPT design now to present a convincing pitch that not only emphasizes the topic but also showcases your presentation skills.
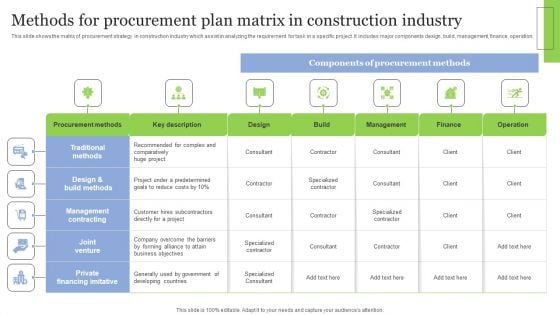
Methods For Procurement Plan Matrix In Construction Industry Structure PDF
This slide shows the matrix of procurement strategy in construction industry which assist in analyzing the requirement for task in a specific project. It includes major components design, build, management, finance, operation. Showcasing this set of slides titled Methods For Procurement Plan Matrix In Construction Industry Structure PDF. The topics addressed in these templates are Traditional Methods, Management Contracting, Private Financing Imitative. All the content presented in this PPT design is completely editable. Download it and make adjustments in color, background, font etc. as per your unique business setting.
Construction Defect Claims Tracking Top 3 Countries Graphics PDF
The slide shows the forecasted vehicle sale of company ABC construction company in top three countries United States, United Kingdom, India. For each country, it provides number of number of projects, number of defect claims in next five years 2021 2025. Deliver and pitch your topic in the best possible manner with this construction defect claims tracking top 3 countries graphics pdf. Use them to share invaluable insights on construction defect claims tracking top 3 countries and impress your audience. This template can be altered and modified as per your expectations. So, grab it now.
Construction Defect Claims Tracking Top 3 Countries Guidelines PDF
The slide shows the forecasted vehicle sale of company ABC construction company in top three countries United States, United Kingdom, India. For each country, it provides number of number of projects, number of defect claims in next five years 2021 to 2025 Deliver and pitch your topic in the best possible manner with this construction defect claims tracking top 3 countries guidelines pdf. Use them to share invaluable insights on construction defect claims tracking top 3 countries and impress your audience. This template can be altered and modified as per your expectations. So, grab it now.
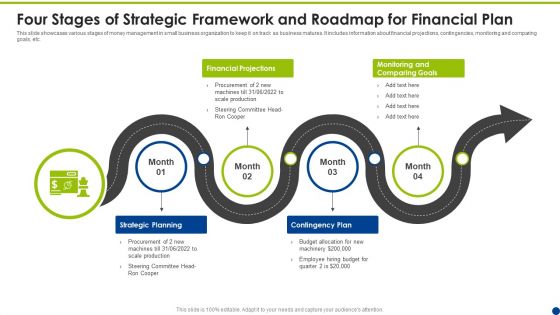
Four Stages Of Strategic Framework And Roadmap For Financial Plan Ppt Files PDF
This slide showcases various stages of money management in small business organization to keep it on track as business matures. It includes information about financial projections, contingencies, monitoring and comparing goals, etc. Presenting Four Stages Of Strategic Framework And Roadmap For Financial Plan Ppt Files PDF to dispense important information. This template comprises four stages. It also presents valuable insights into the topics including Financial Projections, Strategic Planning, Contingency Plan. This is a completely customizable PowerPoint theme that can be put to use immediately. So, download it and address the topic impactfully.
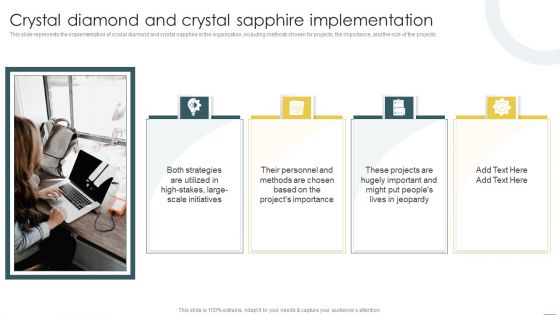
Crystal Methods In Agile Framework Crystal Diamond And Crystal Sapphire Implementation Sample PDF
This slide represents the implementation of crystal diamond and crystal sapphire in the organization, including methods chosen for projects, the importance, and the size of the projects. Slidegeeks is one of the best resources for PowerPoint templates. You can download easily and regulate Crystal Methods In Agile Framework Crystal Diamond And Crystal Sapphire Implementation Sample PDF for your personal presentations from our wonderful collection. A few clicks is all it takes to discover and get the most relevant and appropriate templates. Use our Templates to add a unique zing and appeal to your presentation and meetings. All the slides are easy to edit and you can use them even for advertisement purposes.
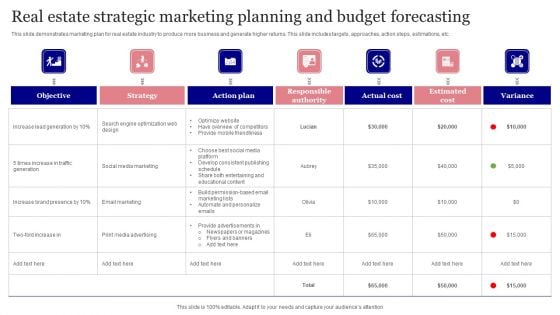
Real Estate Strategic Marketing Planning And Budget Forecasting Guidelines PDF
This slide demonstrates marketing plan for real estate industry to produce more business and generate higher returns. This slide includes targets, approaches, action steps, estimations, etc. Showcasing this set of slides titled Real Estate Strategic Marketing Planning And Budget Forecasting Guidelines PDF. The topics addressed in these templates are Objective, Strategy, Action Plan. All the content presented in this PPT design is completely editable. Download it and make adjustments in color, background, font etc. as per your unique business setting.
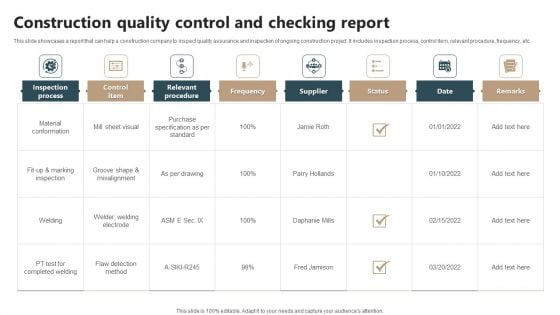
Construction Quality Control And Checking Report Ideas PDF
This slide showcases a report that can help a construction company to inspect quality assurance and inspection of ongoing construction project. It includes inspection process, control item, relevant procedure, frequency, etc. Showcasing this set of slides titled Construction Quality Control And Checking Report Ideas PDF. The topics addressed in these templates are Relevant Procedure, Supplier, Inspection Process. All the content presented in this PPT design is completely editable. Download it and make adjustments in color, background, font etc. as per your unique business setting.
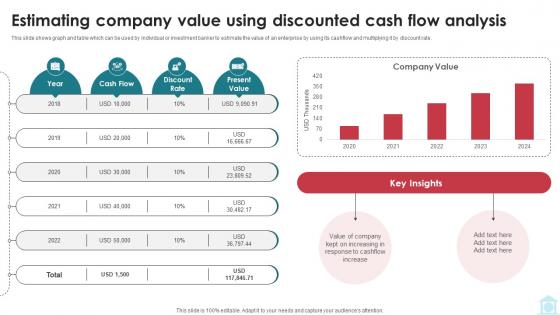
Estimating Company Value Using Discounted Cash Mastering Investment Banking Fin SS V
This slide shows graph and table which can be used by individual or investment banker to estimate the value of an enterprise by using its cashflow and multiplying it by discount rate. Coming up with a presentation necessitates that the majority of the effort goes into the content and the message you intend to convey. The visuals of a PowerPoint presentation can only be effective if it supplements and supports the story that is being told. Keeping this in mind our experts created Estimating Company Value Using Discounted Cash Mastering Investment Banking Fin SS V to reduce the time that goes into designing the presentation. This way, you can concentrate on the message while our designers take care of providing you with the right template for the situation. This slide shows graph and table which can be used by individual or investment banker to estimate the value of an enterprise by using its cashflow and multiplying it by discount rate.

Estimating Company Value Using Investment Banking Simplified Functions Fin SS V
This slide shows graph and table which can be used by individual or investment banker to estimate the value of an enterprise by using its cashflow and multiplying it by discount rate. Coming up with a presentation necessitates that the majority of the effort goes into the content and the message you intend to convey. The visuals of a PowerPoint presentation can only be effective if it supplements and supports the story that is being told. Keeping this in mind our experts created Estimating Company Value Using Investment Banking Simplified Functions Fin SS V to reduce the time that goes into designing the presentation. This way, you can concentrate on the message while our designers take care of providing you with the right template for the situation. This slide shows graph and table which can be used by individual or investment banker to estimate the value of an enterprise by using its cashflow and multiplying it by discount rate.
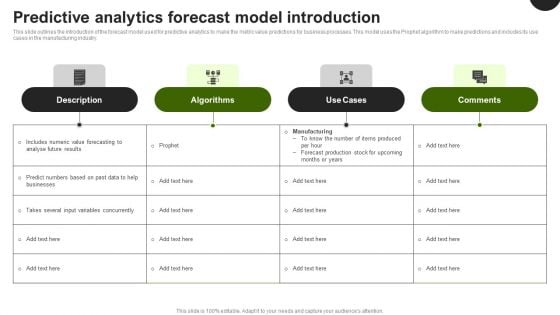
Predictive Analytics In The Age Of Big Data Predictive Analytics Forecast Model Introduction Information PDF
This slide outlines the introduction of the forecast model used for predictive analytics to make the metric value predictions for business processes. This model uses the Prophet algorithm to make predictions and includes its use cases in the manufacturing industry. Formulating a presentation can take up a lot of effort and time, so the content and message should always be the primary focus. The visuals of the PowerPoint can enhance the presenters message, so our Predictive Analytics In The Age Of Big Data Predictive Analytics Forecast Model Introduction Information PDF was created to help save time. Instead of worrying about the design, the presenter can concentrate on the message while our designers work on creating the ideal templates for whatever situation is needed. Slidegeeks has experts for everything from amazing designs to valuable content, we have put everything into Predictive Analytics In The Age Of Big Data Predictive Analytics Forecast Model Introduction Information PDF
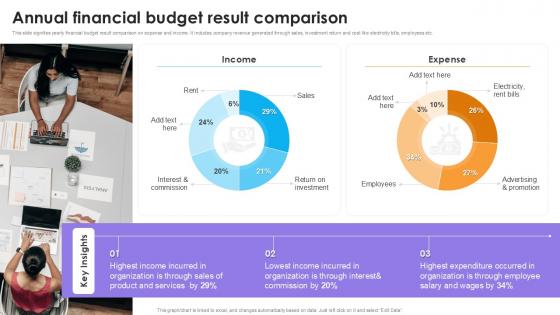
Annual Financial Budget Result Comparison
Create an editable Annual Financial Budget Result Comparison that communicates your idea and engages your audience. Whether you are presenting a business or an educational presentation, pre-designed presentation templates help save time. Annual Financial Budget Result Comparison is highly customizable and very easy to edit, covering many different styles from creative to business presentations. Slidegeeks has creative team members who have crafted amazing templates. So, go and get them without any delay. This slide represents yearly financial budget result comparison on expense and income. It involves company revenue generated through sales, investment return and cost like electricity bills, employees etc.
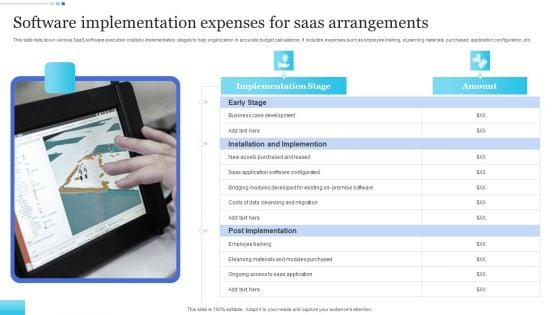
Software Implementation Expenses For Saas Arrangements Brochure PDF
This slide lists down various SaaS software execution costs by implementation stages to help organization in accurate budget calculations. It includes expenses such as employee training, eLearning materials purchased, application configuration, etc. Presenting Software Implementation Expenses For Saas Arrangements Brochure PDF to dispense important information. This template comprises one stages. It also presents valuable insights into the topics including Implementation Stage, Installation And Implementation, Post Implementation. This is a completely customizable PowerPoint theme that can be put to use immediately. So, download it and address the topic impactfully.
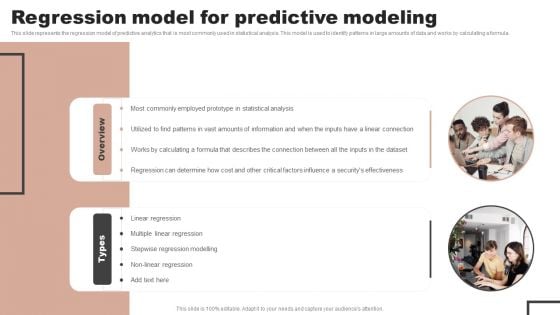
Forecast Analysis Technique IT Regression Model For Predictive Modeling Mockup PDF
This slide represents the regression model of predictive analytics that is most commonly used in statistical analysis. This model is used to identify patterns in large amounts of data and works by calculating a formula. Crafting an eye catching presentation has never been more straightforward. Let your presentation shine with this tasteful yet straightforward Forecast Analysis Technique IT Regression Model For Predictive Modeling Mockup PDF template. It offers a minimalistic and classy look that is great for making a statement. The colors have been employed intelligently to add a bit of playfulness while still remaining professional. Construct the ideal Forecast Analysis Technique IT Regression Model For Predictive Modeling Mockup PDF that effortlessly grabs the attention of your audience Begin now and be certain to wow your customers.
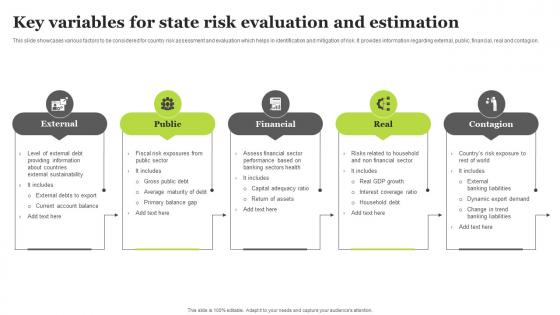
Key Variables For State Risk Evaluation And Estimation Graphics Pdf
This slide showcases various factors to be considered for country risk assessment and evaluation which helps in identification and mitigation of risk. It provides information regarding external, public, financial, real and contagion. Showcasing this set of slides titled Key Variables For State Risk Evaluation And Estimation Graphics Pdf. The topics addressed in these templates are External, Financial, Contagion. All the content presented in this PPT design is completely editable. Download it and make adjustments in color, background, font etc. as per your unique business setting. This slide showcases various factors to be considered for country risk assessment and evaluation which helps in identification and mitigation of risk. It provides information regarding external, public, financial, real and contagion.
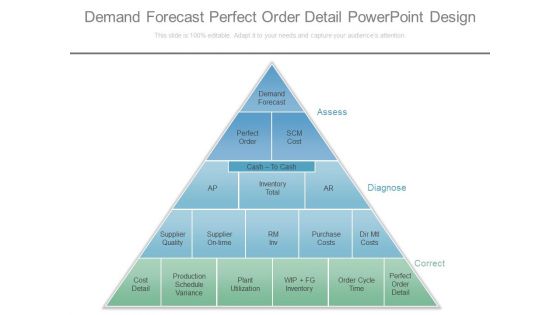
Demand Forecast Perfect Order Detail Powerpoint Design
This is a demand forecast perfect order detail powerpoint design. This is a five stage process. The stages in this process are demand forecast, perfect order, scm cost, assess, diagnose, correct, cash to cash, ap, inventory total, ar, supplier quality, supplier on time, rm inv, purchase costs, dir mtl costs, cost detail, production schedule variance, plant utilization, wip fg inventory, order cycle time, perfect order detail.
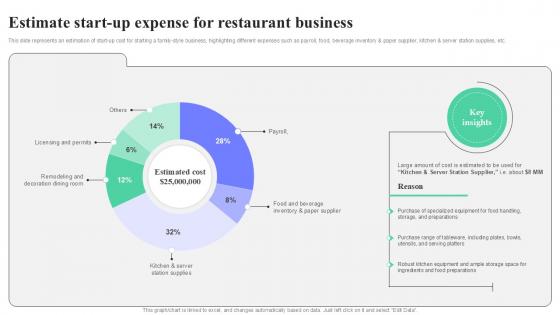
Estimate Start Up Expense For Restaurant Business Strategic Guide To Launching Ppt Sample
This slide represents an estimation of start-up cost for starting a family-style business, highlighting different expenses such as payroll, food, beverage inventory and paper supplier, kitchen and server station supplies, etc. Get a simple yet stunning designed Estimate Start Up Expense For Restaurant Business Strategic Guide To Launching Ppt Sample. It is the best one to establish the tone in your meetings. It is an excellent way to make your presentations highly effective. So, download this PPT today from Slidegeeks and see the positive impacts. Our easy-to-edit Estimate Start Up Expense For Restaurant Business Strategic Guide To Launching Ppt Sample can be your go-to option for all upcoming conferences and meetings. So, what are you waiting for Grab this template today. This slide represents an estimation of start-up cost for starting a family-style business, highlighting different expenses such as payroll, food, beverage inventory and paper supplier, kitchen and server station supplies, etc.
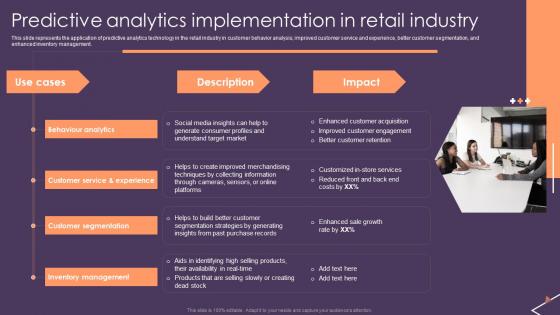
Predictive Analytics For Empowering Predictive Analytics Implementation In Retail Industry Rules Pdf
This slide represents the application of predictive analytics technology in the retail industry in customer behavior analysis, improved customer service and experience, better customer segmentation, and enhanced inventory management. Formulating a presentation can take up a lot of effort and time, so the content and message should always be the primary focus. The visuals of the PowerPoint can enhance the presenters message, so our Predictive Analytics For Empowering Predictive Analytics Implementation In Retail Industry Rules Pdf was created to help save time. Instead of worrying about the design, the presenter can concentrate on the message while our designers work on creating the ideal templates for whatever situation is needed. Slidegeeks has experts for everything from amazing designs to valuable content, we have put everything into Predictive Analytics For Empowering Predictive Analytics Implementation In Retail Industry Rules Pdf This slide represents the application of predictive analytics technology in the retail industry in customer behavior analysis, improved customer service and experience, better customer segmentation, and enhanced inventory management.


 Continue with Email

 Home
Home


