Project Costs
Enhance Customer Retention Tracking The Actual Sales Figures After Deal Finalizing Graphics Pdf
This slide provides glimpse about dashboard analysis that can help the business to track the performance of the sales team. It includes KPIs such as revenues, profit, orders placed, conversion placed, conversion rate, customers, etc. Take your projects to the next level with our ultimate collection of Enhance Customer Retention Tracking The Actual Sales Figures After Deal Finalizing Graphics Pdf. Slidegeeks has designed a range of layouts that are perfect for representing task or activity duration, keeping track of all your deadlines at a glance. Tailor these designs to your exact needs and give them a truly corporate look with your own brand colors they well make your projects stand out from the rest. This slide provides glimpse about dashboard analysis that can help the business to track the performance of the sales team. It includes KPIs such as revenues, profit, orders placed, conversion placed, conversion rate, customers, etc.
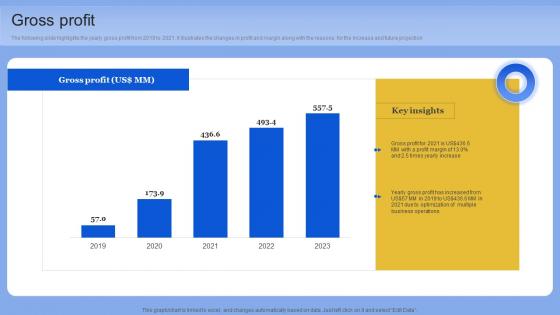
Gross Profit Data Analytics Company Outline Pictures PDF
The following slide highlights the yearly gross profit from 2019 to 2021. it illustrates the changes in profit and margin along with the reasons for the increase and future projection. Formulating a presentation can take up a lot of effort and time, so the content and message should always be the primary focus. The visuals of the PowerPoint can enhance the presenters message, so our Gross Profit Data Analytics Company Outline Pictures PDF was created to help save time. Instead of worrying about the design, the presenter can concentrate on the message while our designers work on creating the ideal templates for whatever situation is needed. Slidegeeks has experts for everything from amazing designs to valuable content, we have put everything into Gross Profit Data Analytics Company Outline Pictures PDF The following slide highlights the yearly gross profit from 2019 to 2021. it illustrates the changes in profit and margin along with the reasons for the increase and future projection
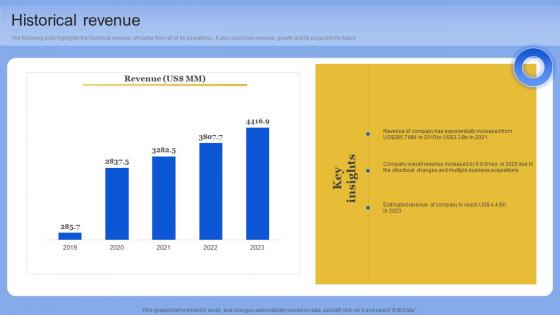
Historical Revenue Data Analytics Company Outline Information PDF
The following slide highlights the historical revenue of Kantar from all of its operations. It also describes revenue growth and its projection for future. This modern and well-arranged Historical Revenue Data Analytics Company Outline Information PDF provides lots of creative possibilities. It is very simple to customize and edit with the Powerpoint Software. Just drag and drop your pictures into the shapes. All facets of this template can be edited with Powerpoint, no extra software is necessary. Add your own material, put your images in the places assigned for them, adjust the colors, and then you can show your slides to the world, with an animated slide included. The following slide highlights the historical revenue of Kantar from all of its operations. It also describes revenue growth and its projection for future
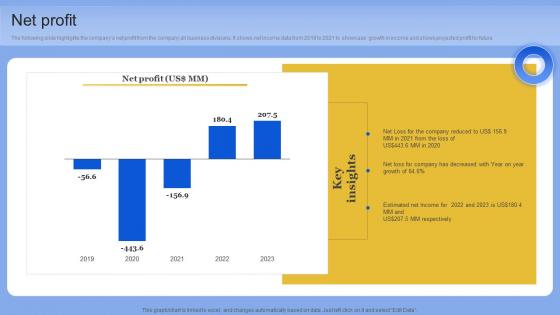
Net Profit Data Analytics Company Outline Diagrams PDF
The following slide highlights the companys net profit from the company all business divisions. It shows net income data from 2019 to 2021 to showcase growth in income and shows projected profit for future. Retrieve professionally designed Net Profit Data Analytics Company Outline Diagrams PDF to effectively convey your message and captivate your listeners. Save time by selecting pre-made slideshows that are appropriate for various topics, from business to educational purposes. These themes come in many different styles, from creative to corporate, and all of them are easily adjustable and can be edited quickly. Access them as PowerPoint templates or as Google Slides themes. You do not have to go on a hunt for the perfect presentation because Slidegeeks got you covered from everywhere. The following slide highlights the companys net profit from the company all business divisions. It shows net income data from 2019 to 2021 to showcase growth in income and shows projected profit for future
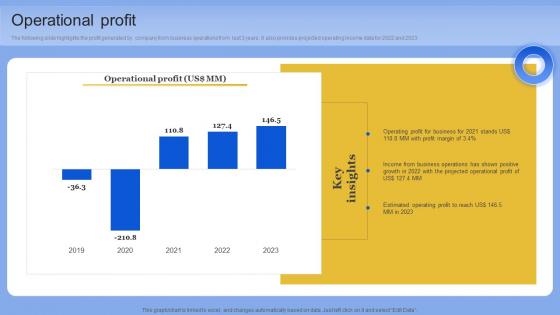
Operational Profit Data Analytics Company Outline Pictures PDF
The following slide highlights the profit generated by company from business operations from last 3 years. It also provides projected operating income data for 2022 and 2023. Slidegeeks has constructed Operational Profit Data Analytics Company Outline Pictures PDF after conducting extensive research and examination. These presentation templates are constantly being generated and modified based on user preferences and critiques from editors. Here, you will find the most attractive templates for a range of purposes while taking into account ratings and remarks from users regarding the content. This is an excellent jumping-off point to explore our content and will give new users an insight into our top-notch PowerPoint Templates. The following slide highlights the profit generated by company from business operations from last 3 years. It also provides projected operating income data for 2022 and 2023
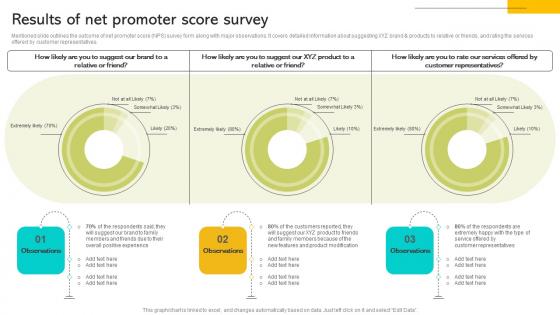
Implementing Strategies To Enhance Results Of Net Promoter Score Survey Summary PDF
Mentioned slide outlines the outcome of net promoter score NPS survey form along with major observations. It covers detailed information about suggesting XYZ brand and products to relative or friends, and rating the services offered by customer representatives. Take your projects to the next level with our ultimate collection of Implementing Strategies To Enhance Results Of Net Promoter Score Survey Summary PDF Slidegeeks has designed a range of layouts that are perfect for representing task or activity duration, keeping track of all your deadlines at a glance. Tailor these designs to your exact needs and give them a truly corporate look with your own brand colors they will make your projects stand out from the rest Mentioned slide outlines the outcome of net promoter score NPS survey form along with major observations. It covers detailed information about suggesting XYZ brand and products to relative or friends, and rating the services offered by customer representatives.
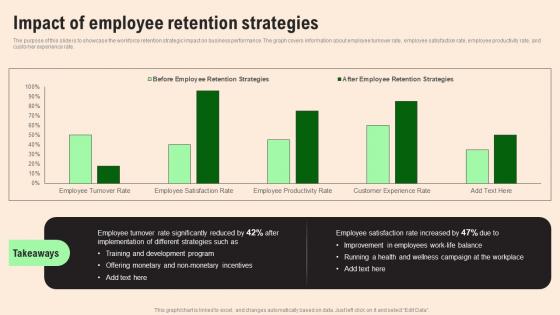
Impact Of Employee Retention HR Retention Techniques For Business Owners Structure Pdf
The purpose of this slide is to showcase the workforce retention strategic impact on business performance. The graph covers information about employee turnover rate, employee satisfaction rate, employee productivity rate, and customer experience rate. Take your projects to the next level with our ultimate collection of Impact Of Employee Retention HR Retention Techniques For Business Owners Structure Pdf. Slidegeeks has designed a range of layouts that are perfect for representing task or activity duration, keeping track of all your deadlines at a glance. Tailor these designs to your exact needs and give them a truly corporate look with your own brand colors they will make your projects stand out from the rest The purpose of this slide is to showcase the workforce retention strategic impact on business performance. The graph covers information about employee turnover rate, employee satisfaction rate, employee productivity rate, and customer experience rate.

Survey Results Depicting Enhancing Customer Service Operations Using CRM Technology Download Pdf
Following slide shows survey results to understand challenges in company billing system. It include pointers such as management issue, data manipulation, complexity, reporting concern etc. Take your projects to the next level with our ultimate collection of Survey Results Depicting Enhancing Customer Service Operations Using CRM Technology Download Pdf. Slidegeeks has designed a range of layouts that are perfect for representing task or activity duration, keeping track of all your deadlines at a glance. Tailor these designs to your exact needs and give them a truly corporate look with your own brand colors they will make your projects stand out from the rest Following slide shows survey results to understand challenges in company billing system. It include pointers such as management issue, data manipulation, complexity, reporting concern etc.
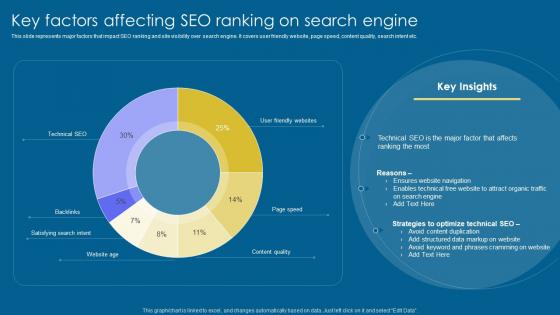
Key Factors Affecting SEO Implementation Of Digital Advertising Strategies Diagrams Pdf
This slide represents major factors that impact SEO ranking and site visibility over search engine. It covers user friendly website, page speed, content quality, search intent etc. Take your projects to the next level with our ultimate collection of Key Factors Affecting SEO Implementation Of Digital Advertising Strategies Diagrams Pdf. Slidegeeks has designed a range of layouts that are perfect for representing task or activity duration, keeping track of all your deadlines at a glance. Tailor these designs to your exact needs and give them a truly corporate look with your own brand colors they will make your projects stand out from the rest This slide represents major factors that impact SEO ranking and site visibility over search engine. It covers user friendly website, page speed, content quality, search intent etc.
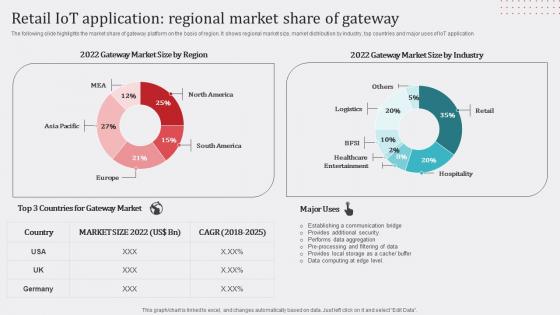
Retail IoT Application Regional Market Share Of Gateway Demonstration Pdf
The following slide highlights the market share of gateway platform on the basis of region. It shows regional market size, market distribution by industry, top countries and major uses of IoT application Take your projects to the next level with our ultimate collection of Retail IoT Application Regional Market Share Of Gateway Demonstration Pdf. Slidegeeks has designed a range of layouts that are perfect for representing task or activity duration, keeping track of all your deadlines at a glance. Tailor these designs to your exact needs and give them a truly corporate look with your own brand colors they will make your projects stand out from the rest The following slide highlights the market share of gateway platform on the basis of region. It shows regional market size, market distribution by industry, top countries and major uses of IoT application
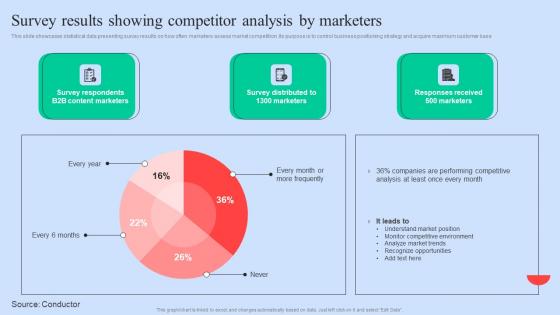
Survey Results Showing Executing Competitors Strategies To Assess Organizational Performance Download Pdf
This slide showcases statistical data presenting survey results on how often marketers assess market competition. Its purpose is to control business positioning strategy and acquire maximum customer base Take your projects to the next level with our ultimate collection of Survey Results Showing Executing Competitors Strategies To Assess Organizational Performance Download Pdf. Slidegeeks has designed a range of layouts that are perfect for representing task or activity duration, keeping track of all your deadlines at a glance. Tailor these designs to your exact needs and give them a truly corporate look with your own brand colors they will make your projects stand out from the rest This slide showcases statistical data presenting survey results on how often marketers assess market competition. Its purpose is to control business positioning strategy and acquire maximum customer base
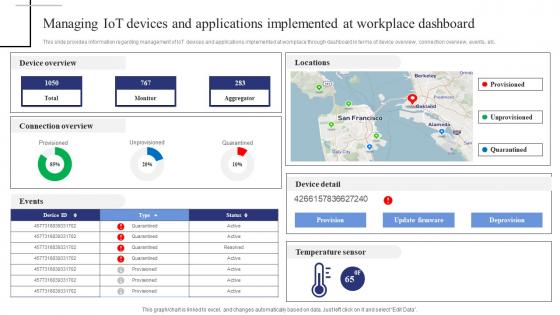
Managing Iot Devices And Applications Exploring Internet Things Themes PDF
This slide provides information regarding management of IoT devices and applications implemented at workplace through dashboard in terms of device overview, connection overview, events, etc. Take your projects to the next level with our ultimate collection of Managing Iot Devices And Applications Exploring Internet Things Themes PDF. Slidegeeks has designed a range of layouts that are perfect for representing task or activity duration, keeping track of all your deadlines at a glance. Tailor these designs to your exact needs and give them a truly corporate look with your own brand colors they will make your projects stand out from the rest This slide provides information regarding management of IoT devices and applications implemented at workplace through dashboard in terms of device overview, connection overview, events, etc.
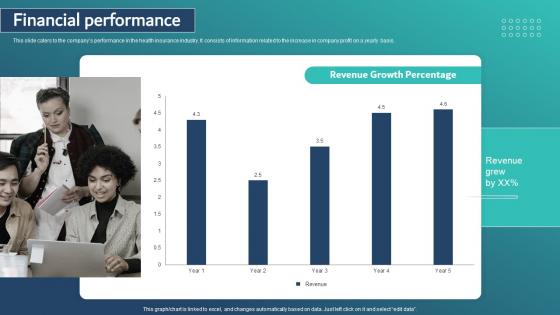
Financial Performance Healthcare Insurance App Capital Raising Pitch Deck Portrait Pdf
This slide caters to the companys performance in the health insurance industry. It consists of information related to the increase in company profit on a yearly basis. Take your projects to the next level with our ultimate collection of Financial Performance Healthcare Insurance App Capital Raising Pitch Deck Portrait Pdf. Slidegeeks has designed a range of layouts that are perfect for representing task or activity duration, keeping track of all your deadlines at a glance. Tailor these designs to your exact needs and give them a truly corporate look with your own brand colors they will make your projects stand out from the rest This slide caters to the companys performance in the health insurance industry. It consists of information related to the increase in company profit on a yearly basis.
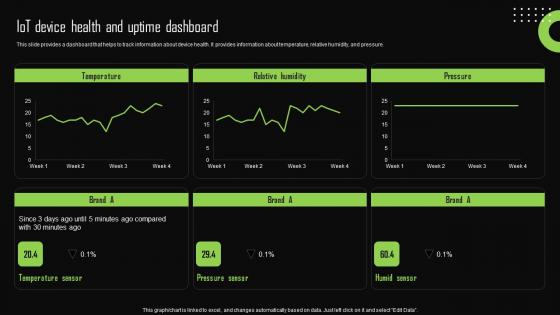
Iot Device Health And Uptime Dashboard Iot Device Management Graphics Pdf
This slide provides a dashboard that helps to track information about device health. It provides information about temperature, relative humidity, and pressure. Take your projects to the next level with our ultimate collection of Iot Device Health And Uptime Dashboard Iot Device Management Graphics Pdf. Slidegeeks has designed a range of layouts that are perfect for representing task or activity duration, keeping track of all your deadlines at a glance. Tailor these designs to your exact needs and give them a truly corporate look with your own brand colors they will make your projects stand out from the rest This slide provides a dashboard that helps to track information about device health. It provides information about temperature, relative humidity, and pressure.
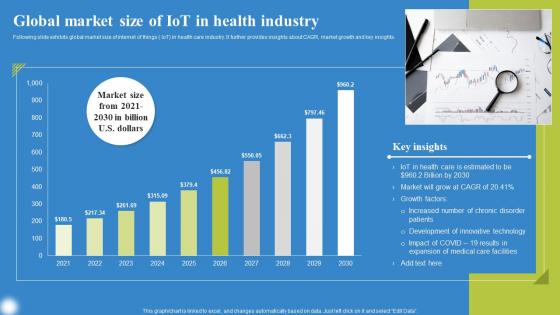
Global Market Size Of IoT In Health Deploying IoT Solutions For Enhanced Healthcare Formats Pdf
Following slide exhibits global market size of internet of things IoT in health care industry. It further provides insights about CAGR, market growth and key insights. Take your projects to the next level with our ultimate collection of Global Market Size Of IoT In Health Deploying IoT Solutions For Enhanced Healthcare Formats Pdf. Slidegeeks has designed a range of layouts that are perfect for representing task or activity duration, keeping track of all your deadlines at a glance. Tailor these designs to your exact needs and give them a truly corporate look with your own brand colors they will make your projects stand out from the rest Following slide exhibits global market size of internet of things IoT in health care industry. It further provides insights about CAGR, market growth and key insights.
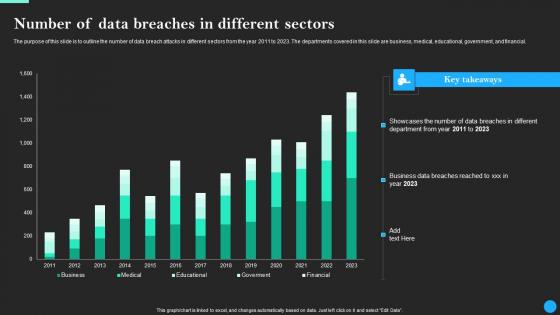
Number Of Data Breaches In Different Sectors Data Breach Prevention Microsoft Pdf
The purpose of this slide is to outline the number of data breach attacks in different sectors from the year 2011 to 2023. The departments covered in this slide are business, medical, educational, government, and financial. Take your projects to the next level with our ultimate collection of Number Of Data Breaches In Different Sectors Data Breach Prevention Microsoft Pdf. Slidegeeks has designed a range of layouts that are perfect for representing task or activity duration, keeping track of all your deadlines at a glance. Tailor these designs to your exact needs and give them a truly corporate look with your own brand colors they will make your projects stand out from the rest The purpose of this slide is to outline the number of data breach attacks in different sectors from the year 2011 to 2023. The departments covered in this slide are business, medical, educational, government, and financial.
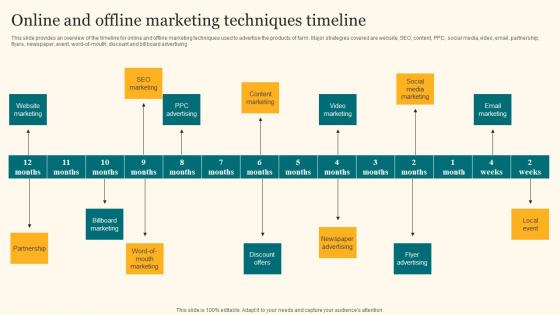
Online And Offline Marketing Techniques Timeline Agricultural Product Promotion Structure Pdf
This slide provides an overview of the timeline for online and offline marketing techniques used to advertise the products of farm. Major strategies covered are website, SEO, content, PPC, social media, video, email, partnership, flyers, newspaper, event, word-of-mouth, discount and billboard advertising. Take your projects to the next level with our ultimate collection of Online And Offline Marketing Techniques Timeline Agricultural Product Promotion Structure Pdf. Slidegeeks has designed a range of layouts that are perfect for representing task or activity duration, keeping track of all your deadlines at a glance. Tailor these designs to your exact needs and give them a truly corporate look with your own brand colors they will make your projects stand out from the rest This slide provides an overview of the timeline for online and offline marketing techniques used to advertise the products of farm. Major strategies covered are website, SEO, content, PPC, social media, video, email, partnership, flyers, newspaper, event, word-of-mouth, discount and billboard advertising.
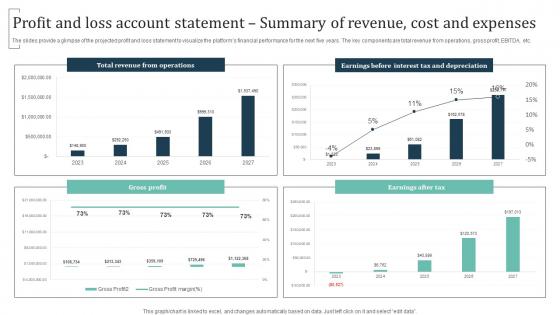
Profit And Loss Account Statement Summary Of Revenue Group Training Business Rules Pdf
The slides provide a glimpse of the projected profit and loss statement to visualize the platforms financial performance for the next five years. The key components are total revenue from operations, gross profit, EBITDA, etc. There are so many reasons you need a Profit And Loss Account Statement Summary Of Revenue Group Training Business Rules Pdf The first reason is you can not spend time making everything from scratch, Thus, Slidegeeks has made presentation templates for you too. You can easily download these templates from our website easily. The slides provide a glimpse of the projected profit and loss statement to visualize the platforms financial performance for the next five years. The key components are total revenue from operations, gross profit, EBITDA, etc.
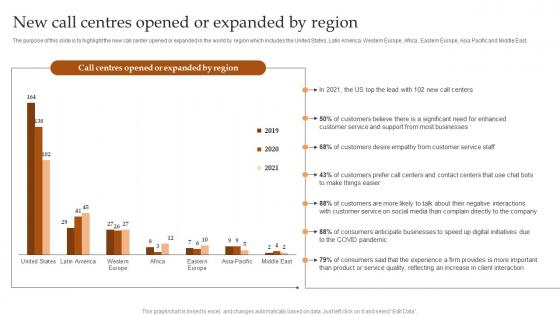
New Call Centres Opened Or Expanded By Region IT And Tech Support Business Portrait Pdf
The purpose of this slide is to highlight the new call center opened or expanded in the world by region which includes the United States, Latin America, Western Europe, Africa, Eastern Europe, Asia Pacific and Middle East. Take your projects to the next level with our ultimate collection of New Call Centres Opened Or Expanded By Region IT And Tech Support Business Portrait Pdf Slidegeeks has designed a range of layouts that are perfect for representing task or activity duration, keeping track of all your deadlines at a glance. Tailor these designs to your exact needs and give them a truly corporate look with your own brand colors they well make your projects stand out from the rest. The purpose of this slide is to highlight the new call center opened or expanded in the world by region which includes the United States, Latin America, Western Europe, Africa, Eastern Europe, Asia Pacific and Middle East.
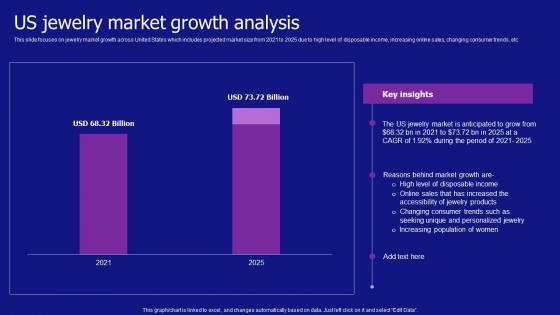
Us Jewelry Market Growth Analysis Jewelry Products Business Sample Pdf
This slide focuses on jewelry market growth across United States which includes projected market size from 2021 to 2025 due to high level of disposable income, increasing online sales, changing consumer trends, etc Get a simple yet stunning designed Us Jewelry Market Growth Analysis Jewelry Products Business Sample Pdf It is the best one to establish the tone in your meetings. It is an excellent way to make your presentations highly effective. So, download this PPT today from Slidegeeks and see the positive impacts. Our easy-to-edit Us Jewelry Market Growth Analysis Jewelry Products Business Sample Pdf can be your go-to option for all upcoming conferences and meetings. So, what are you waiting for Grab this template today. This slide focuses on jewelry market growth across United States which includes projected market size from 2021 to 2025 due to high level of disposable income, increasing online sales, changing consumer trends, etc
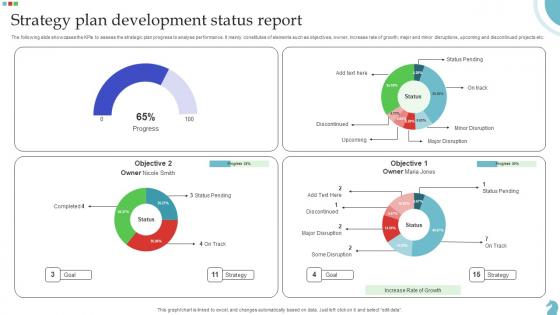
Strategy Plan Development Status Report Ideas Pdf
The following slide showcases the KPIs to assess the strategic plan progress to analyse performance. It mainly constitutes of elements such as objectives, owner, increase rate of growth, major and minor disruptions, upcoming and discontinued projects etc. Showcasing this set of slides titled Strategy Plan Development Status Report Ideas Pdf. The topics addressed in these templates are Strategy Plan, Development Status Report, Increase Rate Of Growth, Minor Disruptions. All the content presented in this PPT design is completely editable. Download it and make adjustments in color, background, font etc. as per your unique business setting. The following slide showcases the KPIs to assess the strategic plan progress to analyse performance. It mainly constitutes of elements such as objectives, owner, increase rate of growth, major and minor disruptions, upcoming and discontinued projects etc.
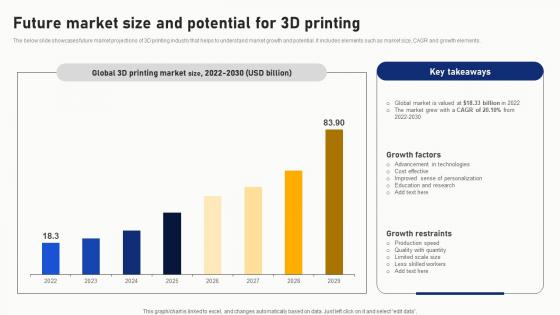
Future Market Size And Potential For 3D Printing Brochure Pdf
The below slide showcases future market projections of 3D printing industry that helps to understand market growth and potential. It includes elements such as market size, CAGR and growth elements. Showcasing this set of slides titled Future Market Size And Potential For 3D Printing Brochure Pdf. The topics addressed in these templates are Future Market Size, Potential. All the content presented in this PPT design is completely editable. Download it and make adjustments in color, background, font etc. as per your unique business setting. The below slide showcases future market projections of 3D printing industry that helps to understand market growth and potential. It includes elements such as market size, CAGR and growth elements.
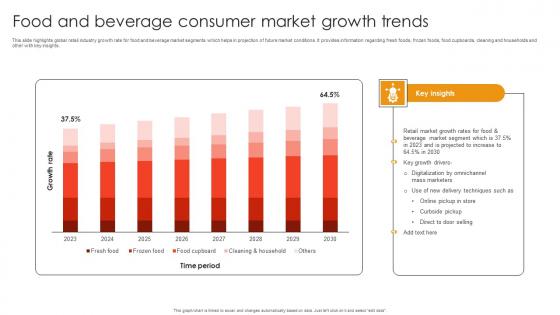
Food And Beverage Consumer Market Growth Trends Download Pdf
This slide highlights global retail industry growth rate for food and beverage market segments which helps in projection of future market conditions. It provides information regarding fresh foods, frozen foods, food cupboards, cleaning and households and other with key insights. Showcasing this set of slides titled Food And Beverage Consumer Market Growth Trends Download Pdf. The topics addressed in these templates are Online Pickup Store, Curbside Pickup, Direct To Door Selling. All the content presented in this PPT design is completely editable. Download it and make adjustments in color, background, font etc. as per your unique business setting. This slide highlights global retail industry growth rate for food and beverage market segments which helps in projection of future market conditions. It provides information regarding fresh foods, frozen foods, food cupboards, cleaning and households and other with key insights.
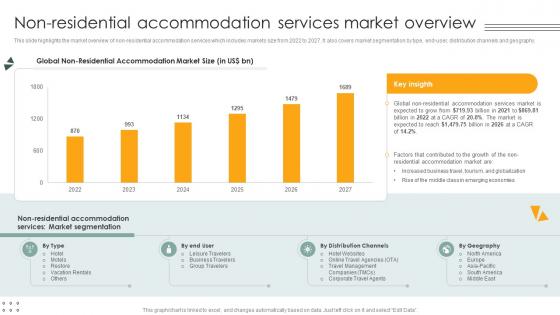
Non Residential Accommodation Services Market Overview Lodging And Accommodation Industry IR SS V
This slide highlights the market overview of non-residential accommodation services which includes markets size from 2022 to 2027. It also covers market segmentation by type, end-user, distribution channels and geography. Take your projects to the next level with our ultimate collection of Non Residential Accommodation Services Market Overview Lodging And Accommodation Industry IR SS V. Slidegeeks has designed a range of layouts that are perfect for representing task or activity duration, keeping track of all your deadlines at a glance. Tailor these designs to your exact needs and give them a truly corporate look with your own brand colors they will make your projects stand out from the rest This slide highlights the market overview of non-residential accommodation services which includes markets size from 2022 to 2027. It also covers market segmentation by type, end-user, distribution channels and geography.
Ultimate Guide To Cold Sales Agents Call Performance Tracking Dashboard SA SS V
This slide showcases company monthly call activity that helps to track agents performance including total answered calls, total agents, CSAT, etc. Take your projects to the next level with our ultimate collection of Ultimate Guide To Cold Sales Agents Call Performance Tracking Dashboard SA SS V. Slidegeeks has designed a range of layouts that are perfect for representing task or activity duration, keeping track of all your deadlines at a glance. Tailor these designs to your exact needs and give them a truly corporate look with your own brand colors they will make your projects stand out from the rest This slide showcases company monthly call activity that helps to track agents performance including total answered calls, total agents, CSAT, etc.
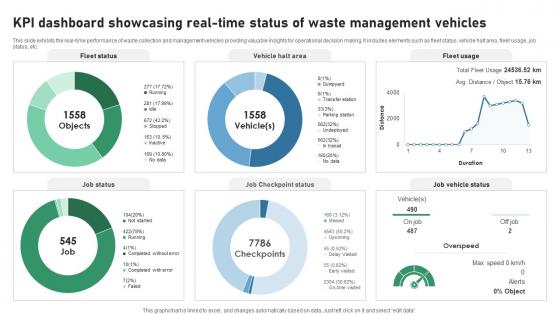
KPI Dashboard Showcasing Real Time Status Of Waste IOT Applications In Smart Waste IoT SS V
This slide exhibits the real-time performance of waste collection and management vehicles providing valuable insights for operational decision making. It includes elements such as fleet status, vehicle halt area, fleet usage, job status, etc. Take your projects to the next level with our ultimate collection of KPI Dashboard Showcasing Real Time Status Of Waste IOT Applications In Smart Waste IoT SS V. Slidegeeks has designed a range of layouts that are perfect for representing task or activity duration, keeping track of all your deadlines at a glance. Tailor these designs to your exact needs and give them a truly corporate look with your own brand colors they will make your projects stand out from the rest This slide exhibits the real-time performance of waste collection and management vehicles providing valuable insights for operational decision making. It includes elements such as fleet status, vehicle halt area, fleet usage, job status, etc.
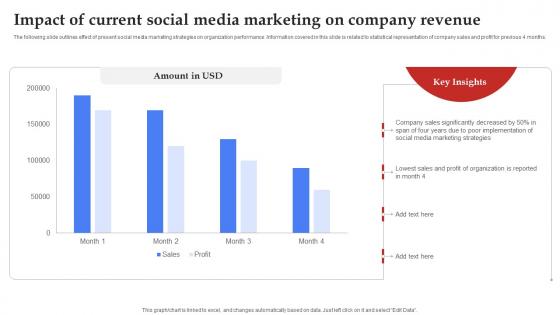
Facebook Marketing Plan Impact Of Current Social Media Marketing Strategy SS V

Increasing Business Awareness Introducing Social Media Marketing For Creating Strategy SS V
This slide presents an overview of social media marketing. It also include a graph showcasing the associated benefits of social media for insurers such as marketing, customer service, new sales leads, fraud detection and risk selection. Take your projects to the next level with our ultimate collection of Increasing Business Awareness Introducing Social Media Marketing For Creating Strategy SS V. Slidegeeks has designed a range of layouts that are perfect for representing task or activity duration, keeping track of all your deadlines at a glance. Tailor these designs to your exact needs and give them a truly corporate look with your own brand colors they will make your projects stand out from the rest This slide presents an overview of social media marketing. It also include a graph showcasing the associated benefits of social media for insurers such as marketing, customer service, new sales leads, fraud detection and risk selection
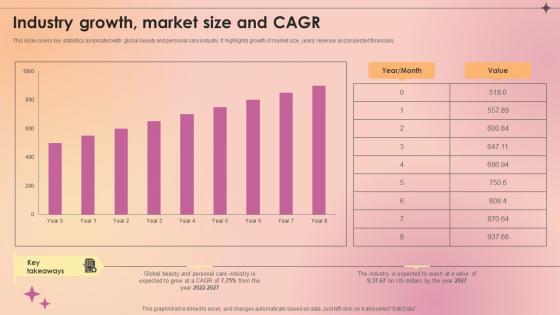
Industry Growth Market Size And Cagr Makeup And Skincare Market IR SS V
This slide covers key statistics associated with global beauty and personal care industry. It highlights growth of market size, yearly revenue and projected financials. you in need of a template that can accommodate all of your creative concepts This one is crafted professionally and can be altered to fit any style. Use it with Google Slides or PowerPoint. Include striking photographs, symbols, depictions, and other visuals. Fill, move around, or remove text boxes as desired. Test out color palettes and font mixtures. Edit and save your work, or work with colleagues. Download Industry Growth Market Size And Cagr Makeup And Skincare Market IR SS V and observe how to make your presentation outstanding. Give an impeccable presentation to your group and make your presentation unforgettable. This slide covers key statistics associated with global beauty and personal care industry. It highlights growth of market size, yearly revenue and projected financials.

Market Potential Work Management Tool Pitch Deck
This slide presents the key statistics related to market potential of the task management software market. It includes market size projection and market share by regions.Are you in need of a template that can accommodate all of your creative concepts This one is crafted professionally and can be altered to fit any style. Use it with Google Slides or PowerPoint. Include striking photographs, symbols, depictions, and other visuals. Fill, move around, or remove text boxes as desired. Test out color palettes and font mixtures. Edit and save your work, or work with colleagues. Download Market Potential Work Management Tool Pitch Deck and observe how to make your presentation outstanding. Give an impeccable presentation to your group and make your presentation unforgettable. This slide presents the key statistics related to market potential of the task management software market. It includes market size projection and market share by regions.
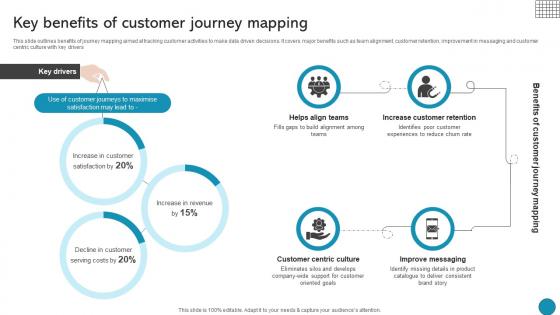
Key Benefits Of Customer Journey Mapping Driving Business Success Integrating Product
This slide outlines benefits of journey mapping aimed at tracking customer activities to make data driven decisions. It covers major benefits such as team alignment, customer retention, improvement in messaging and customer centric culture with key drivers Take your projects to the next level with our ultimate collection of Key Benefits Of Customer Journey Mapping Driving Business Success Integrating Product. Slidegeeks has designed a range of layouts that are perfect for representing task or activity duration, keeping track of all your deadlines at a glance. Tailor these designs to your exact needs and give them a truly corporate look with your own brand colors they will make your projects stand out from the rest This slide outlines benefits of journey mapping aimed at tracking customer activities to make data driven decisions. It covers major benefits such as team alignment, customer retention, improvement in messaging and customer centric culture with key drivers
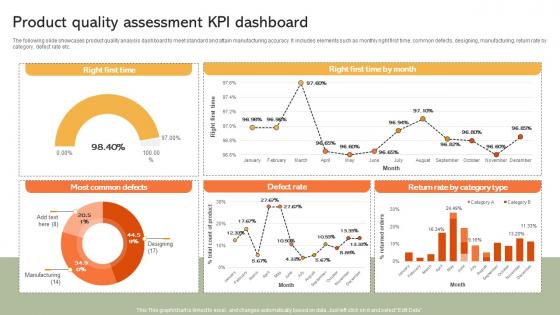
Product Quality Assessment KPI Dashboard Implementing Manufacturing Strategy SS V
The following slide showcases product quality analysis dashboard to meet standard and attain manufacturing accuracy. It includes elements such as monthly right first time, common defects, designing, manufacturing, return rate by category, defect rate etc. Take your projects to the next level with our ultimate collection of Product Quality Assessment KPI Dashboard Implementing Manufacturing Strategy SS V. Slidegeeks has designed a range of layouts that are perfect for representing task or activity duration, keeping track of all your deadlines at a glance. Tailor these designs to your exact needs and give them a truly corporate look with your own brand colors they will make your projects stand out from the rest The following slide showcases product quality analysis dashboard to meet standard and attain manufacturing accuracy. It includes elements such as monthly right first time, common defects, designing, manufacturing, return rate by category, defect rate etc.
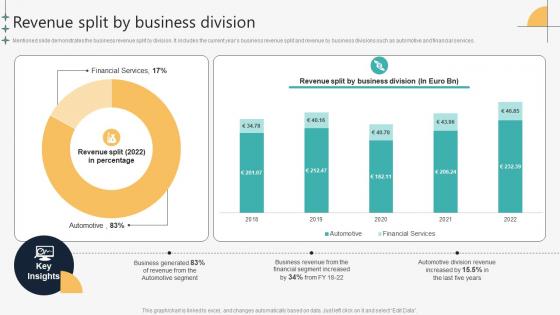
Revenue Split By Business Division Automotive Manufacturing Company Profile CP SS V
Mentioned slide demonstrates the business revenue split by division. It includes the current years business revenue split and revenue by business divisions such as automotive and financial services.Take your projects to the next level with our ultimate collection of Revenue Split By Business Division Automotive Manufacturing Company Profile CP SS V. Slidegeeks has designed a range of layouts that are perfect for representing task or activity duration, keeping track of all your deadlines at a glance. Tailor these designs to your exact needs and give them a truly corporate look with your own brand colors they will make your projects stand out from the rest Mentioned slide demonstrates the business revenue split by division. It includes the current years business revenue split and revenue by business divisions such as automotive and financial services.
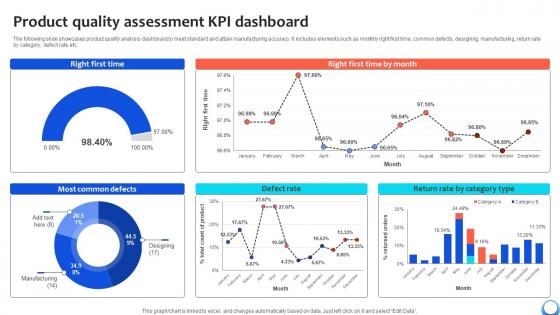
Product Quality Assessment KPI Dashboard Automating Production Process Strategy SS V
The following slide showcases product quality analysis dashboard to meet standard and attain manufacturing accuracy. It includes elements such as monthly right first time, common defects, designing, manufacturing, return rate by category, defect rate etc. Take your projects to the next level with our ultimate collection of Product Quality Assessment KPI Dashboard Automating Production Process Strategy SS V. Slidegeeks has designed a range of layouts that are perfect for representing task or activity duration, keeping track of all your deadlines at a glance. Tailor these designs to your exact needs and give them a truly corporate look with your own brand colors they will make your projects stand out from the rest The following slide showcases product quality analysis dashboard to meet standard and attain manufacturing accuracy. It includes elements such as monthly right first time, common defects, designing, manufacturing, return rate by category, defect rate etc.
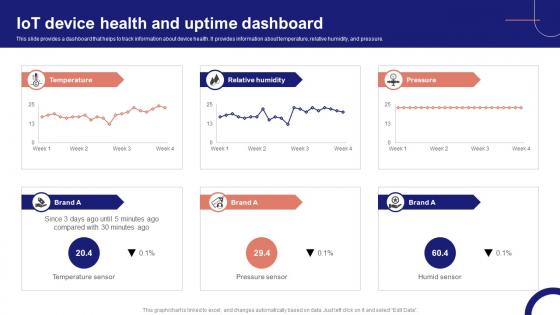
IoT Device Management Fundamentals IoT Device Health And Uptime Dashboard IoT Ss V
This slide provides a dashboard that helps to track information about device health. It provides information about temperature, relative humidity, and pressure. Take your projects to the next level with our ultimate collection of IoT Device Management Fundamentals IoT Device Health And Uptime Dashboard IoT SS V. Slidegeeks has designed a range of layouts that are perfect for representing task or activity duration, keeping track of all your deadlines at a glance. Tailor these designs to your exact needs and give them a truly corporate look with your own brand colors they will make your projects stand out from the rest This slide provides a dashboard that helps to track information about device health. It provides information about temperature, relative humidity, and pressure.
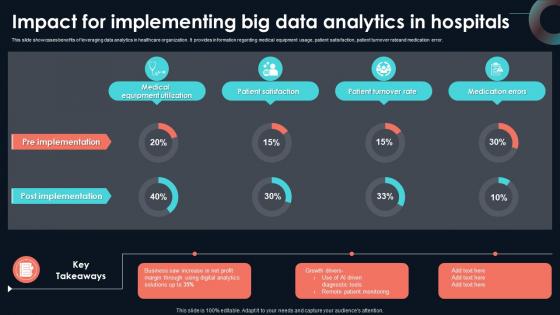
Impact For Implementing Big Data Analytics Developing Strategic Insights Using Big Data Analytics SS V
This slide showcases benefits of leveraging data analytics in healthcare organization. It provides information regarding medical equipment usage, patient satisfaction, patient turnover rateand medication error. Take your projects to the next level with our ultimate collection of Impact For Implementing Big Data Analytics Developing Strategic Insights Using Big Data Analytics SS V. Slidegeeks has designed a range of layouts that are perfect for representing task or activity duration, keeping track of all your deadlines at a glance. Tailor these designs to your exact needs and give them a truly corporate look with your own brand colors they will make your projects stand out from the rest This slide showcases benefits of leveraging data analytics in healthcare organization. It provides information regarding medical equipment usage, patient satisfaction, patient turnover rateand medication error.
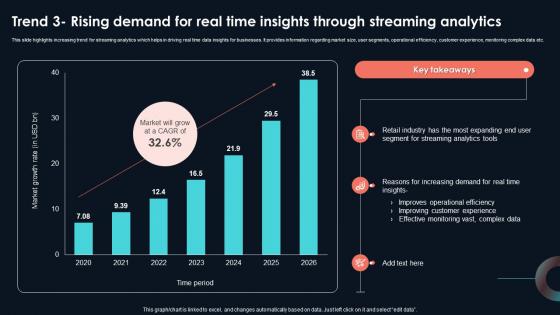
Trend 3 Rising Demand For Real Time Insights Developing Strategic Insights Using Big Data Analytics SS V
This slide highlights increasing trend for streaming analytics which helps in driving real time data insights for businesses. It provides information regarding market size, user segments, operational efficiency, customer experience, monitoring complex data etc. Take your projects to the next level with our ultimate collection of Trend 3 Rising Demand For Real Time Insights Developing Strategic Insights Using Big Data Analytics SS V. Slidegeeks has designed a range of layouts that are perfect for representing task or activity duration, keeping track of all your deadlines at a glance. Tailor these designs to your exact needs and give them a truly corporate look with your own brand colors they will make your projects stand out from the rest This slide highlights increasing trend for streaming analytics which helps in driving real time data insights for businesses. It provides information regarding market size, user segments, operational efficiency, customer experience, monitoring complex data etc.
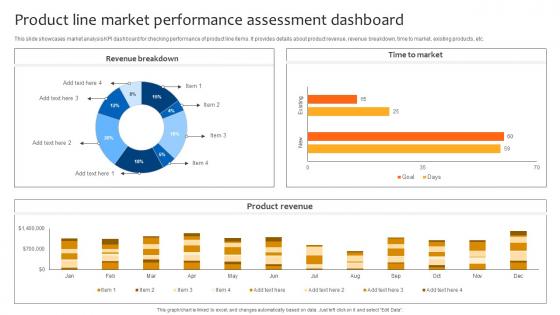
Deploying Strategies For Business Product Line Market Performance Assessment Dashboard Strategy SS V
This slide showcases market analysis KPI dashboard for checking performance of product line items. It provides details about product revenue, revenue breakdown, time to market, existing products, etc. Take your projects to the next level with our ultimate collection of Deploying Strategies For Business Product Line Market Performance Assessment Dashboard Strategy SS V. Slidegeeks has designed a range of layouts that are perfect for representing task or activity duration, keeping track of all your deadlines at a glance. Tailor these designs to your exact needs and give them a truly corporate look with your own brand colors they will make your projects stand out from the rest This slide showcases market analysis KPI dashboard for checking performance of product line items. It provides details about product revenue, revenue breakdown, time to market, existing products, etc.
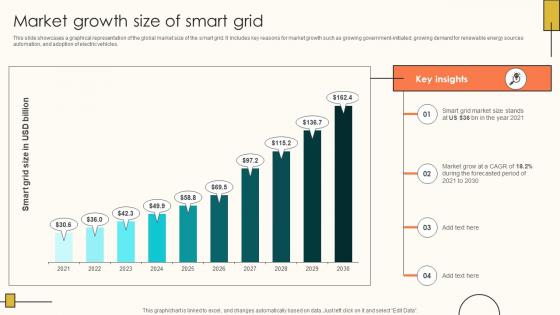
Market Growth Size Of Smart Grid Internet Of Things Solutions To Enhance Energy IoT SS V
This slide showcases a graphical representation of the global market size of the smart grid. It Includes key reasons for market growth such as growing government-initiated, growing demand for renewable energy sources automation, and adoption of electric vehicles. Take your projects to the next level with our ultimate collection of Market Growth Size Of Smart Grid Internet Of Things Solutions To Enhance Energy IoT SS V. Slidegeeks has designed a range of layouts that are perfect for representing task or activity duration, keeping track of all your deadlines at a glance. Tailor these designs to your exact needs and give them a truly corporate look with your own brand colors they will make your projects stand out from the rest This slide showcases a graphical representation of the global market size of the smart grid. It Includes key reasons for market growth such as growing government-initiated, growing demand for renewable energy sources automation, and adoption of electric vehicles.

IoT Solutions For Oil Oil And Gas Production Monitoring KPI Dashboard IoT SS V
This slide exhibits monthly performance of oil and gas production to track wellhead uptime and overall efficiency. It includes various elements such as production efficiency, well uptime, gas production rate, oil production rate, top performing gas producing wells, etc. Take your projects to the next level with our ultimate collection of IoT Solutions For Oil Oil And Gas Production Monitoring KPI Dashboard IoT SS V. Slidegeeks has designed a range of layouts that are perfect for representing task or activity duration, keeping track of all your deadlines at a glance. Tailor these designs to your exact needs and give them a truly corporate look with your own brand colors they will make your projects stand out from the rest This slide exhibits monthly performance of oil and gas production to track wellhead uptime and overall efficiency. It includes various elements such as production efficiency, well uptime, gas production rate, oil production rate, top performing gas producing wells, etc.
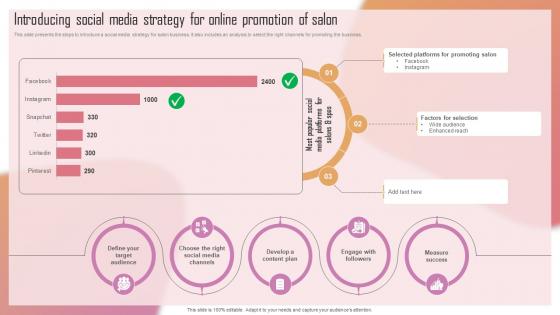
Customizing The Salon Experience Introducing Social Media Strategy For Online Promotion Strategy SS V
This slide presents the steps to introduce a social media strategy for salon business. It also includes an analysis to select the right channels for promoting the business. Take your projects to the next level with our ultimate collection of Customizing The Salon Experience Introducing Social Media Strategy For Online Promotion Strategy SS V. Slidegeeks has designed a range of layouts that are perfect for representing task or activity duration, keeping track of all your deadlines at a glance. Tailor these designs to your exact needs and give them a truly corporate look with your own brand colors they will make your projects stand out from the rest This slide presents the steps to introduce a social media strategy for salon business. It also includes an analysis to select the right channels for promoting the business.

Community Engagement Engineering Solution Provider Company Profile CP SS V
This slide showcases various highlights community engagement presents support to communities from ABB company employees and business areas. It showcases elements such as millions donated, person days volunteered and community projects and charities.Want to ace your presentation in front of a live audience Our Community Engagement Engineering Solution Provider Company Profile CP SS V can help you do that by engaging all the users towards you. Slidegeeks experts have put their efforts and expertise into creating these impeccable powerpoint presentations so that you can communicate your ideas clearly. Moreover, all the templates are customizable, and easy-to-edit and downloadable. Use these for both personal and commercial use. This slide showcases various highlights community engagement presents support to communities from ABB company employees and business areas. It showcases elements such as millions donated, person days volunteered and community projects and charities.
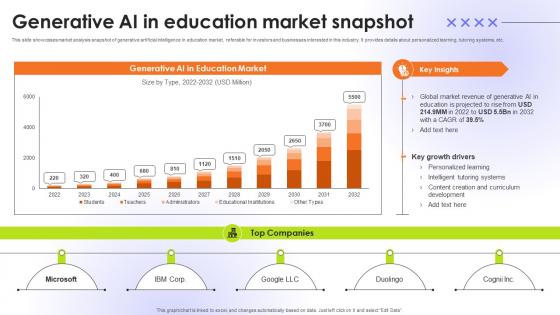
Generative AI In Education Market Snapshot Educational Transformation Through AI SS V
This slide showcases market analysis snapshot of generative artificial intelligence in education market, referable for investors and businesses interested in this industry. It provides details about personalized learning, tutoring systems, etc. Take your projects to the next level with our ultimate collection of Generative AI In Education Market Snapshot Educational Transformation Through AI SS V. Slidegeeks has designed a range of layouts that are perfect for representing task or activity duration, keeping track of all your deadlines at a glance. Tailor these designs to your exact needs and give them a truly corporate look with your own brand colors they will make your projects stand out from the rest This slide showcases market analysis snapshot of generative artificial intelligence in education market, referable for investors and businesses interested in this industry. It provides details about personalized learning, tutoring systems, etc.
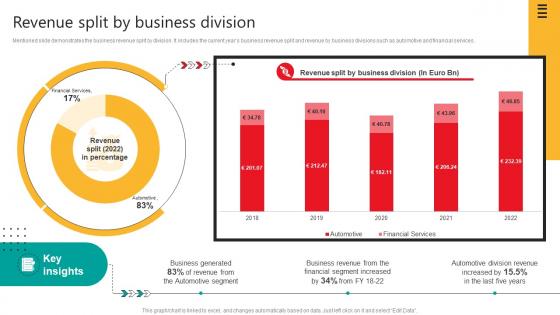
Revenue Split By Business Division Automobile Development Company Profile CP SS V
Mentioned slide demonstrates the business revenue split by division. It includes the current years business revenue split and revenue by business divisions such as automotive and financial services.Take your projects to the next level with our ultimate collection of Revenue Split By Business Division Automobile Development Company Profile CP SS V. Slidegeeks has designed a range of layouts that are perfect for representing task or activity duration, keeping track of all your deadlines at a glance. Tailor these designs to your exact needs and give them a truly corporate look with your own brand colors they will make your projects stand out from the rest Mentioned slide demonstrates the business revenue split by division. It includes the current years business revenue split and revenue by business divisions such as automotive and financial services.
Driving Results Designing A Team Training And Development Program Tracking Dashboard
This slide depicts team development program tracking dashboard to analyze the impact of implementing training plan for the members. It includes training satisfaction rate, engagement score, drop-out rate and top 5 trainees. Take your projects to the next level with our ultimate collection of Driving Results Designing A Team Training And Development Program Tracking Dashboard. Slidegeeks has designed a range of layouts that are perfect for representing task or activity duration, keeping track of all your deadlines at a glance. Tailor these designs to your exact needs and give them a truly corporate look with your own brand colors they will make your projects stand out from the rest This slide depicts team development program tracking dashboard to analyze the impact of implementing training plan for the members. It includes training satisfaction rate, engagement score, drop-out rate and top 5 trainees.
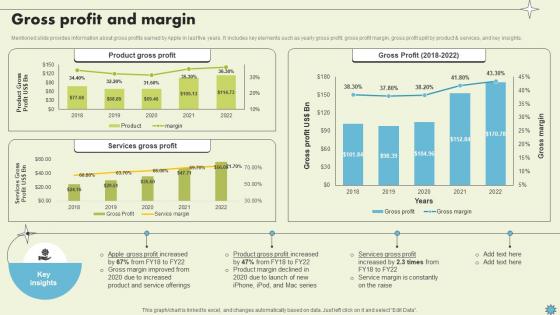
Gross Profit And Margin Consumer Electronics Company Profile CP SS V
Mentioned slide provides information about gross profits earned by Apple in last five years. It includes key elements such as yearly gross profit, gross profit margin, gross profit split by product and services, and key insights.Take your projects to the next level with our ultimate collection of Gross Profit And Margin Consumer Electronics Company Profile CP SS V. Slidegeeks has designed a range of layouts that are perfect for representing task or activity duration, keeping track of all your deadlines at a glance. Tailor these designs to your exact needs and give them a truly corporate look with your own brand colors they will make your projects stand out from the rest Mentioned slide provides information about gross profits earned by Apple in last five years. It includes key elements such as yearly gross profit, gross profit margin, gross profit split by product and services, and key insights.
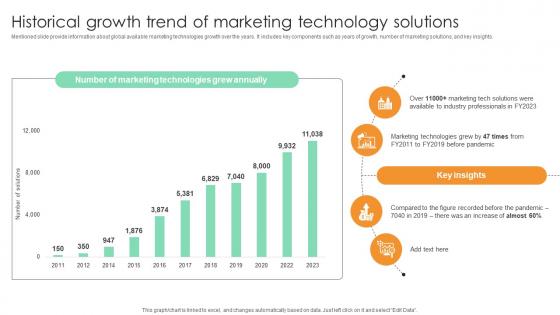
Historical Growth Trend Of Marketing Technology Comprehensive Guide For Marketing Technology
Mentioned slide provide information about global available marketing technologies growth over the years. It includes key components such as years of growth, number of marketing solutions, and key insights. Take your projects to the next level with our ultimate collection of Historical Growth Trend Of Marketing Technology Comprehensive Guide For Marketing Technology. Slidegeeks has designed a range of layouts that are perfect for representing task or activity duration, keeping track of all your deadlines at a glance. Tailor these designs to your exact needs and give them a truly corporate look with your own brand colors they will make your projects stand out from the rest Mentioned slide provide information about global available marketing technologies growth over the years. It includes key components such as years of growth, number of marketing solutions, and key insights.
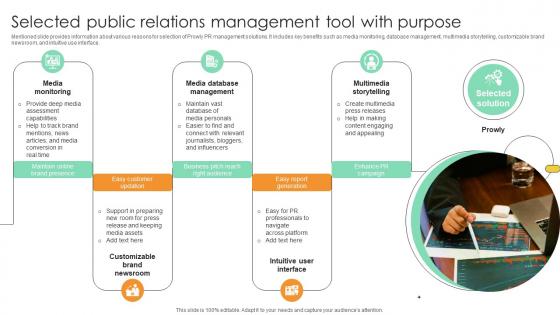
Selected Public Relations Management Tool With Comprehensive Guide For Marketing Technology
Mentioned slide provides information about various reasons for selection of Prowly PR management solutions. It includes key benefits such as media monitoring, database management, multimedia storytelling, customizable brand newsroom, and intuitive use interface.Take your projects to the next level with our ultimate collection of Selected Public Relations Management Tool With Comprehensive Guide For Marketing Technology. Slidegeeks has designed a range of layouts that are perfect for representing task or activity duration, keeping track of all your deadlines at a glance. Tailor these designs to your exact needs and give them a truly corporate look with your own brand colors they will make your projects stand out from the rest Mentioned slide provides information about various reasons for selection of Prowly PR management solutions. It includes key benefits such as media monitoring, database management, multimedia storytelling, customizable brand newsroom, and intuitive use interface.
Dashboard Analysis For Tracking Agricultural Tasks Adopting Sustainable Farming Techniques
This slide showcases the KPIs that would help to track the improvements with adoption of new sustainable agriculture practices. It includes current tasks, crops, harvest, todays weather, summary, etc. Take your projects to the next level with our ultimate collection of Dashboard Analysis For Tracking Agricultural Tasks Adopting Sustainable Farming Techniques. Slidegeeks has designed a range of layouts that are perfect for representing task or activity duration, keeping track of all your deadlines at a glance. Tailor these designs to your exact needs and give them a truly corporate look with your own brand colors they will make your projects stand out from the rest This slide showcases the KPIs that would help to track the improvements with adoption of new sustainable agriculture practices. It includes current tasks, crops, harvest, todays weather, summary, etc.

Telemedicine Industry Analysis Across Latin America Remote Healthcare Services IR SS V
This slide showcases the Telemedicine industry analysis of Latin America region which includes factors that contribute this regions growth such as increasing aging population. It also includes market players operating in this region. Take your projects to the next level with our ultimate collection of Telemedicine Industry Analysis Across Latin America Remote Healthcare Services IR SS V. Slidegeeks has designed a range of layouts that are perfect for representing task or activity duration, keeping track of all your deadlines at a glance. Tailor these designs to your exact needs and give them a truly corporate look with your own brand colors they will make your projects stand out from the rest This slide showcases the Telemedicine industry analysis of Latin America region which includes factors that contribute this regions growth such as increasing aging population. It also includes market players operating in this region.

Segmentation Of Global Prescriptive Analytics Market Data Analytics SS V
This slide provides an overview of market segmentation of prescriptive analytics at a global level. It covers segmentation analysis based on region, data type, component and deployment with key takeaways.Take your projects to the next level with our ultimate collection of Segmentation Of Global Prescriptive Analytics Market Data Analytics SS V. Slidegeeks has designed a range of layouts that are perfect for representing task or activity duration, keeping track of all your deadlines at a glance. Tailor these designs to your exact needs and give them a truly corporate look with your own brand colors they will make your projects stand out from the rest This slide provides an overview of market segmentation of prescriptive analytics at a global level. It covers segmentation analysis based on region, data type, component and deployment with key takeaways.
Workforce Reduction Statistics Among Different Implementing Personnel Downsizing Initiative
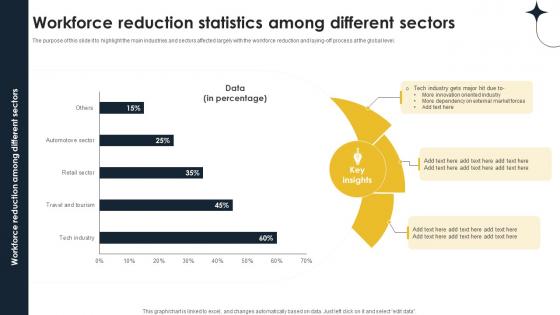
The purpose of this slide it to highlight the main industries and sectors affected largely with the workforce reduction and laying-off process at the global level. Take your projects to the next level with our ultimate collection of Workforce Reduction Statistics Among Different Implementing Personnel Downsizing Initiative. Slidegeeks has designed a range of layouts that are perfect for representing task or activity duration, keeping track of all your deadlines at a glance. Tailor these designs to your exact needs and give them a truly corporate look with your own brand colors they will make your projects stand out from the rest The purpose of this slide it to highlight the main industries and sectors affected largely with the workforce reduction and laying-off process at the global level.
Workforce Competency Enhancement Need Of Cloud Training Program Within Organization DTE SS V
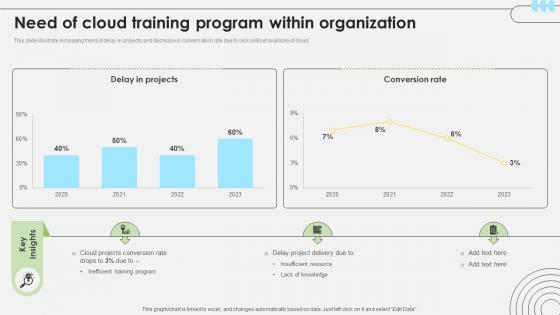
This slide illustrate increasing trend of delay in projects and decrease in conversation rate due to lack skillset available of cloud. The Workforce Competency Enhancement Need Of Cloud Training Program Within Organization DTE SS V is a compilation of the most recent design trends as a series of slides. It is suitable for any subject or industry presentation, containing attractive visuals and photo spots for businesses to clearly express their messages. This template contains a variety of slides for the user to input data, such as structures to contrast two elements, bullet points, and slides for written information. Slidegeeks is prepared to create an impression. This slide illustrate increasing trend of delay in projects and decrease in conversation rate due to lack skillset available of cloud.
Revenue Digital Marketings Strategies PPT Sample CP SS V
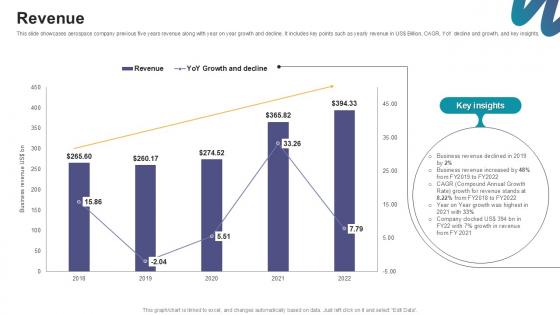
This slide showcases aerospace company previous five years revenue along with year on year growth and decline. It includes key points such as yearly revenue in US Billion, CAGR, YoY decline and growth, and key insights. Take your projects to the next level with our ultimate collection of Revenue Digital Marketings Strategies PPT Sample CP SS V. Slidegeeks has designed a range of layouts that are perfect for representing task or activity duration, keeping track of all your deadlines at a glance. Tailor these designs to your exact needs and give them a truly corporate look with your own brand colors they will make your projects stand out from the rest This slide showcases aerospace company previous five years revenue along with year on year growth and decline. It includes key points such as yearly revenue in US Billion, CAGR, YoY decline and growth, and key insights.
Key Sales Outreach Challenges Planning Outreach Campaigns PPT Example
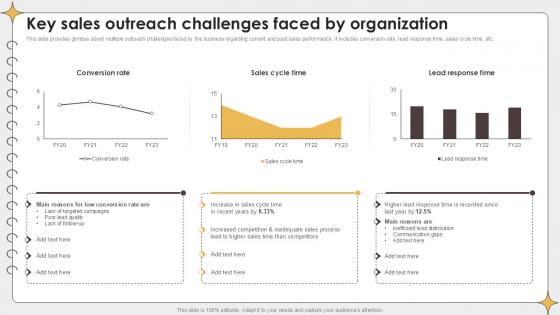
This slide provides glimpse about multiple outreach challenges faced by the business regarding current and past sales performance. It includes conversion rate, lead response time, sales cycle time, etc. Take your projects to the next level with our ultimate collection of Key Sales Outreach Challenges Planning Outreach Campaigns PPT Example. Slidegeeks has designed a range of layouts that are perfect for representing task or activity duration, keeping track of all your deadlines at a glance. Tailor these designs to your exact needs and give them a truly corporate look with your own brand colors they will make your projects stand out from the rest This slide provides glimpse about multiple outreach challenges faced by the business regarding current and past sales performance. It includes conversion rate, lead response time, sales cycle time, etc.
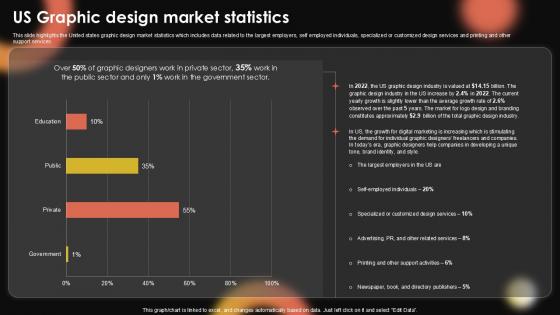
US Graphic Design Market Sample Pentagram Business Plan PPT Template BP SS V
This slide highlights the United states graphic design market statistics which includes data related to the largest employers, self employed individuals, specialized or customized design services and printing and other support services. Take your projects to the next level with our ultimate collection of US Graphic Design Market Sample Pentagram Business Plan PPT Template BP SS V. Slidegeeks has designed a range of layouts that are perfect for representing task or activity duration, keeping track of all your deadlines at a glance. Tailor these designs to your exact needs and give them a truly corporate look with your own brand colors they will make your projects stand out from the rest This slide highlights the United states graphic design market statistics which includes data related to the largest employers, self employed individuals, specialized or customized design services and printing and other support services.

Market Potential Plant Based Eggs Developing Company Investor PPT Example
This slide shows information regarding the market potential or opportunity available for the company in current market. It also includes details regarding compound annual growth rate. Take your projects to the next level with our ultimate collection of Market Potential Plant Based Eggs Developing Company Investor PPT Example. Slidegeeks has designed a range of layouts that are perfect for representing task or activity duration, keeping track of all your deadlines at a glance. Tailor these designs to your exact needs and give them a truly corporate look with your own brand colors they will make your projects stand out from the rest This slide shows information regarding the market potential or opportunity available for the company in current market. It also includes details regarding compound annual growth rate.

Market Potential Team Collaboration Platform Pitch Deck PPT PowerPoint
This slide presents the key statistics related to market potential of the task management software market. It includes market size projection and market share by regions. Whether you have daily or monthly meetings, a brilliant presentation is necessary. Market Potential Team Collaboration Platform Pitch Deck PPT PowerPoint can be your best option for delivering a presentation. Represent everything in detail using Market Potential Team Collaboration Platform Pitch Deck PPT PowerPoint and make yourself stand out in meetings. The template is versatile and follows a structure that will cater to your requirements. All the templates prepared by Slidegeeks are easy to download and edit. Our research experts have taken care of the corporate themes as well. So, give it a try and see the results. This slide presents the key statistics related to market potential of the task management software market. It includes market size projection and market share by regions.
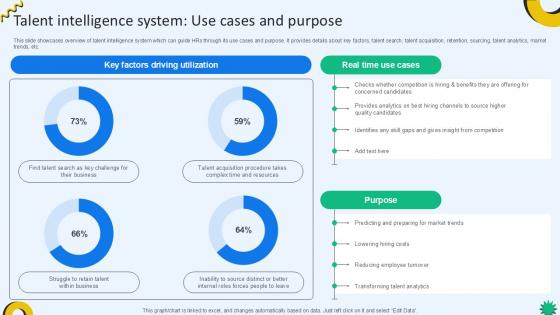
Talent Intelligence System Use Cases Cloud Recruiting Technologies PPT Slide
This slide showcases overview of talent intelligence system which can guide HRs through its use cases and purpose. It provides details about key factors, talent search, talent acquisition, retention, sourcing, talent analytics, market trends, etc. Take your projects to the next level with our ultimate collection of Talent Intelligence System Use Cases Cloud Recruiting Technologies PPT Slide. Slidegeeks has designed a range of layouts that are perfect for representing task or activity duration, keeping track of all your deadlines at a glance. Tailor these designs to your exact needs and give them a truly corporate look with your own brand colors they will make your projects stand out from the rest This slide showcases overview of talent intelligence system which can guide HRs through its use cases and purpose. It provides details about key factors, talent search, talent acquisition, retention, sourcing, talent analytics, market trends, etc.
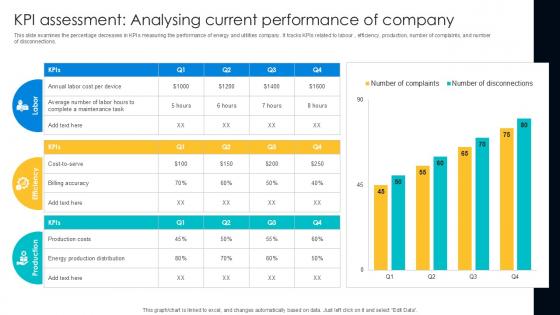
KPI Assessment Analysing Current Digital Transformation Journey PPT Slide DT SS V
This slide examines the percentage decreases in KPIs measuring the performance of energy and utilities company. It tracks KPIs related to labour , efficiency, production, number of complaints, and number of disconnections. Take your projects to the next level with our ultimate collection of KPI Assessment, Analysing Current Performance, Company. Slidegeeks has designed a range of layouts that are perfect for representing task or activity duration, keeping track of all your deadlines at a glance. Tailor these designs to your exact needs and give them a truly corporate look with your own brand colors they will make your projects stand out from the rest This slide examines the percentage decreases in KPIs measuring the performance of energy and utilities company. It tracks KPIs related to labour , efficiency, production, number of complaints, and number of disconnections.


 Continue with Email

 Home
Home


