Project Icons
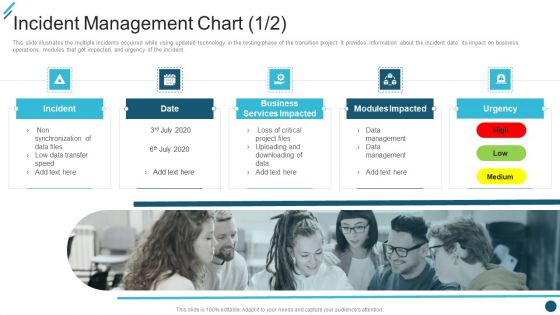
Change Execution Plan Incident Management Chart Ppt PowerPoint Presentation File Graphics Template PDF
This slide illustrates the multiple incidents occurred while using updated technology in the testing phase of the transition project. It provides information about the incident date, its impact on business operations, modules that got impacted, and urgency of the incident. This is a Change Execution Plan Incident Management Chart Ppt PowerPoint Presentation File Graphics Template PDF template with various stages. Focus and dispense information on five stages using this creative set, that comes with editable features. It contains large content boxes to add your information on topics like Business Services Impacted, Modules Impacted Urgency, High Low Medium. You can also showcase facts, figures, and other relevant content using this PPT layout. Grab it now.
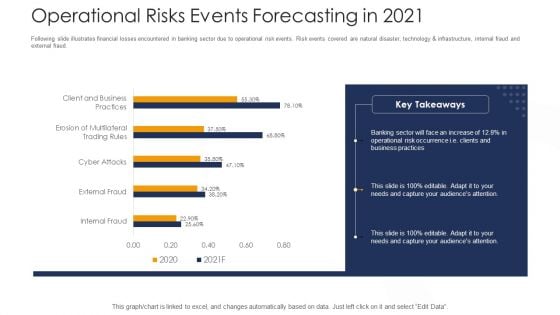
Strategies To Tackle Operational Risk In Banking Institutions Operational Risks Events Forecasting In 2021 Mockup PDF
Following slide illustrates financial losses encountered in banking sector due to operational risk events. Risk events covered are natural disaster, technology and infrastructure, internal fraud and external fraud. Deliver an awe inspiring pitch with this creative strategies to tackle operational risk in banking institutions operational risks events forecasting in 2021 mockup pdf bundle. Topics like internal fraud, external fraud, client and business practices can be discussed with this completely editable template. It is available for immediate download depending on the needs and requirements of the user.
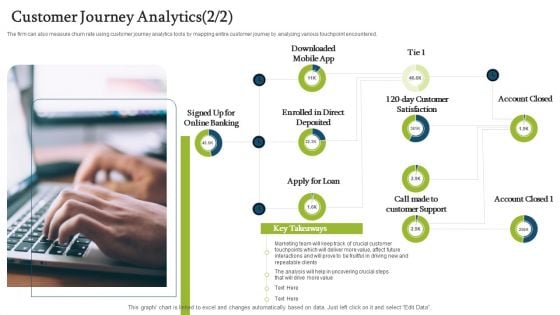
Forecasting And Managing Consumer Attrition For Business Advantage Customer Journey Analytics Direct Designs PDF
The firm can also measure churn rate using customer journey analytics tools by mapping entire customer journey by analyzing various touchpoint encountered.Deliver and pitch your topic in the best possible manner with this forecasting and managing consumer attrition for business advantage customer journey analytics direct designs pdf. Use them to share invaluable insights on signed up for online banking, enrolled in direct deposited, downloaded mobile app and impress your audience. This template can be altered and modified as per your expectations. So, grab it now.
Forecasting And Managing Consumer Attrition For Business Advantage Dashboard Customer Purchase Tracking Repeat Structure PDF
The firm is looking forward to track customer experience by tracking various touchpoints in order to handle issues such customer churn. KPIs mentioned in the dashboard are measured regularly across the organization. Deliver and pitch your topic in the best possible manner with this forecasting and managing consumer attrition for business advantage dashboard customer purchase tracking repeat structure pdf. Use them to share invaluable insights on total repeat sales after coupon, total repeat sales after reward, total cart value per month and impress your audience. This template can be altered and modified as per your expectations. So, grab it now.
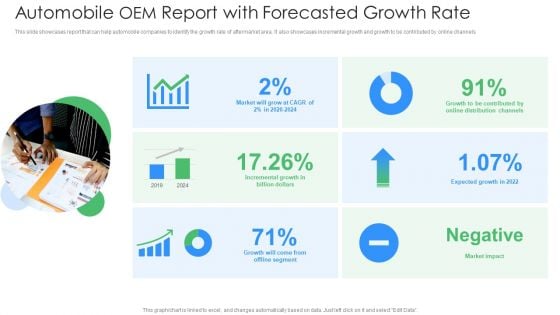
Automobile OEM Report With Forecasted Growth Rate Ppt PowerPoint Presentation File Background Images PDF
This slide showcases report that can help automobile companies to identify the growth rate of aftermarket area. It also showcases incremental growth and growth to be contributed by online channels. Pitch your topic with ease and precision using this automobile oem report with forecasted growth rate ppt powerpoint presentation file background images pdf. This layout presents information on incremental growth, billion dollars, growth, offline segment, market impact, expected growth in 2022. It is also available for immediate download and adjustment. So, changes can be made in the color, design, graphics or any other component to create a unique layout.
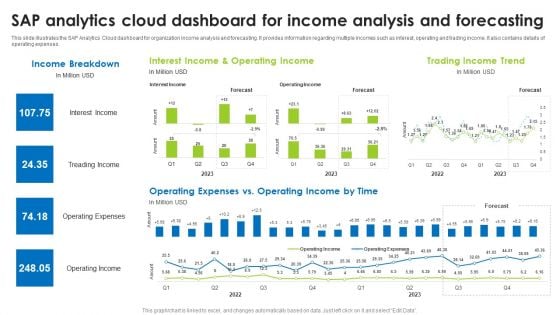
Sap Analytics Cloud Dashboard For Income Analysis And Forecasting Formats PDF
This slide illustrates the SAP Analytics Cloud dashboard for organization income analysis and forecasting. It provides information regarding multiple incomes such as interest, operating and trading income. It also contains details of operating expenses. The best PPT templates are a great way to save time, energy, and resources. Slidegeeks have 100 percent editable powerpoint slides making them incredibly versatile. With these quality presentation templates, you can create a captivating and memorable presentation by combining visually appealing slides and effectively communicating your message. Download Sap Analytics Cloud Dashboard To Asses Digital Marketing Campaigns Performance Ideas PDF from Slidegeeks and deliver a wonderful presentation.
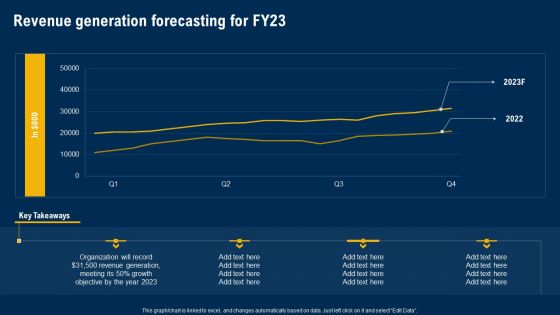
Revenue Generation Forecasting For Fy23 Ultimate Guide Of Strategic Management Clipart PDF
Coming up with a presentation necessitates that the majority of the effort goes into the content and the message you intend to convey. The visuals of a PowerPoint presentation can only be effective if it supplements and supports the story that is being told. Keeping this in mind our experts created Revenue Generation Forecasting For Fy23 Ultimate Guide Of Strategic Management Clipart PDF to reduce the time that goes into designing the presentation. This way, you can concentrate on the message while our designers take care of providing you with the right template for the situation.
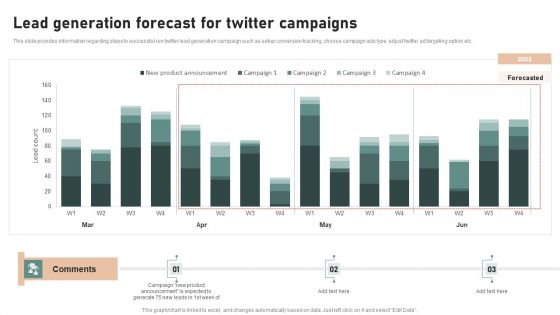
Utilizing Twitter For Social Media Lead Generation Forecast For Twitter Campaigns Information PDF
This slide provides information regarding steps to successful run twitter lead generation campaign such as setup conversion tracking, choose campaign ads type, adjust twitter ad targeting option etc. Boost your pitch with our creative Utilizing Twitter For Social Media Lead Generation Forecast For Twitter Campaigns Information PDF. Deliver an awe-inspiring pitch that will mesmerize everyone. Using these presentation templates you will surely catch everyones attention. You can browse the ppts collection on our website. We have researchers who are experts at creating the right content for the templates. So you do not have to invest time in any additional work. Just grab the template now and use them.
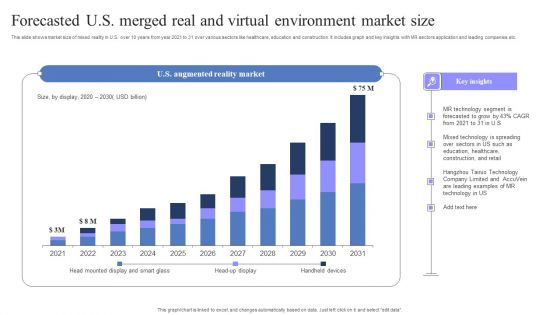
Forecasted U S Merged Real And Virtual Environment Market Size Rules PDF
This slide shows market size of mixed reality in U.S. over 10 years from year 2021 to 31 over various sectors like healthcare, education and construction. It includes graph and key insights with MR sectors application and leading companies etc. Showcasing this set of slides titled Forecasted U S Merged Real And Virtual Environment Market Size Rules PDF. The topics addressed in these templates are MR Technology Segment, Mixed Technology, Technology Company Limited. All the content presented in this PPT design is completely editable. Download it and make adjustments in color, background, font etc. as per your unique business setting.
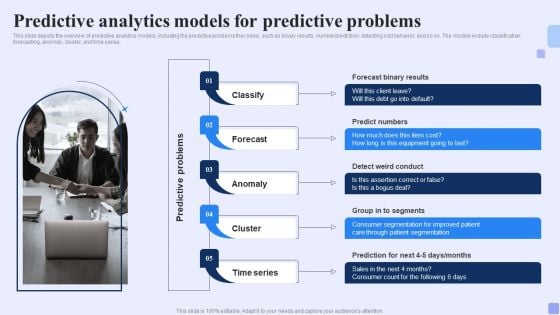
Predictive Analytics Models For Predictive Problems Forward Looking Analysis IT Clipart PDF
This slide depicts the overview of predictive analytics models, including the predictive problems they solve, such as binary results, number prediction, detecting odd behavior, and so on. The models include classification, forecasting, anomaly, cluster, and time series. Are you searching for a Predictive Analytics Models For Predictive Problems Forward Looking Analysis IT Clipart PDF that is uncluttered, straightforward, and original Its easy to edit, and you can change the colors to suit your personal or business branding. For a presentation that expresses how much effort you ve put in, this template is ideal With all of its features, including tables, diagrams, statistics, and lists, its perfect for a business plan presentation. Make your ideas more appealing with these professional slides. Download Predictive Analytics Models For Predictive Problems Forward Looking Analysis IT Clipart PDF from Slidegeeks today.
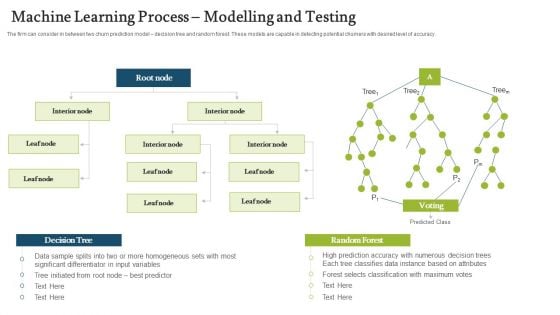
Forecasting And Managing Consumer Attrition For Business Advantage Machine Learning Process Modelling And Testing Topics PDF
Presenting forecasting and managing consumer attrition for business advantage machine learning process modelling and testing topics pdf to provide visual cues and insights. Share and navigate important information on three stages that need your due attention. This template can be used to pitch topics like interior node, random forest, decision tree . In addtion, this PPT design contains high resolution images, graphics, etc, that are easily editable and available for immediate download.
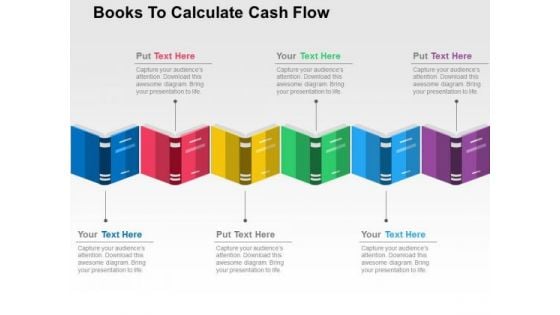
Books To Calculate Cash Flow PowerPoint Template
Graphic of books in linear flow has been displayed in this business slide. This business diagram helps to exhibit calculation of cash flow. Use this diagram to build an exclusive presentation.
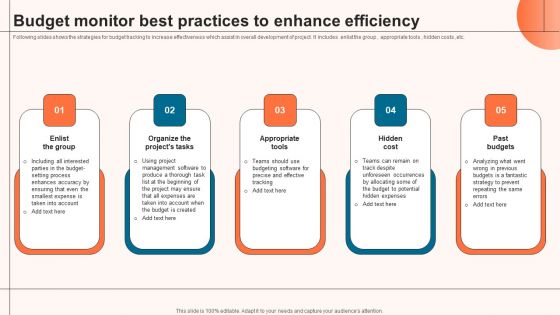
Budget Monitor Best Practices To Enhance Efficiency Designs PDF
Following slides shows the strategies for budget tracking to increase effectiveness which assist in overall development of project. It includes enlist the group , appropriate tools , hidden costs ,etc. Presenting Budget Monitor Best Practices To Enhance Efficiency Designs PDF to dispense important information. This template comprises five stages. It also presents valuable insights into the topics including Appropriate Tools, Hidden Cost, Past Budgets. This is a completely customizable PowerPoint theme that can be put to use immediately. So, download it and address the topic impactfully.
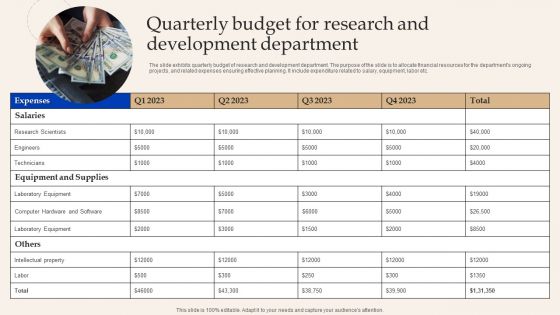
Quarterly Budget For Research And Development Department Clipart PDF
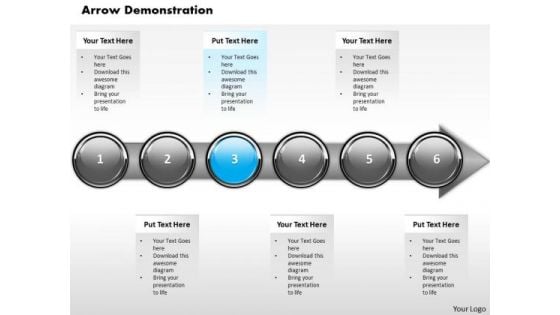
Ppt Homogeneous Demonstration Of Financial Process Using Stage 3 PowerPoint Templates
PPT homogeneous demonstration of financial process using stage 3 PowerPoint Templates-With this pre-designed process arrows diagram you can visualize almost any type of concept, chronological process or steps of your strategies.-PPT homogeneous demonstration of financial process using stage 3 PowerPoint Templates-Abstract, Achievement, Aim, Arrow, Background, Business, Chart, Communication, Company, Competition, Concept, Design, Development, Diagram, Direction, Finance, Financial, Forecast, Forward, Goal, Graph, Graphic, Growth, Icon, Illustration, Increase, Investment, Leader, Leadership, Marketing, Motion, Moving, Orange, Path, Price, Process, Profit, Progress, Shape, Sign, Success, Symbol, Target, Team, Teamwork, Up, Upwards Book you place at the top with our Ppt Homogeneous Demonstration Of Financial Process Using Stage 3 PowerPoint Templates. You will come out on top.
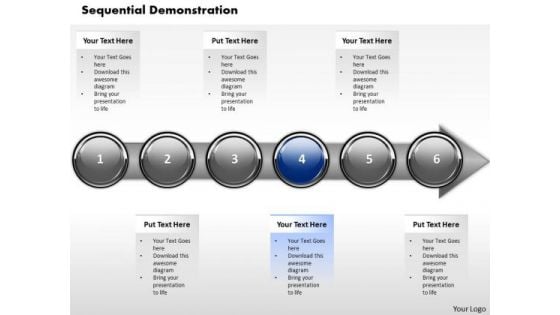
Ppt Horizontal Abstraction Of Financial Process Using Stage 4 PowerPoint Templates
PPT horizontal abstraction of financial process using stage 4 PowerPoint Templates-This diagram can be used in analyzing, designing, documenting or managing a process or program in various fields.-PPT horizontal abstraction of financial process using stage 4 PowerPoint Templates-Abstract, Achievement, Aim, Arrow, Background, Business, Chart, Communication, Company, Competition, Concept, Design, Development, Diagram, Direction, Finance, Financial, Forecast, Forward, Goal, Graph, Graphic, Growth, Icon, Illustration, Increase, Investment, Leader, Leadership, Marketing, Motion, Moving, Orange, Path, Price, Process, Profit, Progress, Shape, Sign, Success, Symbol, Target, Team, Teamwork, Up, Upwards Put in your every bit with our Ppt Horizontal Abstraction Of Financial Process Using Stage 4 PowerPoint Templates. They will give it their all.
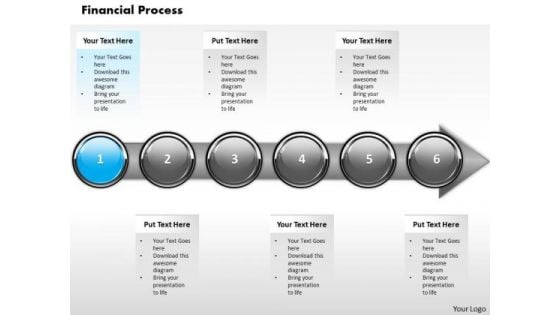
Ppt Sequential Demonstration Of Arrow Process Step 1 PowerPoint Templates
PPT sequential demonstration of arrow process step 1 PowerPoint Templates-With this pre-designed process arrows diagram you can visualize almost any type of concept, chronological process or steps of your strategies-PPT sequential demonstration of arrow process step 1 PowerPoint Templates-Abstract, Achievement, Aim, Arrow, Background, Business, Chart, Communication, Company, Competition, Concept, Design, Development, Diagram, Direction, Finance, Financial, Forecast, Forward, Goal, Graph, Graphic, Growth, Icon, Illustration, Increase, Investment, Leader, Leadership, Marketing, Motion, Moving, Orange, Path, Price, Process, Profit, Progress, Shape, Sign, Success, Symbol, Target, Team, Teamwork, Up, Upwards Accept accolades with our Ppt Sequential Demonstration Of Arrow Process Step 1 PowerPoint Templates. You will come out on top.
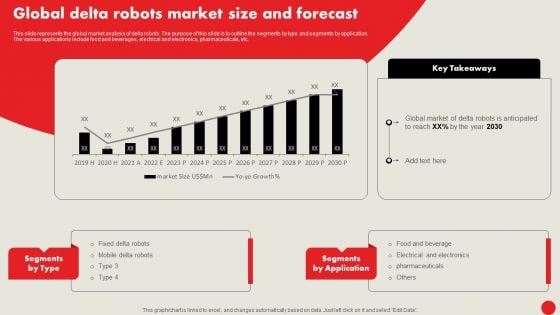
Types Of Robots For Industrial Operations Global Delta Robots Market Size And Forecast Mockup PDF
This slide represents the global market analysis of delta robots. The purpose of this slide is to outline the segments by type and segments by application. The various applications include food and beverages, electrical and electronics, pharmaceuticals, etc. Slidegeeks is here to make your presentations a breeze with Types Of Robots For Industrial Operations Global Delta Robots Market Size And Forecast Mockup PDF With our easy-to-use and customizable templates, you can focus on delivering your ideas rather than worrying about formatting. With a variety of designs to choose from, you are sure to find one that suits your needs. And with animations and unique photos, illustrations, and fonts, you can make your presentation pop. So whether you are giving a sales pitch or presenting to the board, make sure to check out Slidegeeks first
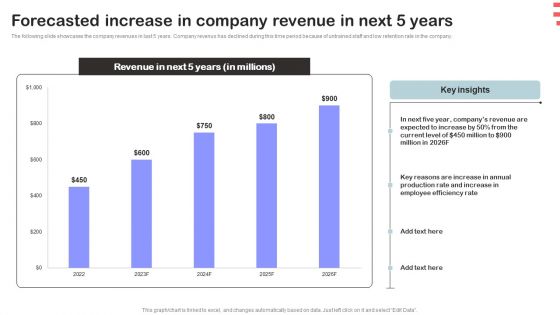
Corporate Training Program Forecasted Increase In Company Revenue In Next 5 Years Demonstration PDF
The following slide showcases the company revenues in last 5 years. Company revenus has declined during this time period because of untrained staff and low retention rate in the company. This modern and well arranged Corporate Training Program Forecasted Increase In Company Revenue In Next 5 Years Demonstration PDF provides lots of creative possibilities. It is very simple to customize and edit with the Powerpoint Software. Just drag and drop your pictures into the shapes. All facets of this template can be edited with Powerpoint no extra software is necessary. Add your own material, put your images in the places assigned for them, adjust the colors, and then you can show your slides to the world, with an animated slide included.
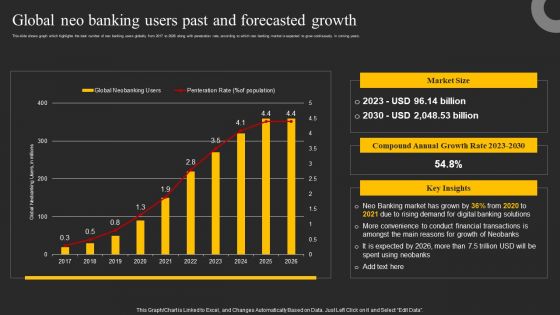
Global Neo Banking Users Past And Forecasted Growth Ppt Infographic Template Example Introduction PDF
This slide shows graph which highlights the total number of neo banking users globally from 2017 to 2026 along with penetration rate, according to which neo banking market is expected to grow continuously in coming years. Coming up with a presentation necessitates that the majority of the effort goes into the content and the message you intend to convey. The visuals of a PowerPoint presentation can only be effective if it supplements and supports the story that is being told. Keeping this in mind our experts created Global Neo Banking Users Past And Forecasted Growth Ppt Infographic Template Example Introduction PDF to reduce the time that goes into designing the presentation. This way, you can concentrate on the message while our designers take care of providing you with the right template for the situation.
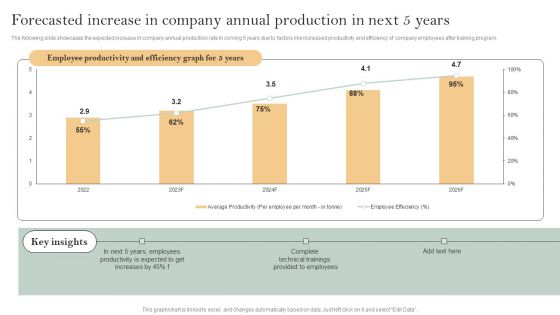
Skill Enhancement Plan Forecasted Increase In Company Annual Production In Next 5 Years Graphics PDF
The following slide showcases the expected increase in company annual production rate in coming 5 years due to factors like increased productivity and efficiency of company employees after training program. Are you in need of a template that can accommodate all of your creative concepts This one is crafted professionally and can be altered to fit any style. Use it with Google Slides or PowerPoint. Include striking photographs, symbols, depictions, and other visuals. Fill, move around, or remove text boxes as desired. Test out color palettes and font mixtures. Edit and save your work, or work with colleagues. Download Skill Enhancement Plan Forecasted Increase In Company Annual Production In Next 5 Years Graphics PDF and observe how to make your presentation outstanding. Give an impeccable presentation to your group and make your presentation unforgettable.
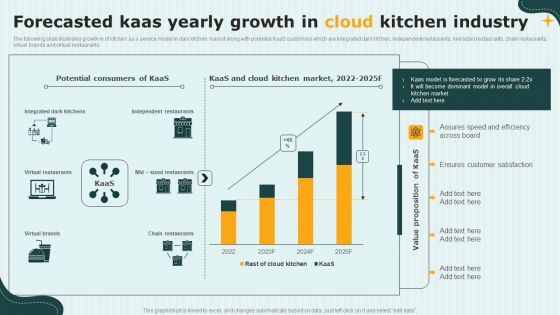
International Cloud Kitchen Industry Analysis Forecasted Kaas Yearly Growth In Cloud Kitchen Industry Slides PDF
The following slide illustrates growth in of kitchen as a service model in dark kitchen market along with potential KaaS customers which are integrated dark kitchen, independent restaurants, mid sized restaurants, chain restaurants, virtual brands and virtual restaurants. Coming up with a presentation necessitates that the majority of the effort goes into the content and the message you intend to convey. The visuals of a PowerPoint presentation can only be effective if it supplements and supports the story that is being told. Keeping this in mind our experts created International Cloud Kitchen Industry Analysis Forecasted Kaas Yearly Growth In Cloud Kitchen Industry Slides PDF to reduce the time that goes into designing the presentation. This way, you can concentrate on the message while our designers take care of providing you with the right template for the situation.
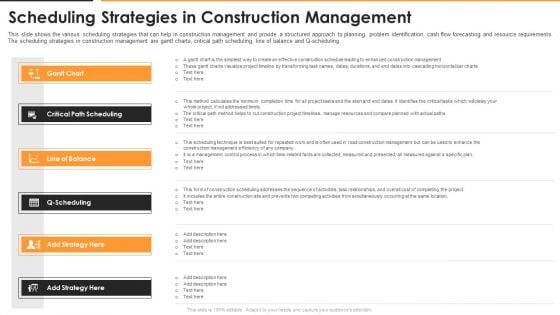
Scheduling Strategies In Construction Management Sample PDF
This slide shows the various scheduling strategies that can help in construction management and provide a structured approach to planning, problem identification, cash flow forecasting and resource requirements. The scheduling strategies in construction management are gantt charts, critical path scheduling, line of balance and Q scheduling. This is a scheduling strategies in construction management sample pdf template with various stages. Focus and dispense information on six stages using this creative set, that comes with editable features. It contains large content boxes to add your information on topics like project, resources, management, plan, technique. You can also showcase facts, figures, and other relevant content using this PPT layout. Grab it now.
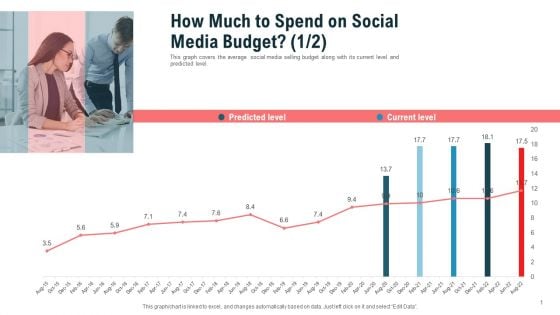
How Much To Spend On Social Media Budget Predicted Ppt Pictures Show PDF
This graph covers the average social media selling budget along with its current level and predicted level.Deliver an awe-inspiring pitch with this creative how much to spend on social media budget predicted ppt pictures show pdf. bundle. Topics like predicted level, current level can be discussed with this completely editable template. It is available for immediate download depending on the needs and requirements of the user.
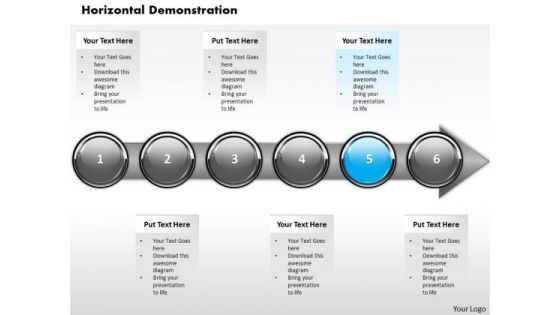
Ppt Consistent Demonstration Of Financial Process Using Stage 5 PowerPoint Templates
PPT consistent demonstration of financial process using stage 5 PowerPoint Templates-Highlight the key components of your entire financial process. Illustrate how each element flows seamlessly onto the next stage.-PPT consistent demonstration of financial process using stage 5 PowerPoint Templates-Abstract, Achievement, Aim, Arrow, Background, Business, Chart, Communication, Company, Competition, Concept, Design, Development, Diagram, Direction, Finance, Financial, Forecast, Forward, Goal, Graph, Graphic, Growth, Icon, Illustration, Increase, Investment, Leader, Leadership, Marketing, Motion, Moving, Orange, Path, Price, Process, Profit, Progress, Shape, Sign, Success, Symbol, Target, Team, Teamwork, Up, Upwards Crush your competition with our Ppt Consistent Demonstration Of Financial Process Using Stage 5 PowerPoint Templates. Just download, type and present.
Reinforcement Learning Techniques And Applications Performance Tracking Dashboard Reinforcement Diagrams PDF
This slide shows the roadmap for the reinforcement learning project, including the list of tasks to be performed from March 2023 to February 2024. The tasks include initializing the values table, observing the current state, choosing an action for that state, and so on. Formulating a presentation can take up a lot of effort and time, so the content and message should always be the primary focus. The visuals of the PowerPoint can enhance the presenters message, so our Reinforcement Learning Techniques And Applications Performance Tracking Dashboard Reinforcement Diagrams PDF was created to help save time. Instead of worrying about the design, the presenter can concentrate on the message while our designers work on creating the ideal templates for whatever situation is needed. Slidegeeks has experts for everything from amazing designs to valuable content, we have put everything into Reinforcement Learning Techniques And Applications Performance Tracking Dashboard Reinforcement Diagrams PDF
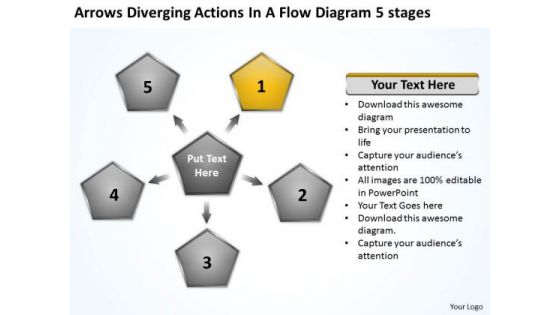
Actions In Flow Diagram 5 Stages Business Circular Layout Network PowerPoint Templates
We present our actions in flow diagram 5 stages business Circular Layout Network PowerPoint templates.Use our Ring Charts PowerPoint Templates because they are Designed to attract the attention of your audience. Download our Business PowerPoint Templates because the fruits of your labour are beginning to show.Enlighten them on the great plans you have for their enjoyment. Present our Future PowerPoint Templates because let this slide illustrates others piggyback on you to see well over the horizon. Present our Process and Flows PowerPoint Templates because with the help of our Slides you can Illustrate your plans to your listeners with the same accuracy. Use our Marketing PowerPoint Templates because The marketplace is the merger of your dreams and your ability. Use these PowerPoint slides for presentations relating to Abstract, action, analysis, blank,business, chart, clipart, commerce,concept, conceptual, design, diagram,direction, flow, generic, goals, guide,guidelines, heirarchy, icon, idea,illustration, lingakes, links, manage,management, mba, model, organization,performance, plan, process, project,representation, resource,steps, strategy, success. The prominent colors used in the PowerPoint template are Black, Yellow, Gray. You can be sure our actions in flow diagram 5 stages business Circular Layout Network PowerPoint templates are effectively colour coded to prioritise your plans They automatically highlight the sequence of events you desire. Professionals tell us our analysis PowerPoint templates and PPT Slides are Versatile. PowerPoint presentation experts tell us our actions in flow diagram 5 stages business Circular Layout Network PowerPoint templates help you meet deadlines which are an element of today's workplace. Just browse and pick the slides that appeal to your intuitive senses. You can be sure our clipart PowerPoint templates and PPT Slides are Magnificent. You can be sure our actions in flow diagram 5 stages business Circular Layout Network PowerPoint templates are Nostalgic. The feedback we get is that our analysis PowerPoint templates and PPT Slides are Magical. Earn a fortune with our Actions In Flow Diagram 5 Stages Business Circular Layout Network PowerPoint Templates. Dont waste time struggling with PowerPoint. Let us do it for you.
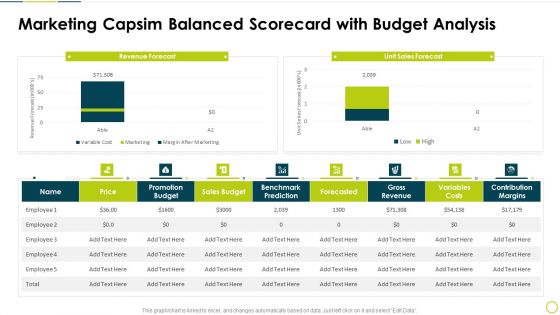
Marketing Capsim Balanced Scorecard With Budget Analysis Slides PDF
Deliver and pitch your topic in the best possible manner with this Marketing Capsim Balanced Scorecard With Budget Analysis Slides PDF. Use them to share invaluable insights on Revenue Forecast, Unit Sales Forecast, Price and impress your audience. This template can be altered and modified as per your expectations. So, grab it now.
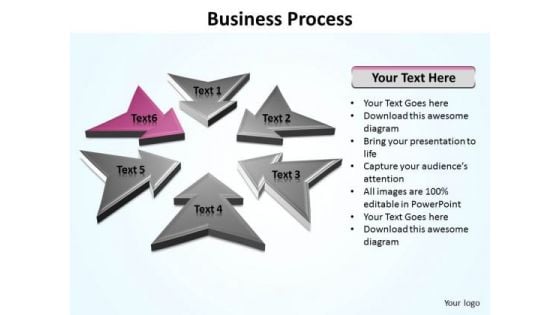
Ppt Direction Arrows Of World Business PowerPoint Templates Process Editable
PPT direction arrows of world business powerpoint templates process editable-Use this arrow diagram to make a brainstorming of the relevant factors that apply to you organization.Summarize with your own conclusions about information.-PPT direction arrows of world business powerpoint templates process editable-Abstract, Achievement, Aim, Arrow, Background, Business, Chart, Communication, Competition, Concept, Design, Direction, Development, Diagram, Direction, Finance, Financial, Forecast, Forward, Goal, Graph, Graphic, Growth, Icon, Illustration, Increase, Investment, Leader, Leadership, Design, Marketing, Price, Process, Profit, Progress, Progress, Shape, Sign, Success, Symbol, Target, Team, Teamwork With our Ppt Direction Arrows Of World Business PowerPoint Templates Process Editable you won't have to feel your way. They will strike a chord straightaway.
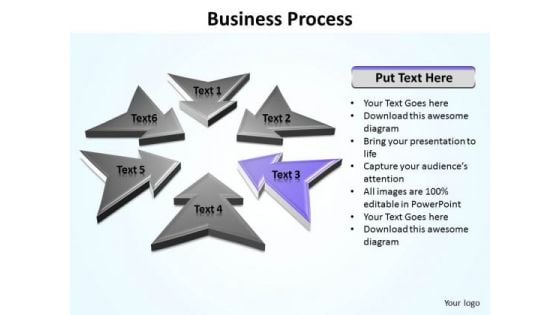
Ppt Direction Arrows Of Layout Editable PowerPoint World Map Templates
PPT direction arrows of layout editable powerpoint world map Templates-The above template contains a graphic of arrows pointing towards the center. Clarity of thought has been the key to your growth. Use our templates to illustrate your ability.-PPT direction arrows of layout editable powerpoint world map Templates-Abstract, Achievement, Aim, Arrow, Background, Business, Chart, Communication, Competition, Concept, Design, Direction, Development, Diagram, Direction, Finance, Financial, Forecast, Forward, Goal, Graph, Graphic, Growth, Icon, Illustration, Increase, Investment, Leader, Leadership, Design, Marketing, Price, Process, Profit, Progress, Progress, Shape, Sign, Success, Symbol, Target, Team, Teamwork Augment your assets with our Ppt Direction Arrows Of Layout Editable PowerPoint World Map Templates. They have many desirable attributes.
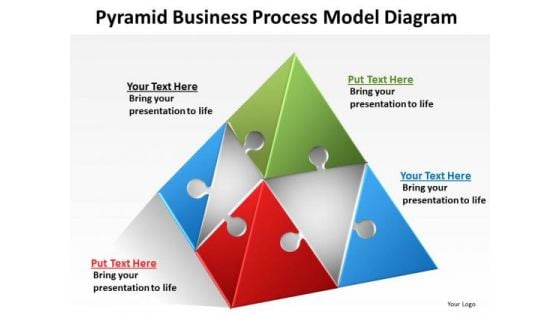
PowerPoint Templates Process Model Diagram Circular Flow
We present our powerpoint templates process model diagram Circular Flow.Present our Pyramids PowerPoint Templates because this template helps you to put your finger on the pulse of your business and sense the need to re-align a bit. Use our Business PowerPoint Templates because it illustrates the city with a lasting tryst with resilience. You epitomise the qualities that give your city its fame. Present our Shapes PowerPoint Templates because this diagram helps you to develop your marketing strategy and communicate your enthusiasm and motivation to raise the bar. Use our Leadership PowerPoint Templates because this diagram helps you to discuss each step slowly but surely move up the pyramid narrowing down to the best and most success oriented project. Use our Symbol PowerPoint Templates because using our templates for your colleagues will impart knowledge to feed.Use these PowerPoint slides for presentations relating to 3d, Abstract, Answer, Blocks, Blue, Box, Business, Challenge, Collect, Color, Concept, Connect, Construction, Contrast, Creative, Difference, Different, Digital, Education, En, Equipment, Example, Geometry, Group, Icon, Isolated, Object, Organization, Organized, Part, Perspective, Pieces, Plastic, Puzzle, Pyramid, Red, Shape, Sign, Skill, Solution, Stages, Success, Three, Togetherness, Toy, Triangle, Unity. The prominent colors used in the PowerPoint template are Red, Green, Blue. We assure you our powerpoint templates process model diagram Circular Flow are Handsome. Customers tell us our Collect PowerPoint templates and PPT Slides are Fashionable. The feedback we get is that our powerpoint templates process model diagram Circular Flow are Upbeat. We assure you our Challenge PowerPoint templates and PPT Slides are Dynamic. People tell us our powerpoint templates process model diagram Circular Flow are designed to make your presentations professional. We assure you our Challenge PowerPoint templates and PPT Slides are Ultra. Avoid delays with our PowerPoint Templates Process Model Diagram Circular Flow. They accelerate your thought process.
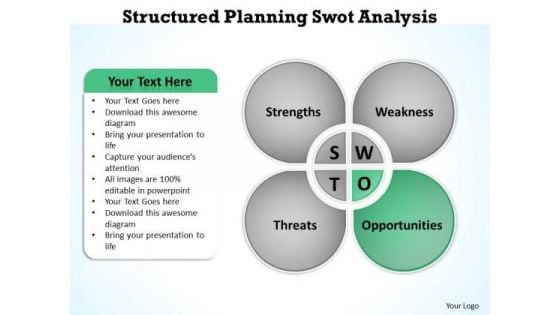
Business Architecture Diagrams Structured Planning Swot Analysis PowerPoint Slides
We present our business architecture diagrams structured planning swot analysis PowerPoint Slides.Use our Advertising PowerPoint Templates because colours generate instant reactions in our brains. Download and present our Business PowerPoint Templates because your product has established a foothold in the market. Customers are happy with the value it brings to their lives. Present our Marketing PowerPoint Templates because The marketplace is the merger of your dreams and your ability. Present our Finance PowerPoint Templates because readymade PowerPoint templates can prove best of your knowledge for your slides to show. Present our Shapes PowerPoint Templates because business ethics is an essential element in your growth.Use these PowerPoint slides for presentations relating to Abstract, Action, Analysis, Business, Chart, Clipart, Commerce, Concept, Conceptual, Design, Diagram, Direction, Dry-Erase, Goals, Guide, Icon, Idea, Illustration, Manage, Management, Mba, Model, Opportunity, Organization, Performance, Plan, Process, Project, Representation, Resource, Sketch, Strategy, Strength, Success, Swot. The prominent colors used in the PowerPoint template are Green, Gray, White. PowerPoint presentation experts tell us our business architecture diagrams structured planning swot analysis PowerPoint Slides are Colorful. Professionals tell us our Conceptual PowerPoint templates and PPT Slides will help you be quick off the draw. Just enter your specific text and see your points hit home. People tell us our business architecture diagrams structured planning swot analysis PowerPoint Slides are Clever. We assure you our Clipart PowerPoint templates and PPT Slides are Dazzling. PowerPoint presentation experts tell us our business architecture diagrams structured planning swot analysis PowerPoint Slides are Pretty. Professionals tell us our Commerce PowerPoint templates and PPT Slides will help you be quick off the draw. Just enter your specific text and see your points hit home. Thoughts won't dry up with our Business Architecture Diagrams Structured Planning Swot Analysis PowerPoint Slides. They keep your brain going at it all the time.
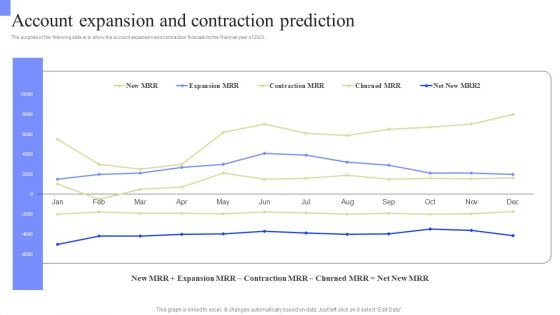
Periodic Revenue Model Account Expansion And Contraction Prediction Summary PDF
The purpose of the following slide is to show the account expansion and contraction forecast for the financial year of 2023. Presenting this PowerPoint presentation, titled Periodic Revenue Model Account Expansion And Contraction Prediction Summary PDF, with topics curated by our researchers after extensive research. This editable presentation is available for immediate download and provides attractive features when used. Download now and captivate your audience. Presenting this Periodic Revenue Model Account Expansion And Contraction Prediction Summary PDF. Our researchers have carefully researched and created these slides with all aspects taken into consideration. This is a completely customizable Periodic Revenue Model Account Expansion And Contraction Prediction Summary PDF that is available for immediate downloading. Download now and make an impact on your audience. Highlight the attractive features available with our PPTs.
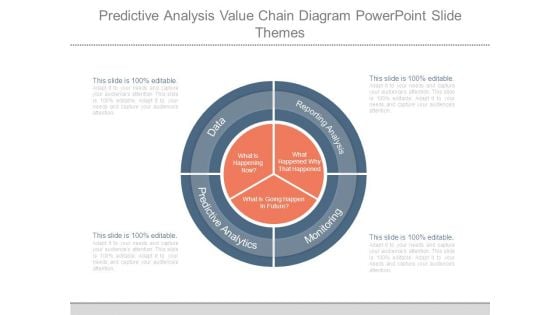
Predictive Analysis Value Chain Diagram Powerpoint Slide Themes
This is a predictive analysis value chain diagram powerpoint slide themes. This is a four stage process. The stages in this process are what is happening now, what is going happen in future, what happened why that happened, data, predictive analytics, reporting analysis, monitoring.
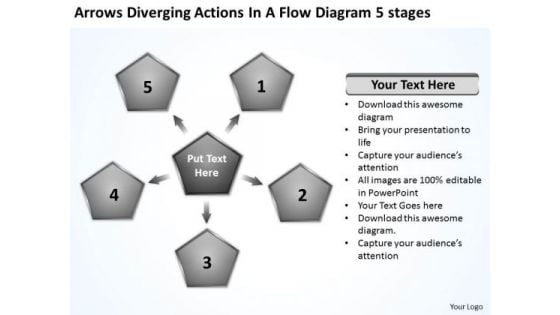
Actions In Flow Diagram 5 Stages Circular Layout Network PowerPoint Templates
We present our actions in flow diagram 5 stages Circular Layout Network PowerPoint templates.Use our Business PowerPoint Templates because spell out your advertising plans to increase market share. The feedback has been positive and productive. Download our Marketing PowerPoint Templates because networking is an imperative in todays world. You need to access the views of others. Similarly you need to give access to them of your abilities. Download our Future PowerPoint Templates because analyse your plans with equal sincerity. Download and present our Process and Flows PowerPoint Templates because it helps to churn the mixture to the right degree and pound home your views and expectations in a spectacularly grand and virtuoso fluid performance. Download our Marketing PowerPoint Templates because our PowerPoint templates designed for your ideas to sell.Use these PowerPoint slides for presentations relating to Action, adding, arrow, business, chart,circulation, communication, connection,conservation, cycle, data, design,direction, element, flow, flowchart, graph,graphic, group, icon, illustration, isolated,label, loop, management, network,orientation, planning, process, project,recycling, repeat, repetition, return,reuse, rotation, sign, sticker, strategy,symbol. The prominent colors used in the PowerPoint template are Gray, White, Black. You can be sure our actions in flow diagram 5 stages Circular Layout Network PowerPoint templates are Versatile. Professionals tell us our connection PowerPoint templates and PPT Slides are Ritzy. PowerPoint presentation experts tell us our actions in flow diagram 5 stages Circular Layout Network PowerPoint templates are the best it can get when it comes to presenting. You can be sure our business PowerPoint templates and PPT Slides are specially created by a professional team with vast experience. They diligently strive to come up with the right vehicle for your brilliant Ideas. You can be sure our actions in flow diagram 5 stages Circular Layout Network PowerPoint templates are Spiffy. The feedback we get is that our business PowerPoint templates and PPT Slides are Classic. Your thoughts will leave an everlasting image. Etch them in the memory with our Actions In Flow Diagram 5 Stages Circular Layout Network PowerPoint Templates.
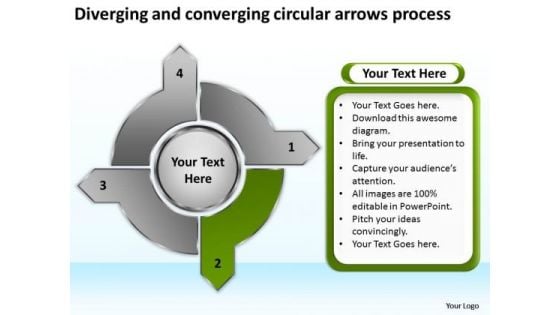
And Converging Circular Arrows Process Success Motion PowerPoint Templates
We present our and converging circular arrows process success Motion PowerPoint templates.Present our Arrow PowerPoint Templates because this diagram helps you to discuss each step slowly but surely move up the pyramid narrowing down to the best and most success oriented project. Use our Marketing PowerPoint Templates because this PPt slide helps you to measure key aspects of the current process and collect relevant data. Present our Process and Flows PowerPoint Templates because this is a good example of the strength of teamwork. Download and present our Ring Charts PowerPoint Templates because your quicksilver ideas are the arrows in your quiver. Use our Shapes PowerPoint Templates because you can Lead your flock steadily to greater heights. Look around at the vast potential of achievement around you.Use these PowerPoint slides for presentations relating to Arrow, chart, chromatic, circle,circular, circulation, collection, color,concept, connection, continuity, cursor,cycle, cyclic, diagram, direction, dynamic,element, flow, flowchart, graph, graphic,group, icon, loop, motion, movement,multicolored, paint, palette, pantone,process, progress, rainbow, recycle,recycling, repetition, ring, rotation, round,set, sign, six, spectrum, spin, symbol,. The prominent colors used in the PowerPoint template are Green, Black, White. You can be sure our and converging circular arrows process success Motion PowerPoint templates are Sparkling. Professionals tell us our collection PowerPoint templates and PPT Slides are Awesome. PowerPoint presentation experts tell us our and converging circular arrows process success Motion PowerPoint templates are Appealing. You can be sure our concept PowerPoint templates and PPT Slides are Elegant. You can be sure our and converging circular arrows process success Motion PowerPoint templates will make you look like a winner. The feedback we get is that our circular PowerPoint templates and PPT Slides are Excellent. Raise the bar with our And Converging Circular Arrows Process Success Motion PowerPoint Templates. You will come out on top.
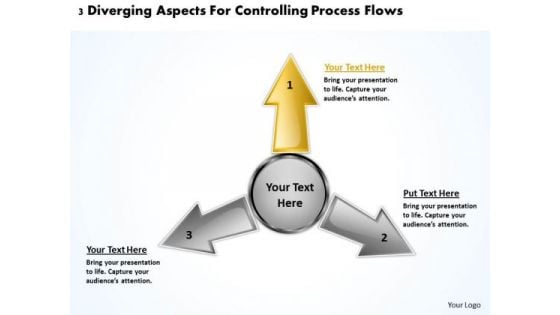
Aspects For Controlling Process Flows Relative Circular Arrow Network PowerPoint Template
We present our aspects for controlling process flows Relative Circular Arrow Network PowerPoint template.Download and present our Process and Flows PowerPoint Templates because you have to coordinate and motivate your team. Use our Business PowerPoint Templates because your ideas too are pinpointedly focused on you goals. Download our Flow Charts PowerPoint Templates because the structure of our templates allows you to effectively highlight the key issues concerning the growth of your business. Present our Marketing PowerPoint Templates because The marketplace is the merger of your dreams and your ability. Use our Arrows PowerPoint Templates because firing the arrows to emblazon the desired path will let you achieve anticipated results.Use these PowerPoint slides for presentations relating to Business, chart, clipart, commerce,concept, conceptual, design, diagram,direction, flow, generic, goals, guide,guidelines, heirarchy, icon, idea,illustration, lingakes, links, manage,management, mba, model, organization,performance, plan, process, project,relationship, representation, resource,steps, strategy, success, tactics,theoretical, theory, tool, wo. The prominent colors used in the PowerPoint template are Green lime, Black, White. You can be sure our aspects for controlling process flows Relative Circular Arrow Network PowerPoint template are visually appealing. PowerPoint presentation experts tell us our direction PowerPoint templates and PPT Slides are Chic. Professionals tell us our aspects for controlling process flows Relative Circular Arrow Network PowerPoint template are Graceful. Presenters tell us our commerce PowerPoint templates and PPT Slides are Youthful. Professionals tell us our aspects for controlling process flows Relative Circular Arrow Network PowerPoint template will impress their bosses and teams. Customers tell us our concept PowerPoint templates and PPT Slides have awesome images to get your point across. Foster good ethics with our Aspects For Controlling Process Flows Relative Circular Arrow Network PowerPoint Template. Your thoughts will set an impeccable example.
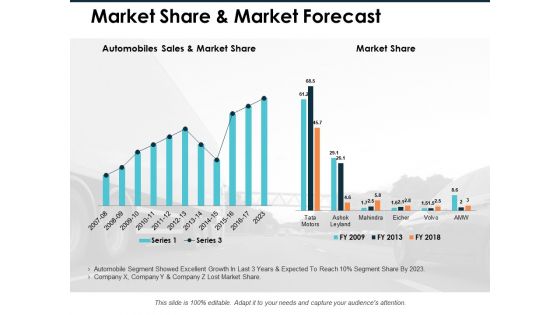
Market Share And Market Forecast Ppt PowerPoint Presentation Inspiration Example Introduction
This is a market share and market forecast ppt powerpoint presentation inspiration example introduction. This is a two stage process. The stages in this process are finance, marketing, management, investment, analysis.
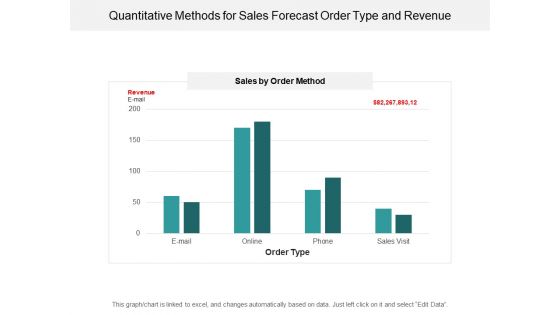
Quantitative Methods For Sales Forecast Order Type And Revenue Ppt PowerPoint Presentation Styles Show
This is a quantitative methods for sales forecast order type and revenue ppt powerpoint presentation styles show. This is a four stage process. The stages in this process are financial analysis, quantitative, statistical modelling.
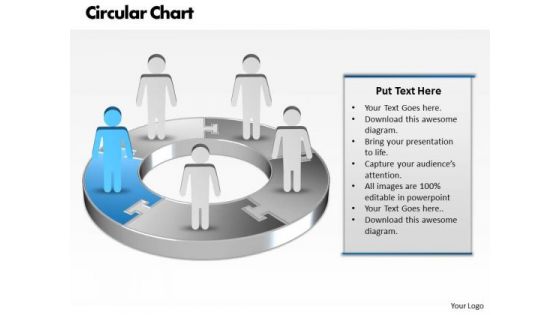
Ppt Blue Men Standing On Business Pie Organization Chart PowerPoint Template Templates
PPT blue men standing on business pie organization chart powerpoint template Templates-Use this Business based PowerPoint Diagram to represent the Business issues Graphically. It indicates arrange, block out, blueprint, cast, delineate, design, devise, draft, graph , lay out, outline, plot, project, shape, sketch etc.-PPT blue men standing on business pie organization chart powerpoint template Templates-arrow, art, basic, blank, business, capital, chart, chevron, clip, clipart, colorful, conglomerates, consumer, copy, cyclical, energy, financial, flow, goods, graph, graphic, healthcare, illustration, infographic, information, investment, isolated, market, materials, non, round, sectors, services, slide, space, stock, technology, text, Our Ppt Blue Men Standing On Business Pie Organization Chart PowerPoint Template Templates are never a drag. The audience will be always attentive.
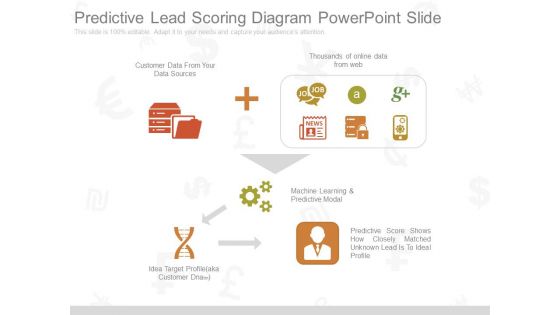
Predictive Lead Scoring Diagram Powerpoint Slide
This is a predictive lead scoring diagram powerpoint slide. This is a one stage process. The stages in this process are thousands of online data from web, customer data from your data sources, machine learning and predictive modal, predictive score shows how closely matched unknown lead is to ideal profile, idea target profile aka customer dnatm.
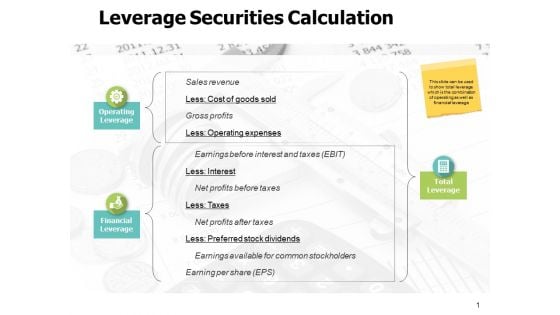
Leverage Securities Calculation Ppt PowerPoint Presentation Model
This is a leverage securities calculation ppt powerpoint presentation model. The topics discussed in this diagram are marketing, business, management, planning, strategy This is a completely editable PowerPoint presentation, and is available for immediate download.
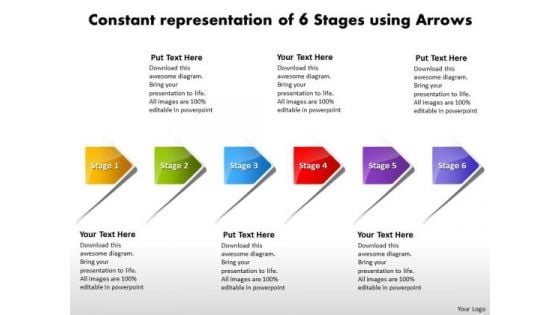
Constant Representation Of 6 Stages Using Arrows Vision Flowchart Templates PowerPoint Slides
We present our constant representation of 6 stages using arrows vision flowchart templates PowerPoint Slides.Use our Business PowerPoint Templates because,A lot of dissimilar elements needing to gel to strike the deal. Use our Arrows PowerPoint Templates because,This diagram provides multiple options for taking in and making sense of information. Use our Shapes PowerPoint Templates because, You have it all down to a nicety, slice by slice, layer by layer. Use our Marketing PowerPoint Templates because,they will help you to organise the logic of your views. Use our Success PowerPoint Templates because, You have some exciting plans to spread goodwill among the underprivileged, Expound on your ideas and show to your colleagues how they can help others and in the process increase your Brand value.Use these PowerPoint slides for presentations relating to business, chart, clipart, commerce, concept, corporate, design, diagram, goals, guidelines, hierarchy, icon, idea, management, market, marketing, mission, organization, performance, plans, price, process, product, project, promotion, representation, sales, strategy, success, target. The prominent colors used in the PowerPoint template are Yellow, Green, Blue. People tell us our constant representation of 6 stages using arrows vision flowchart templates PowerPoint Slides are Fancy. The feedback we get is that our corporate PowerPoint templates and PPT Slides are Endearing. People tell us our constant representation of 6 stages using arrows vision flowchart templates PowerPoint Slides are Exuberant. Presenters tell us our design PowerPoint templates and PPT Slides are Energetic. The feedback we get is that our constant representation of 6 stages using arrows vision flowchart templates PowerPoint Slides are Royal. Professionals tell us our corporate PowerPoint templates and PPT Slides are Radiant. Modify plans with our Constant Representation Of 6 Stages Using Arrows Vision Flowchart Templates PowerPoint Slides. Download without worries with our money back guaranteee.
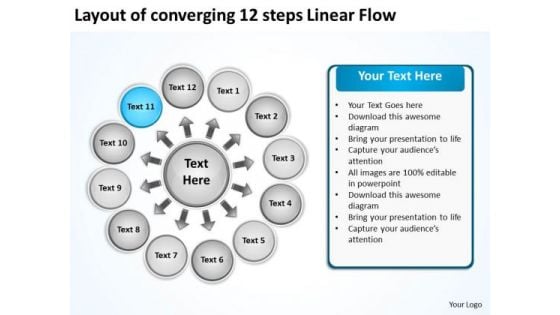
Layout Of Converging 12 Steps Linear Flow Ppt Cycle Network PowerPoint Templates
We present our layout of converging 12 steps linear flow ppt Cycle Network PowerPoint templates.Download and present our Symbol PowerPoint Templates because this diagram helps you to discuss each step slowly but surely move up the pyramid narrowing down to the best and most success oriented project. Download and present our Business PowerPoint Templates because it illustrates the city with a lasting tryst with resilience. You epitomise the qualities that give your city its fame. Download our Arrows PowerPoint Templates because you have a clear vision of the cake you want. Download our Shapes PowerPoint Templates because excite your audience with the brilliance of your thoughts. Download our Process and Flows PowerPoint Templates because with the help of our Slides you can Illustrate these thoughts with this slide.Use these PowerPoint slides for presentations relating to Arrows, Business, Central, Centralized, Chart, Circle, Circular, Circulation, Concept, Conceptual, Converging, Design, Diagram, Executive, Icon, Idea, Illustration, Management, Mapping, Model, Numbers, Organization, Outwards, Pointing, Procedure, Process, Radial, Radiating, Relationship, Resource, Sequence, Sequential, Square. The prominent colors used in the PowerPoint template are Blue, Gray, White. Use our layout of converging 12 steps linear flow ppt Cycle Network PowerPoint templates provide you with a vast range of viable options. Select the appropriate ones and just fill in your text. We assure you our Central PowerPoint templates and PPT Slides are Appealing. People tell us our layout of converging 12 steps linear flow ppt Cycle Network PowerPoint templates are incredible easy to use. PowerPoint presentation experts tell us our Circular PowerPoint templates and PPT Slides are Ritzy. PowerPoint presentation experts tell us our layout of converging 12 steps linear flow ppt Cycle Network PowerPoint templates are Quaint. Use our Circular PowerPoint templates and PPT Slides are Gorgeous. Get the nod for your plans with our Layout Of Converging 12 Steps Linear Flow Ppt Cycle Network PowerPoint Templates. You will be at the top of your game.
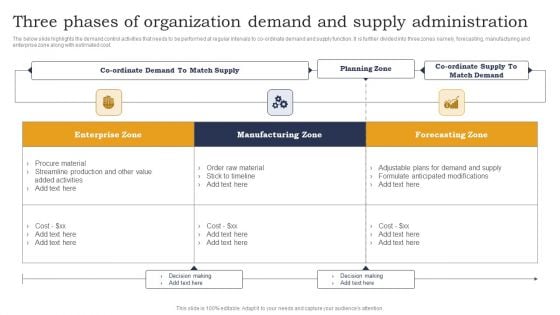
Three Phases Of Organization Demand And Supply Administration Diagrams PDF
The below slide highlights the demand control activities that needs to be performed at regular intervals to co-ordinate demand and supply function. It is further divided into three zones namely, forecasting, manufacturing and enterprise zone along with estimated cost. Showcasing this set of slides titled Three Phases Of Organization Demand And Supply Administration Diagrams PDF. The topics addressed in these templates are Enterprise Zone, Manufacturing Zone, Forecasting Zone. All the content presented in this PPT design is completely editable. Download it and make adjustments in color, background, font etc. as per your unique business setting.

Steps Post Pre Building Construction Meeting Graphics PDF
This slide shows steps after pre construction meeting to create a strategic plan for the project. It includes methods such as engineering assessment, cost estimation, responsibility matrix, initial schedule, and guidance. Presenting Steps Post Pre Building Construction Meeting Graphics PDF to dispense important information. This template comprises five stages. It also presents valuable insights into the topics including Cost Estimate, Guidance, Responsibility Matrix. This is a completely customizable PowerPoint theme that can be put to use immediately. So, download it and address the topic impactfully.

Business Forecast And Strategy Vision PowerPoint Templates Ppt Backgrounds For Slides 0413
We present our Business Forecast And Strategy Vision PowerPoint Templates PPT Backgrounds For Slides 0413.Download and present our Marketing PowerPoint Templates because Our PowerPoint Templates and Slides are designed to help you succeed. They have all the ingredients you need. Use our Success PowerPoint Templates because You aspire to touch the sky with glory. Let our PowerPoint Templates and Slides provide the fuel for your ascent. Download and present our People PowerPoint Templates because Our PowerPoint Templates and Slides will bullet point your ideas. See them fall into place one by one. Download our Business PowerPoint Templates because Our PowerPoint Templates and Slides are a sure bet. Gauranteed to win against all odds. Download our Targets PowerPoint Templates because You can Be the star of the show with our PowerPoint Templates and Slides. Rock the stage with your ideas.Use these PowerPoint slides for presentations relating to Business man create business plan concept, business, people, marketing, success, targets. The prominent colors used in the PowerPoint template are Green, Gray, White. Take a blind date with our Business Forecast And Strategy Vision PowerPoint Templates Ppt Backgrounds For Slides 0413. You will be charmed to the core.
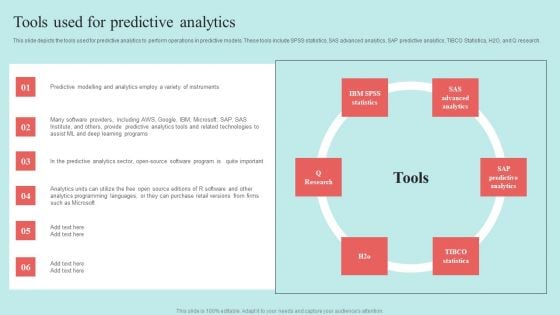
Predictive Data Model Tools Used For Predictive Analytics Download PDF
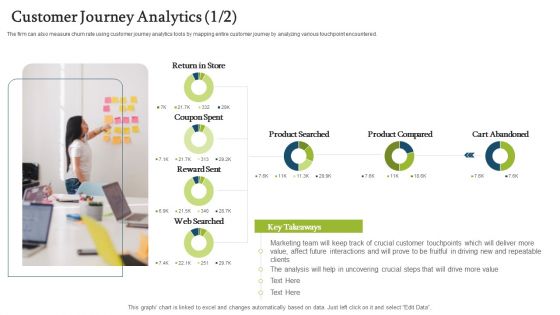
Forecasting And Managing Consumer Attrition For Business Advantage Customer Journey Analytics Searched Formats PDF
Deliver an awe inspiring pitch with this creative forecasting and managing consumer attrition for business advantage customer journey analytics searched formats pdf bundle. Topics like product searched, product compared, cart abandoned can be discussed with this completely editable template. It is available for immediate download depending on the needs and requirements of the user.
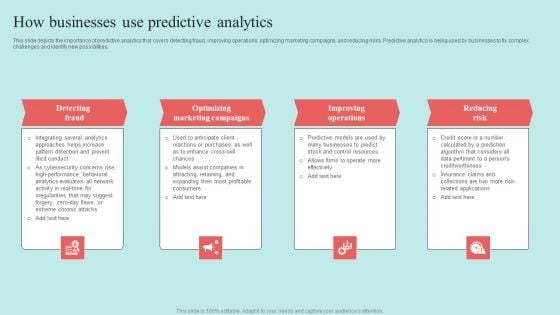
Predictive Data Model How Businesses Use Predictive Analytics Topics PDF
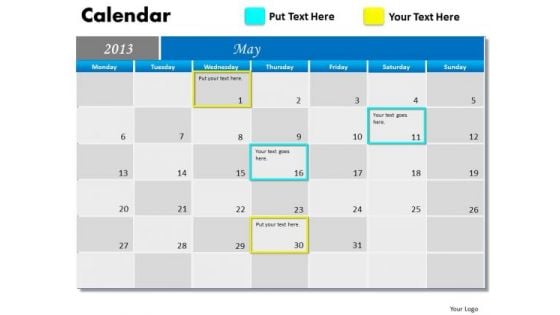
May 2013 Calendar PowerPoint Slides Ppt Templates
We present our May 2013 Calendar PowerPoint Slides PPT templates.Download our Calendars PowerPoint Templates because business ethics is an essential element in your growth. Download our New Year PowerPoint Templates because this is a time to reflect and retrospect on successes and failures. Download our Timelines PowerPoint Templates because it shows subtle changes that are taking place. Present our Targets PowerPoint Templates because you have a great plan to put the pieces together, getting all the various contributors to gel for a successful completion. Present our Time Planning PowerPoint Templates because this diagram helps you to discuss each step slowly but surely move up the pyramid narrowing down to the best and most success oriented project.Use these PowerPoint slides for presentations relating to 2013, Abstract, Agenda, Annual, April, Background, Book, Business, Calendar, Calendar, Content, Date, Day, Design, Desk, Diary, Document, Editable, Element, Eps10, Graphic, Green, Icon, Illustration, Layout, Monday, Month, Monthly, New, Note, Notepaper, Number, Old, Organizer, Paper, Plan, Planner. The prominent colors used in the PowerPoint template are Blue, Blue light, Yellow. PowerPoint presentation experts tell us our May 2013 Calendar PowerPoint Slides PPT templates are Detailed. You can be sure our April PowerPoint templates and PPT Slides are Endearing. Presenters tell us our May 2013 Calendar PowerPoint Slides PPT templates are Breathtaking. We assure you our Agenda PowerPoint templates and PPT Slides are Festive. Professionals tell us our May 2013 Calendar PowerPoint Slides PPT templates are Versatile. The feedback we get is that our April PowerPoint templates and PPT Slides are Upbeat. Our May 2013 Calendar PowerPoint Slides Ppt Templates don't fib about. They display factual conditions.
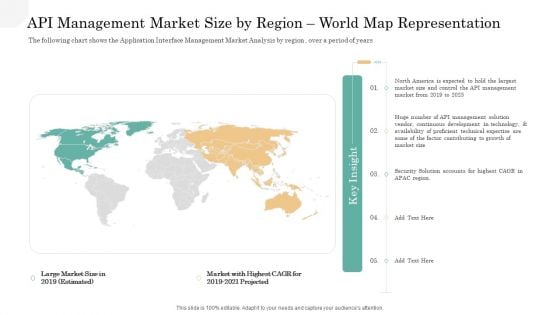
API Management Market API Management Market Size By Region World Map Representation Guidelines PDF
The following chart shows the Application Interface Management Market Analysis by region , over a period of years. Presenting api management market api management market size by region world map representation guidelines pdf to provide visual cues and insights. Share and navigate important information on five stages that need your due attention. This template can be used to pitch topics like management, technical, security solution accounts, market with highest cagr for 2019 2021 projected. In addtion, this PPT design contains high resolution images, graphics, etc, that are easily editable and available for immediate download.
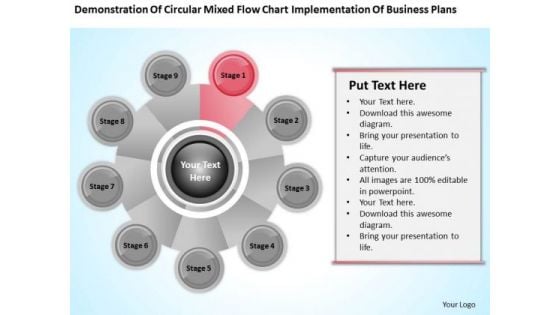
Business Analysis Diagrams Flow Chart Implementation Plans PowerPoint Templates
We present our business analysis diagrams flow chart implementation plans PowerPoint templates.Present our Business PowerPoint Templates because It will get your audience in sync. Download our Circle Charts PowerPoint Templates because Your ideas provide food for thought. Our PowerPoint Templates and Slides will help you create a dish to tickle the most discerning palate. Present our Shapes PowerPoint Templates because our PowerPoint Templates and Slides will give your ideas the shape. Download our Process and Flows PowerPoint Templates because Our PowerPoint Templates and Slides has conjured up a web of all you need with the help of our great team. Use them to string together your glistening ideas. Present our Leadership PowerPoint Templates because Watching this your Audience will Grab their eyeballs, they wont even blink.Use these PowerPoint slides for presentations relating to project, flow, process, business, system, success, chart, work, innovation, implementation, plan, concept, evaluation, presentation, symbol, internet, diagram, analysis, flowchart, analyzing, technology, idea, development, management, steps, strategy, addie, design, outcome, assessment, structure. The prominent colors used in the PowerPoint template are Red, Gray, White. Our Business Analysis Diagrams Flow Chart Implementation Plans PowerPoint Templates really apply themselves. They do everything to display your thoughts.
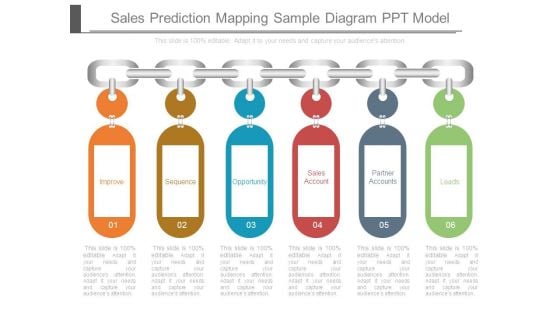
Sales Prediction Mapping Sample Diagram Ppt Model
This is a sales prediction mapping sample diagram ppt model. This is a six stage process. The stages in this process are improve, sequence, opportunity, sales account, partner accounts, leads.
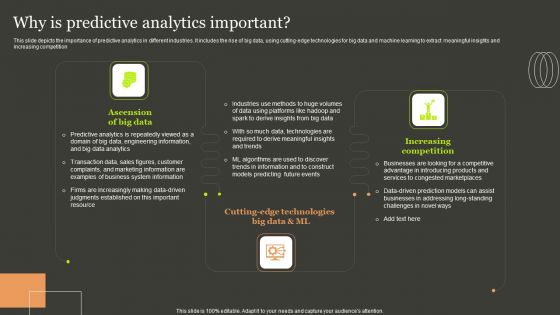
Predictive Analytics Methods Why Is Predictive Analytics Important Ideas PDF
This slide depicts the importance of predictive analytics in different industries. It includes the rise of big data, using cutting-edge technologies for big data and machine learning to extract meaningful insights and increasing competition. Whether you have daily or monthly meetings, a brilliant presentation is necessary. Predictive Analytics Methods Why Is Predictive Analytics Important Ideas PDF can be your best option for delivering a presentation. Represent everything in detail using Predictive Analytics Methods Why Is Predictive Analytics Important Ideas PDF and make yourself stand out in meetings. The template is versatile and follows a structure that will cater to your requirements. All the templates prepared by Slidegeeks are easy to download and edit. Our research experts have taken care of the corporate themes as well. So, give it a try and see the results.
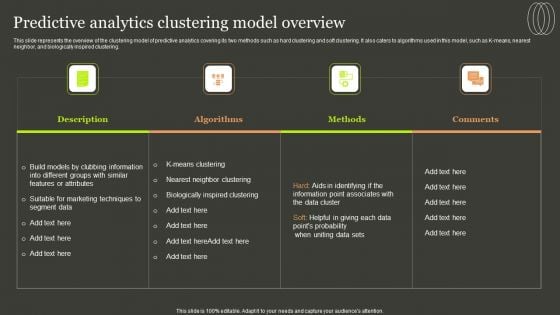
Predictive Analytics Methods Predictive Analytics Clustering Model Overview Template PDF
This slide represents the overview of the clustering model of predictive analytics covering its two methods such as hard clustering and soft clustering. It also caters to algorithms used in this model, such as K-means, nearest neighbor, and biologically inspired clustering. Whether you have daily or monthly meetings, a brilliant presentation is necessary. Predictive Analytics Methods Predictive Analytics Clustering Model Overview Template PDF can be your best option for delivering a presentation. Represent everything in detail using Predictive Analytics Methods Predictive Analytics Clustering Model Overview Template PDF and make yourself stand out in meetings. The template is versatile and follows a structure that will cater to your requirements. All the templates prepared by Slidegeeks are easy to download and edit. Our research experts have taken care of the corporate themes as well. So, give it a try and see the results.
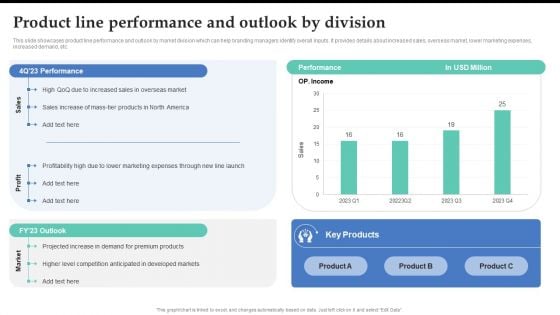
Product Line Performance And Outlook By Division Brand Expansion Strategy Execution Information PDF
This slide showcases product line performance and outlook by market division which can help branding managers identify overall inputs. It provides details about increased sales, overseas market, lower marketing expenses, increased demand, etc. Retrieve professionally designed Product Line Performance And Outlook By Division Brand Expansion Strategy Execution Information PDF to effectively convey your message and captivate your listeners. Save time by selecting pre-made slideshows that are appropriate for various topics, from business to educational purposes. These themes come in many different styles, from creative to corporate, and all of them are easily adjustable and can be edited quickly. Access them as PowerPoint templates or as Google Slides themes. You do not have to go on a hunt for the perfect presentation because Slidegeeks got you covered from everywhere.

Organizing Security Awareness Operational Outlook Of Security Awareness Training Ideas PDF
The purpose of this slide is to showcase the general outlook of cyber security awareness training software. The slide covers information about opened simulations, links clicked, reported, attachments opened, data entered etc. Retrieve professionally designed Organizing Security Awareness Operational Outlook Of Security Awareness Training Ideas PDF to effectively convey your message and captivate your listeners. Save time by selecting pre-made slideshows that are appropriate for various topics, from business to educational purposes. These themes come in many different styles, from creative to corporate, and all of them are easily adjustable and can be edited quickly. Access them as PowerPoint templates or as Google Slides themes. You dont have to go on a hunt for the perfect presentation because Slidegeeks got you covered from everywhere.
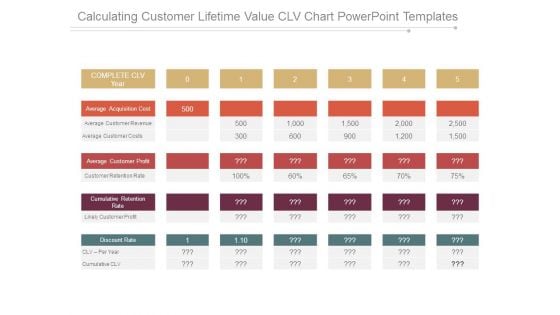
Calculating Customer Lifetime Value Clv Chart Powerpoint Templates
This is a calculating customer lifetime value clv chart powerpoint templates. This is a five stage process. The stages in this process are complete clv year, average acquisition cost, average customer revenue, average customer costs, average customer profit, customer retention rate, cumulative retention rate, likely customer profit, discount rate, clv per year, cumulative clv.
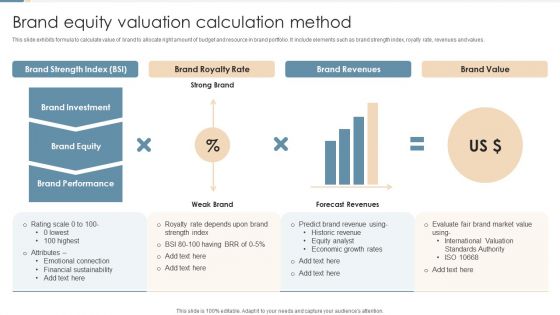
Brand Equity Valuation Calculation Method Ppt Visual Aids PDF
This slide exhibits formula to calculate value of brand to allocate right amount of budget and resource in brand portfolio. It include elements such as brand strength index, royalty rate, revenues and values. Showcasing this set of slides titled Brand Equity Valuation Calculation Method Ppt Visual Aids PDF. The topics addressed in these templates are Brand Strength Index, Brand Royalty Rate, Brand Revenues. All the content presented in this PPT design is completely editable. Download it and make adjustments in color, background, font etc. as per your unique business setting.

 Home
Home