Project Kpi
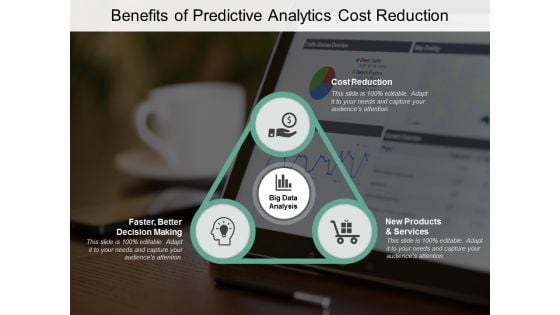
Benefits Of Predictive Analytics Cost Reduction Ppt PowerPoint Presentation Styles Sample
Presenting this set of slides with name benefits of predictive analytics cost reduction ppt powerpoint presentation styles sample. This is a three stage process. The stages in this process are big data analysis, data management, technologies segmentation. This is a completely editable PowerPoint presentation and is available for immediate download. Download now and impress your audience.
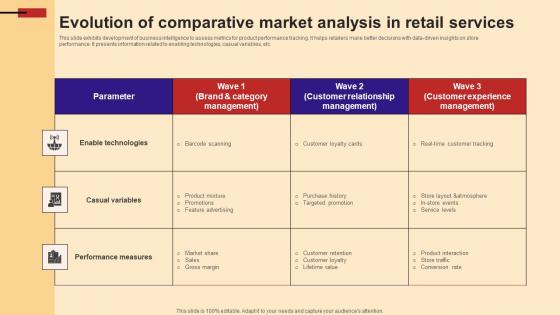
Evolution Of Comparative Market Analysis In Retail Services Information Pdf
This slide exhibits development of business intelligence to assess metrics for product performance tracking. It helps retailers make better decisions with data driven insights on store performance. It presents information related to enabling technologies, casual variables, etc.Showcasing this set of slides titled Evolution Of Comparative Market Analysis In Retail Services Information Pdf The topics addressed in these templates are Enable Technologies, Performance Measures, Casual Variables All the content presented in this PPT design is completely editable. Download it and make adjustments in color, background, font etc. as per your unique business setting. This slide exhibits development of business intelligence to assess metrics for product performance tracking. It helps retailers make better decisions with data driven insights on store performance. It presents information related to enabling technologies, casual variables, etc.
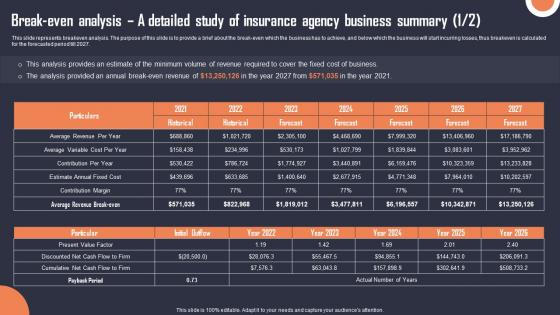
Break Even Analysis A Detailed Study Of Insurance Agency Building An Insurance Company Themes Pdf
This slide represents breakeven analysis. The purpose of this slide is to provide a brief about the break-even which the business has to achieve, and below which the business will start incurring losses, thus breakeven is calculated for the forecasted period till 2027. The Break Even Analysis A Detailed Study Of Insurance Agency Building An Insurance Company Themes Pdf is a compilation of the most recent design trends as a series of slides. It is suitable for any subject or industry presentation, containing attractive visuals and photo spots for businesses to clearly express their messages. This template contains a variety of slides for the user to input data, such as structures to contrast two elements, bullet points, and slides for written information. Slidegeeks is prepared to create an impression. This slide represents breakeven analysis. The purpose of this slide is to provide a brief about the break-even which the business has to achieve, and below which the business will start incurring losses, thus breakeven is calculated for the forecasted period till 2027.

Splunk Analysis Of Big Data To Assess Business Value Sample Pdf
Following slide showcases splunk big data analysis to evaluate business value. The purpose of this slide is to help businesses in forming better decisions by providing insights into their data. It includes components such as search, deploy, proactive monitoring, etc. Showcasing this set of slides titled Splunk Analysis Of Big Data To Assess Business Value Sample Pdf The topics addressed in these templates are Enterprise Scalability, Operational Intelligence All the content presented in this PPT design is completely editable. Download it and make adjustments in color, background, font etc. as per your unique business setting. Following slide showcases splunk big data analysis to evaluate business value. The purpose of this slide is to help businesses in forming better decisions by providing insights into their data. It includes components such as search, deploy, proactive monitoring, etc.

Performing Basket Analysis In Ecommerce Using Data Mining Tools To Optimize Processes AI SS V
This slide showcases basket analysis, a data mining technique which can guide ecommerce websites to identify customer insights properly. It provides details about product affinities, shopper profile, planograms, product combos, etc. Presenting this PowerPoint presentation, titled Performing Basket Analysis In Ecommerce Using Data Mining Tools To Optimize Processes AI SS V, with topics curated by our researchers after extensive research. This editable presentation is available for immediate download and provides attractive features when used. Download now and captivate your audience. Presenting this Performing Basket Analysis In Ecommerce Using Data Mining Tools To Optimize Processes AI SS V. Our researchers have carefully researched and created these slides with all aspects taken into consideration. This is a completely customizable Performing Basket Analysis In Ecommerce Using Data Mining Tools To Optimize Processes AI SS V that is available for immediate downloading. Download now and make an impact on your audience. Highlight the attractive features available with our PPTs. This slide showcases basket analysis, a data mining technique which can guide ecommerce websites to identify customer insights properly. It provides details about product affinities, shopper profile, planograms, product combos, etc.
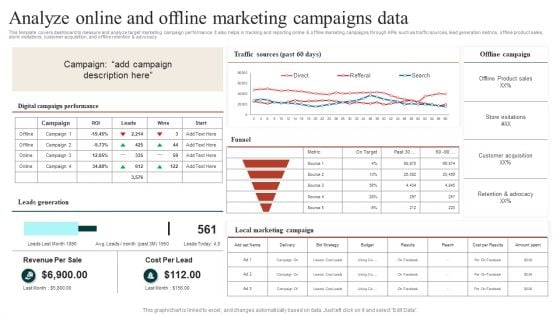
Target Marketing Techniques Analyze Online And Offline Marketing Campaigns Data Ideas PDF
This template covers dashboard to measure and analyze target marketing campaign performance. It also helps in tracking and reporting online and offline marketing campaigns through KPIs such as traffic sources, lead generation metrics, offline product sales, store visitations, customer acquisition, and offline retention and advocacy Find a pre designed and impeccable Target Marketing Techniques Evaluating Growth Rate For Target Marketing Slides PDF. The templates can ace your presentation without additional effort. You can download these easy to edit presentation templates to make your presentation stand out from others. So, what are you waiting for Download the template from Slidegeeks today and give a unique touch to your presentation.
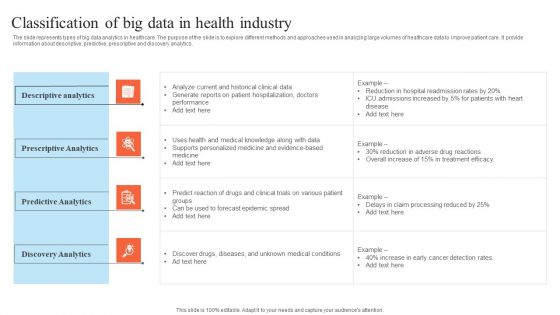
Classification Of Big Data In Health Industry Microsoft PDF
The slide represents types of big data analytics in healthcare. The purpose of the slide is to explore different methods and approaches used in analyzing large volumes of healthcare data to improve patient care. It provide information about descriptive, predictive, prescriptive and discovery analytics. Presenting Classification Of Big Data In Health Industry Microsoft PDF to dispense important information. This template comprises four stages. It also presents valuable insights into the topics including Descriptive Analytics, Prescriptive Analytics, Predictive Analytics. This is a completely customizable PowerPoint theme that can be put to use immediately. So, download it and address the topic impactfully.
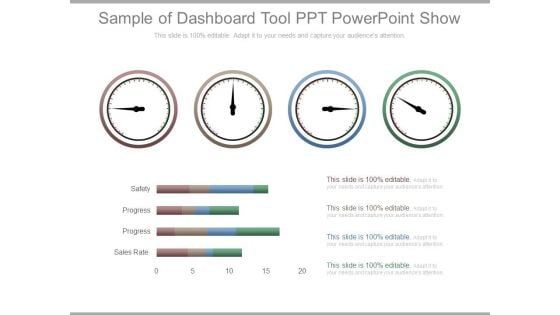
Sample Of Dashboard Tool Ppt Powerpoint Show
This is a sample of dashboard tool ppt powerpoint show. This is a four stage process. The stages in this process are safety, progress, sales rate.
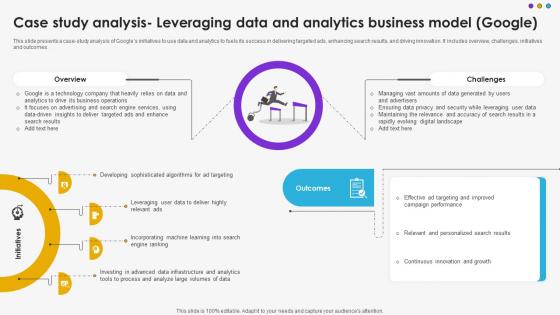
Case Study Analysis Leveraging Data And Analytics Business Model Google DT SS V
This slide presents a case-study analysis of Googles initiatives to use data and analytics to fuels its success in delivering targeted ads, enhancing search results, and driving innovation. It includes overview, challenges, initiatives and outcomes.Find highly impressive Case Study Analysis Leveraging Data And Analytics Business Model Google DT SS V on Slidegeeks to deliver a meaningful presentation. You can save an ample amount of time using these presentation templates. No need to worry to prepare everything from scratch because Slidegeeks experts have already done a huge research and work for you. You need to download Case Study Analysis Leveraging Data And Analytics Business Model Google DT SS V for your upcoming presentation. All the presentation templates are 100 percent editable and you can change the color and personalize the content accordingly. Download now This slide presents a case-study analysis of Googles initiatives to use data and analytics to fuels its success in delivering targeted ads, enhancing search results, and driving innovation. It includes overview, challenges, initiatives and outcomes.
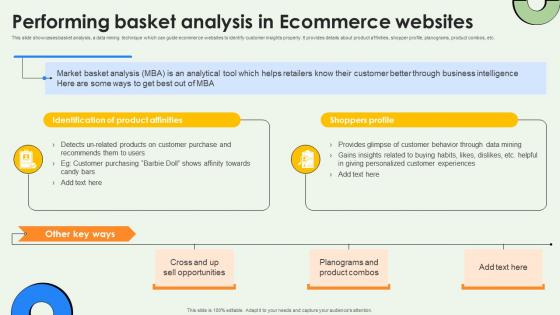
Data Warehousing And Performing Basket Analysis In Ecommerce Websites AI SS V
This slide showcases basket analysis, a data mining technique which can guide ecommerce websites to identify customer insights properly. It provides details about product affinities, shopper profile, planograms, product combos, etc. If you are looking for a format to display your unique thoughts, then the professionally designed Data Warehousing And Performing Basket Analysis In Ecommerce Websites AI SS V is the one for you. You can use it as a Google Slides template or a PowerPoint template. Incorporate impressive visuals, symbols, images, and other charts. Modify or reorganize the text boxes as you desire. Experiment with shade schemes and font pairings. Alter, share or cooperate with other people on your work. Download Data Warehousing And Performing Basket Analysis In Ecommerce Websites AI SS V and find out how to give a successful presentation. Present a perfect display to your team and make your presentation unforgettable. This slide showcases basket analysis, a data mining technique which can guide ecommerce websites to identify customer insights properly. It provides details about product affinities, shopper profile, planograms, product combos, etc.
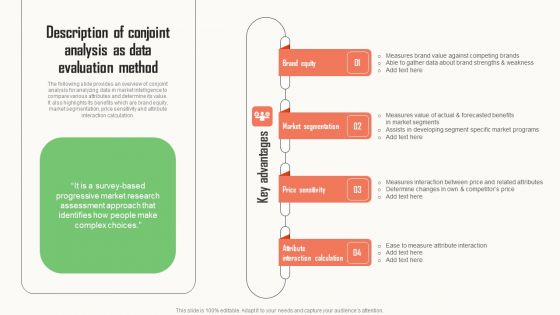
Strategic Market Insight Implementation Guide Description Of Conjoint Analysis As Data Evaluation Method Graphics PDF
The following slide provides an overview of conjoint analysis for analyzing data in market intelligence to compare various attributes and determine its value. It also highlights its benefits which are brand equity, market segmentation, price sensitivity and attribute interaction calculation. Whether you have daily or monthly meetings, a brilliant presentation is necessary. Strategic Market Insight Implementation Guide Description Of Conjoint Analysis As Data Evaluation Method Graphics PDF can be your best option for delivering a presentation. Represent everything in detail using Strategic Market Insight Implementation Guide Description Of Conjoint Analysis As Data Evaluation Method Graphics PDF and make yourself stand out in meetings. The template is versatile and follows a structure that will cater to your requirements. All the templates prepared by Slidegeeks are easy to download and edit. Our research experts have taken care of the corporate themes as well. So, give it a try and see the results.

Before Vs After Data Integration Implementation Data Integration Strategies For Business
This slide showcases the comparative analysis of the before versus after data integration implementation. The purpose of this slide is to discuss the different performance aspects and how data management has proved beneficial for these aspects. Get a simple yet stunning designed Before Vs After Data Integration Implementation Data Integration Strategies For Business. It is the best one to establish the tone in your meetings. It is an excellent way to make your presentations highly effective. So, download this PPT today from Slidegeeks and see the positive impacts. Our easy-to-edit Before Vs After Data Integration Implementation Data Integration Strategies For Business can be your go-to option for all upcoming conferences and meetings. So, what are you waiting for Grab this template today. This slide showcases the comparative analysis of the before versus after data integration implementation. The purpose of this slide is to discuss the different performance aspects and how data management has proved beneficial for these aspects.
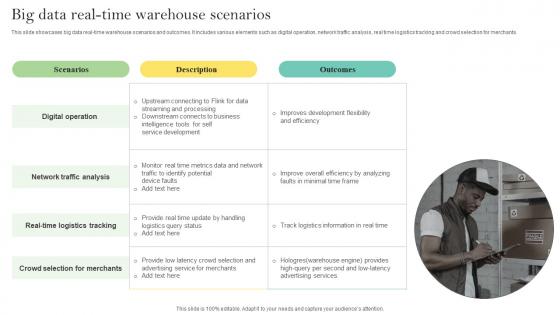
Big Data Real Time Warehouse Scenarios Ppt Slides Background Designs Pdf
This slide showcases big data real-time warehouse scenarios and outcomes. It includes various elements such as digital operation, network traffic analysis, real time logistics tracking and crowd selection for merchants. Pitch your topic with ease and precision using this Big Data Real Time Warehouse Scenarios Ppt Slides Background Designs Pdf. This layout presents information on Digital Operation, Network Traffic Analysis, Real Time Logistics. It is also available for immediate download and adjustment. So, changes can be made in the color, design, graphics or any other component to create a unique layout. This slide showcases big data real-time warehouse scenarios and outcomes. It includes various elements such as digital operation, network traffic analysis, real time logistics tracking and crowd selection for merchants.
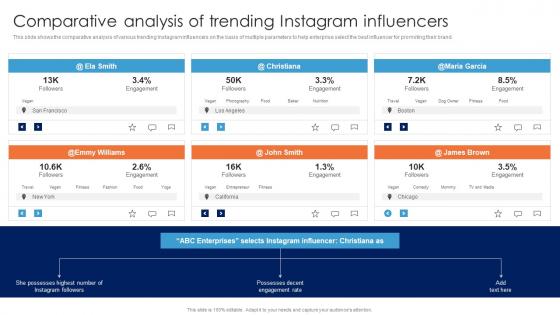
Comparative Analysis Of Trending Instagram Guide For Data Driven Advertising Themes Pdf
This slide shows the comparative analysis of various trending Instagram influencers on the basis of multiple parameters to help enterprise select the best influencer for promoting their brand.This modern and well-arranged Comparative Analysis Of Trending Instagram Guide For Data Driven Advertising Themes Pdf provides lots of creative possibilities. It is very simple to customize and edit with the Powerpoint Software. Just drag and drop your pictures into the shapes. All facets of this template can be edited with Powerpoint no extra software is necessary. Add your own material, put your images in the places assigned for them, adjust the colors, and then you can show your slides to the world, with an animated slide included. This slide shows the comparative analysis of various trending Instagram influencers on the basis of multiple parameters to help enterprise select the best influencer for promoting their brand.

Statistical Analysis Software Features Data Analytics For Informed Decision Ppt Presentation
The purpose of this slide is to outline the different software used to perform statistical analysis. This slide represents the primary features and benefits of various statistical software available in the market. This Statistical Analysis Software Features Data Analytics For Informed Decision Ppt Presentation from Slidegeeks makes it easy to present information on your topic with precision. It provides customization options, so you can make changes to the colors, design, graphics, or any other component to create a unique layout. It is also available for immediate download, so you can begin using it right away. Slidegeeks has done good research to ensure that you have everything you need to make your presentation stand out. Make a name out there for a brilliant performance. The purpose of this slide is to outline the different software used to perform statistical analysis. This slide represents the primary features and benefits of various statistical software available in the market.
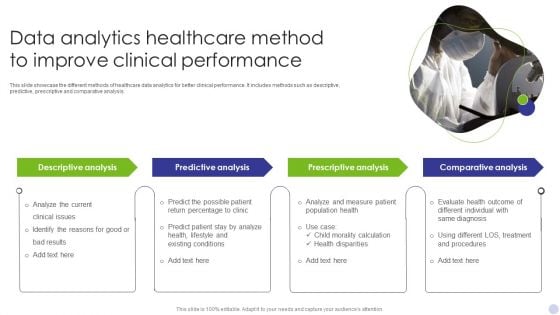
Data Analytics Healthcare Method To Improve Clinical Performance Brochure PDF
This slide showcase the different methods of healthcare data analytics for better clinical performance. It includes methods such as descriptive, predictive, prescriptive and comparative analysis. Persuade your audience using this Data Analytics Healthcare Method To Improve Clinical Performance Brochure PDF. This PPT design covers Four stages, thus making it a great tool to use. It also caters to a variety of topics including Descriptive Analysis, Predictive Analysis, Prescriptive Analysis. Download this PPT design now to present a convincing pitch that not only emphasizes the topic but also showcases your presentation skills.
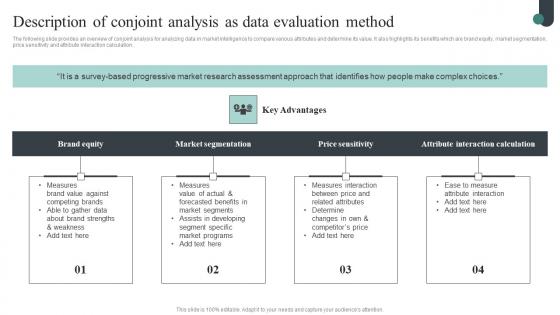
Competitive Intelligence Guide To Determine Market Description Of Conjoint Analysis As Data Designs Pdf
The following slide provides an overview of conjoint analysis for analyzing data in market intelligence to compare various attributes and determine its value. It also highlights its benefits which are brand equity, market segmentation, price sensitivity and attribute interaction calculation. Present like a pro with Competitive Intelligence Guide To Determine Market Description Of Conjoint Analysis As Data Designs Pdf Create beautiful presentations together with your team, using our easy-to-use presentation slides. Share your ideas in real-time and make changes on the fly by downloading our templates. So whether you are in the office, on the go, or in a remote location, you can stay in sync with your team and present your ideas with confidence. With Slidegeeks presentation got a whole lot easier. Grab these presentations today. The following slide provides an overview of conjoint analysis for analyzing data in market intelligence to compare various attributes and determine its value. It also highlights its benefits which are brand equity, market segmentation, price sensitivity and attribute interaction calculation.
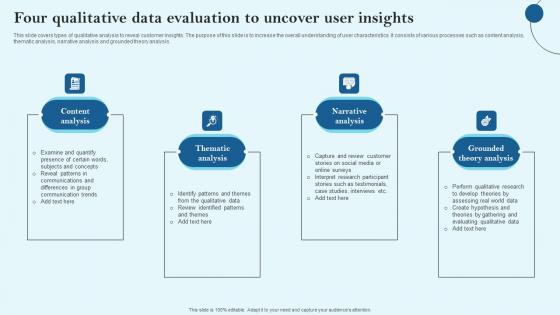
Four Qualitative Data Evaluation To Uncover User Insights Infographics Pdf
This slide covers types of qualitative analysis to reveal customer insights. The purpose of this slide is to increase the overall understanding of user characteristics. It consists of various processes such as content analysis, thematic analysis, narrative analysis and grounded theory analysis. Pitch your topic with ease and precision using this Four Qualitative Data Evaluation To Uncover User Insights Infographics Pdf This layout presents information on Content Analysis, Thematic Analysis, Narrative Analysis It is also available for immediate download and adjustment. So, changes can be made in the color, design, graphics or any other component to create a unique layout. This slide covers types of qualitative analysis to reveal customer insights. The purpose of this slide is to increase the overall understanding of user characteristics. It consists of various processes such as content analysis, thematic analysis, narrative analysis and grounded theory analysis.

Before And After Data Management Technology Implementation PPT Presentation SS
The slide showcases before and after implementation comparative analysis of various aspects with data management solution. It includes aspects like syncing, data duplication and queries, underutilization of data and incorrect data. Slidegeeks is one of the best resources for PowerPoint templates. You can download easily and regulate Before And After Data Management Technology Implementation PPT Presentation SS for your personal presentations from our wonderful collection. A few clicks is all it takes to discover and get the most relevant and appropriate templates. Use our Templates to add a unique zing and appeal to your presentation and meetings. All the slides are easy to edit and you can use them even for advertisement purposes. The slide showcases before and after implementation comparative analysis of various aspects with data management solution. It includes aspects like syncing, data duplication and queries, underutilization of data and incorrect data.
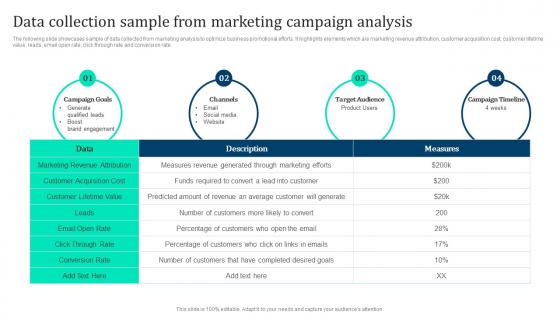
Data Collection Sample From Marketing Intelligence Guide Data Gathering Guidelines Pdf
The following slide showcases sample of data collected from marketing analysis to optimize business promotional efforts. It highlights elements which are marketing revenue attribution, customer acquisition cost, customer lifetime value, leads, email open rate, click through rate and conversion rate. From laying roadmaps to briefing everything in detail, our templates are perfect for you. You can set the stage with your presentation slides. All you have to do is download these easy to edit and customizable templates. Data Collection Sample From Marketing Intelligence Guide Data Gathering Guidelines Pdf will help you deliver an outstanding performance that everyone would remember and praise you for. Do download this presentation today. The following slide showcases sample of data collected from marketing analysis to optimize business promotional efforts. It highlights elements which are marketing revenue attribution, customer acquisition cost, customer lifetime value, leads, email open rate, click through rate and conversion rate.
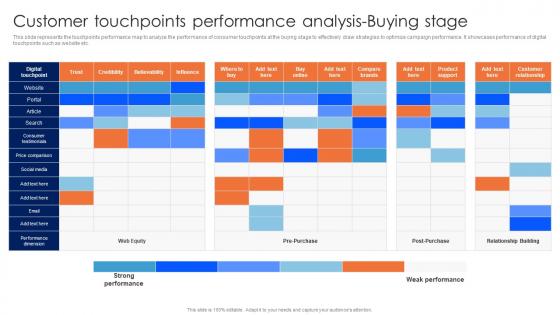
Customer Touchpoints Performance Analysis Guide For Data Driven Advertising Formats Pdf
This slide represents the touchpoints performance map to analyze the performance of consumer touchpoints at the buying stage to effectively draw strategies to optimize campaign performance. It showcases performance of digital touchpoints such as website etc.Welcome to our selection of the Customer Touchpoints Performance Analysis Guide For Data Driven Advertising Formats Pdf. These are designed to help you showcase your creativity and bring your sphere to life. Planning and Innovation are essential for any business that is just starting out. This collection contains the designs that you need for your everyday presentations. All of our PowerPoints are 100Precent editable, so you can customize them to suit your needs. This multi-purpose template can be used in various situations. Grab these presentation templates today. This slide represents the touchpoints performance map to analyze the performance of consumer touchpoints at the buying stage to effectively draw strategies to optimize campaign performance. It showcases performance of digital touchpoints such as website etc.
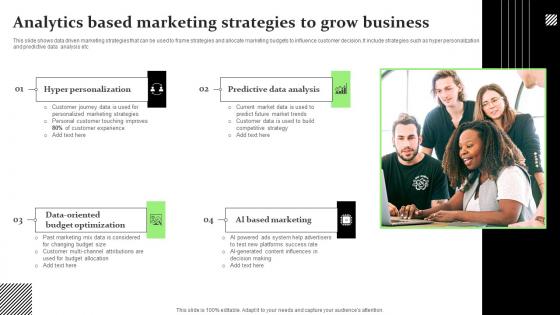
Analytics Based Marketing Strategies To Grow Business Themes Pdf
This slide shows data driven marketing strategies that can be used to frame strategies and allocate marketing budgets to influence customer decision. It include strategies such as hyper personalization and predictive data analysis etc.Showcasing this set of slides titled Analytics Based Marketing Strategies To Grow Business Themes Pdf The topics addressed in these templates are Hyper Personalization, Predictive Data Analysis, Budget Optimization All the content presented in this PPT design is completely editable. Download it and make adjustments in color, background, font etc. as per your unique business setting. This slide shows data driven marketing strategies that can be used to frame strategies and allocate marketing budgets to influence customer decision. It include strategies such as hyper personalization and predictive data analysis etc.
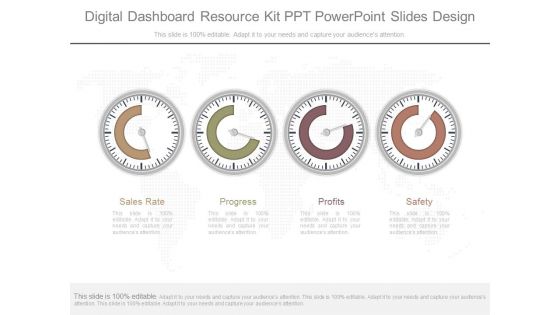
Digital Dashboard Resource Kit Ppt Powerpoint Slides Design
This is a digital dashboard resource kit ppt powerpoint slides design. This is a four stage process. The stages in this process are sales rate, progress, profits, safety.
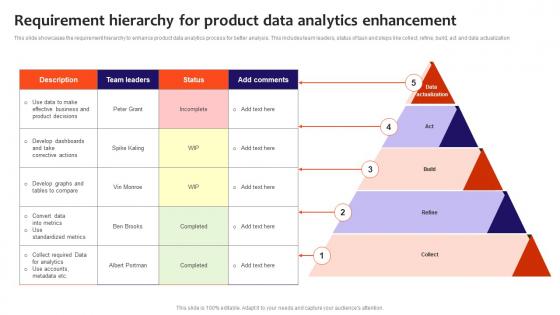
Requirement Hierarchy For Product Data Analytics Enhancement Clipart Pdf
This slide showcases the requirement hierarchy to enhance product data analytics process for better analysis. This includes team leaders, status of task and steps like collect, refine, build, act and data actualization Showcasing this set of slides titled Requirement Hierarchy For Product Data Analytics Enhancement Clipart Pdf. The topics addressed in these templates are Develop Graphs, Collect Required Data, Develop Dashboards. All the content presented in this PPT design is completely editable. Download it and make adjustments in color, background, font etc. as per your unique business setting. This slide showcases the requirement hierarchy to enhance product data analytics process for better analysis. This includes team leaders, status of task and steps like collect, refine, build, act and data actualization

Business Intelligence And Data Visualization Tools DT SS V
This slide presents various business intelligence and data visualization tools that help SMEs make better business decisions. It also mentions applications such as data analysis, exploration, visualization, reporting and dashboard creations.Present like a pro with Business Intelligence And Data Visualization Tools DT SS V. Create beautiful presentations together with your team, using our easy-to-use presentation slides. Share your ideas in real-time and make changes on the fly by downloading our templates. So whether you are in the office, on the go, or in a remote location, you can stay in sync with your team and present your ideas with confidence. With Slidegeeks presentation got a whole lot easier. Grab these presentations today. This slide presents various business intelligence and data visualization tools that help SMEs make better business decisions. It also mentions applications such as data analysis, exploration, visualization, reporting and dashboard creations.
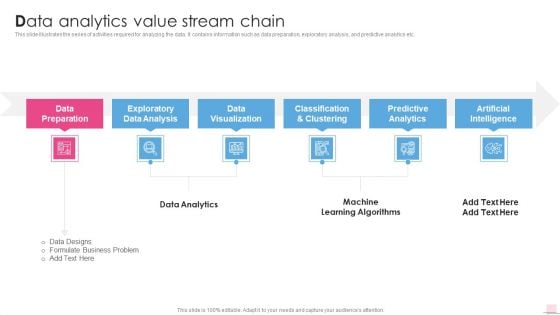
Data Analytics Value Stream Chain Business Analysis Modification Toolkit Summary PDF
This slide illustrates the series of activities required for analyzing the data. It contains information such as data preparation, exploratory analysis, and predictive analytics etc.This is a Data Analytics Value Stream Chain Business Analysis Modification Toolkit Summary PDF template with various stages. Focus and dispense information on six stages using this creative set, that comes with editable features. It contains large content boxes to add your information on topics like Formulate Business, Data Visualization, Classification Clustering. You can also showcase facts, figures, and other relevant content using this PPT layout. Grab it now.

Introduction To Big Data Analytics Technology Advanced Tools For Hyperautomation Ppt Designs Pdf
This slide represents the introduction of big data analytics, including the complete data handling process, such as data collection, storage, research, analysis, visualization, volume, and network. It also caters to the critical Vs and benefits of big data. Slidegeeks has constructed Introduction To Big Data Analytics Technology Advanced Tools For Hyperautomation Ppt Designs Pdf after conducting extensive research and examination. These presentation templates are constantly being generated and modified based on user preferences and critiques from editors. Here, you will find the most attractive templates for a range of purposes while taking into account ratings and remarks from users regarding the content. This is an excellent jumping-off point to explore our content and will give new users an insight into our top-notch PowerPoint Templates. This slide represents the introduction of big data analytics, including the complete data handling process, such as data collection, storage, research, analysis, visualization, volume, and network. It also caters to the critical Vs and benefits of big data.
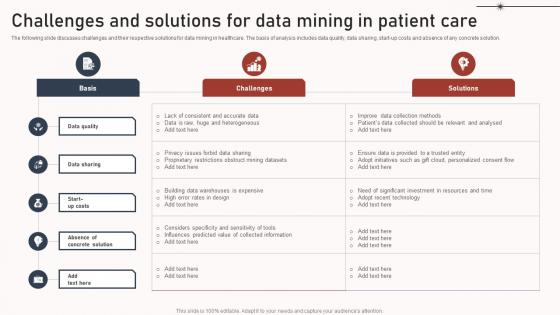
Challenges And Solutions For Data Mining In Patient Care Microsoft Pdf
The following slide discusses challenges and their respective solutions for data mining in healthcare. The basis of analysis includes data quality, data sharing, start up costs and absence of any concrete solution. Pitch your topic with ease and precision using this Challenges And Solutions For Data Mining In Patient Care Microsoft Pdf. This layout presents information on Data Quality, Data Sharing, Start Up Costs. It is also available for immediate download and adjustment. So, changes can be made in the color, design, graphics or any other component to create a unique layout. The following slide discusses challenges and their respective solutions for data mining in healthcare. The basis of analysis includes data quality, data sharing, start up costs and absence of any concrete solution.
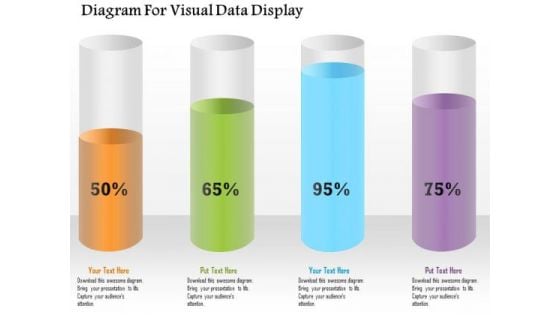
Business Diagram Diagram For Visual Data Display Presentation Template
Four colored cylindrical bars with percentage values are used to design this power point template. This diagram slide helps to display financial data analysis. Use this diagram for your business and finance related presentations.
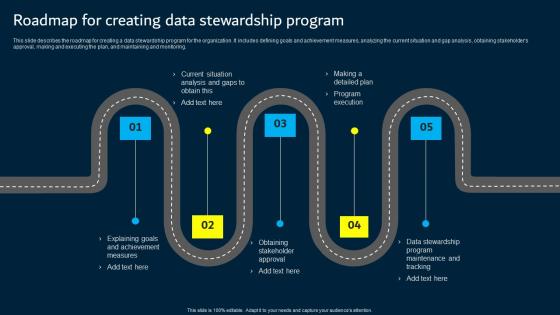
Roadmap For Creating Data Stewardship Program Data Custodianship Introduction Pdf
This slide describes the roadmap for creating a data stewardship program for the organization. It includes defining goals and achievement measures, analyzing the current situation and gap analysis, obtaining stakeholder s approval, making and executing the plan, and maintaining and monitoring. Are you searching for a Roadmap For Creating Data Stewardship Program Data Custodianship Introduction Pdf that is uncluttered, straightforward, and original Its easy to edit, and you can change the colors to suit your personal or business branding. For a presentation that expresses how much effort you have put in, this template is ideal With all of its features, including tables, diagrams, statistics, and lists, its perfect for a business plan presentation. Make your ideas more appealing with these professional slides. Download Roadmap For Creating Data Stewardship Program Data Custodianship Introduction Pdf from Slidegeeks today. This slide describes the roadmap for creating a data stewardship program for the organization. It includes defining goals and achievement measures, analyzing the current situation and gap analysis, obtaining stakeholder s approval, making and executing the plan, and maintaining and monitoring.
Data Analytics Vector Icon Ppt PowerPoint Presentation Professional
Presenting this set of slides with name data analytics vector icon ppt powerpoint presentation professional. This is a four stage process. The stages in this process are data visualization icon, research analysis, business focus. This is a completely editable PowerPoint presentation and is available for immediate download. Download now and impress your audience.
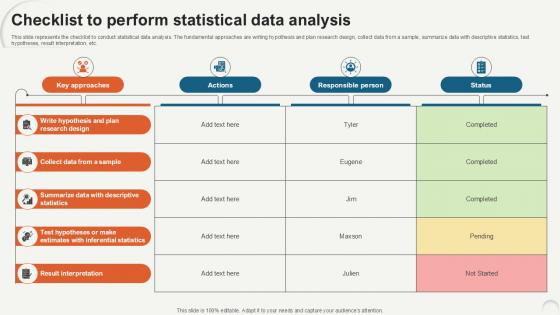
Checklist To Perform Statistical Data Analytics For Informed Decision Ppt Slide
This slide represents the checklist to conduct statistical data analysis. The fundamental approaches are writing hypothesis and plan research design, collect data from a sample, summarize data with descriptive statistics, test hypotheses, result interpretation, etc. Get a simple yet stunning designed Checklist To Perform Statistical Data Analytics For Informed Decision Ppt Slide. It is the best one to establish the tone in your meetings. It is an excellent way to make your presentations highly effective. So, download this PPT today from Slidegeeks and see the positive impacts. Our easy-to-edit Checklist To Perform Statistical Data Analytics For Informed Decision Ppt Slide can be your go-to option for all upcoming conferences and meetings. So, what are you waiting for Grab this template today. This slide represents the checklist to conduct statistical data analysis. The fundamental approaches are writing hypothesis and plan research design, collect data from a sample, summarize data with descriptive statistics, test hypotheses, result interpretation, etc.
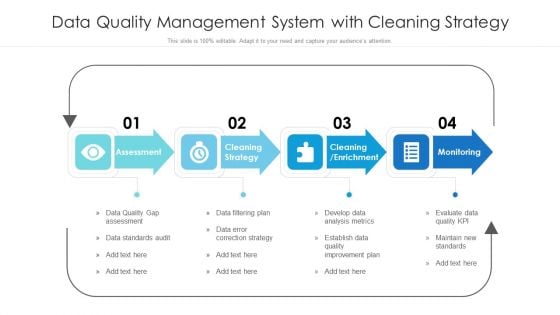
Data Quality Management System With Cleaning Strategy Ppt PowerPoint Presentation File Files PDF
Presenting data quality management system with cleaning strategy ppt powerpoint presentation file files pdf to dispense important information. This template comprises four stages. It also presents valuable insights into the topics including assessment, cleaning strategy, develop data analysis metrics. This is a completely customizable PowerPoint theme that can be put to use immediately. So, download it and address the topic impactfully.

Timeline To Conduct Statistical Data Analytics For Informed Decision Ppt Presentation
This slide shows the timeline for performing statistical data analysis. The key steps include writing hypothesis and plan research design, collect data from a sample, summarize data with descriptive statistics, test hypotheses, result interpretation, etc. Slidegeeks is here to make your presentations a breeze with Timeline To Conduct Statistical Data Analytics For Informed Decision Ppt Presentation With our easy-to-use and customizable templates, you can focus on delivering your ideas rather than worrying about formatting. With a variety of designs to choose from, you are sure to find one that suits your needs. And with animations and unique photos, illustrations, and fonts, you can make your presentation pop. So whether you are giving a sales pitch or presenting to the board, make sure to check out Slidegeeks first This slide shows the timeline for performing statistical data analysis. The key steps include writing hypothesis and plan research design, collect data from a sample, summarize data with descriptive statistics, test hypotheses, result interpretation, etc.
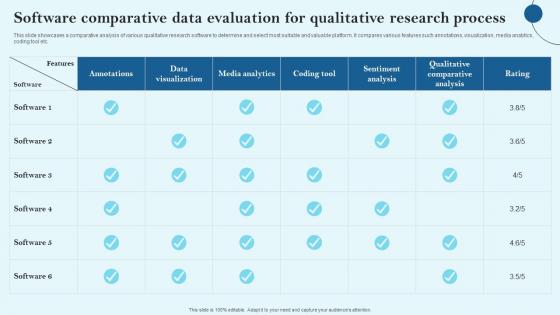
Software Comparative Data Evaluation For Qualitative Research Process Sample Pdf
This slide showcases a comparative analysis of various qualitative research software to determine and select most suitable and valuable platform. It compares various features such annotations, visualization, media analytics, coding tool etc. Pitch your topic with ease and precision using this Software Comparative Data Evaluation For Qualitative Research Process Sample Pdf This layout presents information on Annotations, Data Visualization, Media Analytics It is also available for immediate download and adjustment. So, changes can be made in the color, design, graphics or any other component to create a unique layout. This slide showcases a comparative analysis of various qualitative research software to determine and select most suitable and valuable platform. It compares various features such annotations, visualization, media analytics, coding tool etc.
Data And Analytics Ppt PowerPoint Presentation Icon Layouts Cpb
This is a data and analytics ppt powerpoint presentation icon layouts cpb. This is a five stage process. The stages in this process are data and analytics.
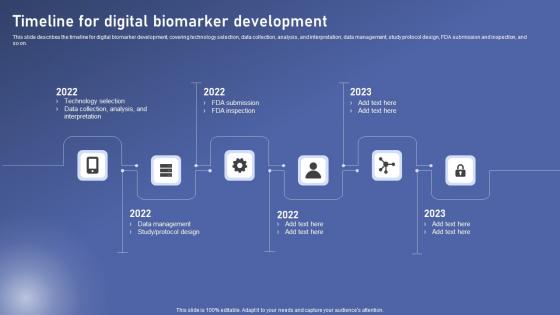
Timeline For Digital Biomarker Biomedical Data Science And Health Informatics Sample Pdf
This slide describes the timeline for digital biomarker development, covering technology selection, data collection, analysis, and interpretation, data management, study protocol design, FDA submission and inspection, and so on. Do you have an important presentation coming up Are you looking for something that will make your presentation stand out from the rest Look no further than Timeline For Digital Biomarker Biomedical Data Science And Health Informatics Sample Pdf. With our professional designs, you can trust that your presentation will pop and make delivering it a smooth process. And with Slidegeeks, you can trust that your presentation will be unique and memorable. So why wait Grab Timeline For Digital Biomarker Biomedical Data Science And Health Informatics Sample Pdf today and make your presentation stand out from the rest This slide describes the timeline for digital biomarker development, covering technology selection, data collection, analysis, and interpretation, data management, study protocol design, FDA submission and inspection, and so on.

Transformation Toolkit Competitive Intelligence Information Analysis Value Stream Information Data Analytics Structure Infographics PDF
The slides shows the stages of data analytics with reactive and proactive approach. In includes four steps collection, analysis, predictive and actions. Present like a pro with Transformation Toolkit Competitive Intelligence Information Analysis Value Stream Information Data Analytics Structure Infographics PDF Create beautiful presentations together with your team, using our easy to use presentation slides. Share your ideas in real time and make changes on the fly by downloading our templates. So whether you are in the office, on the go, or in a remote location, you can stay in sync with your team and present your ideas with confidence. With Slidegeeks presentation got a whole lot easier. Grab these presentations today.
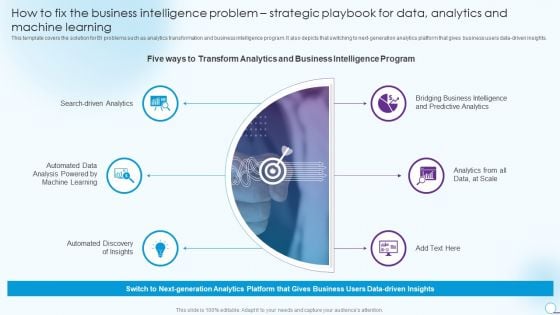
How To Fix The Business Intelligence Problem Strategic Playbook For Data Analytics And Machine Learning Designs PDF
This template covers the solution for BI problems such as analytics transformation and business intelligence program. It also depicts that switching to next generation analytics platform that gives business users data driven insights. This is a How To Fix The Business Intelligence Problem Strategic Playbook For Data Analytics And Machine Learning Designs PDF template with various stages. Focus and dispense information on six stages using this creative set, that comes with editable features. It contains large content boxes to add your information on topics like Automated Data Analysis, Search Driven Analytics, Predictive Analytics. You can also showcase facts, figures, and other relevant content using this PPT layout. Grab it now.
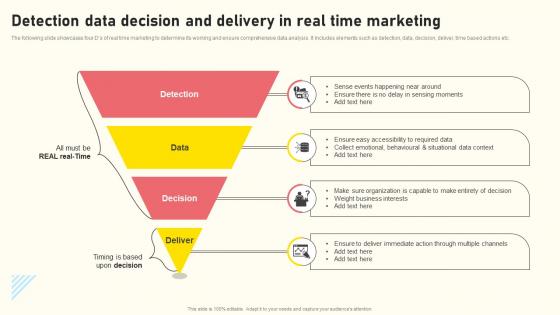
Effective Real Time Marketing Principles Detection Data Decision And Delivery In Real Time Marketing Sample Pdf
The following slide showcases four Ds of real time marketing to determine its working and ensure comprehensive data analysis. It includes elements such as detection, data, decision, deliver, time based actions etc. This Effective Real Time Marketing Principles Detection Data Decision And Delivery In Real Time Marketing Sample Pdf from Slidegeeks makes it easy to present information on your topic with precision. It provides customization options, so you can make changes to the colors, design, graphics, or any other component to create a unique layout. It is also available for immediate download, so you can begin using it right away. Slidegeeks has done good research to ensure that you have everything you need to make your presentation stand out. Make a name out there for a brilliant performance. The following slide showcases four Ds of real time marketing to determine its working and ensure comprehensive data analysis. It includes elements such as detection, data, decision, deliver, time based actions etc.
Email Marketing Software To Enhance Data Collection And Management Ppt Icon Example File Pdf
This slide presents a comparative analysis of email marketing software that enables customer data collection and data management. It includes features such as CRM, email verification, SMS automation, and campaign management. Pitch your topic with ease and precision using this Email Marketing Software To Enhance Data Collection And Management Ppt Icon Example File Pdf. This layout presents information on CRM, Email Verification, SMS Automation, Campaign Management. It is also available for immediate download and adjustment. So, changes can be made in the color, design, graphics or any other component to create a unique layout. This slide presents a comparative analysis of email marketing software that enables customer data collection and data management. It includes features such as CRM, email verification, SMS automation, and campaign management.
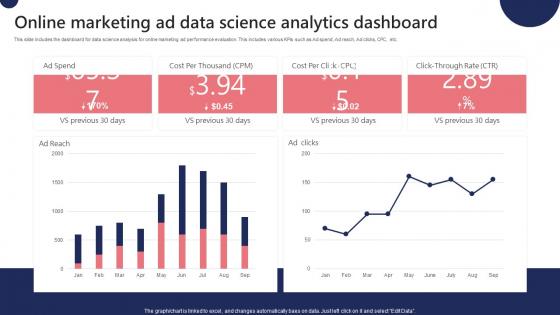
Online Marketing Ad Data Science Analytics Dashboard Ppt File Portfolio Pdf
This slide includes the dashboard for data science analysis for online marketing ad performance evaluation. This includes various KPIs such as Ad spend, Ad reach, Ad clicks, CPC, etc. Showcasing this set of slides titled Online Marketing Ad Data Science Analytics Dashboard Ppt File Portfolio Pdf. The topics addressed in these templates are Data Transformation, Data Visualization, Cross Channel Analytics. All the content presented in this PPT design is completely editable. Download it and make adjustments in color, background, font etc. as per your unique business setting. This slide includes the dashboard for data science analysis for online marketing ad performance evaluation. This includes various KPIs such as Ad spend, Ad reach, Ad clicks, CPC, etc.
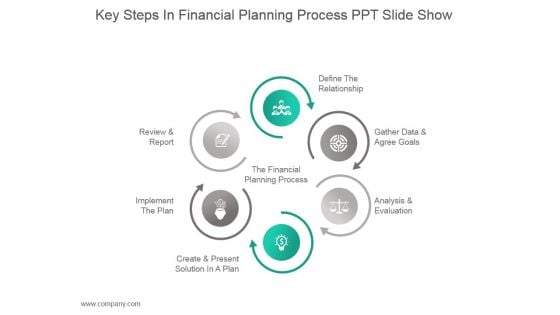
Key Steps In Financial Planning Process Ppt Slide Show
This is a key steps in financial planning process ppt slide show. This is a six stage process. The stages in this process are review and report, implement the plan, create and present solution in a plan, define the relationship, gather data and agree goals, analysis and evaluation, the financial planning process.
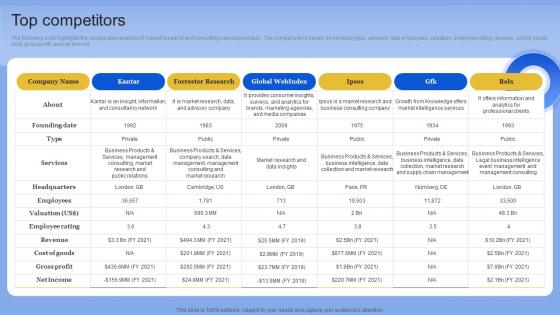
Top Competitors Data Analytics Company Outline Designs PDF
The following slide highlights the comparative analysis of market research and consulting service providers. The comparison is based on company type, services, total employees, valuation, employee rating, revenue, cost of goods sold, gross profit, and net income. Boost your pitch with our creative Top Competitors Data Analytics Company Outline Designs PDF Deliver an awe-inspiring pitch that will mesmerize everyone. Using these presentation templates you will surely catch everyones attention. You can browse the ppts collection on our website. We have researchers who are experts at creating the right content for the templates. So you do not have to invest time in any additional work. Just grab the template now and use them. The following slide highlights the comparative analysis of market research and consulting service providers. The comparison is based on company type, services, total employees, valuation, employee rating, revenue, cost of goods sold, gross profit, and net income
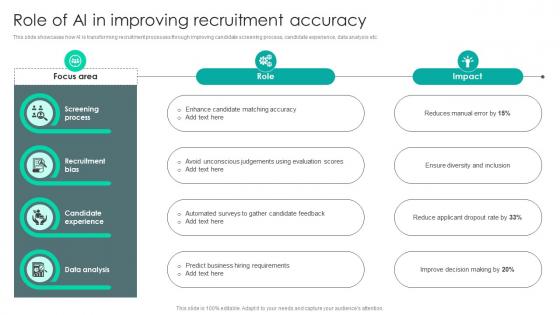
Strategic Staffing Using Data Role Of AI In Improving Recruitment Accuracy CRP DK SS V
This slide showcases how AI is transforming recruitment processes through improving candidate screening process, candidate experience, data analysis etc. Create an editable Strategic Staffing Using Data Role Of AI In Improving Recruitment Accuracy CRP DK SS V that communicates your idea and engages your audience. Whether you are presenting a business or an educational presentation, pre-designed presentation templates help save time. Strategic Staffing Using Data Role Of AI In Improving Recruitment Accuracy CRP DK SS V is highly customizable and very easy to edit, covering many different styles from creative to business presentations. Slidegeeks has creative team members who have crafted amazing templates. So, go and get them without any delay. This slide showcases how AI is transforming recruitment processes through improving candidate screening process, candidate experience, data analysis etc.

Before Vs After Performing Data Analytics For Informed Decision Ppt Template
This slide shows the before vs. after comparison of statistical analysis of business data. The different aspects compared in this slide are decision-making, operational efficiency, customer insights, product quality, revenue generation, supply chain efficiency, etc. Create an editable Before Vs After Performing Data Analytics For Informed Decision Ppt Template that communicates your idea and engages your audience. Whether you are presenting a business or an educational presentation, pre-designed presentation templates help save time. Before Vs After Performing Data Analytics For Informed Decision Ppt Template is highly customizable and very easy to edit, covering many different styles from creative to business presentations. Slidegeeks has creative team members who have crafted amazing templates. So, go and get them without any delay. This slide shows the before vs. after comparison of statistical analysis of business data. The different aspects compared in this slide are decision-making, operational efficiency, customer insights, product quality, revenue generation, supply chain efficiency, etc.
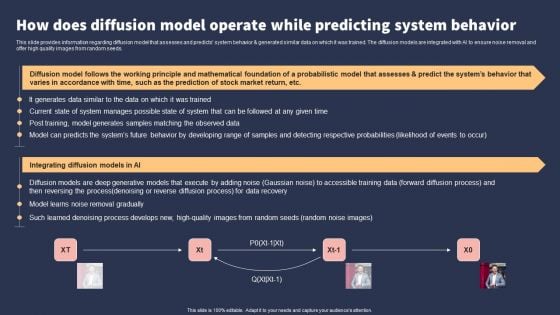
Top 10 Revolutionary Solutions For Everything How Does Diffusion Model Operate While Predicting System Behavior Introduction PDF
This slide provides information regarding diffusion model that assesses and predicts system behavior and generated similar data on which it was trained. The diffusion models are integrated with AI to ensure noise removal and offer high quality images from random seeds. Formulating a presentation can take up a lot of effort and time, so the content and message should always be the primary focus. The visuals of the PowerPoint can enhance the presenters message, so our Top 10 Revolutionary Solutions For Everything How Does Diffusion Model Operate While Predicting System Behavior Introduction PDF was created to help save time. Instead of worrying about the design, the presenter can concentrate on the message while our designers work on creating the ideal templates for whatever situation is needed. Slidegeeks has experts for everything from amazing designs to valuable content, we have put everything into Top 10 Revolutionary Solutions For Everything How Does Diffusion Model Operate While Predicting System Behavior Introduction PDF
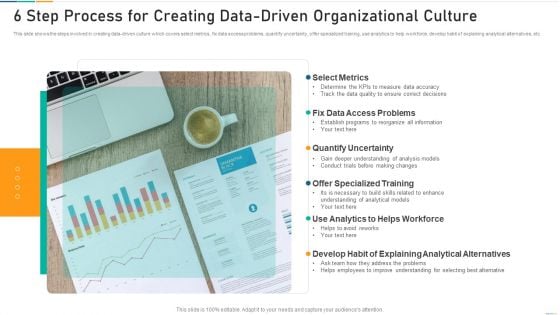
6 Step Process For Creating Data Driven Organizational Culture Background PDF
Presenting 6 step process for creating data driven organizational culture background pdf to dispense important information. This template comprises six stages. It also presents valuable insights into the topics including metrics, analysis, information. This is a completely customizable PowerPoint theme that can be put to use immediately. So, download it and address the topic impactfully.
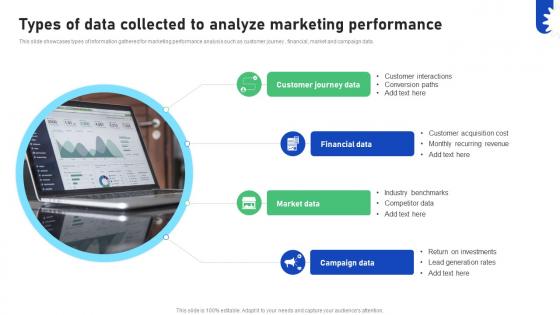
Improving Business Marketing Performance Types Of Data Collected To Analyze CRP DK SS V
This slide showcases types of information gathered for marketing performance analysis such as customer journey , financial, market and campaign data. Present like a pro with Improving Business Marketing Performance Types Of Data Collected To Analyze CRP DK SS V. Create beautiful presentations together with your team, using our easy-to-use presentation slides. Share your ideas in real-time and make changes on the fly by downloading our templates. So whether you are in the office, on the go, or in a remote location, you can stay in sync with your team and present your ideas with confidence. With Slidegeeks presentation got a whole lot easier. Grab these presentations today. This slide showcases types of information gathered for marketing performance analysis such as customer journey , financial, market and campaign data.
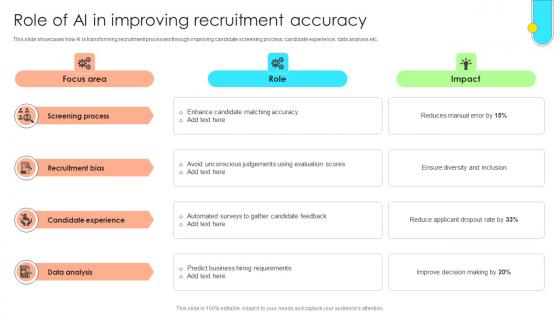
Data Driven Approach To Optimise Role Of Ai In Improving Recruitment Accuracy CRP SS V
This slide showcases how AI is transforming recruitment processes through improving candidate screening process, candidate experience, data analysis etc. Boost your pitch with our creative Data Driven Approach To Optimise Role Of Ai In Improving Recruitment Accuracy CRP SS V. Deliver an awe-inspiring pitch that will mesmerize everyone. Using these presentation templates you will surely catch everyones attention. You can browse the ppts collection on our website. We have researchers who are experts at creating the right content for the templates. So you do not have to invest time in any additional work. Just grab the template now and use them. This slide showcases how AI is transforming recruitment processes through improving candidate screening process, candidate experience, data analysis etc.
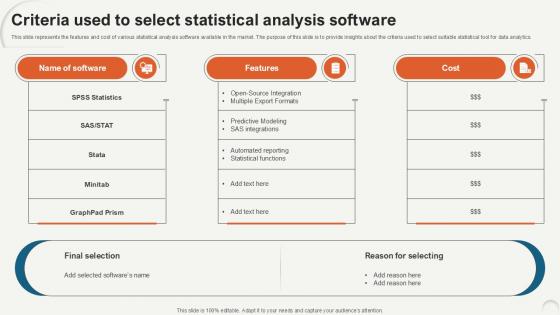
Criteria Used To Select Statistical Data Analytics For Informed Decision Ppt Sample
This slide represents the features and cost of various statistical analysis software available in the market. The purpose of this slide is to provide insights about the criteria used to select suitable statistical tool for data analytics. Present like a pro with Criteria Used To Select Statistical Data Analytics For Informed Decision Ppt Sample. Create beautiful presentations together with your team, using our easy-to-use presentation slides. Share your ideas in real-time and make changes on the fly by downloading our templates. So whether you are in the office, on the go, or in a remote location, you can stay in sync with your team and present your ideas with confidence. With Slidegeeks presentation got a whole lot easier. Grab these presentations today. This slide represents the features and cost of various statistical analysis software available in the market. The purpose of this slide is to provide insights about the criteria used to select suitable statistical tool for data analytics.
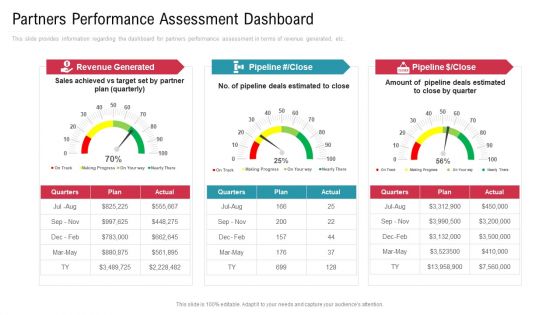
Co Variety Advertisement Partners Performance Assessment Dashboard Introduction PDF
This slide provides information regarding the dashboard for partners performance assessment in terms of revenue generated, etc. Presenting co variety advertisement partners performance assessment dashboard introduction pdf to provide visual cues and insights. Share and navigate important information on three stages that need your due attention. This template can be used to pitch topics like revenue generated, marketing progress, plan. In addition, this PPT design contains high-resolution images, graphics, etc, that are easily editable and available for immediate download.

Plan And Frame Problem Collect The Data Ppt Sample
This is a plan and frame problem collect the data ppt sample. This is a four stage process. The stages in this process are business, marketing, success.
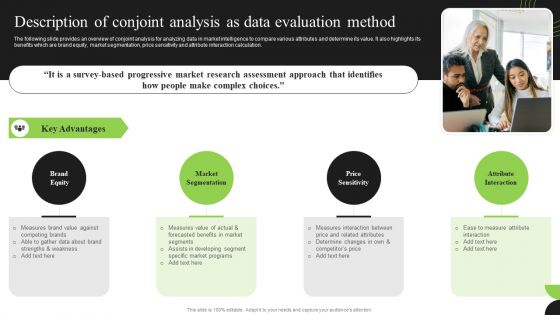
Guidebook For Executing Business Market Intelligence Description Of Conjoint Analysis As Data Professional PDF
The following slide provides an overview of conjoint analysis for analyzing data in market intelligence to compare various attributes and determine its value. It also highlights its benefits which are brand equity, market segmentation, price sensitivity and attribute interaction calculation. Create an editable Guidebook For Executing Business Market Intelligence Description Of Conjoint Analysis As Data Professional PDF that communicates your idea and engages your audience. Whether you are presenting a business or an educational presentation, pre designed presentation templates help save time. Guidebook For Executing Business Market Intelligence Description Of Conjoint Analysis As Data Professional PDF is highly customizable and very easy to edit, covering many different styles from creative to business presentations. Slidegeeks has creative team members who have crafted amazing templates. So, go and get them without any delay.
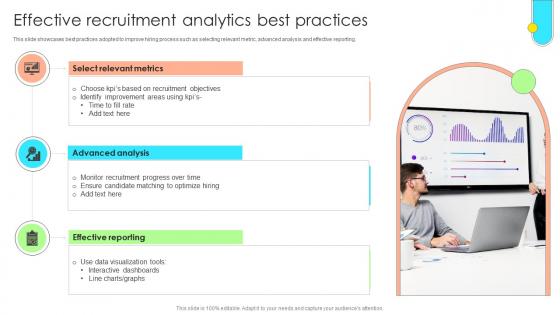
Data Driven Approach To Optimise Effective Recruitment Analytics Best Practices CRP SS V
This slide showcases best practices adopted to improve hiring process such as selecting relevant metric, advanced analysis and effective reporting. Crafting an eye-catching presentation has never been more straightforward. Let your presentation shine with this tasteful yet straightforward Data Driven Approach To Optimise Effective Recruitment Analytics Best Practices CRP SS V template. It offers a minimalistic and classy look that is great for making a statement. The colors have been employed intelligently to add a bit of playfulness while still remaining professional. Construct the ideal Data Driven Approach To Optimise Effective Recruitment Analytics Best Practices CRP SS V that effortlessly grabs the attention of your audience Begin now and be certain to wow your customers This slide showcases best practices adopted to improve hiring process such as selecting relevant metric, advanced analysis and effective reporting.
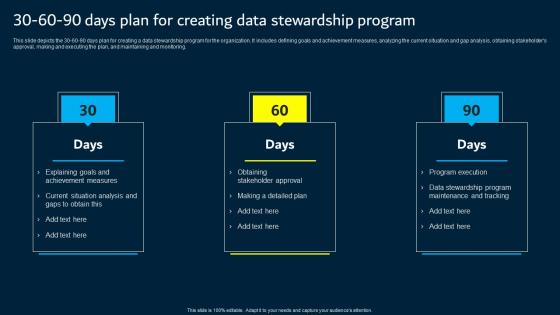
30 60 90 Days Plan For Creating Data Stewardship Program Data Custodianship Inspiration Pdf
This slide depicts the 30 60 90 days plan for creating a data stewardship program for the organization. It includes defining goals and achievement measures, analyzing the current situation and gap analysis, obtaining stakeholder s approval, making and executing the plan, and maintaining and monitoring. Do you have an important presentation coming up Are you looking for something that will make your presentation stand out from the rest Look no further than 30 60 90 Days Plan For Creating Data Stewardship Program Data Custodianship Inspiration Pdf. With our professional designs, you can trust that your presentation will pop and make delivering it a smooth process. And with Slidegeeks, you can trust that your presentation will be unique and memorable. So why wait Grab 30 60 90 Days Plan For Creating Data Stewardship Program Data Custodianship Inspiration Pdf today and make your presentation stand out from the rest This slide depicts the 30 60 90 days plan for creating a data stewardship program for the organization. It includes defining goals and achievement measures, analyzing the current situation and gap analysis, obtaining stakeholder s approval, making and executing the plan, and maintaining and monitoring.
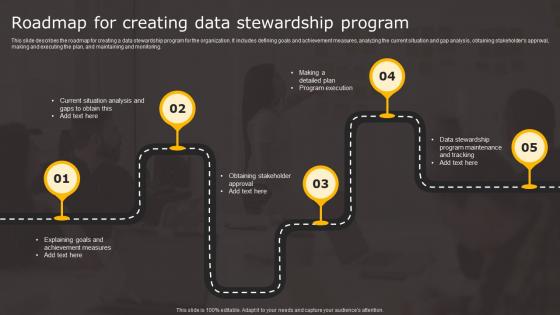
Data Stewardship In Business Processes Roadmap Creating Data Stewardship Infographics Pdf
This slide describes the roadmap for creating a data stewardship program for the organization. It includes defining goals and achievement measures, analyzing the current situation and gap analysis, obtaining stakeholders approval, making and executing the plan, and maintaining and monitoring. Crafting an eye catching presentation has never been more straightforward. Let your presentation shine with this tasteful yet straightforward Data Stewardship In Business Processes Roadmap Creating Data Stewardship Infographics Pdf template. It offers a minimalistic and classy look that is great for making a statement. The colors have been employed intelligently to add a bit of playfulness while still remaining professional. Construct the ideal Data Stewardship In Business Processes Roadmap Creating Data Stewardship Infographics Pdf that effortlessly grabs the attention of your audience Begin now and be certain to wow your customers This slide describes the roadmap for creating a data stewardship program for the organization. It includes defining goals and achievement measures, analyzing the current situation and gap analysis, obtaining stakeholders approval, making and executing the plan, and maintaining and monitoring.
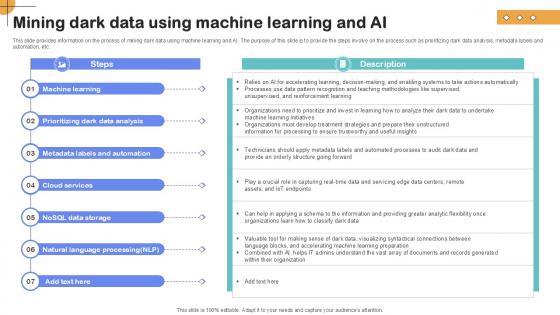
Mining Dark Data Using Machine Importance Of Unstructured Data Ppt PowerPoint
This slide provides information on the process of mining dark data using machine learning and AI. The purpose of this slide is to provide the steps involve on the process such as prioritizing dark data analysis, metadata labels and automation, etc.Retrieve professionally designed Mining Dark Data Using Machine Importance Of Unstructured Data Ppt PowerPoint to effectively convey your message and captivate your listeners. Save time by selecting pre-made slideshows that are appropriate for various topics, from business to educational purposes. These themes come in many different styles, from creative to corporate, and all of them are easily adjustable and can be edited quickly. Access them as PowerPoint templates or as Google Slides themes. You do not have to go on a hunt for the perfect presentation because Slidegeeks got you covered from everywhere. This slide provides information on the process of mining dark data using machine learning and AI. The purpose of this slide is to provide the steps involve on the process such as prioritizing dark data analysis, metadata labels and automation, etc.
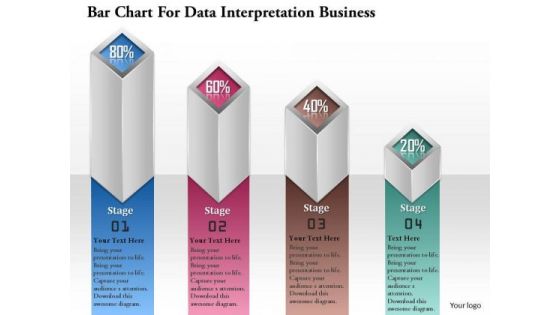
Consulting Slides Bar Chart For Data Interpretation Business Presentation
This pre-designed and appealing bar chart for PowerPoint offer an optimized possibility to illustrate your business strategy. You can use this diagram for data interpretation. This diagram is editable and can be easily adjusted.
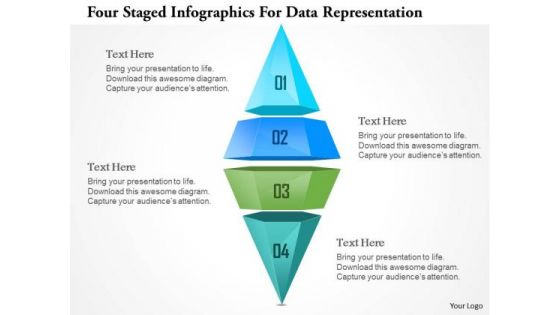
Busines Diagram Four Staged Ingographics For Data Representation Ppt Template
This business diagram has been designed with graphic of four staged info graphics. This info graphic can be used for data representation. Deliver amazing presentations to mesmerize your audience.


 Continue with Email

 Home
Home


