Project Kpi
System Analysis And Design Running On Browser Icon Ppt Styles Images PDF
Persuade your audience using this System Analysis And Design Running On Browser Icon Ppt Styles Images PDF. This PPT design covers three stages, thus making it a great tool to use. It also caters to a variety of topics including System, Analysis And Design, Running Browser Icon. Download this PPT design now to present a convincing pitch that not only emphasizes the topic but also showcases your presentation skills.

5 Key Considerations To Initiate Data Centralization Introduction PDF
This slide showcases important points to consider while initiating for data centralization in the organization. Key five points highlighted here are data alignment, budget allocation, data security, cross-functionality and data monitoring. Presenting 5 Key Considerations To Initiate Data Centralization Introduction PDF to dispense important information. This template comprises five stages. It also presents valuable insights into the topics including Data Monitoring, Data Security, Management System. This is a completely customizable PowerPoint theme that can be put to use immediately. So, download it and address the topic impactfully.
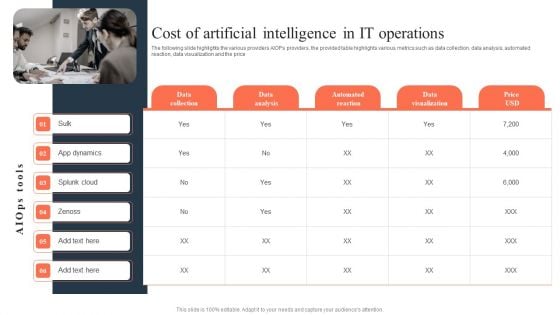
Ml And Big Data In Information Technology Processes Cost Of Artificial Intelligence In IT Operations Infographics PDF
The following slide highlights the various providers AIOPs providers, the provided table highlights various metrics such as data collection, data analysis, automated reaction, data visualization and the price Do you have to make sure that everyone on your team knows about any specific topic I yes, then you should give Ml And Big Data In Information Technology Processes Cost Of Artificial Intelligence In IT Operations Infographics PDF a try. Our experts have put a lot of knowledge and effort into creating this impeccable Ml And Big Data In Information Technology Processes Cost Of Artificial Intelligence In IT Operations Infographics PDF. You can use this template for your upcoming presentations, as the slides are perfect to represent even the tiniest detail. You can download these templates from the Slidegeeks website and these are easy to edit. So grab these today.
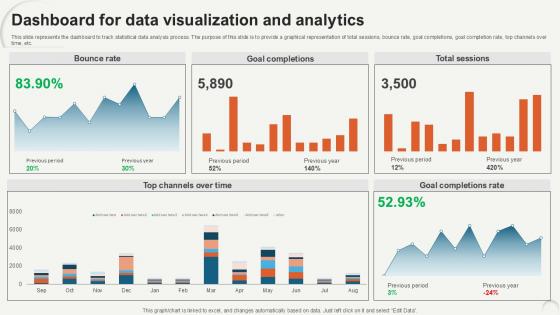
Dashboard For Data Visualization Data Analytics For Informed Decision Ppt Sample
This slide represents the dashboard to track statistical data analysis process. The purpose of this slide is to provide a graphical representation of total sessions, bounce rate, goal completions, goal completion rate, top channels over time, etc. Do you have an important presentation coming up Are you looking for something that will make your presentation stand out from the rest Look no further than Dashboard For Data Visualization Data Analytics For Informed Decision Ppt Sample. With our professional designs, you can trust that your presentation will pop and make delivering it a smooth process. And with Slidegeeks, you can trust that your presentation will be unique and memorable. So why wait Grab Dashboard For Data Visualization Data Analytics For Informed Decision Ppt Sample today and make your presentation stand out from the rest This slide represents the dashboard to track statistical data analysis process. The purpose of this slide is to provide a graphical representation of total sessions, bounce rate, goal completions, goal completion rate, top channels over time, etc.
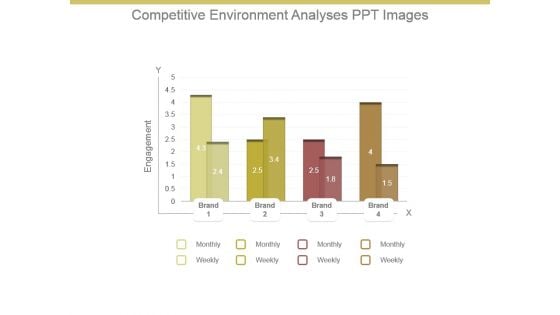
Competitive Environment Analysis Ppt Images
This is a competitive environment analysis ppt images. This is a four stage process. The stages in this process are engagement, brand, monthly, weekly, x, y.
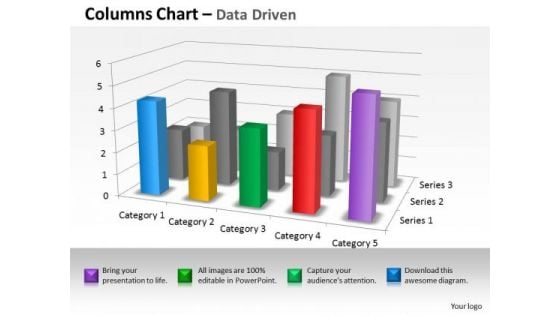
Quantitative Data Analysis 3d Interpretation Of Statistical Quality Control PowerPoint Templates
Land The Idea With Our quantitative data analysis 3d interpretation of statistical quality control Powerpoint Templates . Help It Grow With Your Thoughts.

Progress Assessment Outline Ppt PowerPoint Presentation Complete Deck With Slides
Presenting this set of slides with name progress assessment outline ppt powerpoint presentation complete deck with slides. The topics discussed in these slides are measurement, implementation, strategy, performance, dashboard. This is a completely editable PowerPoint presentation and is available for immediate download. Download now and impress your audience.
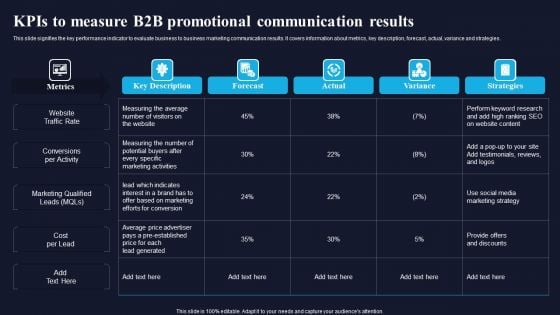
Kpis To Measure B2B Promotional Communication Results Graphics PDF
This slide signifies the key performance indicator to evaluate business to business marketing communication results. It covers information about metrics, key description, forecast, actual, variance and strategies. Showcasing this set of slides titled Kpis To Measure B2B Promotional Communication Results Graphics PDF. The topics addressed in these templates are Key Description, Forecast, Actual, Variance. All the content presented in this PPT design is completely editable. Download it and make adjustments in color, background, font etc. as per your unique business setting.
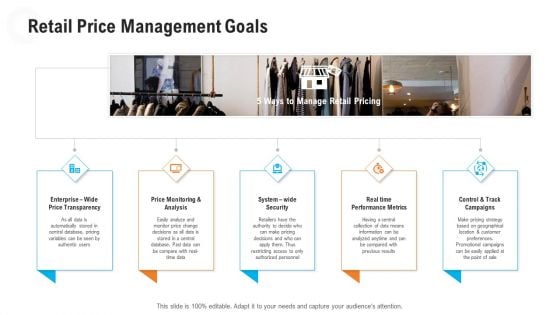
Retail Industry Outlook Retail Price Management Goals Brochure PDF
Deliver and pitch your topic in the best possible manner with this retail industry outlook retail price management goals brochure pdf. Use them to share invaluable insights on enterprise wide price transparency, price monitoring and analysis, system wide security, real time performance metrics and impress your audience. This template can be altered and modified as per your expectations. So, grab it now.
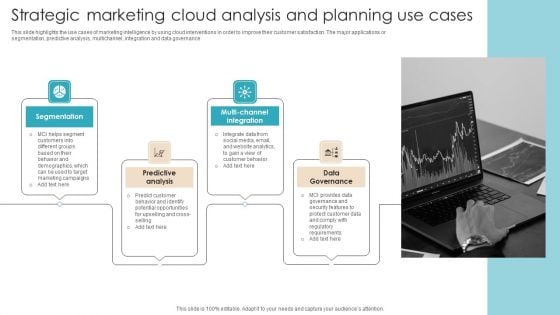
Strategic Marketing Cloud Analysis And Planning Use Cases Themes PDF
This slide highlights the use cases of marketing intelligence by using cloud interventions in order to improve their customer satisfaction. The major applications or segmentation, predictive analysis, multichannel, integration and data governance. Presenting Strategic Marketing Cloud Analysis And Planning Use Cases Themes PDF to dispense important information. This template comprises four stages. It also presents valuable insights into the topics including Segmentation, Predictive Analysis, Data Governance. This is a completely customizable PowerPoint theme that can be put to use immediately. So, download it and address the topic impactfully.
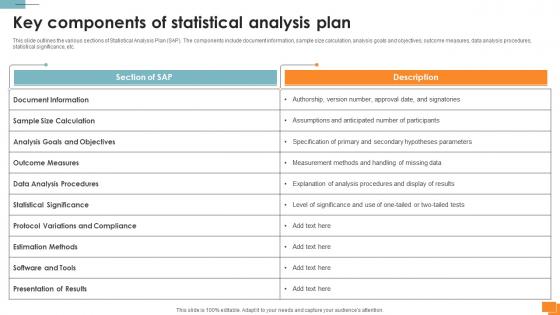
Statistical Tools For Evidence Key Components Of Statistical Analysis Plan
This slide outlines the various sections of Statistical Analysis Plan SAP. The components include document information, sample size calculation, analysis goals and objectives, outcome measures, data analysis procedures, statistical significance, etc. The Statistical Tools For Evidence Key Components Of Statistical Analysis Plan is a compilation of the most recent design trends as a series of slides. It is suitable for any subject or industry presentation, containing attractive visuals and photo spots for businesses to clearly express their messages. This template contains a variety of slides for the user to input data, such as structures to contrast two elements, bullet points, and slides for written information. Slidegeeks is prepared to create an impression. This slide outlines the various sections of Statistical Analysis Plan SAP. The components include document information, sample size calculation, analysis goals and objectives, outcome measures, data analysis procedures, statistical significance, etc.
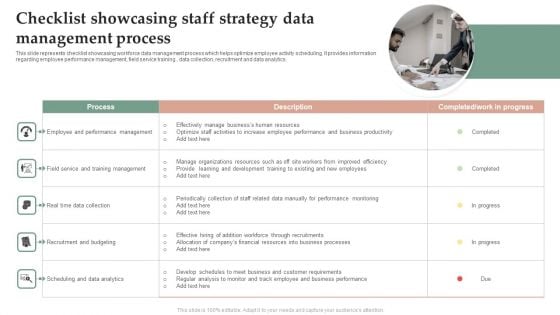
Checklist Showcasing Staff Strategy Data Management Process Information PDF
This slide represents checklist showcasing workforce data management process which helps optimize employee activity scheduling. It provides information regarding employee performance management, field service training , data collection, recruitment and data analytics. Persuade your audience using this Checklist Showcasing Staff Strategy Data Management Process Information PDF. This PPT design covers One stage, thus making it a great tool to use. It also caters to a variety of topics including Recruitment Budgeting, Scheduling Data Analytics. Download this PPT design now to present a convincing pitch that not only emphasizes the topic but also showcases your presentation skills.
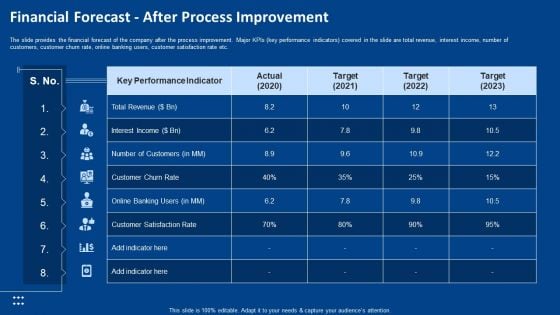
Procedure Advancements Banking Department Financial Forecast After Process Improvement Template PDF
The slide provides the financial forecast of the company after the process improvement. Major KPIs key performance indicators covered in the slide are total revenue, interest income, number of customers, customer churn rate, online banking users, customer satisfaction rate etc. Deliver and pitch your topic in the best possible manner with this procedure advancements banking department financial forecast after process improvement template pdf. Use them to share invaluable insights on total revenue, interest income, customer satisfaction rate, customer churn rate, online banking users and impress your audience. This template can be altered and modified as per your expectations. So, grab it now.
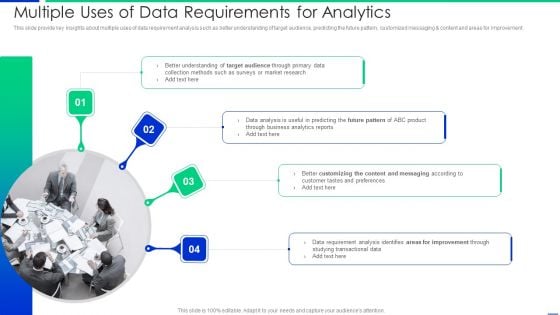
Multiple Uses Of Data Requirements For Analytics Pictures PDF
This slide provide key insights about multiple uses of data requirement analysis such as better understanding of target audience, predicting the future pattern, customized messaging and content and areas for improvement. Presenting multiple uses of data requirements for analytics pictures pdf to dispense important information. This template comprises four stages. It also presents valuable insights into the topics including analysis, customer, requirement. This is a completely customizable PowerPoint theme that can be put to use immediately. So, download it and address the topic impactfully.
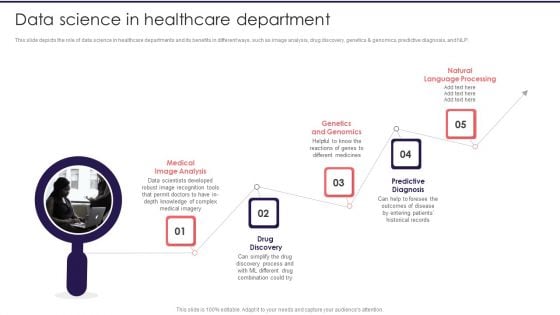
Information Studies Data Science In Healthcare Department Rules PDF
This slide depicts the role of data science in healthcare departments and its benefits in different ways, such as image analysis, drug discovery, genetics And genomics, predictive diagnosis, and NLP. This is a Information Studies Data Science In Healthcare Department Rules PDF template with various stages. Focus and dispense information on five stages using this creative set, that comes with editable features. It contains large content boxes to add your information on topics like Medical Image Analysis, Genetics And Genomics, Natural Language Processing. You can also showcase facts, figures, and other relevant content using this PPT layout. Grab it now.
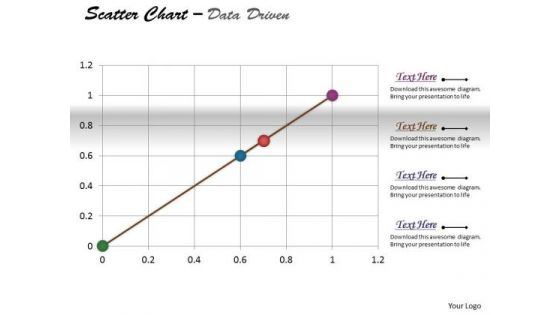
Excel Data Analysis Data Methods Statistical Tool Survey Driven PowerPoint Slides Templates
Be The Duke Of The Dais With Our excel data analysis data methods statistical tool survey driven powerpoint slides Templates . Acquire Royalty Status With Your Thoughts.
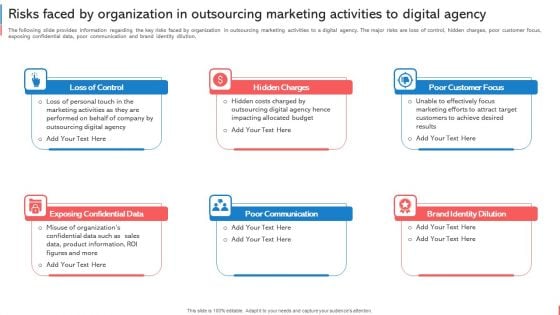
Company Budget Analysis Risks Faced By Organization In Outsourcing Marketing Activities Information PDF
The following slide provides information regarding the key risks faced by organization in outsourcing marketing activities to a digital agency. The major risks are loss of control, hidden charges, poor customer focus, exposing confidential data, poor communication and brand identity dilution. Coming up with a presentation necessitates that the majority of the effort goes into the content and the message you intend to convey. The visuals of a PowerPoint presentation can only be effective if it supplements and supports the story that is being told. Keeping this in mind our experts created Company Budget Analysis Risks Faced By Organization In Outsourcing Marketing Activities Information PDF to reduce the time that goes into designing the presentation. This way, you can concentrate on the message while our designers take care of providing you with the right template for the situation.
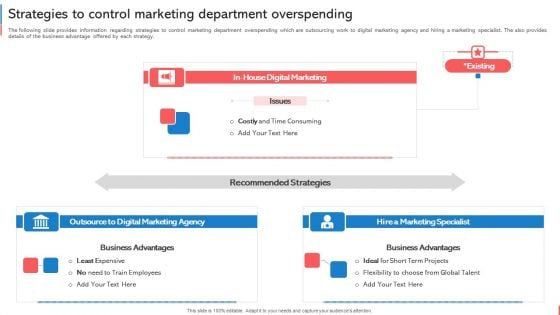
Company Budget Analysis Strategies To Control Marketing Department Overspending Mockup PDF
The following slide provides information regarding strategies to control marketing department overspending which are outsourcing work to digital marketing agency and hiring a marketing specialist. The also provides details of the business advantage offered by each strategy. The Company Budget Analysis Strategies To Control Marketing Department Overspending Mockup PDF is a compilation of the most recent design trends as a series of slides. It is suitable for any subject or industry presentation, containing attractive visuals and photo spots for businesses to clearly express their messages. This template contains a variety of slides for the user to input data, such as structures to contrast two elements, bullet points, and slides for written information. Slidegeeks is prepared to create an impression.
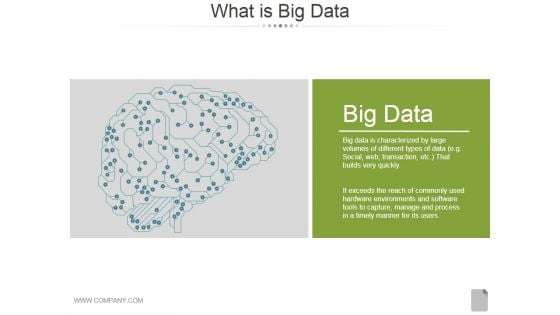
What Is Big Data Ppt PowerPoint Presentation Diagrams
This is a what is big data ppt powerpoint presentation diagrams. This is a one stage process. The stages in this process are big data, business, analysis, management, marketing.
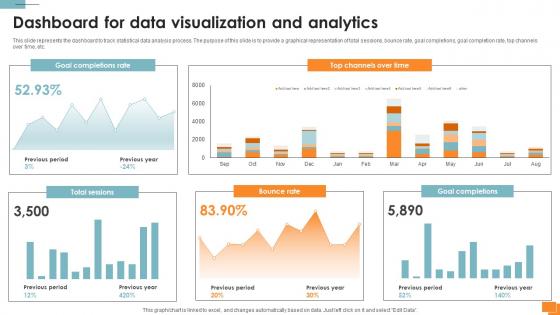
Statistical Tools For Evidence Dashboard For Data Visualization And Analytics
This slide represents the dashboard to track statistical data analysis process. The purpose of this slide is to provide a graphical representation of total sessions, bounce rate, goal completions, goal completion rate, top channels over time, etc. Are you in need of a template that can accommodate all of your creative concepts This one is crafted professionally and can be altered to fit any style. Use it with Google Slides or PowerPoint. Include striking photographs, symbols, depictions, and other visuals. Fill, move around, or remove text boxes as desired. Test out color palettes and font mixtures. Edit and save your work, or work with colleagues. Download Statistical Tools For Evidence Dashboard For Data Visualization And Analytics and observe how to make your presentation outstanding. Give an impeccable presentation to your group and make your presentation unforgettable. This slide represents the dashboard to track statistical data analysis process. The purpose of this slide is to provide a graphical representation of total sessions, bounce rate, goal completions, goal completion rate, top channels over time, etc.
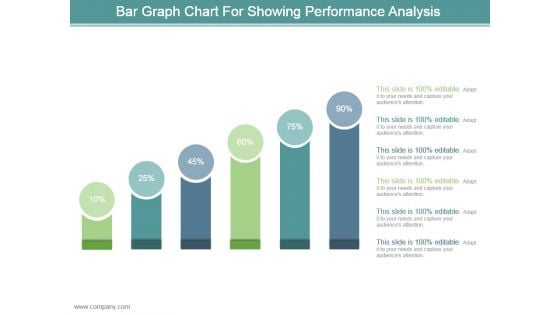
Bar Graph Chart For Showing Performance Analysis Ppt Design
This is a bar graph chart for showing performance analysis ppt design. This is a six stage process. The stages in this process are business, marketing, process, success, presentation.
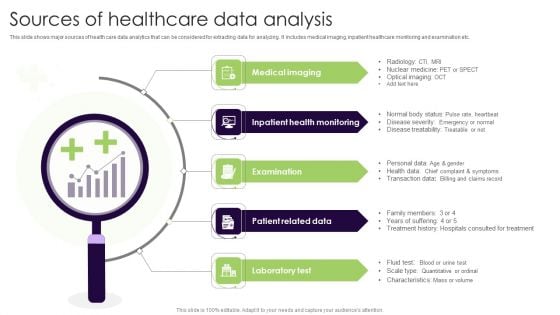
Sources Of Healthcare Data Analysis Rules PDF
This slide shows major sources of health care data analytics that can be considered for extracting data for analyzing. It includes medical imaging, inpatient healthcare monitoring and examination etc. Presenting Sources Of Healthcare Data Analysis Rules PDF to dispense important information. This template comprises five stages. It also presents valuable insights into the topics including Inpatient Health Monitoring, Examination, Patient Related Data. This is a completely customizable PowerPoint theme that can be put to use immediately. So, download it and address the topic impactfully.
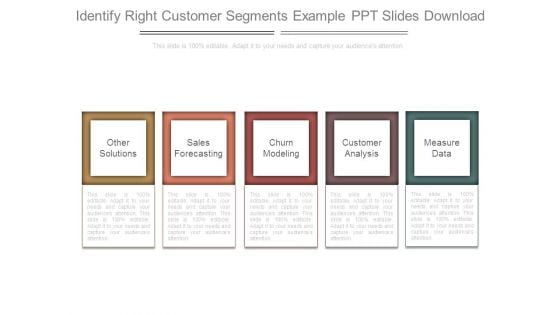
Identify Right Customer Segments Example Ppt Slides Download
This is a identify right customer segments example ppt slides download. This is a five stage process. The stages in this process are other solutions, sales forecasting, churn modeling, customer analysis, measure data.
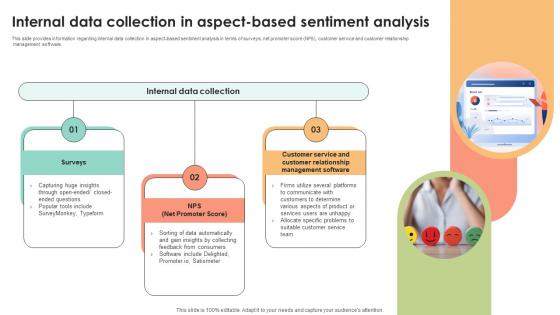
Internal Data Collection In Aspect Based Decoding User Emotions In Depth Exploration AI SS V
This slide provides information regarding internal data collection in aspect-based sentiment analysis in terms of surveys, net promoter score NPS, customer service and customer relationship management software. Presenting this PowerPoint presentation, titled Internal Data Collection In Aspect Based Decoding User Emotions In Depth Exploration AI SS V, with topics curated by our researchers after extensive research. This editable presentation is available for immediate download and provides attractive features when used. Download now and captivate your audience. Presenting this Internal Data Collection In Aspect Based Decoding User Emotions In Depth Exploration AI SS V. Our researchers have carefully researched and created these slides with all aspects taken into consideration. This is a completely customizable Internal Data Collection In Aspect Based Decoding User Emotions In Depth Exploration AI SS V that is available for immediate downloading. Download now and make an impact on your audience. Highlight the attractive features available with our PPTs. This slide provides information regarding internal data collection in aspect-based sentiment analysis in terms of surveys, net promoter score NPS, customer service and customer relationship management software.
Database Management Vector Icon Ppt PowerPoint Presentation Professional Format Ideas
Presenting this set of slides with name database management vector icon ppt powerpoint presentation professional format ideas. The topics discussed in these slides are data sources, database management, marketing. This is a completely editable PowerPoint presentation and is available for immediate download. Download now and impress your audience.

Five Ways To Maximize Digital Marketing Efficiency Ppt PowerPoint Presentation Summary Brochure
Presenting this set of slides with name five ways to maximize digital marketing efficiency ppt powerpoint presentation summary brochure. The topics discussed in these slides are data sources, database management, marketing. This is a completely editable PowerPoint presentation and is available for immediate download. Download now and impress your audience.
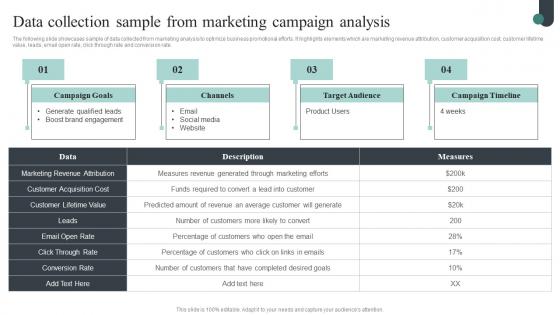
Data Collection Sample From Marketing Competitive Intelligence Guide To Determine Market Topics Pdf
The following slide showcases sample of data collected from marketing analysis to optimize business promotional efforts. It highlights elements which are marketing revenue attribution, customer acquisition cost, customer lifetime value, leads, email open rate, click through rate and conversion rate. Here you can discover an assortment of the finest PowerPoint and Google Slides templates. With these templates, you can create presentations for a variety of purposes while simultaneously providing your audience with an eye-catching visual experience. Download Data Collection Sample From Marketing Competitive Intelligence Guide To Determine Market Topics Pdf to deliver an impeccable presentation. These templates will make your job of preparing presentations much quicker, yet still, maintain a high level of quality. Slidegeeks has experienced researchers who prepare these templates and write high-quality content for you. Later on, you can personalize the content by editing the Data Collection Sample From Marketing Competitive Intelligence Guide To Determine Market Topics Pdf. The following slide showcases sample of data collected from marketing analysis to optimize business promotional efforts. It highlights elements which are marketing revenue attribution, customer acquisition cost, customer lifetime value, leads, email open rate, click through rate and conversion rate.
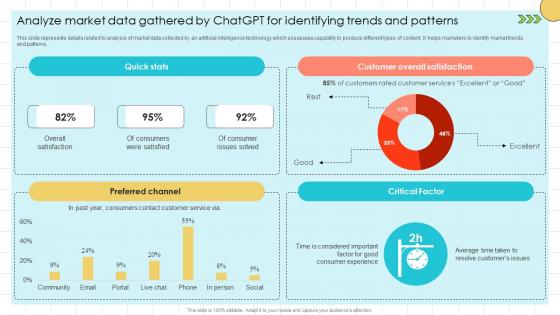
Chat GPT Prompts For Market Analyze Market Data Gathered By ChatGPT SS V
This slide represents details related to analysis of market data collected by an artificial intelligence technology which possesses capability to produce different types of content. It helps marketers to identify market trends and patterns. Do you have to make sure that everyone on your team knows about any specific topic I yes, then you should give Chat GPT Prompts For Market Analyze Market Data Gathered By ChatGPT SS V a try. Our experts have put a lot of knowledge and effort into creating this impeccable Chat GPT Prompts For Market Analyze Market Data Gathered By ChatGPT SS V. You can use this template for your upcoming presentations, as the slides are perfect to represent even the tiniest detail. You can download these templates from the Slidegeeks website and these are easy to edit. So grab these today This slide represents details related to analysis of market data collected by an artificial intelligence technology which possesses capability to produce different types of content. It helps marketers to identify market trends and patterns.

Overview Cybersecurity And Data Protection In Digital Transformation DT SS V
This slide presents an overview into the landscape of cybersecurity and data protection with its advantages. It also presents a survey analysis on share of SMEs that have implemented essential and basic IT security initiatives.Find highly impressive Overview Cybersecurity And Data Protection In Digital Transformation DT SS V on Slidegeeks to deliver a meaningful presentation. You can save an ample amount of time using these presentation templates. No need to worry to prepare everything from scratch because Slidegeeks experts have already done a huge research and work for you. You need to download Overview Cybersecurity And Data Protection In Digital Transformation DT SS V for your upcoming presentation. All the presentation templates are 100 percent editable and you can change the color and personalize the content accordingly. Download now This slide presents an overview into the landscape of cybersecurity and data protection with its advantages. It also presents a survey analysis on share of SMEs that have implemented essential and basic IT security initiatives.
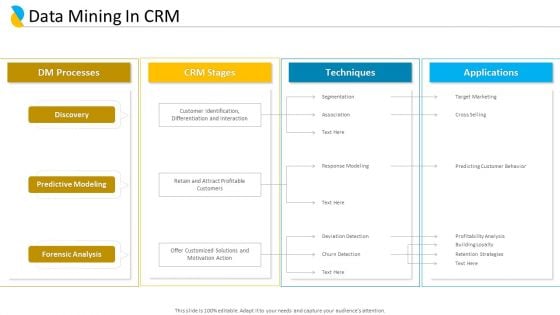
Customer Relationship Management Data Mining In CRM Ppt File Model PDF
Presenting customer relationship management data mining in CRM ppt file model pdf to provide visual cues and insights. Share and navigate important information on four stages that need your due attention. This template can be used to pitch topics like CRM stages, techniques, predictive modeling, forensic analysis, target marketing. In addtion, this PPT design contains high resolution images, graphics, etc, that are easily editable and available for immediate download.
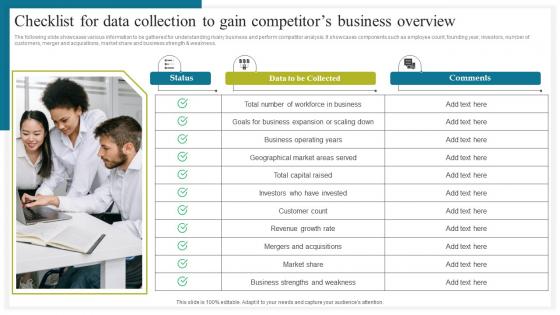
Checklist For Data Collection How To Conduct Competitive Assessment Brochure Pdf
The following slide showcases various information to be gathered for understanding rivalry business and perform competitor analysis. It showcases components such as employee count, founding year, investors, number of customers, merger and acquisitions, market share and business strength and weakness. Get a simple yet stunning designed Checklist For Data Collection How To Conduct Competitive Assessment Brochure Pdf. It is the best one to establish the tone in your meetings. It is an excellent way to make your presentations highly effective. So, download this PPT today from Slidegeeks and see the positive impacts. Our easy to edit Checklist For Data Collection How To Conduct Competitive Assessment Brochure Pdf can be your go to option for all upcoming conferences and meetings. So, what are you waiting for Grab this template today. The following slide showcases various information to be gathered for understanding rivalry business and perform competitor analysis. It showcases components such as employee count, founding year, investors, number of customers, merger and acquisitions, market share and business strength and weakness.
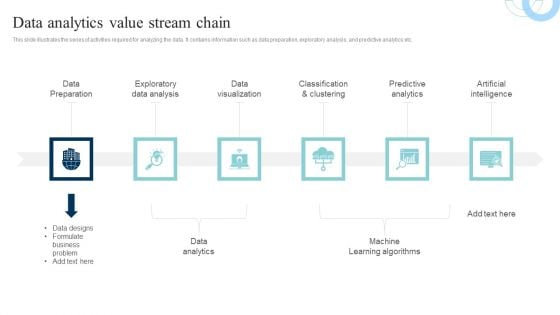
Data Evaluation And Processing Toolkit Data Analytics Value Stream Chain Microsoft PDF
This slide illustrates the series of activities required for analyzing the data. It contains information such as data preparation, exploratory analysis, and predictive analytics etc. Formulating a presentation can take up a lot of effort and time, so the content and message should always be the primary focus. The visuals of the PowerPoint can enhance the presenters message, so our Data Evaluation And Processing Toolkit Data Analytics Value Stream Chain Microsoft PDF was created to help save time. Instead of worrying about the design, the presenter can concentrate on the message while our designers work on creating the ideal templates for whatever situation is needed. Slidegeeks has experts for everything from amazing designs to valuable content, we have put everything into Data Evaluation And Processing Toolkit Data Analytics Value Stream Chain Microsoft PDF.

Toolkit For Data Science And Analytics Transition Data Analytics Value Stream Chain Pictures PDF
This slide illustrates the series of activities required for analyzing the data. It contains information such as data preparation, exploratory analysis, and predictive analytics etc. If you are looking for a format to display your unique thoughts, then the professionally designed Toolkit For Data Science And Analytics Transition Data Analytics Value Stream Chain Pictures PDF is the one for you. You can use it as a Google Slides template or a PowerPoint template. Incorporate impressive visuals, symbols, images, and other charts. Modify or reorganize the text boxes as you desire. Experiment with shade schemes and font pairings. Alter, share or cooperate with other people on your work. Download Toolkit For Data Science And Analytics Transition Data Analytics Value Stream Chain Pictures PDF and find out how to give a successful presentation. Present a perfect display to your team and make your presentation unforgettable.
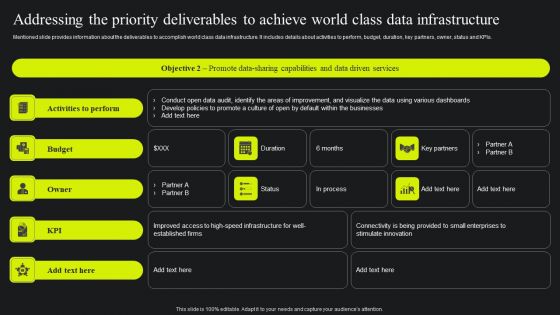
Addressing The Priority Deliverables To Achieve World Class Data Infrastructure Themes PDF
Mentioned slide provides information about the deliverables to accomplish world class data infrastructure. It includes details about activities to perform, budget, duration, key partners, owner, status and KPIs. Slidegeeks is one of the best resources for PowerPoint templates. You can download easily and regulate Addressing The Priority Deliverables To Achieve World Class Data Infrastructure Themes PDF for your personal presentations from our wonderful collection. A few clicks is all it takes to discover and get the most relevant and appropriate templates. Use our Templates to add a unique zing and appeal to your presentation and meetings. All the slides are easy to edit and you can use them even for advertisement purposes.
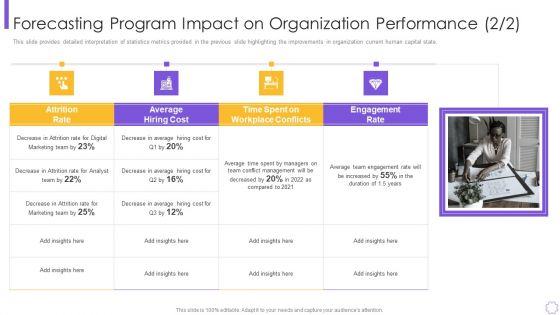
Forecasting Program Impact On Organization Performance Rules Clipart PDF
This slide provides detailed interpretation of statistics metrics provided in the previous slide highlighting the improvements in organization current human capital state.Presenting forecasting program impact on organization performance rules clipart pdf to provide visual cues and insights. Share and navigate important information on one stage that need your due attention. This template can be used to pitch topics like average hiring cost, decrease in attrition, conflict management In addtion, this PPT design contains high resolution images, graphics, etc, that are easily editable and available for immediate download.

Forecasting Program Impact On Organization Performance Guidelines PDF
This slide provides detailed interpretation of statistics metrics provided in the previous slide highlighting the improvements in organization current human capital state.This is a forecasting program impact on organization performance guidelines pdf template with various stages. Focus and dispense information on one stage using this creative set, that comes with editable features. It contains large content boxes to add your information on topics like average hiring cost, engagement rate, average time spent You can also showcase facts, figures, and other relevant content using this PPT layout. Grab it now.
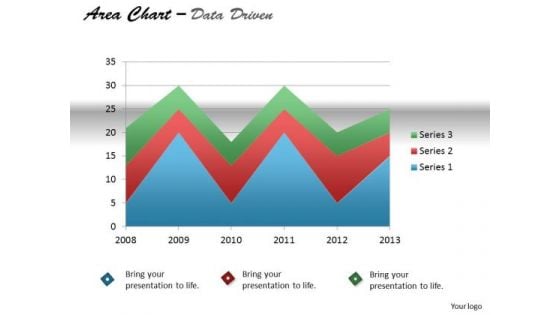
Quantitative Data Analysis Driven Display Series With Area Chart PowerPoint Slides Templates
Our quantitative data analysis driven display series with area chart powerpoint slides Templates Enjoy Drama. They Provide Entertaining Backdrops.
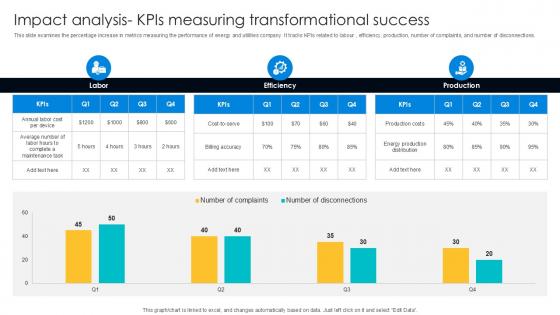
Impact Analysis KPIs Measuring Digital Transformation Journey PPT Presentation DT SS V
This slide examines the percentage increase in metrics measuring the performance of energy and utilities company. It tracks KPIs related to labour , efficiency, production, number of complaints, and number of disconnections. The Impact Analysis KPIs Measuring Digital Transformation Journey PPT Presentation DT SS V is a compilation of the most recent design trends as a series of slides. It is suitable for any subject or industry presentation, containing attractive visuals and photo spots for businesses to clearly express their messages. This template contains a variety of slides for the user to input data, such as structures to contrast two elements, bullet points, and slides for written information. Slidegeeks is prepared to create an impression. This slide examines the percentage increase in metrics measuring the performance of energy and utilities company. It tracks KPIs related to labour , efficiency, production, number of complaints, and number of disconnections.
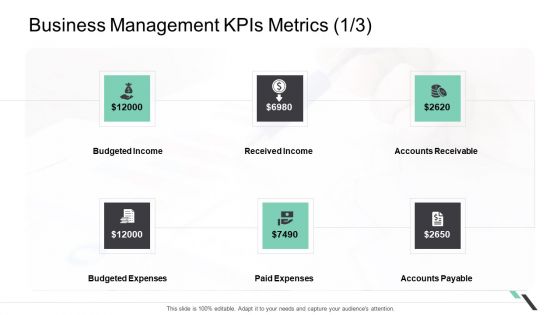
Business Management Kpis Metrics Income Ppt Example File PDF
This is a business management kpis metrics income ppt example file pdf. template with various stages. Focus and dispense information on six stages using this creative set, that comes with editable features. It contains large content boxes to add your information on topics like budgeted income, received income, accounts receivable. You can also showcase facts, figures, and other relevant content using this PPT layout. Grab it now.
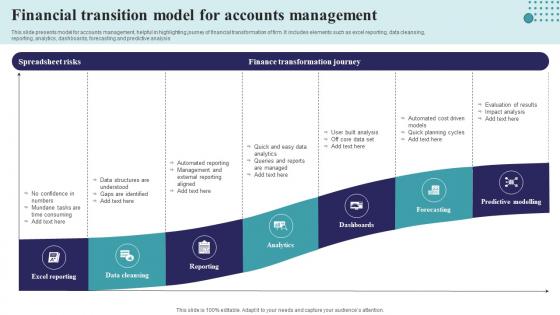
Financial Transition Model For Accounts Management Structure Pdf
This slide presents model for accounts management, helpful in highlighting journey of financial transformation of firm. It includes elements such as excel reporting, data cleansing, reporting, analytics, dashboards, forecasting and predictive analysis Pitch your topic with ease and precision using this Financial Transition Model For Accounts Management Structure Pdf This layout presents information on Excel Reporting, Data Cleansing, Reporting, Analytics It is also available for immediate download and adjustment. So, changes can be made in the color, design, graphics or any other component to create a unique layout. This slide presents model for accounts management, helpful in highlighting journey of financial transformation of firm. It includes elements such as excel reporting, data cleansing, reporting, analytics, dashboards, forecasting and predictive analysis
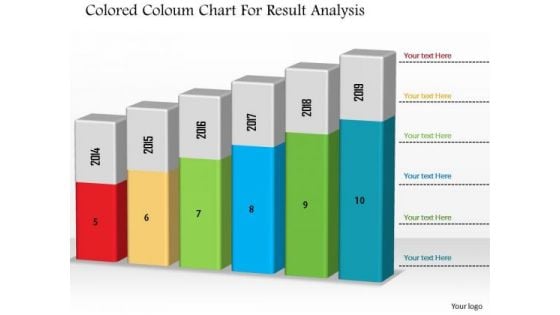
Business Diagram Colored Column Chart For Result Analysis PowerPoint Slide
This Power Point diagram has been designed with graphic of column chart. It contains diagram of bar char depicting annual business progress report. Use this diagram to build professional presentations for your viewers.
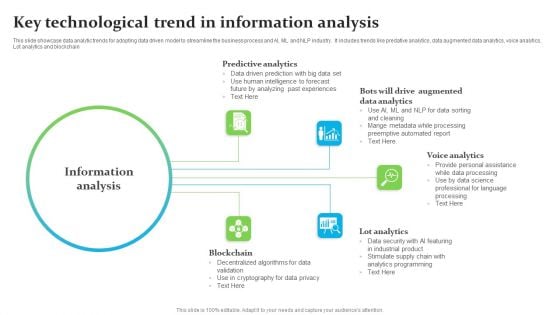
Key Technological Trend In Information Analysis Ppt Ideas Layout PDF
This slide showcase data analytic trends for adopting data driven model to streamline the business process and AI, ML and NLP industry. It includes trends like predative analytics, data augmented data analytics, voice analytics, Lot analytics and blockchain. Presenting Key Technological Trend In Information Analysis Ppt Ideas Layout PDF to dispense important information. This template comprises five stages. It also presents valuable insights into the topics including Predictive Analytics, Voice Analytics, Lot Analytics, Blockchain. This is a completely customizable PowerPoint theme that can be put to use immediately. So, download it and address the topic impactfully.
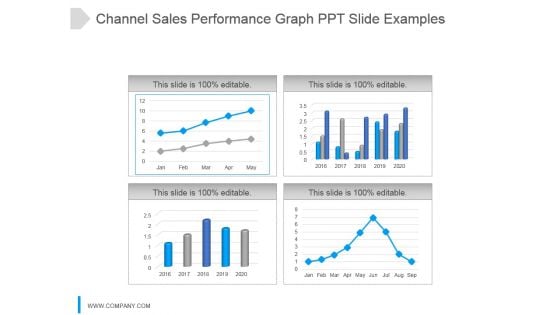
Channel Sales Performance Graph Ppt Slide Examples
This is a channel sales performance graph ppt slide examples. This is a four stage process. The stages in this process are jan, feb, mar, apr, may, jun, jul, aug, sep.

Overview Of Key Findings Ppt PowerPoint Presentation Complete Deck With Slides
Presenting this set of slides with name overview of key findings ppt powerpoint presentation complete deck with slides. The topics discussed in these slides are overview, key findings, agenda, marketing, business. This is a completely editable PowerPoint presentation and is available for immediate download. Download now and impress your audience.
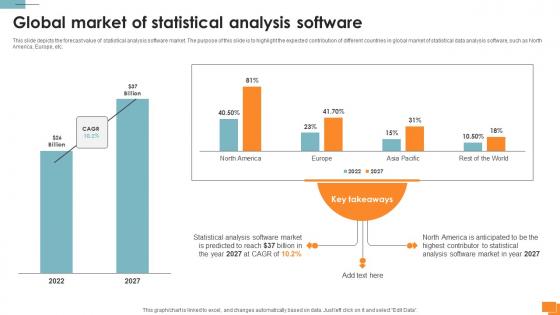
Statistical Tools For Evidence Global Market Of Statistical Analysis Software
This slide depicts the forecast value of statistical analysis software market. The purpose of this slide is to highlight the expected contribution of different countries in global market of statistical data analysis software, such as North America, Europe, etc. This modern and well-arranged Statistical Tools For Evidence Global Market Of Statistical Analysis Software provides lots of creative possibilities. It is very simple to customize and edit with the Powerpoint Software. Just drag and drop your pictures into the shapes. All facets of this template can be edited with Powerpoint, no extra software is necessary. Add your own material, put your images in the places assigned for them, adjust the colors, and then you can show your slides to the world, with an animated slide included. This slide depicts the forecast value of statistical analysis software market. The purpose of this slide is to highlight the expected contribution of different countries in global market of statistical data analysis software, such as North America, Europe, etc.
Requirement Analysis Of Gap Vector Icon Ppt File Rules PDF
Presenting requirement analysis of gap vector icon ppt file rules pdf. to dispense important information. This template comprises three stages. It also presents valuable insights into the topics including requirement analysis of gap vector icon. This is a completely customizable PowerPoint theme that can be put to use immediately. So, download it and address the topic impactfully.

Data Analysis Excel 3d Pie Chart For Marketing Process PowerPoint Templates
Our data analysis excel 3d pie chart for marketing process Powerpoint Templates Team Are A Dogged Lot. They Keep At It Till They Get It Right.
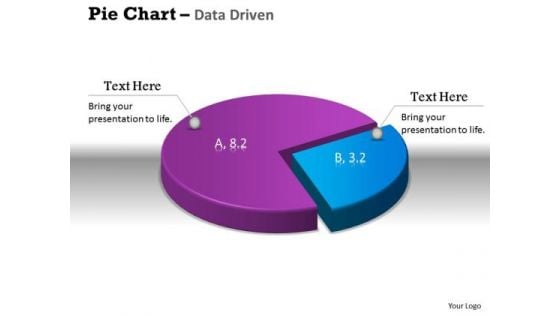
Data Analysis Excel 3d Pie Chart Shows Relative Size Of PowerPoint Templates
Get The Doers Into Action. Activate Them With Our data analysis excel 3d pie chart shows relative size of Powerpoint Templates.
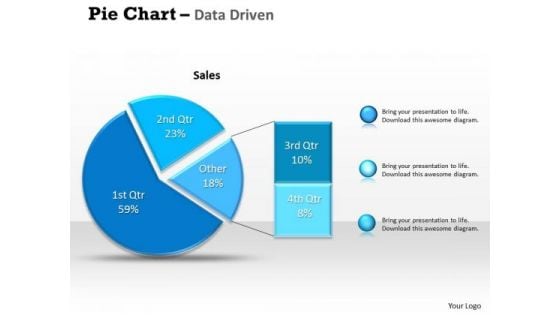
Data Analysis Excel Driven Percentage Breakdown Pie Chart PowerPoint Slides Templates
Be A Donor Of Great Ideas. Display Your Charity On Our data analysis excel driven percentage breakdown pie chart powerpoint slides Templates.
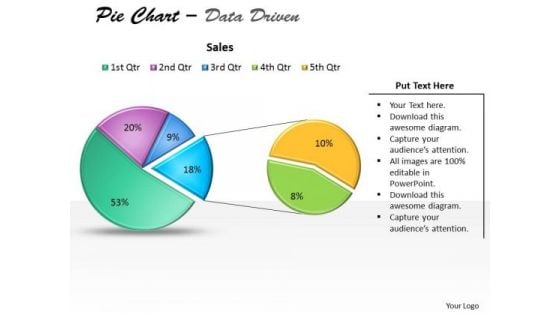
Data Analysis Excel Driven Pie Chart For Business Stratregy PowerPoint Slides Templates
Open Up Doors That Lead To Success. Our data analysis excel driven pie chart for business stratregy powerpoint slides Templates Provide The Handles.

Data Analysis Excel Driven Pie Chart For Easy Comparison PowerPoint Slides Templates
Our data analysis excel driven pie chart for easy comparison powerpoint slides Templates Abhor Doodling. They Never Let The Interest Flag.
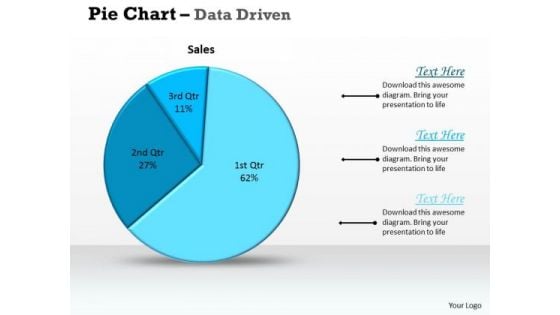
Data Analysis Excel Driven Pie Chart For Sales Process PowerPoint Slides Templates
Deliver The Right Dose With Our data analysis excel driven pie chart for sales process powerpoint slides Templates . Your Ideas Will Get The Correct Illumination.
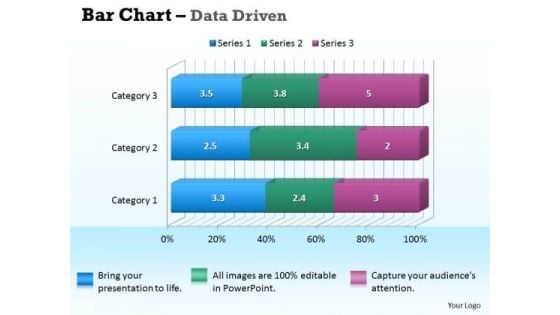
Data Analysis In Excel 3d Bar Chart For Business Information PowerPoint Templates
Our data analysis in excel 3d bar chart for business information Powerpoint Templates Deliver At Your Doorstep. Let Them In For A Wonderful Experience.
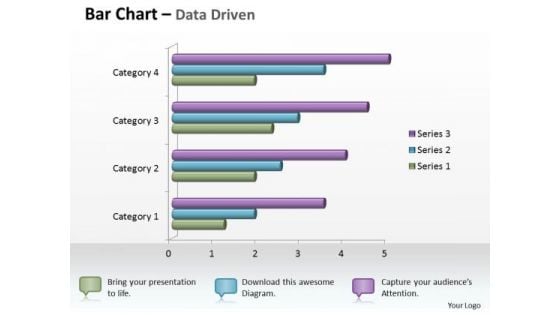
Data Analysis In Excel 3d Bar Chart For Business Statistics PowerPoint Templates
Knock On The Door To Success With Our data analysis in excel 3d bar chart for business statistics Powerpoint Templates . Be Assured Of Gaining Entry.
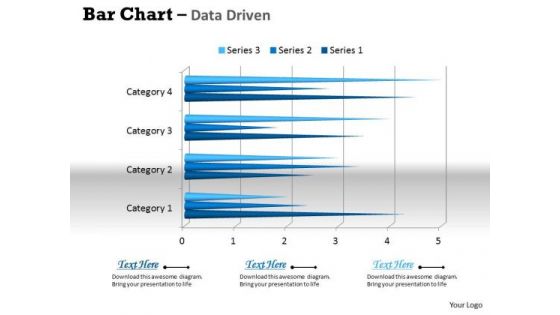
Data Analysis In Excel 3d Bar Chart For Business Trends PowerPoint Templates
Connect The Dots With Our data analysis in excel 3d bar chart for business trends Powerpoint Templates . Watch The Whole Picture Clearly Emerge.
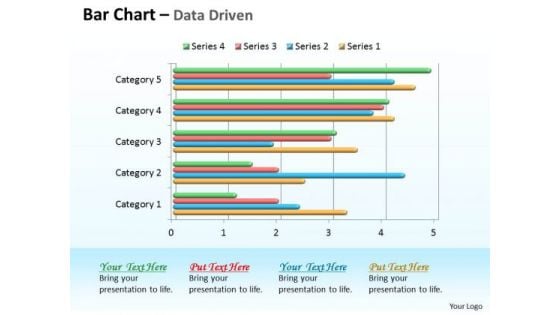
Data Analysis In Excel 3d Bar Chart For Comparison Of Time Series PowerPoint Templates
Double Your Chances With Our data analysis in excel 3d bar chart for comparison of time series Powerpoint Templates . The Value Of Your Thoughts Will Increase Two-Fold.
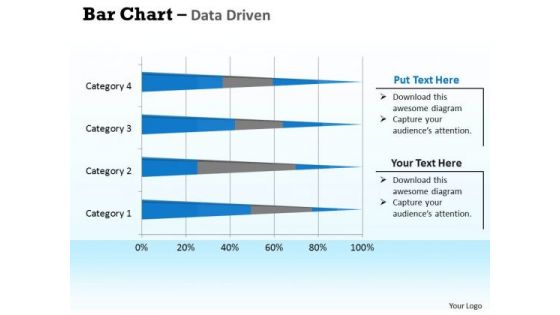
Data Analysis In Excel 3d Bar Chart For Interpretation PowerPoint Templates
Double Up Our data analysis in excel 3d bar chart for interpretation Powerpoint Templates With Your Thoughts. They Will Make An Awesome Pair.
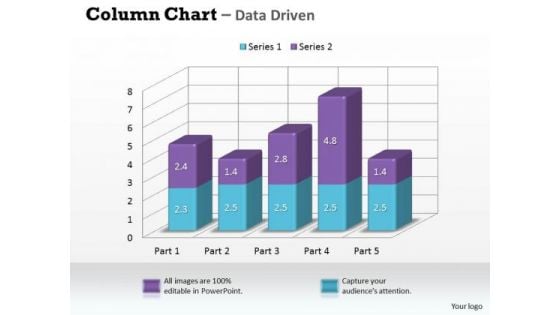
Data Analysis In Excel 3d Column Chart For Market Surveys PowerPoint Templates
Our data analysis in excel 3d column chart for market surveys Powerpoint Templates Leave No One In Doubt. Provide A Certainty To Your Views.
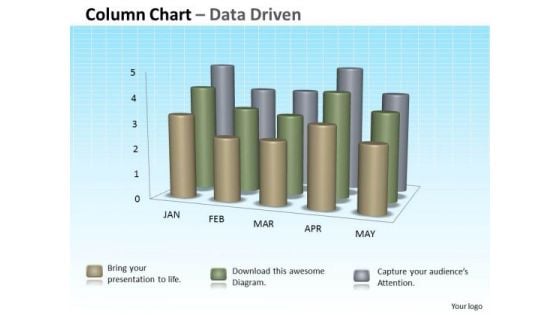
Data Analysis In Excel 3d Column Chart For Sets Of Information PowerPoint Templates
Double The Impact With Our data analysis in excel 3d column chart for sets of information Powerpoint Templates . Your Thoughts Will Have An Imposing Effect.
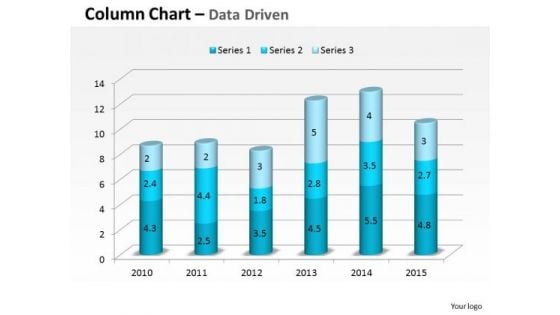
Data Analysis In Excel 3d Compare Yearly Business Performance PowerPoint Templates
Plan For All Contingencies With Our data analysis in excel 3d compare yearly business performance Powerpoint Templates . Douse The Fire Before It Catches.


 Continue with Email

 Home
Home


