Project Management Icon

Organization Branch Budget Ppt PowerPoint Presentation Complete Deck With Slides
If designing a presentation takes a lot of your time and resources and you are looking for a better alternative, then this Organization Branch Budget Ppt PowerPoint Presentation Complete Deck With Slides is the right fit for you. This is a prefabricated set that can help you deliver a great presentation on the topic. All the twelve slides included in this sample template can be used to present a birds-eye view of the topic. These slides are also fully editable, giving you enough freedom to add specific details to make this layout more suited to your business setting. Apart from the content, all other elements like color, design, theme are also replaceable and editable. This helps in designing a variety of presentations with a single layout. Not only this, you can use this PPT design in formats like PDF, PNG, and JPG once downloaded. Therefore, without any further ado, download and utilize this sample presentation as per your liking.
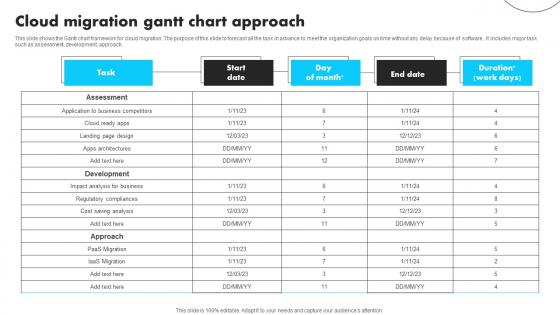
Cloud Migration Gantt Chart Approach Graphics Pdf
This slide shows the Gantt chart framework for cloud migration. The purpose of this slide to forecast all the task in advance to meet the organization goals on time without any delay because of software . It includes major task such as assessment, development, approach. Showcasing this set of slides titled Cloud Migration Gantt Chart Approach Graphics Pdf The topics addressed in these templates are Assessment, Development, Approach All the content presented in this PPT design is completely editable. Download it and make adjustments in color, background, font etc. as per your unique business setting. This slide shows the Gantt chart framework for cloud migration. The purpose of this slide to forecast all the task in advance to meet the organization goals on time without any delay because of software . It includes major task such as assessment, development, approach.
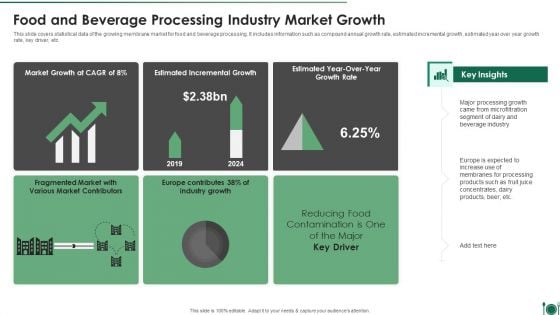
Food And Beverage Processing Industry Market Growth Themes PDF
This slide covers statistical data of the growing membrane market for food and beverage processing. It includes information such as compound annual growth rate, estimated incremental growth, estimated year over year growth rate, key driver, etc. Showcasing this set of slides titled Food And Beverage Processing Industry Market Growth Themes PDF. The topics addressed in these templates are Market Growth, Estimated Incremental Growth, Growth Rate. All the content presented in this PPT design is completely editable. Download it and make adjustments in color, background, font etc. as per your unique business setting.
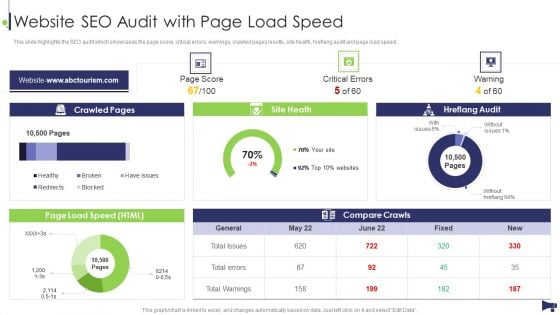
Website And Social Media Website SEO Audit With Page Load Speed Ideas PDF
This slide highlights the SEO audit which showcases the page score, critical errors, warnings, crawled pages results, site health, hreflang audit and page load speed. Deliver an awe inspiring pitch with this creative Website And Social Media Website SEO Audit With Page Load Speed Ideas PDF bundle. Topics like Crawled Pages, Site Heath, Hreflang Audit can be discussed with this completely editable template. It is available for immediate download depending on the needs and requirements of the user.
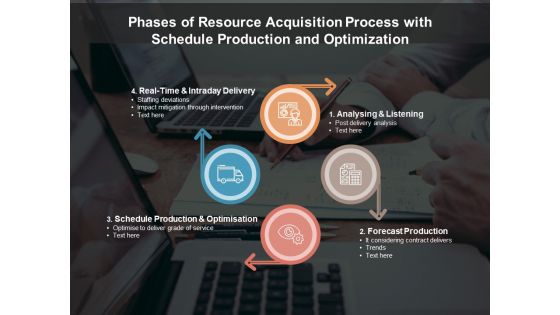
Phases Of Resource Acquisition Process With Schedule Production And Optimization Ppt PowerPoint Presentation Gallery Example File PDF
Presenting this set of slides with name phases of resource acquisition process with schedule production and optimization ppt powerpoint presentation gallery example file pdf. This is a four stage process. The stages in this process are real time and intraday delivery, analysing and listening, schedule production and optimisation, forecast production. This is a completely editable PowerPoint presentation and is available for immediate download. Download now and impress your audience.
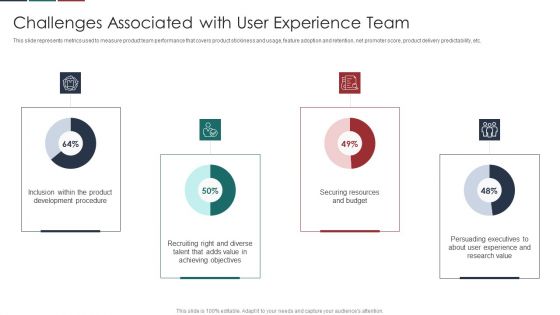
Deliver Efficiency Innovation Challenges Associated With User Experience Team Themes PDF
This slide represents metrics used to measure product team performance that covers product stickiness and usage, feature adoption and retention, net promoter score, product delivery predictability, etc. Deliver an awe inspiring pitch with this creative Deliver Efficiency Innovation Challenges Associated With User Experience Team Themes PDF bundle. Topics like Product Development Procedure, Value Achieving Objectives, Securing Resources And Budget, Experience And Research Value can be discussed with this completely editable template. It is available for immediate download depending on the needs and requirements of the user.
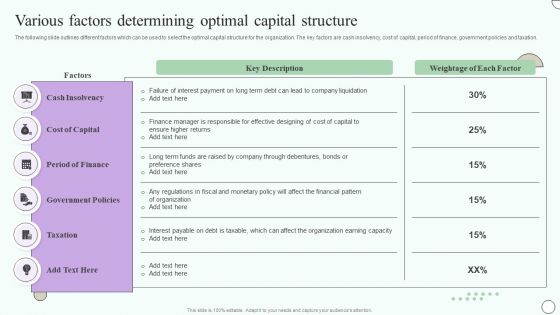
Estimating Business Overall Various Factors Determining Optimal Capital Structure Rules PDF
The following slide outlines different factors which can be used to select the optimal capital structure for the organization. The key factors are cash insolvency, cost of capital, period of finance, government policies and taxation. Retrieve professionally designed Estimating Business Overall Various Factors Determining Optimal Capital Structure Rules PDF to effectively convey your message and captivate your listeners. Save time by selecting pre-made slideshows that are appropriate for various topics, from business to educational purposes. These themes come in many different styles, from creative to corporate, and all of them are easily adjustable and can be edited quickly. Access them as PowerPoint templates or as Google Slides themes. You dont have to go on a hunt for the perfect presentation because Slidegeeks got you covered from everywhere.

Expectations After Expanding Into Global Markets Ppt PowerPoint Presentation Diagram Lists PDF
This slide showcase graph that can help organization to estimate the impact on organizational sales after global expansion. It showcases sales in thousand dollars and forecast for a period of two years.Want to ace your presentation in front of a live audience Our Expectations After Expanding Into Global Markets Ppt PowerPoint Presentation Diagram Lists PDF can help you do that by engaging all the users towards you.. Slidegeeks experts have put their efforts and expertise into creating these impeccable powerpoint presentations so that you can communicate your ideas clearly. Moreover, all the templates are customizable, and easy-to-edit and downloadable. Use these for both personal and commercial use.
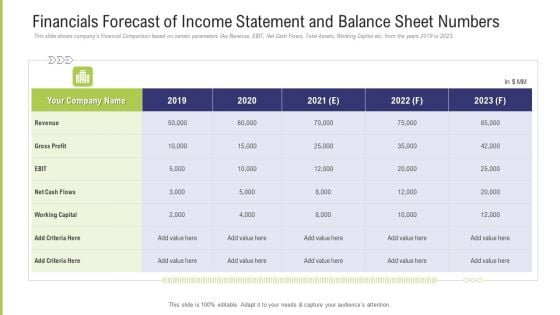
Funding Pitch Deck To Obtain Long Term Debt From Banks Financials Forecast Of Income Statement And Balance Sheet Numbers Diagrams PDF
This slide shows companys Financial Comparison based on certain parameters like Revenue, EBIT, Net Cash Flows, Total Assets, Working Capital etc. from the years 2019 to 2023. Deliver an awe inspiring pitch with this creative funding pitch deck to obtain long term debt from banks financials forecast of income statement and balance sheet numbers diagrams pdf bundle. Topics like revenue, gross profit, net cash flows, 2019 to 2023 can be discussed with this completely editable template. It is available for immediate download depending on the needs and requirements of the user.
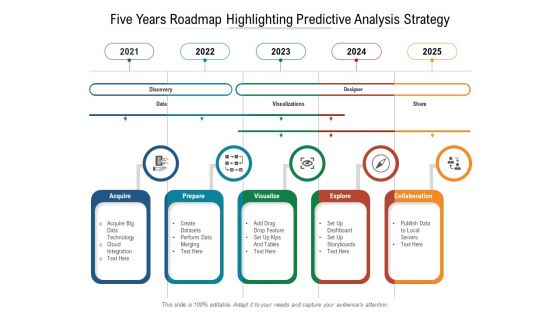
Five Years Roadmap Highlighting Predictive Analysis Strategy Pictures
We present our five years roadmap highlighting predictive analysis strategy pictures. This PowerPoint layout is easy-to-edit so you can change the font size, font type, color, and shape conveniently. In addition to this, the PowerPoint layout is Google Slides compatible, so you can share it with your audience and give them access to edit it. Therefore, download and save this well-researched five years roadmap highlighting predictive analysis strategy pictures in different formats like PDF, PNG, and JPG to smoothly execute your business plan.
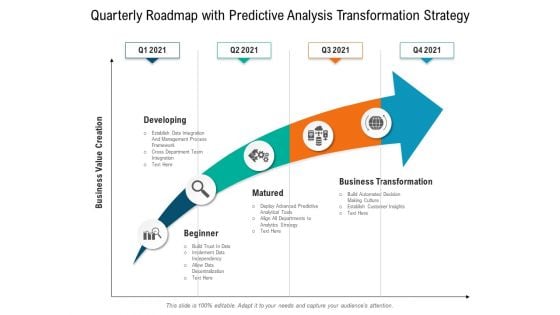
Quarterly Roadmap With Predictive Analysis Transformation Strategy Summary
We present our quarterly roadmap with predictive analysis transformation strategy summary. This PowerPoint layout is easy-to-edit so you can change the font size, font type, color, and shape conveniently. In addition to this, the PowerPoint layout is Google Slides compatible, so you can share it with your audience and give them access to edit it. Therefore, download and save this well-researched quarterly roadmap with predictive analysis transformation strategy summary in different formats like PDF, PNG, and JPG to smoothly execute your business plan.
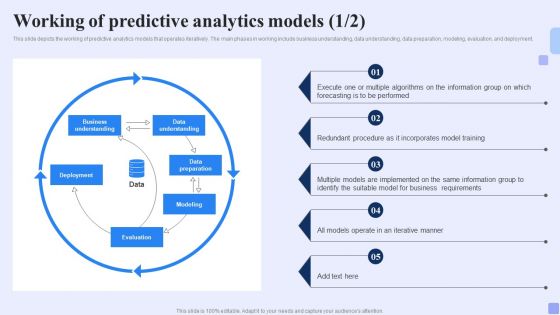
Working Of Predictive Analytics Models Forward Looking Analysis IT Elements PDF
This slide depicts the working of predictive analytics models that operates iteratively. The main phases in working include business understanding, data understanding, data preparation, modeling, evaluation, and deployment.Slidegeeks is here to make your presentations a breeze with Working Of Predictive Analytics Models Forward Looking Analysis IT Elements PDF With our easy-to-use and customizable templates, you can focus on delivering your ideas rather than worrying about formatting. With a variety of designs to choose from, you are sure to find one that suits your needs. And with animations and unique photos, illustrations, and fonts, you can make your presentation pop. So whether you are giving a sales pitch or presenting to the board, make sure to check out Slidegeeks first.
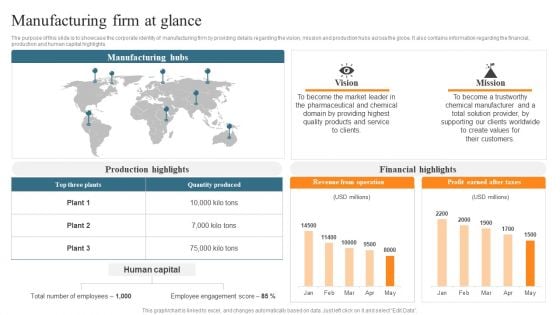
Leveraging Predictive Maintenance To Enhance Production Process Manufacturing Firm At Glance Elements PDF
The purpose of this slide is to showcase the corporate identity of manufacturing firm by providing details regarding the vision, mission and production hubs across the globe. It also contains information regarding the financial, production and human capital highlights. If you are looking for a format to display your unique thoughts, then the professionally designed Leveraging Predictive Maintenance To Enhance Production Process Manufacturing Firm At Glance Elements PDF is the one for you. You can use it as a Google Slides template or a PowerPoint template. Incorporate impressive visuals, symbols, images, and other charts. Modify or reorganize the text boxes as you desire. Experiment with shade schemes and font pairings. Alter, share or cooperate with other people on your work. Download Leveraging Predictive Maintenance To Enhance Production Process Manufacturing Firm At Glance Elements PDF and find out how to give a successful presentation. Present a perfect display to your team and make your presentation unforgettable.
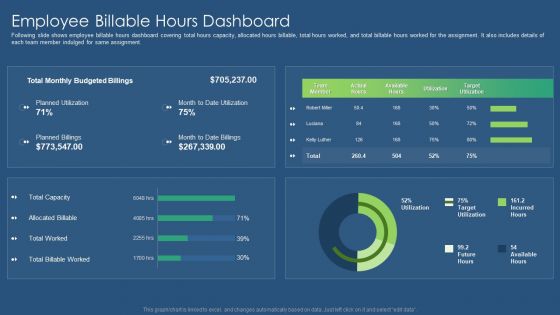
Sustainability Calculation With KPI Employee Billable Hours Dashboard Demonstration PDF Portrait PDF
Following slide shows employee billable hours dashboard covering total hours capacity, allocated hours billable, total hours worked, and total billable hours worked for the assignment. It also includes details of each team member indulged for same assignment. Deliver an awe inspiring pitch with this creative sustainability calculation with kpi employee billable hours dashboard demonstration pdf bundle. Topics like employee billable hours dashboard can be discussed with this completely editable template. It is available for immediate download depending on the needs and requirements of the user.
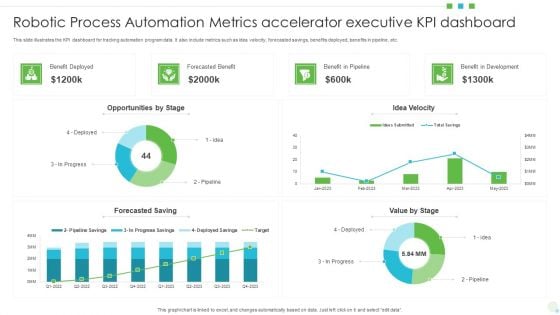
Robotic Process Automation Metrics Accelerator Executive KPI Dashboard Formats PDF
This slide illustrates the KPI dashboard for tracking automation program data. It also include metrics such as idea velocity, forecasted savings, benefits deployed, benefits in pipeline, etc. Showcasing this set of slides titled Robotic Process Automation Metrics Accelerator Executive KPI Dashboard Formats PDF. The topics addressed in these templates are Opportunities, Benefit In Development, Value. All the content presented in this PPT design is completely editable. Download it and make adjustments in color, background, font etc. as per your unique business setting.
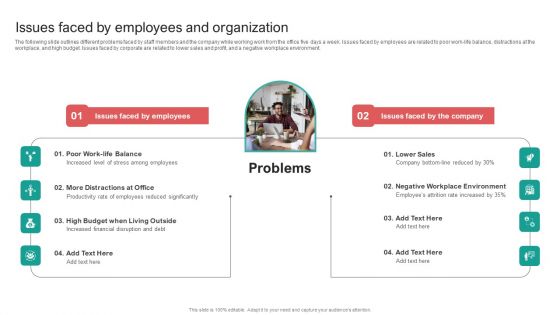
Organising Staff Flexible Job Arrangements Issues Faced By Employees And Organization Themes PDF
The following slide outlines different problems faced by staff members and the company while working work from the office five days a week. Issues faced by employees are related to poor work-life balance, distractions at the workplace, and high budget. Issues faced by corporate are related to lower sales and profit, and a negative workplace environment. Present like a pro with Organising Staff Flexible Job Arrangements Issues Faced By Employees And Organization Themes PDF Create beautiful presentations together with your team, using our easy to use presentation slides. Share your ideas in real time and make changes on the fly by downloading our templates. So whether you are in the office, on the go, or in a remote location, you can stay in sync with your team and present your ideas with confidence. With Slidegeeks presentation got a whole lot easier. Grab these presentations today.
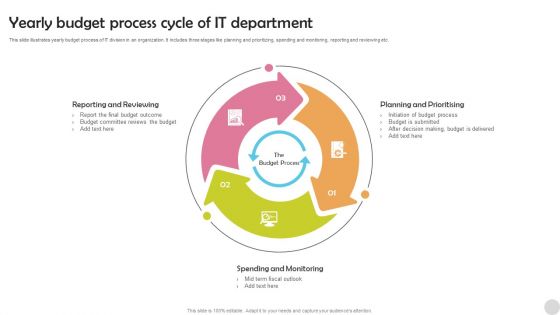
Yearly Budget Process Cycle Of IT Department Diagrams PDF
This slide illustrates yearly budget process of IT division in an organization. It includes three stages like planning and prioritizing, spending and monitoring, reporting and reviewing etc. Persuade your audience using this Yearly Budget Process Cycle Of IT Department Diagrams PDF. This PPT design covers three stages, thus making it a great tool to use. It also caters to a variety of topics including Reporting And Reviewing, Planning And Prioritising, Spending And Monitoring. Download this PPT design now to present a convincing pitch that not only emphasizes the topic but also showcases your presentation skills.
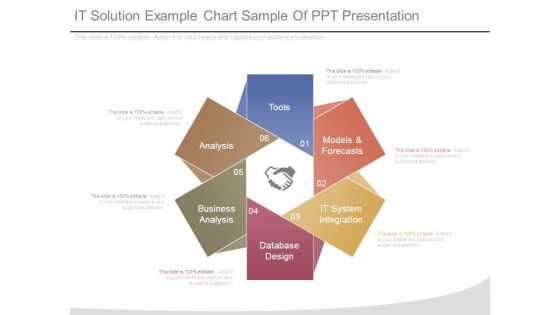
It Solution Example Chart Sample Of Ppt Presentation
This is a it solution example chart sample of ppt presentation. This is a six stage process. The stages in this process are tools, models and forecasts, it system integration, database design, business analysis, analysis.
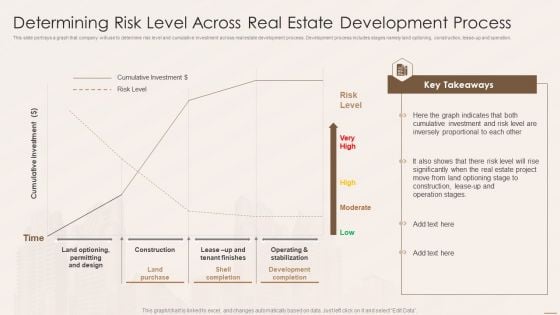
Real Estate Developers Funding Alternatives Determining Risk Level Across Real Estate Development Process Sample PDF
This slide portrays a graph that company will use to determine risk level and cumulative investment across real estate development process. Development process includes stages namely land optioning, construction, lease up and operation. Presenting Real Estate Developers Funding Alternatives Determining Risk Level Across Real Estate Development Process Sample PDF to provide visual cues and insights. Share and navigate important information on two stages that need your due attention. This template can be used to pitch topics like Cumulative Investment, Land Purchase, Development Completion. In addtion, this PPT design contains high resolution images, graphics, etc, that are easily editable and available for immediate download.
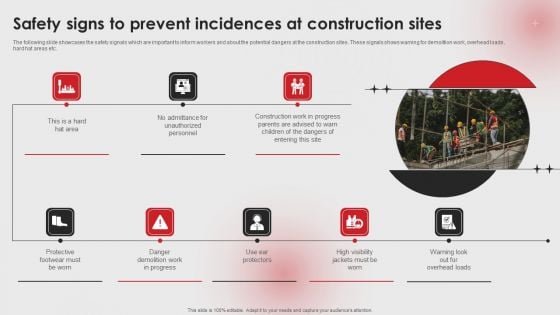
Safety Signs To Prevent Incidences At Construction Sites Ppt PowerPoint Presentation Diagram PDF
The following slide showcases the safety signals which are important to inform workers and about the potential dangers at the construction sites. These signals shows warning for demolition work, overhead loads, Protective footwear, Danger demolition work, unauthorized personnelhard hat areas etc. Slidegeeks is here to make your presentations a breeze with Safety Signs To Prevent Incidences At Construction Sites Ppt PowerPoint Presentation Diagram PDF With our easy to use and customizable templates, you can focus on delivering your ideas rather than worrying about formatting. With a variety of designs to choose from, you are sure to find one that suits your needs. And with animations and unique photos, illustrations, and fonts, you can make your presentation pop. So whether you are giving a sales pitch or presenting to the board, make sure to check out Slidegeeks first.
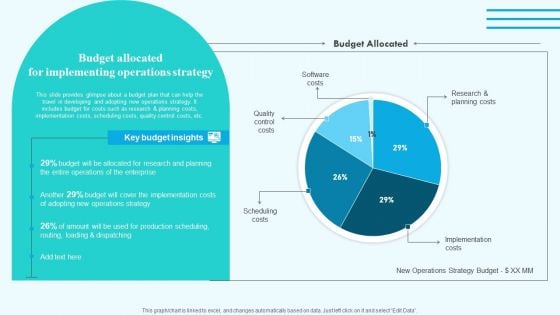
Budget Allocated For Implementing Operations Strategy Graphics PDF
This slide provides glimpse about a budget plan that can help the travel in developing and adopting new operations strategy. It includes budget for costs such as research and planning costs, implementation costs, scheduling costs, quality control costs, etc. If you are looking for a format to display your unique thoughts, then the professionally designed Budget Allocated For Implementing Operations Strategy Graphics PDF is the one for you. You can use it as a Google Slides template or a PowerPoint template. Incorporate impressive visuals, symbols, images, and other charts. Modify or reorganize the text boxes as you desire. Experiment with shade schemes and font pairings. Alter, share or cooperate with other people on your work. Download Budget Allocated For Implementing Operations Strategy Graphics PDF and find out how to give a successful presentation. Present a perfect display to your team and make your presentation unforgettable.
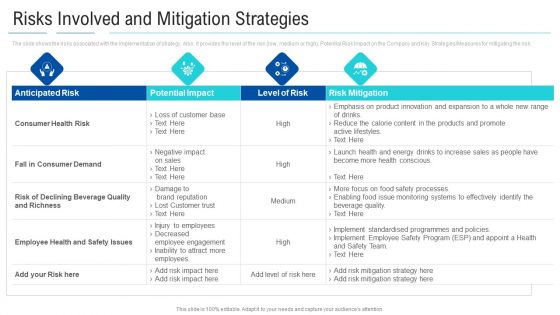
Soft Drink Firm Revamping Business To Healthy Drinks Risks Involved And Mitigation Strategies Themes PDF
The slide shows the risks associated with the implementation of strategy. Also, it provides the level of the risk low, medium or high, Potential Risk Impact on the Company and Key Strategies or Measures for mitigating the risk. Deliver an awe-inspiring pitch with this creative soft drink firm revamping business to healthy drinks risks involved and mitigation strategies themes pdf. bundle. Topics like potential impact, anticipated risk, risk mitigation, level of risk can be discussed with this completely editable template. It is available for immediate download depending on the needs and requirements of the user.
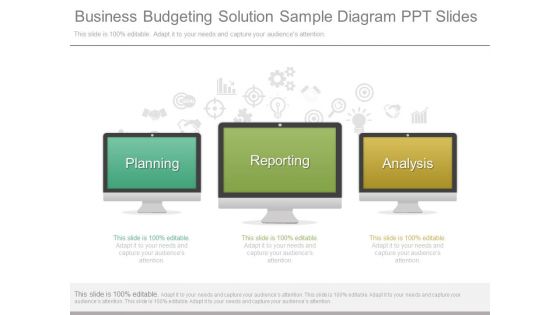
Business Budgeting Solution Sample Diagram Ppt Slides
This is a business budgeting solution sample diagram ppt slides. This is a three stage process. The stages in this process are planning, reporting, analysis.
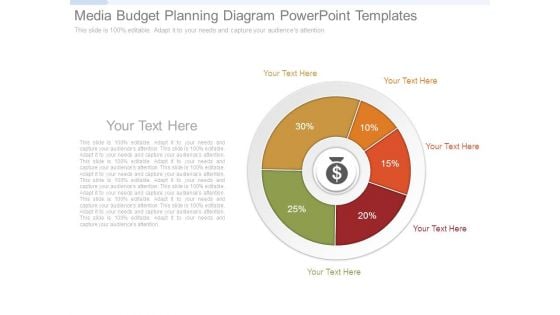
Media Budget Planning Diagram Powerpoint Templates
This is a media budget planning diagram powerpoint templates. This is a six stage process. The stages in this process are growth, business, marketing, percentage.
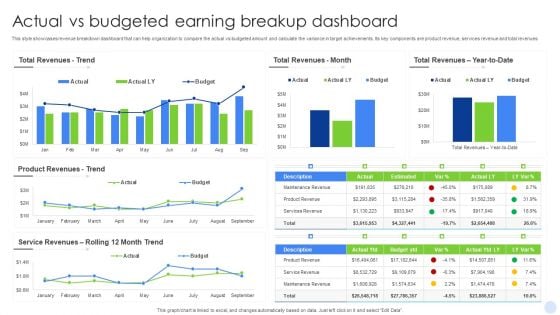
Actual Vs Budgeted Earning Breakup Dashboard Inspiration PDF
This style showcases revenue breakdown dashboard that can help organization to compare the actual vs budgeted amount and calculate the variance in target achievements. Its key components are product revenue, services revenue and total revenues. Showcasing this set of slides titled Actual Vs Budgeted Earning Breakup Dashboard Inspiration PDF. The topics addressed in these templates are Actual Vs Budgeted, Earning Breakup Dashboard. All the content presented in this PPT design is completely editable. Download it and make adjustments in color, background, font etc. as per your unique business setting.
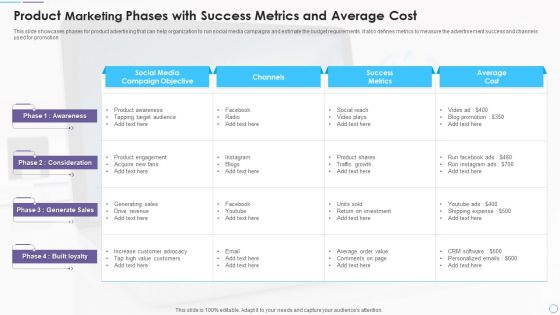
Product Marketing Phases With Success Metrics And Average Cost Structure PDF
This slide showcases phases for product advertising that can help organization to run social media campaigns and estimate the budget requirements. It also defines metrics to measure the advertisement success and channels used for promotion. Pitch your topic with ease and precision using this Product Marketing Phases With Success Metrics And Average Cost Structure PDF. This layout presents information on Awareness, Consideration, Generate Sales, Built loyalty. It is also available for immediate download and adjustment. So, changes can be made in the color, design, graphics or any other component to create a unique layout.
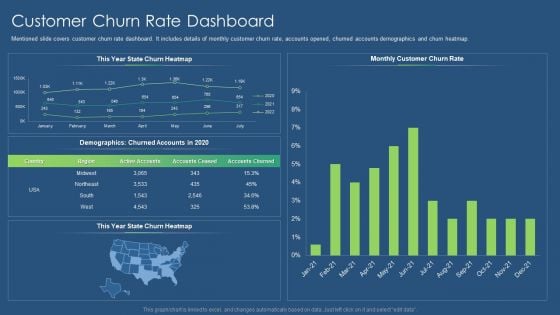
Sustainability Calculation With KPI Customer Churn Rate Dashboard Mockup PDF Mockup PDF
Mentioned slide covers cash flow dashboard. It shows detailed cash flow status in a 12 months format and working capital with accounts receivable and payable details. Deliver and pitch your topic in the best possible manner with this sustainability calculation with kpi cash flow dashboard liquidity ratio inspiration pdf. Use them to share invaluable insights on cash flow dashboard and impress your audience. This template can be altered and modified as per your expectations. So, grab it now.
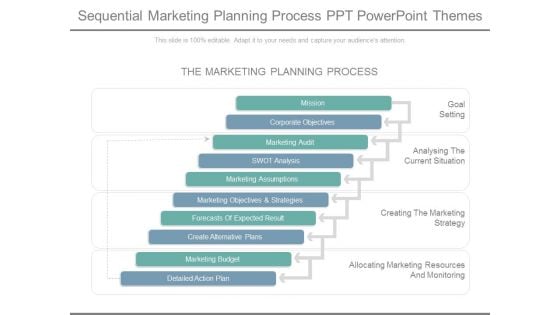
Sequential Marketing Planning Process Ppt Powerpoint Themes
This is a sequential marketing planning process ppt powerpoint themes. This is a ten stage process. The stages in this process are the marketing planning process, mission , corporate objectives , marketing audit, marketing assumptions , marketing objectives and strategies , forecasts of expected result.
AI And ML Driving Monetary Value For Organization Customer Engagement Tracking Kpi Dashboard Pictures PDF
This slide displays customer engagement dashboard. It include key performance indicators namely median lifetime spend. Average churn risk, brand affinities and highly engaged customers. Deliver an awe inspiring pitch with this creative ai and ml driving monetary value for organization customer engagement tracking kpi dashboard pictures pdf bundle. Topics like high earners, high engaged customers, return customers, brand affinities, interests can be discussed with this completely editable template. It is available for immediate download depending on the needs and requirements of the user.
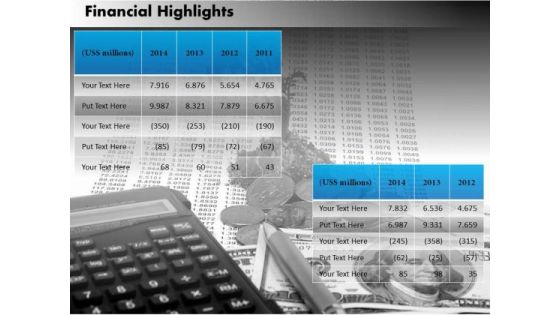
Business Diagram Business Equipments For Financial Calculation Mba Models And Frameworks
Document The Process On Our Business Diagram Business Equipments For Financial Calculation MBA Models And Frameworks Powerpoint Templates. Make A Record Of Every Detail. Satiate Desires With Our Business Diagram Business Equipments For Financial Calculation MBA Models And Frameworks Powerpoint Templates. Give Them All They Want And More.
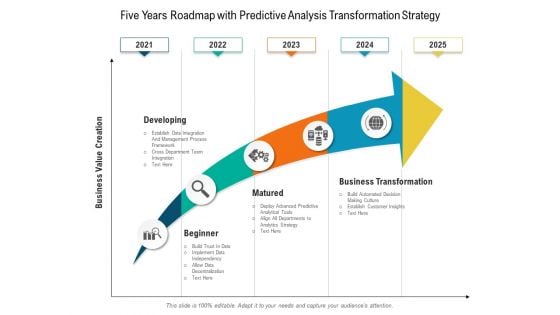
Five Years Roadmap With Predictive Analysis Transformation Strategy Formats
Presenting our innovatively-structured five years roadmap with predictive analysis transformation strategy formats Template. Showcase your roadmap process in different formats like PDF, PNG, and JPG by clicking the download button below. This PPT design is available in both Standard Screen and Widescreen aspect ratios. It can also be easily personalized and presented with modified font size, font type, color, and shapes to measure your progress in a clear way.
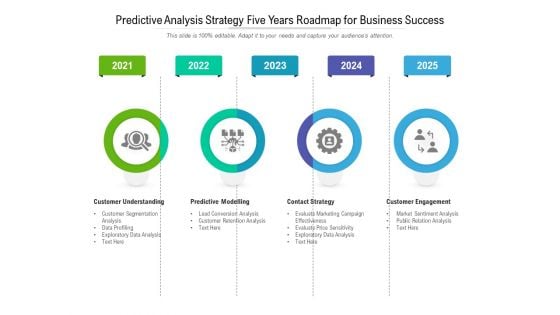
Predictive Analysis Strategy Five Years Roadmap For Business Success Rules
Presenting our jaw-dropping predictive analysis strategy five years roadmap for business success rules. You can alternate the color, font size, font type, and shapes of this PPT layout according to your strategic process. This PPT presentation is compatible with Google Slides and is available in both standard screen and widescreen aspect ratios. You can also download this well-researched PowerPoint template design in different formats like PDF, JPG, and PNG. So utilize this visually-appealing design by clicking the download button given below.
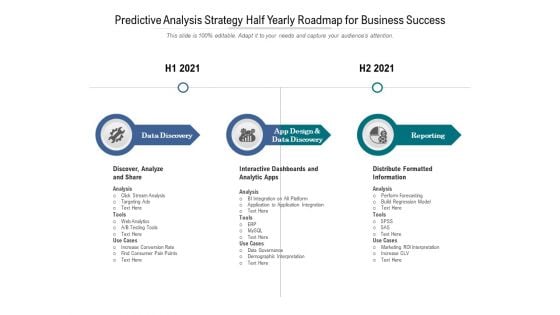
Predictive Analysis Strategy Half Yearly Roadmap For Business Success Microsoft
Presenting our innovatively-structured predictive analysis strategy half yearly roadmap for business success microsoft Template. Showcase your roadmap process in different formats like PDF, PNG, and JPG by clicking the download button below. This PPT design is available in both Standard Screen and Widescreen aspect ratios. It can also be easily personalized and presented with modified font size, font type, color, and shapes to measure your progress in a clear way.
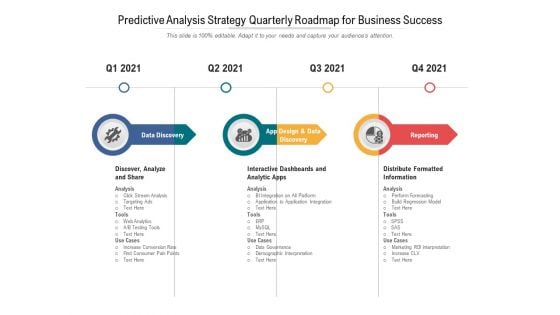
Predictive Analysis Strategy Quarterly Roadmap For Business Success Inspiration
Presenting our jaw-dropping predictive analysis strategy quarterly roadmap for business success inspiration. You can alternate the color, font size, font type, and shapes of this PPT layout according to your strategic process. This PPT presentation is compatible with Google Slides and is available in both standard screen and widescreen aspect ratios. You can also download this well-researched PowerPoint template design in different formats like PDF, JPG, and PNG. So utilize this visually-appealing design by clicking the download button given below.
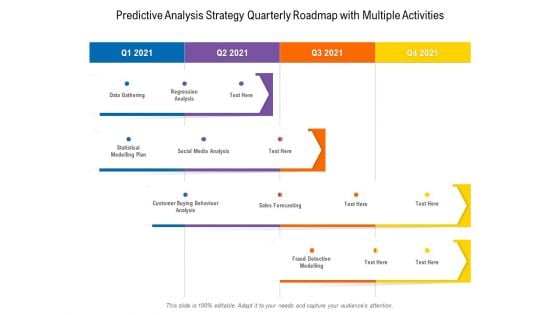
Predictive Analysis Strategy Quarterly Roadmap With Multiple Activities Clipart
Presenting our innovatively-structured predictive analysis strategy quarterly roadmap with multiple activities clipart Template. Showcase your roadmap process in different formats like PDF, PNG, and JPG by clicking the download button below. This PPT design is available in both Standard Screen and Widescreen aspect ratios. It can also be easily personalized and presented with modified font size, font type, color, and shapes to measure your progress in a clear way.
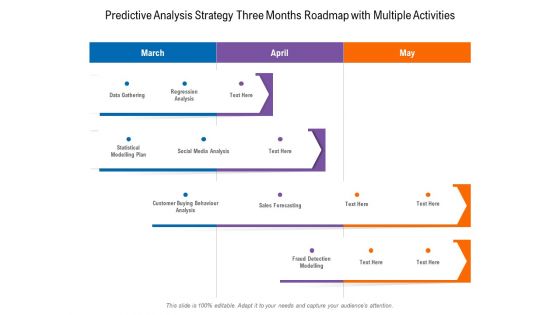
Predictive Analysis Strategy Three Months Roadmap With Multiple Activities Template
Presenting our innovatively-structured predictive analysis strategy three months roadmap with multiple activities template Template. Showcase your roadmap process in different formats like PDF, PNG, and JPG by clicking the download button below. This PPT design is available in both Standard Screen and Widescreen aspect ratios. It can also be easily personalized and presented with modified font size, font type, color, and shapes to measure your progress in a clear way.
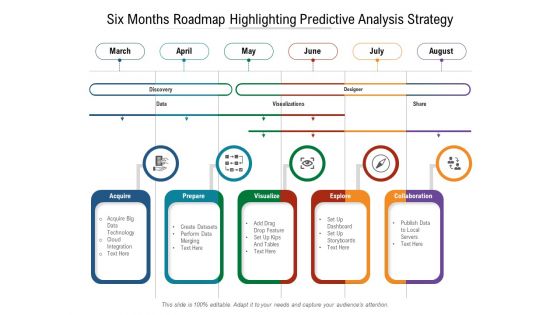
Six Months Roadmap Highlighting Predictive Analysis Strategy Brochure
Presenting our innovatively-structured six months roadmap highlighting predictive analysis strategy brochure Template. Showcase your roadmap process in different formats like PDF, PNG, and JPG by clicking the download button below. This PPT design is available in both Standard Screen and Widescreen aspect ratios. It can also be easily personalized and presented with modified font size, font type, color, and shapes to measure your progress in a clear way.
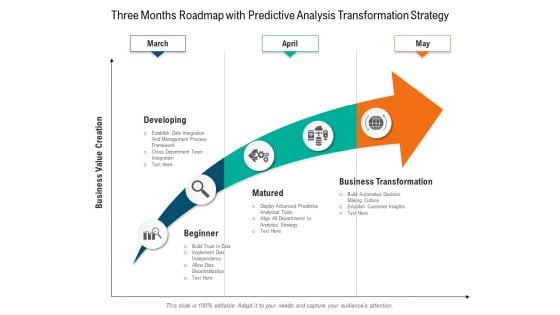
Three Months Roadmap With Predictive Analysis Transformation Strategy Infographics
Presenting our jaw-dropping three months roadmap with predictive analysis transformation strategy infographics. You can alternate the color, font size, font type, and shapes of this PPT layout according to your strategic process. This PPT presentation is compatible with Google Slides and is available in both standard screen and widescreen aspect ratios. You can also download this well-researched PowerPoint template design in different formats like PDF, JPG, and PNG. So utilize this visually-appealing design by clicking the download button given below.
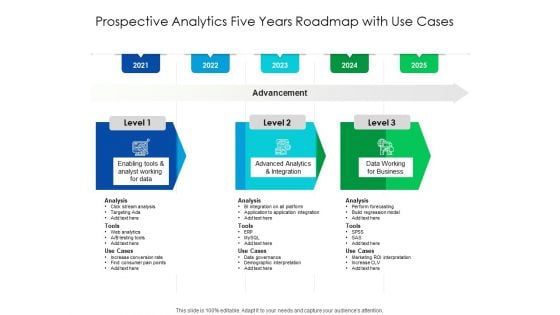
Predictive Analytics Five Years Roadmap With Use Cases Topics
Presenting our jaw dropping predictive analytics five years roadmap with use cases topics. You can alternate the color, font size, font type, and shapes of this PPT layout according to your strategic process. This PPT presentation is compatible with Google Slides and is available in both standard screen and widescreen aspect ratios. You can also download this well researched PowerPoint template design in different formats like PDF, JPG, and PNG. So utilize this visually appealing design by clicking the download button given below.
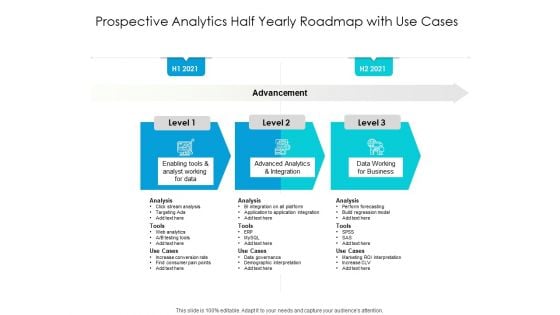
Predictive Analytics Half Yearly Roadmap With Use Cases Portrait
Presenting our jaw dropping predictive analytics half yearly roadmap with use cases portrait. You can alternate the color, font size, font type, and shapes of this PPT layout according to your strategic process. This PPT presentation is compatible with Google Slides and is available in both standard screen and widescreen aspect ratios. You can also download this well researched PowerPoint template design in different formats like PDF, JPG, and PNG. So utilize this visually appealing design by clicking the download button given below.
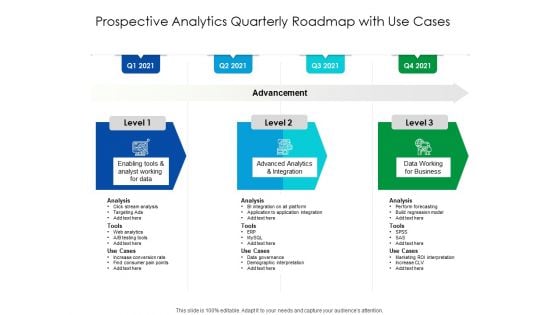
Predictive Analytics Quarterly Roadmap With Use Cases Designs
Presenting our jaw dropping predictive analytics quarterly roadmap with use cases designs. You can alternate the color, font size, font type, and shapes of this PPT layout according to your strategic process. This PPT presentation is compatible with Google Slides and is available in both standard screen and widescreen aspect ratios. You can also download this well researched PowerPoint template design in different formats like PDF, JPG, and PNG. So utilize this visually appealing design by clicking the download button given below.

Predictive Analytics Three Months Roadmap With Use Cases Background
Presenting our jaw dropping predictive analytics three months roadmap with use cases background. You can alternate the color, font size, font type, and shapes of this PPT layout according to your strategic process. This PPT presentation is compatible with Google Slides and is available in both standard screen and widescreen aspect ratios. You can also download this well researched PowerPoint template design in different formats like PDF, JPG, and PNG. So utilize this visually appealing design by clicking the download button given below.

Predictive Analysis Strategy Five Years Roadmap With Multiple Activities Introduction
We present our predictive analysis strategy five years roadmap with multiple activities introduction. This PowerPoint layout is easy-to-edit so you can change the font size, font type, color, and shape conveniently. In addition to this, the PowerPoint layout is Google Slides compatible, so you can share it with your audience and give them access to edit it. Therefore, download and save this well-researched predictive analysis strategy five years roadmap with multiple activities introduction in different formats like PDF, PNG, and JPG to smoothly execute your business plan.
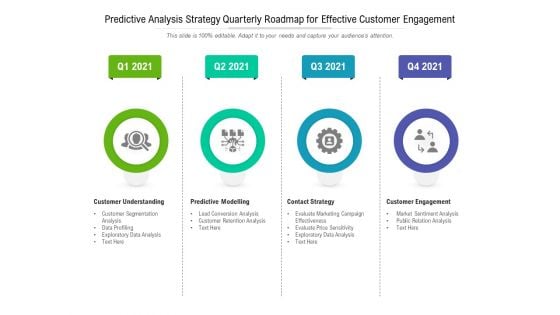
Predictive Analysis Strategy Quarterly Roadmap For Effective Customer Engagement Rules
We present our predictive analysis strategy quarterly roadmap for effective customer engagement rules. This PowerPoint layout is easy-to-edit so you can change the font size, font type, color, and shape conveniently. In addition to this, the PowerPoint layout is Google Slides compatible, so you can share it with your audience and give them access to edit it. Therefore, download and save this well-researched predictive analysis strategy quarterly roadmap for effective customer engagement rules in different formats like PDF, PNG, and JPG to smoothly execute your business plan.
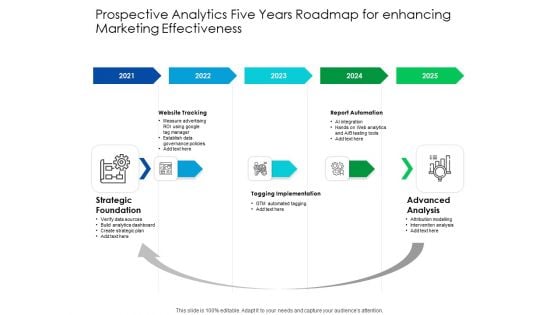
Predictive Analytics Five Years Roadmap For Enhancing Marketing Effectiveness Formats
We present our predictive analytics five years roadmap for enhancing marketing effectiveness formats. This PowerPoint layout is easy to edit so you can change the font size, font type, color, and shape conveniently. In addition to this, the PowerPoint layout is Google Slides compatible, so you can share it with your audience and give them access to edit it. Therefore, download and save this well researched predictive analytics five years roadmap for enhancing marketing effectiveness formats in different formats like PDF, PNG, and JPG to smoothly execute your business plan.
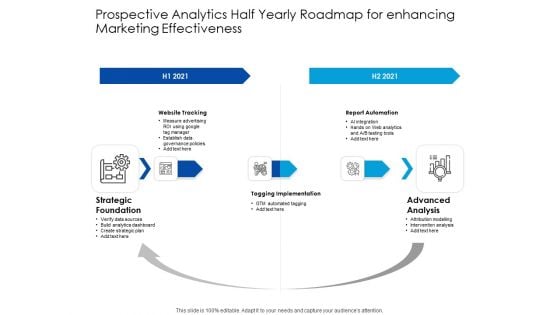
Predictive Analytics Half Yearly Roadmap For Enhancing Marketing Effectiveness Pictures
We present our predictive analytics half yearly roadmap for enhancing marketing effectiveness pictures. This PowerPoint layout is easy to edit so you can change the font size, font type, color, and shape conveniently. In addition to this, the PowerPoint layout is Google Slides compatible, so you can share it with your audience and give them access to edit it. Therefore, download and save this well researched predictive analytics half yearly roadmap for enhancing marketing effectiveness pictures in different formats like PDF, PNG, and JPG to smoothly execute your business plan.
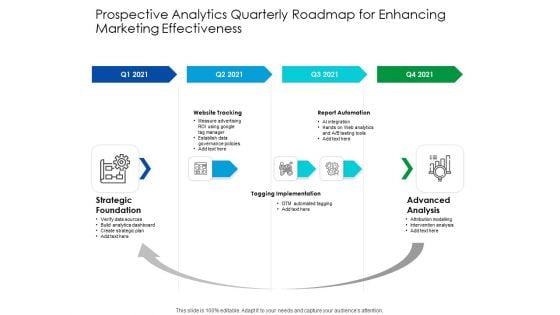
Predictive Analytics Quarterly Roadmap For Enhancing Marketing Effectiveness Inspiration
We present our predictive analytics quarterly roadmap for enhancing marketing effectiveness inspiration. This PowerPoint layout is easy to edit so you can change the font size, font type, color, and shape conveniently. In addition to this, the PowerPoint layout is Google Slides compatible, so you can share it with your audience and give them access to edit it. Therefore, download and save this well researched predictive analytics quarterly roadmap for enhancing marketing effectiveness inspiration in different formats like PDF, PNG, and JPG to smoothly execute your business plan.
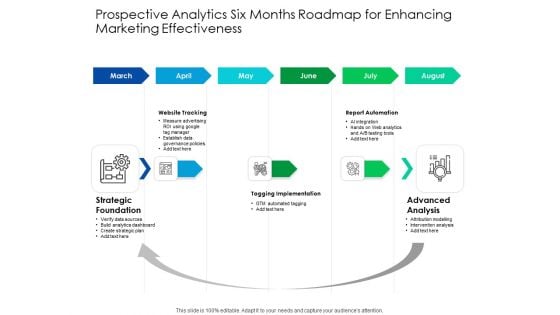
Predictive Analytics Six Months Roadmap For Enhancing Marketing Effectiveness Graphics
We present our predictive analytics six months roadmap for enhancing marketing effectiveness graphics. This PowerPoint layout is easy to edit so you can change the font size, font type, color, and shape conveniently. In addition to this, the PowerPoint layout is Google Slides compatible, so you can share it with your audience and give them access to edit it. Therefore, download and save this well researched predictive analytics six months roadmap for enhancing marketing effectiveness graphics in different formats like PDF, PNG, and JPG to smoothly execute your business plan.
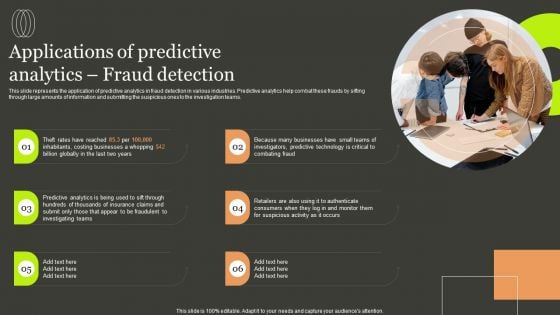
Predictive Analytics Methods Applications Of Predictive Analytics Fraud Detection Designs PDF
This slide represents the application of predictive analytics in fraud detection in various industries. Predictive analytics help combat these frauds by sifting through large amounts of information and submitting the suspicious ones to the investigation teams. If you are looking for a format to display your unique thoughts, then the professionally designed Predictive Analytics Methods Applications Of Predictive Analytics Fraud Detection Designs PDF is the one for you. You can use it as a Google Slides template or a PowerPoint template. Incorporate impressive visuals, symbols, images, and other charts. Modify or reorganize the text boxes as you desire. Experiment with shade schemes and font pairings. Alter, share or cooperate with other people on your work. Download Predictive Analytics Methods Applications Of Predictive Analytics Fraud Detection Designs PDF and find out how to give a successful presentation. Present a perfect display to your team and make your presentation unforgettable.

Table Of Contents For Risk Based Methodology Process Portrait PDF
Do you know about Slidesgeeks Table Of Contents For Risk Based Methodology Process Portrait PDF These are perfect for delivering any kind od presentation. Using it, create PowerPoint presentations that communicate your ideas and engage audiences. Save time and effort by using our pre-designed presentation templates that are perfect for a wide range of topic. Our vast selection of designs covers a range of styles, from creative to business, and are all highly customizable and easy to edit. Download as a PowerPoint template or use them as Google Slides themes.
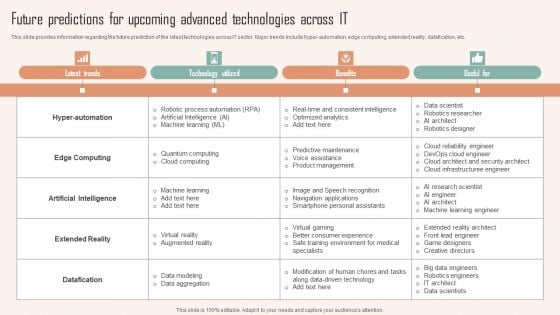
Future Predictions For Upcoming Advanced Technologies Across It Ppt PowerPoint Presentation Diagram Lists PDF
This slide provides information regarding the future prediction of the latest technologies across IT sector. Major trends include hyper-automation, edge computing, extended reality, datafication, etc. If you are looking for a format to display your unique thoughts, then the professionally designed Future Predictions For Upcoming Advanced Technologies Across It Ppt PowerPoint Presentation Diagram Lists PDF is the one for you. You can use it as a Google Slides template or a PowerPoint template. Incorporate impressive visuals, symbols, images, and other charts. Modify or reorganize the text boxes as you desire. Experiment with shade schemes and font pairings. Alter, share or cooperate with other people on your work. Download Future Predictions For Upcoming Advanced Technologies Across It Ppt PowerPoint Presentation Diagram Lists PDF and find out how to give a successful presentation. Present a perfect display to your team and make your presentation unforgettable.
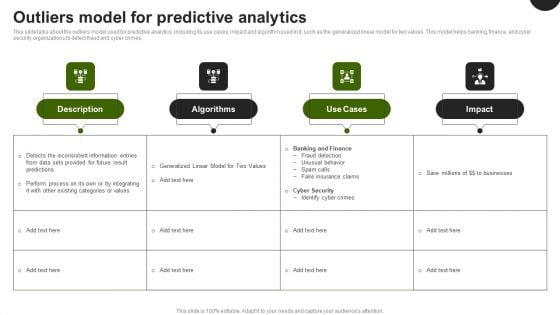
Predictive Analytics In The Age Of Big Data Outliers Model For Predictive Analytics Demonstration PDF
This slide talks about the outliers model used for predictive analytics, including its use cases, impact and algorithm used in it, such as the generalized linear model for two values. This model helps banking, finance, and cyber security organizations to detect fraud and cyber crimes. Whether you have daily or monthly meetings, a brilliant presentation is necessary. Predictive Analytics In The Age Of Big Data Outliers Model For Predictive Analytics Demonstration PDF can be your best option for delivering a presentation. Represent everything in detail using Predictive Analytics In The Age Of Big Data Outliers Model For Predictive Analytics Demonstration PDF and make yourself stand out in meetings. The template is versatile and follows a structure that will cater to your requirements. All the templates prepared by Slidegeeks are easy to download and edit. Our research experts have taken care of the corporate themes as well. So, give it a try and see the results.
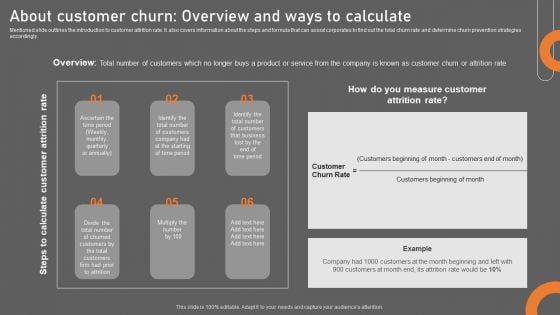
About Customer Churn Overview And Ways To Calculate Download PDF
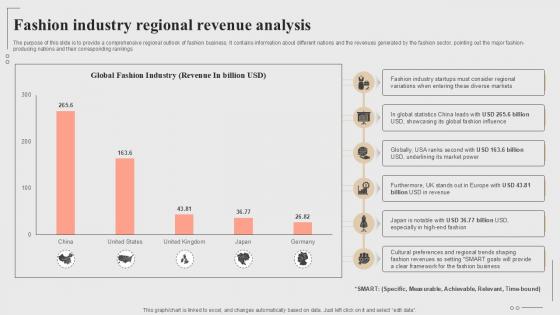
Fashion Industry Regional Revenue Analysis Fashion Startup Roadmap Plan Ppt Template BP SS V
The purpose of this slide is to provide a comprehensive regional outlook of fashion business. It contains information about different nations and the revenues generated by the fashion sector, pointing out the major fashion-producing nations and their corresponding rankings Make sure to capture your audiences attention in your business displays with our gratis customizable Fashion Industry Regional Revenue Analysis Fashion Startup Roadmap Plan Ppt Template BP SS V These are great for business strategies, office conferences, capital raising or task suggestions. If you desire to acquire more customers for your tech business and ensure they stay satisfied, create your own sales presentation with these plain slides. The purpose of this slide is to provide a comprehensive regional outlook of fashion business. It contains information about different nations and the revenues generated by the fashion sector, pointing out the major fashion-producing nations and their corresponding rankings
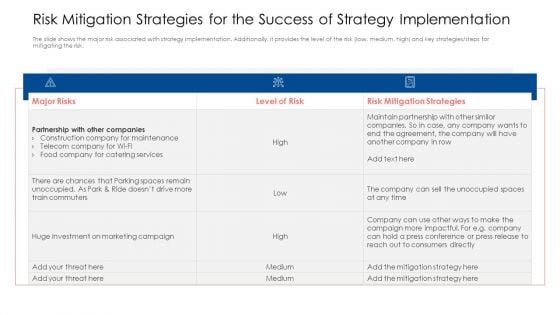
Risk Mitigation Strategies For The Success Of Strategy Implementation Themes PDF
The slide shows the major risk associated with strategy implementation. Additionally, it provides the level of the risk low, medium, high and key strategies or steps for mitigating the risk. Deliver and pitch your topic in the best possible manner with this risk mitigation strategies for the success of strategy implementation themes pdf. Use them to share invaluable insights on risk mitigation strategies, marketing campaign, mitigation strategy and impress your audience. This template can be altered and modified as per your expectations. So, grab it now.
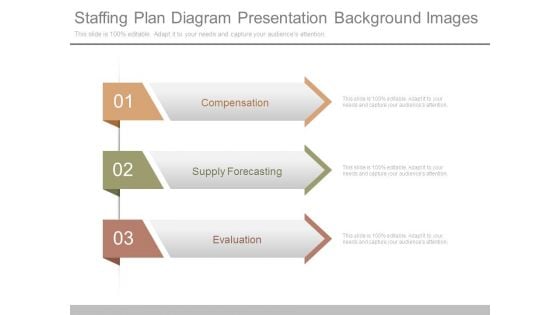
Staffing Plan Diagram Presentation Background Images
This is a staffing plan diagram presentation background images. This is a three stage process. The stages in this process are compensation, supply forecasting, evaluation.
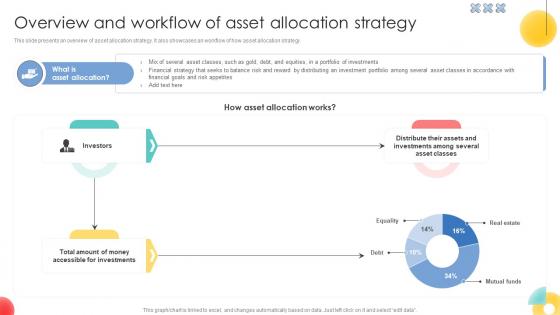
Overview And Workflow Of Asset Allocation Strategy Strategic Investment Plan For Optimizing Risk SS V
This slide presents an overview of asset allocation strategy. It also showcases an workflow of how asset allocation strategy.Do you know about Slidesgeeks Overview And Workflow Of Asset Allocation Strategy Strategic Investment Plan For Optimizing Risk SS V These are perfect for delivering any kind od presentation. Using it, create PowerPoint presentations that communicate your ideas and engage audiences. Save time and effort by using our pre-designed presentation templates that are perfect for a wide range of topic. Our vast selection of designs covers a range of styles, from creative to business, and are all highly customizable and easy to edit. Download as a PowerPoint template or use them as Google Slides themes. This slide presents an overview of asset allocation strategy. It also showcases an workflow of how asset allocation strategy.
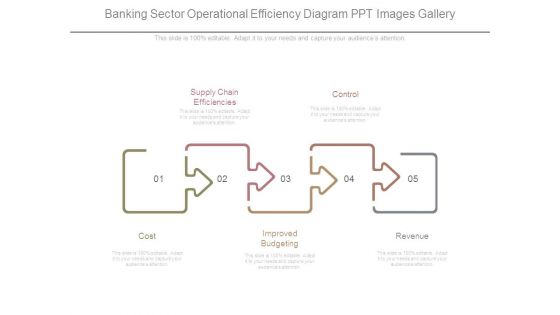
Banking Sector Operational Efficiency Diagram Ppt Images Gallery
This is a banking sector operational efficiency diagram ppt images gallery. This is a five stage process. The stages in this process are cost, supply chain efficiencies, improved budgeting, control, revenue.

Asset Mix Defining Taxable And Tax Free Allocation Strategic Investment Plan For Optimizing Risk SS V
This slide presents an asset mix for insured asset allocation strategy. It segregates assets based on four criteria no risk, low risk, high risk and moderate risk and differentiate between taxable vs. tax-free assets.There are so many reasons you need a Asset Mix Defining Taxable And Tax Free Allocation Strategic Investment Plan For Optimizing Risk SS V. The first reason is you can not spend time making everything from scratch, Thus, Slidegeeks has made presentation templates for you too. You can easily download these templates from our website easily. This slide presents an asset mix for insured asset allocation strategy. It segregates assets based on four criteria no risk, low risk, high risk and moderate risk and differentiate between taxable vs. tax-free assets.
Evaluating Current Marketing Performance Of Organization Ppt PowerPoint Presentation Diagram Templates PDF
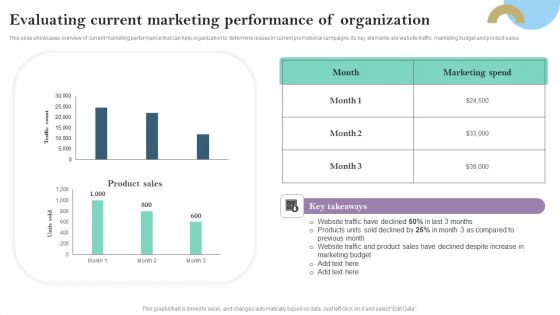
This slide showcases overview of current marketing performance that can help organization to determine issues in current promotional campaigns. Its key elements are website traffic, marketing budget and product sales Explore a selection of the finest Evaluating Current Marketing Performance Of Organization Ppt PowerPoint Presentation Diagram Templates PDF here. With a plethora of professionally designed and pre made slide templates, you can quickly and easily find the right one for your upcoming presentation. You can use our Evaluating Current Marketing Performance Of Organization Ppt PowerPoint Presentation Diagram Templates PDF to effectively convey your message to a wider audience. Slidegeeks has done a lot of research before preparing these presentation templates. The content can be personalized and the slides are highly editable. Grab templates today from Slidegeeks.


 Continue with Email

 Home
Home


