Project Management Phases

Predictive Analytics Three Months Roadmap With Use Cases Background
Presenting our jaw dropping predictive analytics three months roadmap with use cases background. You can alternate the color, font size, font type, and shapes of this PPT layout according to your strategic process. This PPT presentation is compatible with Google Slides and is available in both standard screen and widescreen aspect ratios. You can also download this well researched PowerPoint template design in different formats like PDF, JPG, and PNG. So utilize this visually appealing design by clicking the download button given below.
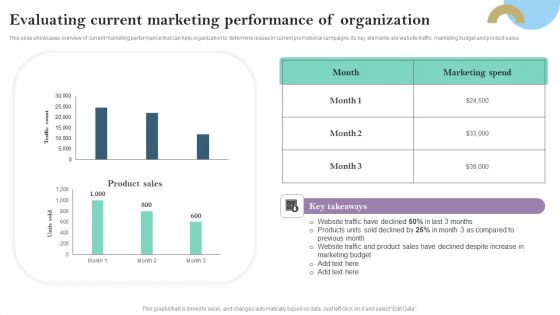
Evaluating Current Marketing Performance Of Organization Ppt PowerPoint Presentation Diagram Templates PDF
This slide showcases overview of current marketing performance that can help organization to determine issues in current promotional campaigns. Its key elements are website traffic, marketing budget and product sales Explore a selection of the finest Evaluating Current Marketing Performance Of Organization Ppt PowerPoint Presentation Diagram Templates PDF here. With a plethora of professionally designed and pre made slide templates, you can quickly and easily find the right one for your upcoming presentation. You can use our Evaluating Current Marketing Performance Of Organization Ppt PowerPoint Presentation Diagram Templates PDF to effectively convey your message to a wider audience. Slidegeeks has done a lot of research before preparing these presentation templates. The content can be personalized and the slides are highly editable. Grab templates today from Slidegeeks.
Corporate Digital Transformation Roadmap Budget Allocation For Digital Icons PDF
Purpose of the following slide is to show the budget for digital transformation as it highlights the key components of the budget along with the total amount allocated for the entire process. Deliver and pitch your topic in the best possible manner with this Corporate Digital Transformation Roadmap Budget Allocation For Digital Icons PDF Use them to share invaluable insights on Improve Security, Upgrading Network, Most Impotent Technology Investment and impress your audience. This template can be altered and modified as per your expectations. So, grab it now.

Predictive Analysis Strategy Five Years Roadmap With Multiple Activities Introduction
We present our predictive analysis strategy five years roadmap with multiple activities introduction. This PowerPoint layout is easy-to-edit so you can change the font size, font type, color, and shape conveniently. In addition to this, the PowerPoint layout is Google Slides compatible, so you can share it with your audience and give them access to edit it. Therefore, download and save this well-researched predictive analysis strategy five years roadmap with multiple activities introduction in different formats like PDF, PNG, and JPG to smoothly execute your business plan.
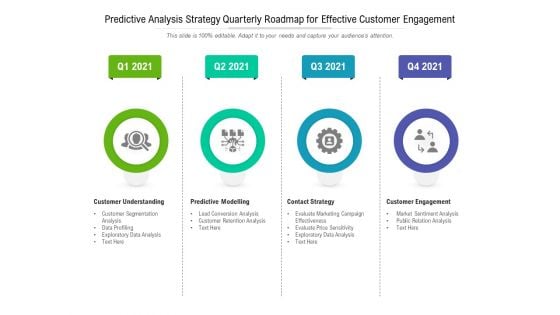
Predictive Analysis Strategy Quarterly Roadmap For Effective Customer Engagement Rules
We present our predictive analysis strategy quarterly roadmap for effective customer engagement rules. This PowerPoint layout is easy-to-edit so you can change the font size, font type, color, and shape conveniently. In addition to this, the PowerPoint layout is Google Slides compatible, so you can share it with your audience and give them access to edit it. Therefore, download and save this well-researched predictive analysis strategy quarterly roadmap for effective customer engagement rules in different formats like PDF, PNG, and JPG to smoothly execute your business plan.
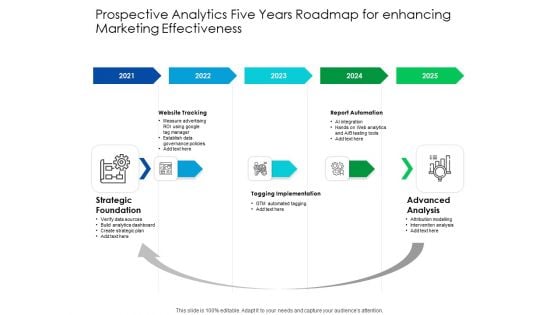
Predictive Analytics Five Years Roadmap For Enhancing Marketing Effectiveness Formats
We present our predictive analytics five years roadmap for enhancing marketing effectiveness formats. This PowerPoint layout is easy to edit so you can change the font size, font type, color, and shape conveniently. In addition to this, the PowerPoint layout is Google Slides compatible, so you can share it with your audience and give them access to edit it. Therefore, download and save this well researched predictive analytics five years roadmap for enhancing marketing effectiveness formats in different formats like PDF, PNG, and JPG to smoothly execute your business plan.
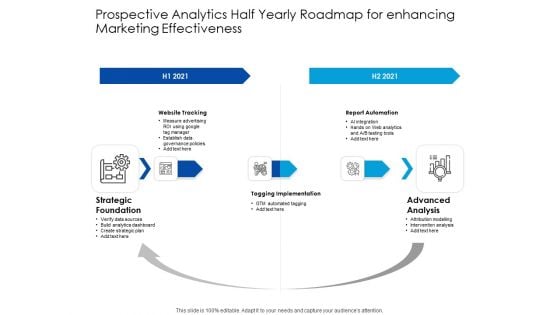
Predictive Analytics Half Yearly Roadmap For Enhancing Marketing Effectiveness Pictures
We present our predictive analytics half yearly roadmap for enhancing marketing effectiveness pictures. This PowerPoint layout is easy to edit so you can change the font size, font type, color, and shape conveniently. In addition to this, the PowerPoint layout is Google Slides compatible, so you can share it with your audience and give them access to edit it. Therefore, download and save this well researched predictive analytics half yearly roadmap for enhancing marketing effectiveness pictures in different formats like PDF, PNG, and JPG to smoothly execute your business plan.
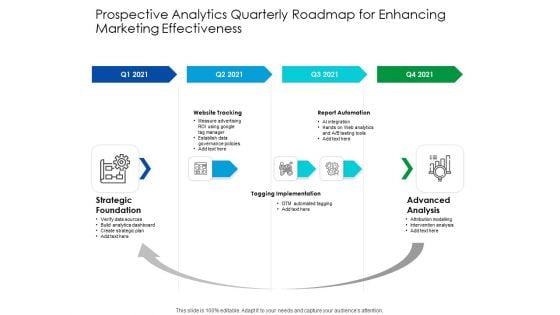
Predictive Analytics Quarterly Roadmap For Enhancing Marketing Effectiveness Inspiration
We present our predictive analytics quarterly roadmap for enhancing marketing effectiveness inspiration. This PowerPoint layout is easy to edit so you can change the font size, font type, color, and shape conveniently. In addition to this, the PowerPoint layout is Google Slides compatible, so you can share it with your audience and give them access to edit it. Therefore, download and save this well researched predictive analytics quarterly roadmap for enhancing marketing effectiveness inspiration in different formats like PDF, PNG, and JPG to smoothly execute your business plan.
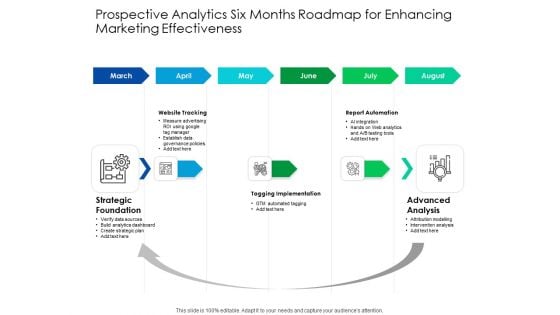
Predictive Analytics Six Months Roadmap For Enhancing Marketing Effectiveness Graphics
We present our predictive analytics six months roadmap for enhancing marketing effectiveness graphics. This PowerPoint layout is easy to edit so you can change the font size, font type, color, and shape conveniently. In addition to this, the PowerPoint layout is Google Slides compatible, so you can share it with your audience and give them access to edit it. Therefore, download and save this well researched predictive analytics six months roadmap for enhancing marketing effectiveness graphics in different formats like PDF, PNG, and JPG to smoothly execute your business plan.
CRM Administration To Reduce Churn Rate Customer Loyalty Program For Better Retention Icons PDF
This slide shows the customer loyalty program for better retention which includes customer categorization, volume of purchases, speed of payment, customer profitability, initiatives to encourage customer loyalty and budget. Crafting an eye catching presentation has never been more straightforward. Let your presentation shine with this tasteful yet straightforward CRM Administration To Reduce Churn Rate Customer Loyalty Program For Better Retention Icons PDF template. It offers a minimalistic and classy look that is great for making a statement. The colors have been employed intelligently to add a bit of playfulness while still remaining professional. Construct the ideal CRM Administration To Reduce Churn Rate Customer Loyalty Program For Better Retention Icons PDF that effortlessly grabs the attention of your audience Begin now and be certain to wow your customers.
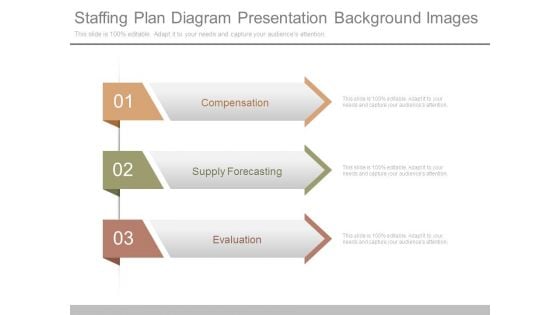
Staffing Plan Diagram Presentation Background Images
This is a staffing plan diagram presentation background images. This is a three stage process. The stages in this process are compensation, supply forecasting, evaluation.
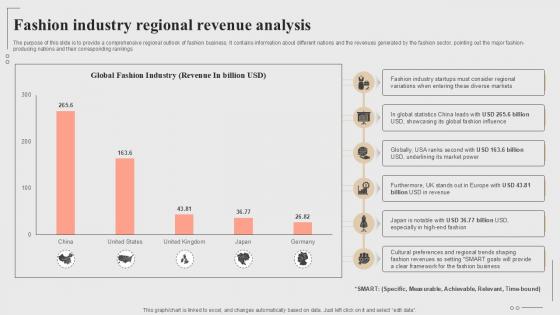
Fashion Industry Regional Revenue Analysis Fashion Startup Roadmap Plan Ppt Template BP SS V
The purpose of this slide is to provide a comprehensive regional outlook of fashion business. It contains information about different nations and the revenues generated by the fashion sector, pointing out the major fashion-producing nations and their corresponding rankings Make sure to capture your audiences attention in your business displays with our gratis customizable Fashion Industry Regional Revenue Analysis Fashion Startup Roadmap Plan Ppt Template BP SS V These are great for business strategies, office conferences, capital raising or task suggestions. If you desire to acquire more customers for your tech business and ensure they stay satisfied, create your own sales presentation with these plain slides. The purpose of this slide is to provide a comprehensive regional outlook of fashion business. It contains information about different nations and the revenues generated by the fashion sector, pointing out the major fashion-producing nations and their corresponding rankings
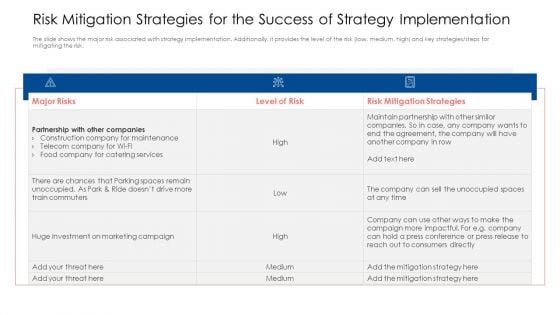
Risk Mitigation Strategies For The Success Of Strategy Implementation Themes PDF
The slide shows the major risk associated with strategy implementation. Additionally, it provides the level of the risk low, medium, high and key strategies or steps for mitigating the risk. Deliver and pitch your topic in the best possible manner with this risk mitigation strategies for the success of strategy implementation themes pdf. Use them to share invaluable insights on risk mitigation strategies, marketing campaign, mitigation strategy and impress your audience. This template can be altered and modified as per your expectations. So, grab it now.
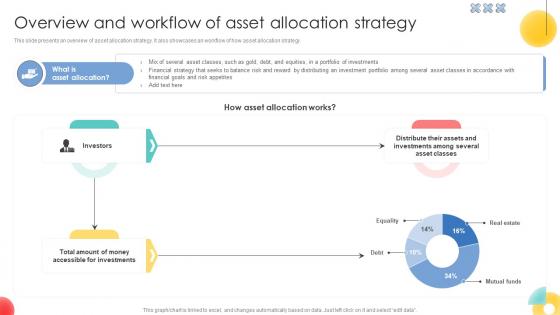
Overview And Workflow Of Asset Allocation Strategy Strategic Investment Plan For Optimizing Risk SS V
This slide presents an overview of asset allocation strategy. It also showcases an workflow of how asset allocation strategy.Do you know about Slidesgeeks Overview And Workflow Of Asset Allocation Strategy Strategic Investment Plan For Optimizing Risk SS V These are perfect for delivering any kind od presentation. Using it, create PowerPoint presentations that communicate your ideas and engage audiences. Save time and effort by using our pre-designed presentation templates that are perfect for a wide range of topic. Our vast selection of designs covers a range of styles, from creative to business, and are all highly customizable and easy to edit. Download as a PowerPoint template or use them as Google Slides themes. This slide presents an overview of asset allocation strategy. It also showcases an workflow of how asset allocation strategy.
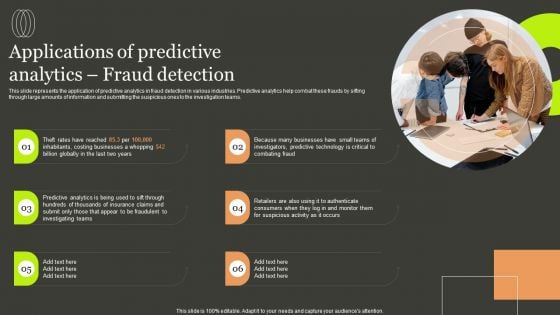
Predictive Analytics Methods Applications Of Predictive Analytics Fraud Detection Designs PDF
This slide represents the application of predictive analytics in fraud detection in various industries. Predictive analytics help combat these frauds by sifting through large amounts of information and submitting the suspicious ones to the investigation teams. If you are looking for a format to display your unique thoughts, then the professionally designed Predictive Analytics Methods Applications Of Predictive Analytics Fraud Detection Designs PDF is the one for you. You can use it as a Google Slides template or a PowerPoint template. Incorporate impressive visuals, symbols, images, and other charts. Modify or reorganize the text boxes as you desire. Experiment with shade schemes and font pairings. Alter, share or cooperate with other people on your work. Download Predictive Analytics Methods Applications Of Predictive Analytics Fraud Detection Designs PDF and find out how to give a successful presentation. Present a perfect display to your team and make your presentation unforgettable.
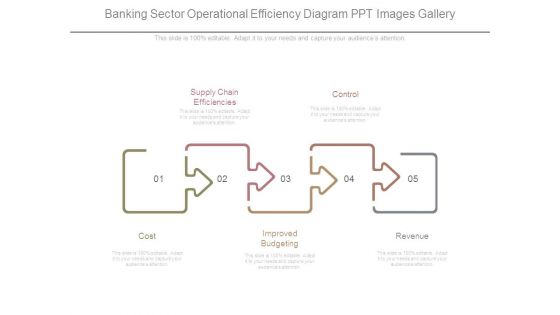
Banking Sector Operational Efficiency Diagram Ppt Images Gallery
This is a banking sector operational efficiency diagram ppt images gallery. This is a five stage process. The stages in this process are cost, supply chain efficiencies, improved budgeting, control, revenue.
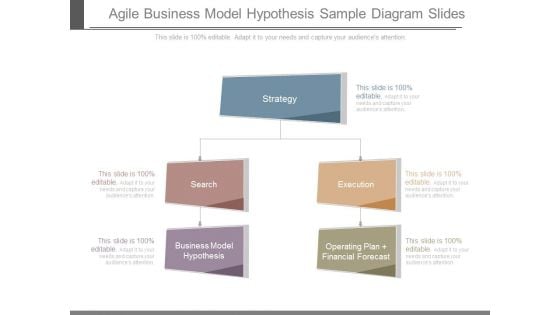
Agile Business Model Hypothesis Sample Diagram Slides
This is a agile business model hypothesis sample diagram slides. This is a three stage process. The stages in this process are strategy, search, business model hypothesis, execution, operating plan financial forecast.

Table Of Contents For Risk Based Methodology Process Portrait PDF
Do you know about Slidesgeeks Table Of Contents For Risk Based Methodology Process Portrait PDF These are perfect for delivering any kind od presentation. Using it, create PowerPoint presentations that communicate your ideas and engage audiences. Save time and effort by using our pre-designed presentation templates that are perfect for a wide range of topic. Our vast selection of designs covers a range of styles, from creative to business, and are all highly customizable and easy to edit. Download as a PowerPoint template or use them as Google Slides themes.
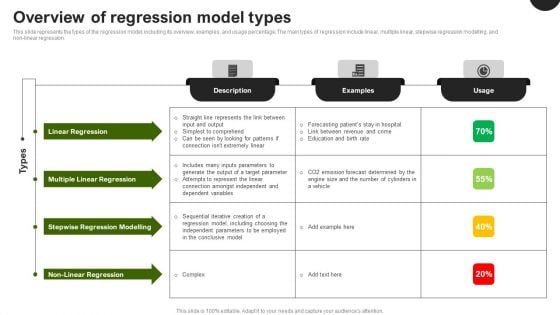
Predictive Analytics In The Age Of Big Data Overview Of Regression Model Types Diagrams PDF
This slide represents the types of the regression model, including its overview, examples, and usage percentage. The main types of regression include linear, multiple linear, stepwise regression modelling, and non-linear regression. If you are looking for a format to display your unique thoughts, then the professionally designed Predictive Analytics In The Age Of Big Data Overview Of Regression Model Types Diagrams PDF is the one for you. You can use it as a Google Slides template or a PowerPoint template. Incorporate impressive visuals, symbols, images, and other charts. Modify or reorganize the text boxes as you desire. Experiment with shade schemes and font pairings. Alter, share or cooperate with other people on your work. Download Predictive Analytics In The Age Of Big Data Overview Of Regression Model Types Diagrams PDF and find out how to give a successful presentation. Present a perfect display to your team and make your presentation unforgettable.

Asset Mix Defining Taxable And Tax Free Allocation Strategic Investment Plan For Optimizing Risk SS V
This slide presents an asset mix for insured asset allocation strategy. It segregates assets based on four criteria no risk, low risk, high risk and moderate risk and differentiate between taxable vs. tax-free assets.There are so many reasons you need a Asset Mix Defining Taxable And Tax Free Allocation Strategic Investment Plan For Optimizing Risk SS V. The first reason is you can not spend time making everything from scratch, Thus, Slidegeeks has made presentation templates for you too. You can easily download these templates from our website easily. This slide presents an asset mix for insured asset allocation strategy. It segregates assets based on four criteria no risk, low risk, high risk and moderate risk and differentiate between taxable vs. tax-free assets.
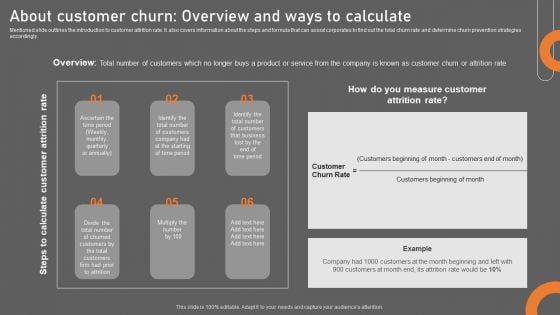
About Customer Churn Overview And Ways To Calculate Download PDF
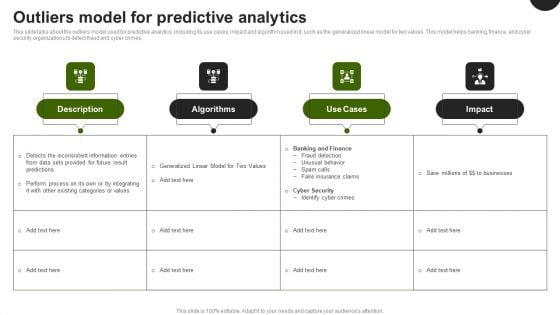
Predictive Analytics In The Age Of Big Data Outliers Model For Predictive Analytics Demonstration PDF
This slide talks about the outliers model used for predictive analytics, including its use cases, impact and algorithm used in it, such as the generalized linear model for two values. This model helps banking, finance, and cyber security organizations to detect fraud and cyber crimes. Whether you have daily or monthly meetings, a brilliant presentation is necessary. Predictive Analytics In The Age Of Big Data Outliers Model For Predictive Analytics Demonstration PDF can be your best option for delivering a presentation. Represent everything in detail using Predictive Analytics In The Age Of Big Data Outliers Model For Predictive Analytics Demonstration PDF and make yourself stand out in meetings. The template is versatile and follows a structure that will cater to your requirements. All the templates prepared by Slidegeeks are easy to download and edit. Our research experts have taken care of the corporate themes as well. So, give it a try and see the results.

Business Analyst Diagrams Man Suffering From Disaster PowerPoint Theme Slides
We present our business analyst diagrams man suffering from disaster powerpoint theme Slides.Present our Security PowerPoint Templates because you should once Tap the ingenuity of our PowerPoint Templates and Slides. They are programmed to succeed. Use our Symbol PowerPoint Templates because Our PowerPoint Templates and Slides have the Brilliant backdrops. Guaranteed to illuminate the minds of your audience. Present our Business PowerPoint Templates because It will Give impetus to the hopes of your colleagues. Our PowerPoint Templates and Slides will aid you in winning their trust. Download our Shapes PowerPoint Templates because Our PowerPoint Templates and Slides are Clear and concise. Use them and dispel any doubts your team may have. Download our People PowerPoint Templates because you should Whip up a frenzy with our PowerPoint Templates and Slides. They will fuel the excitement of your team.Use these PowerPoint slides for presentations relating to Accident, Activity, Assistance, Background, Belt, Buoy, Business, Businessman, Care, Circle, Concept, Crash, Danger, Despair, Disaster, Emergency, Emotional, Equipment, Hand, Help, Hopelessness, Human, Illustration, Insurance, Isolated, Life, Lifebuoy, Life Preserver, Loss, Lost, People, Person, Protection, Rescue, Ring, Risk, Rubber, Safe, Safety, Salvage, Security, Shipwreck, Single, Stress, Survival, Symbol, Warning, White. The prominent colors used in the PowerPoint template are Red, Gray, White. PowerPoint presentation experts tell us our business analyst diagrams man suffering from disaster powerpoint theme Slides are designed by a team of presentation professionals. Use our Assistance PowerPoint templates and PPT Slides provide you with a vast range of viable options. Select the appropriate ones and just fill in your text. You can be sure our business analyst diagrams man suffering from disaster powerpoint theme Slides will help them to explain complicated concepts. Presenters tell us our Care PowerPoint templates and PPT Slides provide you with a vast range of viable options. Select the appropriate ones and just fill in your text. You can be sure our business analyst diagrams man suffering from disaster powerpoint theme Slides have awesome images to get your point across. Professionals tell us our Belt PowerPoint templates and PPT Slides will generate and maintain the level of interest you desire. They will create the impression you want to imprint on your audience. Assist the fallen with our Business Analyst Diagrams Man Suffering From Disaster PowerPoint Theme Slides. Give them hope to rise again.
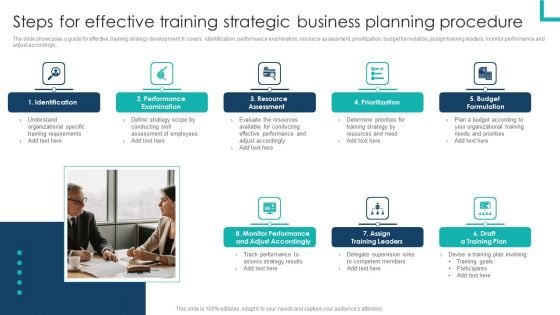
Steps For Effective Training Strategic Business Planning Procedure Diagrams PDF
The slide showcases a guide for effective training strategy development. It covers identification, performance examination, resource assessment, prioritization, budget formulation, assign training leaders, monitor performance and adjust accordingly.Persuade your audience using this Steps For Effective Training Strategic Business Planning Procedure Diagrams PDF. This PPT design covers five stages, thus making it a great tool to use. It also caters to a variety of topics including Performance Examination, Resource Assessment, Budget Formulation. Download this PPT design now to present a convincing pitch that not only emphasizes the topic but also showcases your presentation skills.

Social Media Content Survey Report Ppt PowerPoint Presentation Layouts Good PDF
Showcasing this set of slides titled social media content survey report ppt powerpoint presentation layouts good pdf. The topics addressed in these templates are news, humor, opinion, fiction, warnings, alerts. All the content presented in this PPT design is completely editable. Download it and make adjustments in color, background, font etc. as per your unique business setting.
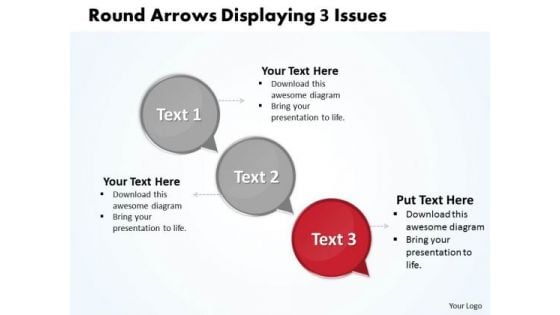
Ppt Arrows Download PowerPoint Layouts Stagesdisplaying 3 Issues Templates
PPT arrows download powerpoint layouts stagesdisplaying 3 issues Templates-This PowerPoint Diagram shows you the Circular Text boxes to represent different procedures or mechanism. The text boxes can be very useful in hand-outs because the space for text is sufficiently large for Business purposes. It uses Red Circular Text box to explain the concept.-PPT arrows download powerpoint layouts stagesdisplaying 3 issues Templates-Add, Aqua, Arrows, Badges, Bar, Blend, Blue, Bright, Bubbles, Buttons, Caution, Circle, Drop, Elements, Glossy, Glowing, Graphic, Heart, Help, Icons, Idea, Illustration, Navigation, Oblong, Plus, Round, Service, Shadow, Shiny, Sign, Speech, Squares Continue on your path to success with our Ppt Arrows Download PowerPoint Layouts Stagesdisplaying 3 Issues Templates. You will come out on top.
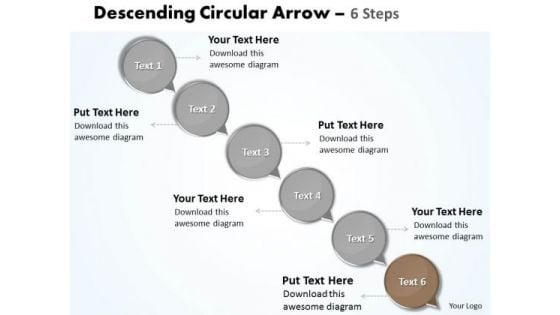
Ppt Circular Text PowerPoint 2010 Circles Descending Arrow 6 Steps Business Templates
PPT circular text powerpoint 2010 circles descending arrow 6 steps Business Templates-This PowerPoint Diagram shows you the Circular Text boxes to represent different procedures or mechanism. The text boxes can be very useful in hand-outs because the space for text is sufficiently large for Business purposes. It uses brown Circular Text box to explain the concept.-PPT circular text powerpoint 2010 circles descending arrow 6 steps Business Templates-Add, Aqua, Arrows, Badges, Bar, Blend, Blue, Bright, Bubbles, Buttons, Caution, Circle, Drop, Elements, Glossy, Glowing, Graphic, Heart, Help, Icons, Idea, Illustration, Navigation, Oblong, Plus, Round, Service, Shadow, Shiny, Sign, Speech, Squares Clear bottlenecks with our Ppt Circular Text PowerPoint 2010 Circles Descending Arrow 6 Steps Business Templates. Get past any obstacle in your way.
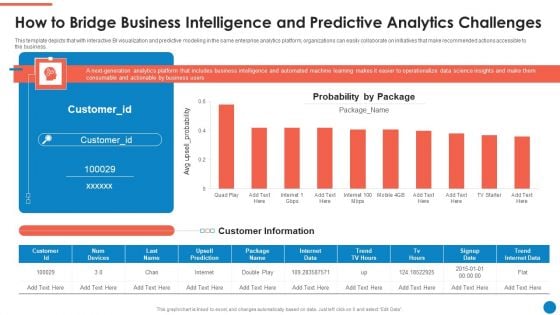
Data And Analytics Playbook How To Bridge Business Intelligence And Predictive Graphics PDF
This template depicts that with interactive BI visualization and predictive modeling in the same enterprise analytics platform, organizations can easily collaborate on initiatives that make recommended actions accessible to the business. Deliver and pitch your topic in the best possible manner with this Data And Analytics Playbook How To Bridge Business Intelligence And Predictive Graphics PDF. Use them to share invaluable insights on Probability By Package, Customer Information, Internet Data and impress your audience. This template can be altered and modified as per your expectations. So, grab it now.
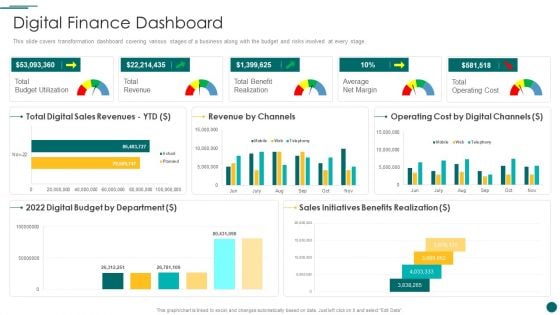
Organization Reinvention Digital Finance Dashboard Clipart PDF
This slide covers the advanced technologies entering the market from past few decades. The combinatorial effects of base technologies, such as mobile, cloud, sensors, analytics and the Internet of Things IoT, are accelerating progress exponentially. This slide covers transformation dashboard covering various stages of a business along with the budget and risks involved at every stage. Deliver and pitch your topic in the best possible manner with this Organization Reinvention Digital Finance Dashboard Clipart PDF. Use them to share invaluable insights on Revenue By Channels, Operating Cost, Digital Budget and impress your audience. This template can be altered and modified as per your expectations. So, grab it now.
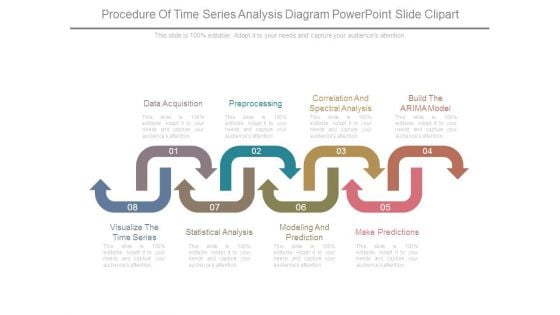
Procedure Of Time Series Analysis Diagram Powerpoint Slide Clipart
This is a procedure of time series analysis diagram powerpoint slide clipart. This is a eight stage process. The stages in this process are data acquisition, preprocessing, correlation and spectral analysis, build the arima model, make predictions, modeling and prediction, statistical analysis, visualize the time series.
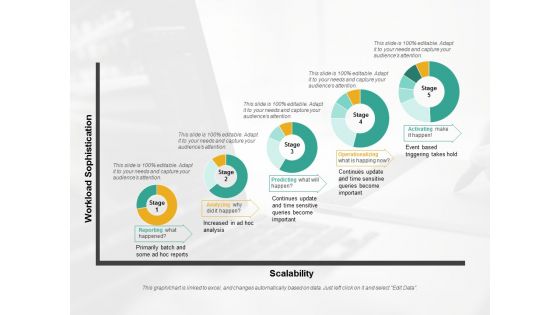
Predictive Analytics Stages Ppt PowerPoint Presentation Infographic Template Structure
This is a predictive analytics stages ppt powerpoint presentation infographic template structure. This is a five stage process. The stages in this process are business, donut chart, finance, marketing, strategy.
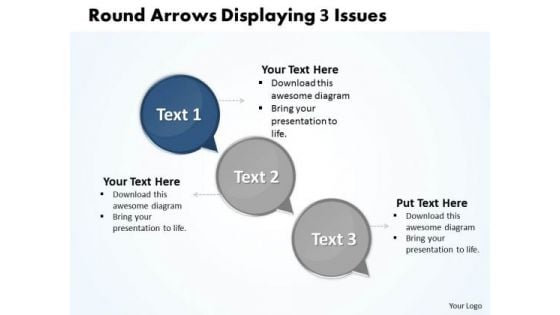
Ppt Circle Curved Arrows PowerPoint 2010 Showing 3 Issues Templates
PPT circle curved arrows powerpoint 2010 showing 3 issues Templates-This Diagram makes information accessible throughout the organization with a collective, visible view of critical data from different perspectives and providing the tools to upcoming business scenarios and plan for change. This compelling graphics can be used to show relations and interfaces among various marketing activities. -PPT circle curved arrows powerpoint 2010 showing 3 issues Templates-Add, Aqua, Arrows, Badges, Bar, Blend, Blue, Bright, Bubbles, Buttons, Caution, Circle, Drop, Elements, Glossy, Glowing, Graphic, Heart, Help, Icons, Idea, Illustration, Navigation, Oblong, Plus, Round, Service, Shadow, Shiny, Sign, Speech, Squares Take your cause forward with passion. Our Ppt Circle Curved Arrows PowerPoint 2010 Showing 3 Issues Templates will espouse your thoughts.
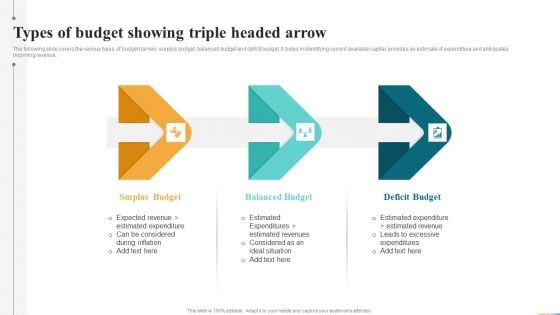
Types Of Budget Showing Triple Headed Arrow Ppt Infographics Good PDF
The following slide covers the various types of budget namely surplus budget, balanced budget and deficit budget. It helps in identifying current available capital, provides an estimate of expenditure and anticipates incoming revenue. Persuade your audience using this Types Of Budget Showing Triple Headed Arrow Ppt Infographics Good PDF. This PPT design covers three stages, thus making it a great tool to use. It also caters to a variety of topics including Surplus Budget, Balanced Budget, Deficit Budget. Download this PPT design now to present a convincing pitch that not only emphasizes the topic but also showcases your presentation skills.
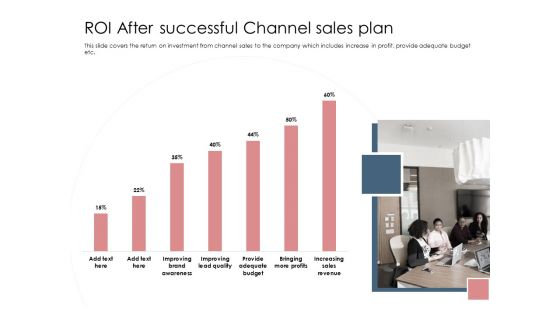
Best Practices Increase Revenue Out Indirect ROI After Successful Channel Sales Plan Themes PDF
Deliver an awe inspiring pitch with this creative best practices increase revenue out indirect roi after successful channel sales plan themes pdf bundle. Topics like revenue, sales, budget, awareness, profit can be discussed with this completely editable template. It is available for immediate download depending on the needs and requirements of the user.
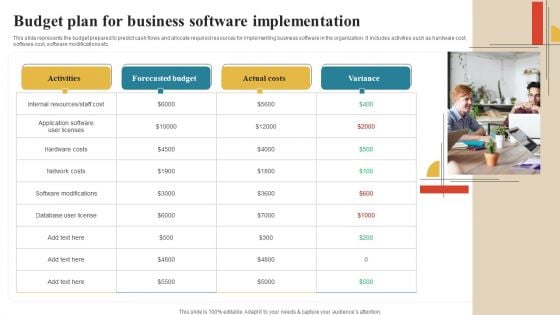
Software Implementation Technique Budget Plan For Business Software Implementation Themes PDF
This slide represents the budget prepared to predict cash flows and allocate required resources for implementing business software in the organization. It includes activities such as hardware cost, software cost, software modifications etc. Boost your pitch with our creative Software Implementation Technique Budget Plan For Business Software Implementation Themes PDF. Deliver an awe-inspiring pitch that will mesmerize everyone. Using these presentation templates you will surely catch everyones attention. You can browse the ppts collection on our website. We have researchers who are experts at creating the right content for the templates. So you do not have to invest time in any additional work. Just grab the template now and use them.
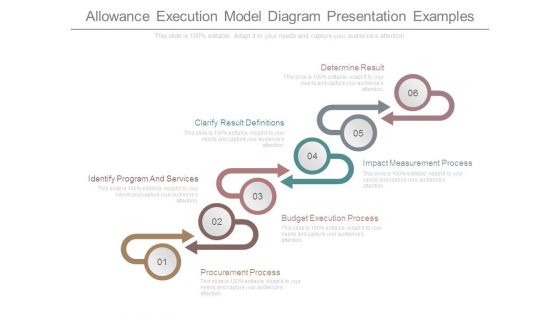
Allowance Execution Model Diagram Presentation Examples
This is a allowance execution model diagram presentation examples. This is a six stage process. The stages in this process are determine result, clarify result definitions, identify program and services, impact measurement process, budget execution process, procurement process.
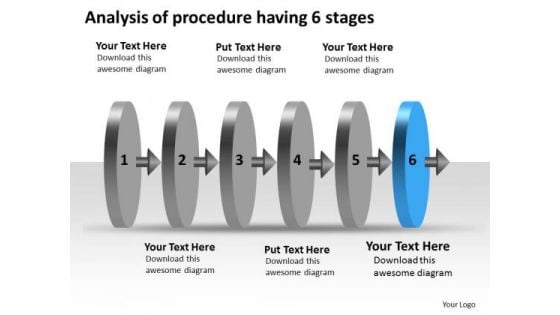
Of Procedure Having 6 Stages Ppt Technical Support Process Flow Chart PowerPoint Templates
We present our of procedure having 6 stages ppt technical support process flow chart PowerPoint templates.Present our Leadership PowerPoint Templates because this diagram can be used to illustrate the logical path or system. Download and present our Arrows PowerPoint Templates because this slide depicts the occasion for gifting and giving. Use our Process and Flows PowerPoint Templates because you will be able to Highlight the various ways in which we can maintain its efficiency. Download our Business PowerPoint Templates because your product has established a foothold in the market. Customers are happy with the value it brings to their lives. Present our Circle Charts PowerPoint Templates because you can Bullet-point your thoughts and ideas to profitably accomplish every step of every stage along the way.Use these PowerPoint slides for presentations relating to Analysis, Analyze, Argument, Argumentation, Black, Business, Calculation, Concept, Criticism, Critique, Detection, Discussion, Dispute, Examination, Experiment, Interpretation, Interview, Know, Learning, Loupe, Magnification, Magnify, Magnifying, Operation, Problem, Procedure, Strategy, Technical, Verification. The prominent colors used in the PowerPoint template are Blue, Gray, Black. People tell us our of procedure having 6 stages ppt technical support process flow chart PowerPoint templates are Stunning. PowerPoint presentation experts tell us our Calculation PowerPoint templates and PPT Slides are Luxuriant. Presenters tell us our of procedure having 6 stages ppt technical support process flow chart PowerPoint templates are Efficient. The feedback we get is that our Black PowerPoint templates and PPT Slides provide you with a vast range of viable options. Select the appropriate ones and just fill in your text. You can be sure our of procedure having 6 stages ppt technical support process flow chart PowerPoint templates look good visually. Professionals tell us our Argument PowerPoint templates and PPT Slides are Luxuriant. Creat an attractive presentation with our Of Procedure Having 6 Stages Ppt Technical Support Process Flow Chart PowerPoint Templates. Dont pass up this opportunity to shine.
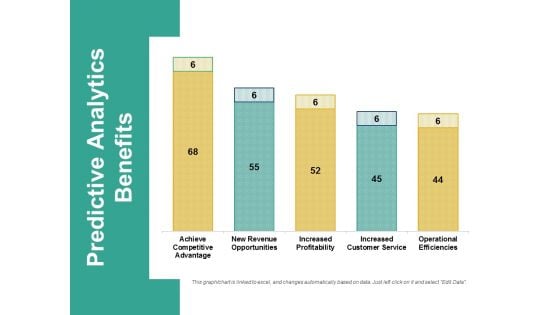
Predictive Analytics Benefits Ppt PowerPoint Presentation Professional Samples
This is a predictive analytics benefits ppt powerpoint presentation professional samples. This is a five stage process. The stages in this process are business, finance, marketing, strategy, analysis.
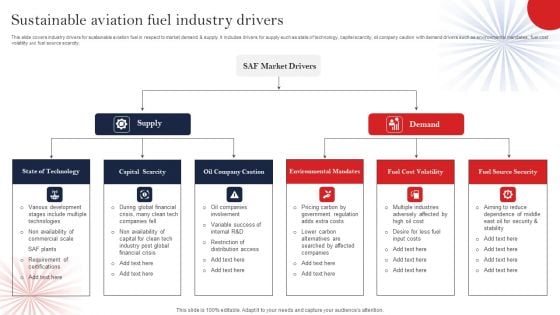
Sustainable Aviation Fuel Industry Drivers Brochure PDF
This slide covers industry drivers for sustainable aviation fuel in respect to market demand and supply. It includes drivers for supply such as state of technology, capital scarcity, oil company caution with demand drivers such as environmental mandates, fuel cost volatility and fuel source scarcity. Presenting Sustainable Aviation Fuel Industry Drivers Brochure PDF to dispense important information. This template comprises one stages. It also presents valuable insights into the topics including Saf Market Drivers, Supply, Demand. This is a completely customizable PowerPoint theme that can be put to use immediately. So, download it and address the topic impactfully.
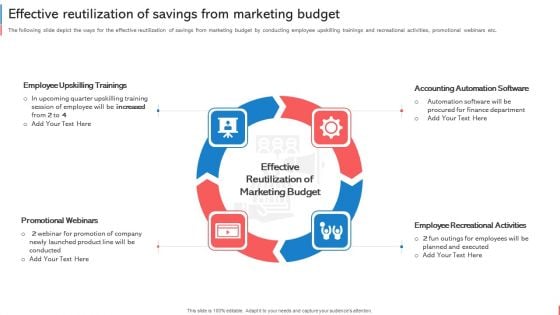
Company Budget Analysis Effective Reutilization Of Savings From Marketing Budget Portrait PDF
The following slide depict the ways for the effective reutilization of savings from marketing budget by conducting employee upskilling trainings and recreational activities, promotional webinars etc. Do you have to make sure that everyone on your team knows about any specific topic I yes, then you should give Company Budget Analysis Effective Reutilization Of Savings From Marketing Budget Portrait PDF a try. Our experts have put a lot of knowledge and effort into creating this impeccable Company Budget Analysis Effective Reutilization Of Savings From Marketing Budget Portrait PDF. You can use this template for your upcoming presentations, as the slides are perfect to represent even the tiniest detail. You can download these templates from the Slidegeeks website and these are easy to edit. So grab these today.
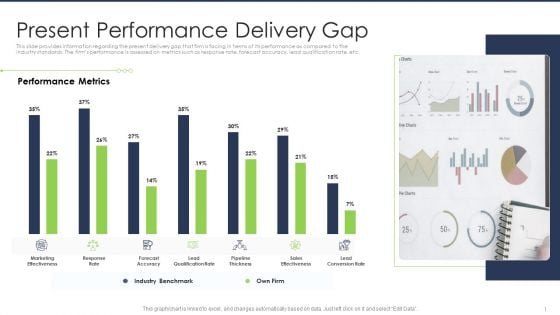
Lead Scoring AI Model Present Performance Delivery Gap Ppt File Slides PDF
This slide provides information regarding the present delivery gap that firm is facing in terms of its performance as compared to the industry standards. The firms performance is assessed on metrics such as response rate, forecast accuracy, lead qualification rate, etc. Deliver an awe inspiring pitch with this creative lead scoring ai model present performance delivery gap ppt file slides pdf bundle. Topics like marketing, effectiveness, sales, accuracy, performance can be discussed with this completely editable template. It is available for immediate download depending on the needs and requirements of the user.
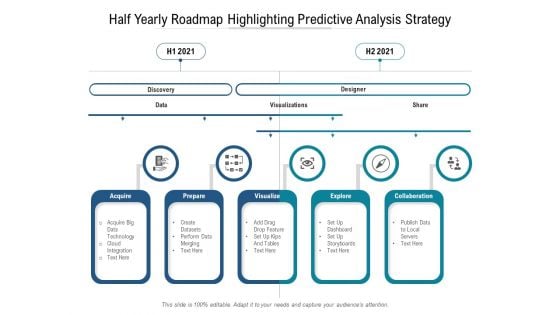
Half Yearly Roadmap Highlighting Predictive Analysis Strategy Guidelines
Introducing our half yearly roadmap highlighting predictive analysis strategy guidelines. This PPT presentation is Google Slides compatible, therefore, you can share it easily with the collaborators for measuring the progress. Also, the presentation is available in both standard screen and widescreen aspect ratios. So edit the template design by modifying the font size, font type, color, and shapes as per your requirements. As this PPT design is fully editable it can be presented in PDF, JPG and PNG formats.
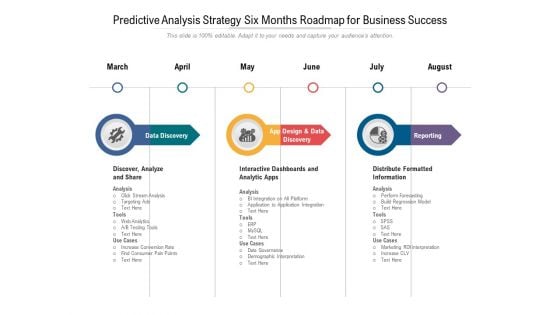
Predictive Analysis Strategy Six Months Roadmap For Business Success Rules
Introducing our predictive analysis strategy six months roadmap for business success rules. This PPT presentation is Google Slides compatible, therefore, you can share it easily with the collaborators for measuring the progress. Also, the presentation is available in both standard screen and widescreen aspect ratios. So edit the template design by modifying the font size, font type, color, and shapes as per your requirements. As this PPT design is fully editable it can be presented in PDF, JPG and PNG formats.
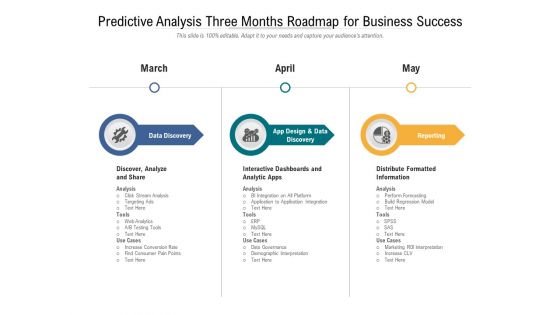
Predictive Analysis Three Months Roadmap For Business Success Infographics
Introducing our predictive analysis three months roadmap for business success infographics. This PPT presentation is Google Slides compatible, therefore, you can share it easily with the collaborators for measuring the progress. Also, the presentation is available in both standard screen and widescreen aspect ratios. So edit the template design by modifying the font size, font type, color, and shapes as per your requirements. As this PPT design is fully editable it can be presented in PDF, JPG and PNG formats.
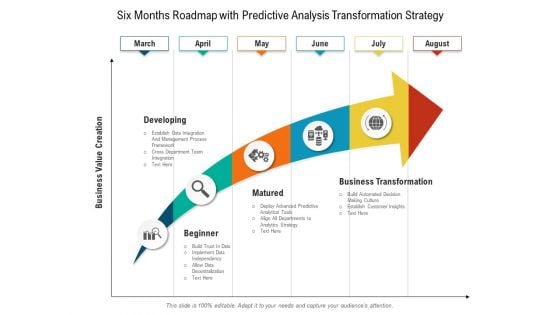
Six Months Roadmap With Predictive Analysis Transformation Strategy Summary
Introducing our six months roadmap with predictive analysis transformation strategy summary. This PPT presentation is Google Slides compatible, therefore, you can share it easily with the collaborators for measuring the progress. Also, the presentation is available in both standard screen and widescreen aspect ratios. So edit the template design by modifying the font size, font type, color, and shapes as per your requirements. As this PPT design is fully editable it can be presented in PDF, JPG and PNG formats.
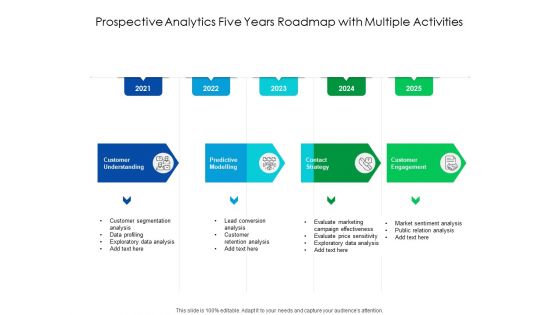
Predictive Analytics Five Years Roadmap With Multiple Activities Ideas
Introducing our predictive analytics five years roadmap with multiple activities ideas. This PPT presentation is Google Slides compatible, therefore, you can share it easily with the collaborators for measuring the progress. Also, the presentation is available in both standard screen and widescreen aspect ratios. So edit the template design by modifying the font size, font type, color, and shapes as per your requirements. As this PPT design is fully editable it can be presented in PDF, JPG and PNG formats.
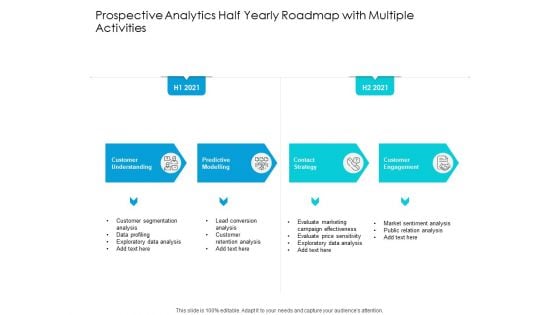
Predictive Analytics Half Yearly Roadmap With Multiple Activities Formats
Introducing our predictive analytics half yearly roadmap with multiple activities formats. This PPT presentation is Google Slides compatible, therefore, you can share it easily with the collaborators for measuring the progress. Also, the presentation is available in both standard screen and widescreen aspect ratios. So edit the template design by modifying the font size, font type, color, and shapes as per your requirements. As this PPT design is fully editable it can be presented in PDF, JPG and PNG formats.
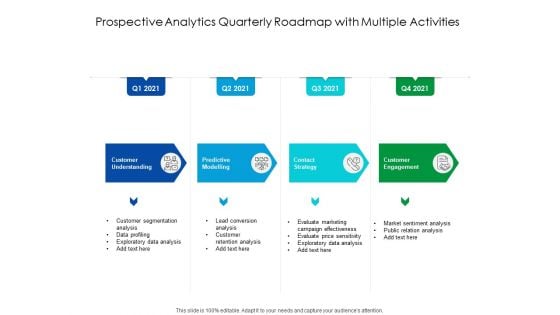
Predictive Analytics Quarterly Roadmap With Multiple Activities Ideas
Introducing our predictive analytics quarterly roadmap with multiple activities ideas. This PPT presentation is Google Slides compatible, therefore, you can share it easily with the collaborators for measuring the progress. Also, the presentation is available in both standard screen and widescreen aspect ratios. So edit the template design by modifying the font size, font type, color, and shapes as per your requirements. As this PPT design is fully editable it can be presented in PDF, JPG and PNG formats.
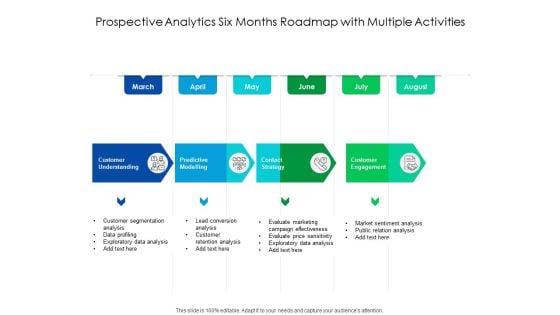
Predictive Analytics Six Months Roadmap With Multiple Activities Topics
Introducing our predictive analytics six months roadmap with multiple activities topics. This PPT presentation is Google Slides compatible, therefore, you can share it easily with the collaborators for measuring the progress. Also, the presentation is available in both standard screen and widescreen aspect ratios. So edit the template design by modifying the font size, font type, color, and shapes as per your requirements. As this PPT design is fully editable it can be presented in PDF, JPG and PNG formats.

Predictive Analytics Three Months Roadmap With Multiple Activities Elements
Introducing our predictive analytics three months roadmap with multiple activities elements. This PPT presentation is Google Slides compatible, therefore, you can share it easily with the collaborators for measuring the progress. Also, the presentation is available in both standard screen and widescreen aspect ratios. So edit the template design by modifying the font size, font type, color, and shapes as per your requirements. As this PPT design is fully editable it can be presented in PDF, JPG and PNG formats.
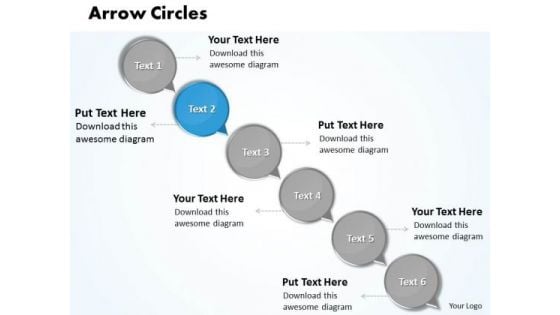
Ppt Descending Circles Lotus Connections With Arrow 6 Steps PowerPoint Templates
PPT descending circles lotus connections with arrow 6 steps PowerPoint Templates-Our compelling template consists of design of text circles connected with arrows in descending order. Forward thinking is the way to go. Use this template to emphasize your views.-PPT descending circles lotus connections with arrow 6 steps PowerPoint Templates-Add, Aqua, Arrows, Badges, Bar, Blend, Blue, Bright, Bubbles, Buttons, Caution, Circle, Drop, Elements, Glossy, Glowing, Graphic, Heart, Help, Icons, Idea, Illustration, Navigation, Oblong, Plus, Round, Service, Shadow, Shiny, Sign, Speech, Squares Perceive problems with our Ppt Descending Circles Lotus Connections With Arrow 6 Steps PowerPoint Templates. Download without worries with our money back guaranteee.
Four Steps Workflow Chart For Profit Planning Process Ppt PowerPoint Presentation Portfolio Icons PDF
Presenting four steps workflow chart for profit planning process ppt powerpoint presentation portfolio icons pdf to dispense important information. This template comprises four stages. It also presents valuable insights into the topics including profit goals, estimated profits, sales volume. This is a completely customizable PowerPoint theme that can be put to use immediately. So, download it and address the topic impactfully.
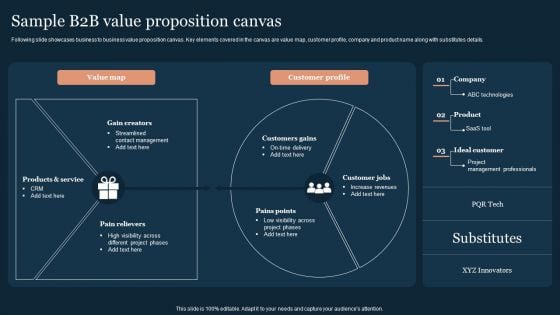
Guide To Develop And Estimate Brand Value Sample B2b Value Proposition Canvas Themes PDF
Following slide showcases business to business value proposition canvas. Key elements covered in the canvas are value map, customer profile, company and product name along with substitutes details.If you are looking for a format to display your unique thoughts, then the professionally designed Guide To Develop And Estimate Brand Value Sample B2b Value Proposition Canvas Themes PDF is the one for you. You can use it as a Google Slides template or a PowerPoint template. Incorporate impressive visuals, symbols, images, and other charts. Modify or reorganize the text boxes as you desire. Experiment with shade schemes and font pairings. Alter, share or cooperate with other people on your work. Download Guide To Develop And Estimate Brand Value Sample B2b Value Proposition Canvas Themes PDF and find out how to give a successful presentation. Present a perfect display to your team and make your presentation unforgettable.
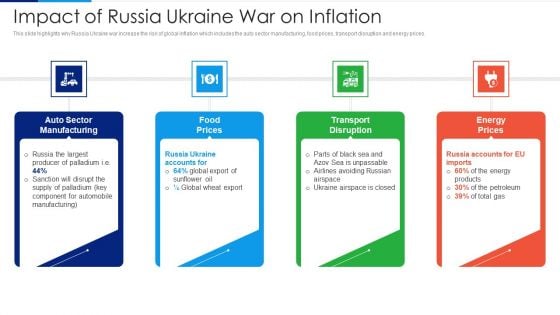
Russia Ukraine Conflict Effect Impact Of Russia Ukraine War On Inflation Diagrams PDF
This slide highlights why Russia Ukraine war increase the risk of global inflation which includes the auto sector manufacturing, food prices, transport disruption and energy prices. Presenting Russia Ukraine Conflict Effect Impact Of Russia Ukraine War On Inflation Diagrams PDF to provide visual cues and insights. Share and navigate important information on four stages that need your due attention. This template can be used to pitch topics like Auto Sector Manufacturing, Food Prices, Transport Disruption, Energy Prices. In addtion, this PPT design contains high resolution images, graphics, etc, that are easily editable and available for immediate download.
Social Media Marketing Budget Venn Diagram Ppt Layouts Design Inspiration PDF
Presenting this set of slides with name social media marketing budget venn diagram ppt layouts design inspiration pdf. This is a five stage process. The stages in this process are venn diagram. This is a completely editable PowerPoint presentation and is available for immediate download. Download now and impress your audience.
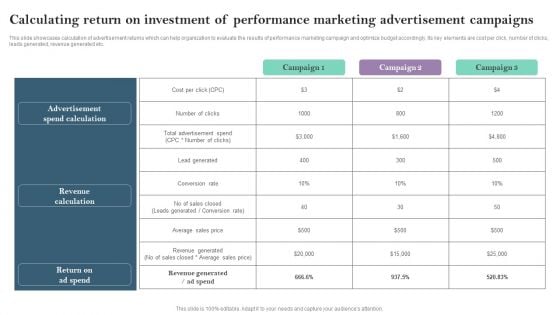
Calculating Return On Investment Of Performance Marketing Advertisement Campaigns Ppt PowerPoint Presentation File Pictures PDF
This slide showcases calculation of advertisement returns which can help organization to evaluate the results of performance marketing campaign and optimize budget accordingly. Its key elements are cost per click, number of clicks, leads generated, revenue generated etc. If you are looking for a format to display your unique thoughts, then the professionally designed Calculating Return On Investment Of Performance Marketing Advertisement Campaigns Ppt PowerPoint Presentation File Pictures PDF is the one for you. You can use it as a Google Slides template or a PowerPoint template. Incorporate impressive visuals, symbols, images, and other charts. Modify or reorganize the text boxes as you desire. Experiment with shade schemes and font pairings. Alter, share or cooperate with other people on your work. Download Calculating Return On Investment Of Performance Marketing Advertisement Campaigns Ppt PowerPoint Presentation File Pictures PDF and find out how to give a successful presentation. Present a perfect display to your team and make your presentation unforgettable.
Steps To Complete A Process 3 Stages Business Plan PowerPoint Templates
We present our steps to complete a process 3 stages business plan PowerPoint templates.Download our Business PowerPoint Templates because You can Inspire your team with our PowerPoint Templates and Slides. Let the force of your ideas flow into their minds. Present our Leadership PowerPoint Templates because Our PowerPoint Templates and Slides will let your team Walk through your plans. See their energy levels rise as you show them the way. Download our Targets PowerPoint Templates because They will Put your wonderful verbal artistry on display. Our PowerPoint Templates and Slides will provide you the necessary glam and glitter. Present our Signs PowerPoint Templates because Our PowerPoint Templates and Slides are specially created by a professional team with vast experience. They diligently strive to come up with the right vehicle for your brilliant Ideas. Present our Process and Flows PowerPoint Templates because You can Stir your ideas in the cauldron of our PowerPoint Templates and Slides. Cast a magic spell on your audience.Use these PowerPoint slides for presentations relating to team, logo icon, leadership, leader, forward, progress bar, target, circle logo, achievement, business, concept, sign, success, teamwork, symbol, logo design, diagram, circle, graphic, finance, difference, process, goal, marketing, different, development, price, abstract, graph, sectors, illustration, icon, circular, chart, forecast, direction, design, moving, motion, company, competition, progress, profit, increase, background, path, investment, aim, financial, communication. The prominent colors used in the PowerPoint template are Green, Blue, Black. Enthuse your audience with your ideas. Our Steps To Complete A Process 3 Stages Business Plan PowerPoint Templates will generate keenness.
Organizational Development And Promotional Plan Brand Launch Process And Budget Audit Icons PDF
The following slide briefly analyses and explains the new brand strategy of the organization. Presenting organizational development and promotional plan brand launch process and budget audit icons pdf to provide visual cues and insights. Share and navigate important information on five stages that need your due attention. This template can be used to pitch topics like research, strategic branding plan, internal branding, external branding, brand analysis and audit. In addtion, this PPT design contains high resolution images, graphics, etc, that are easily editable and available for immediate download.
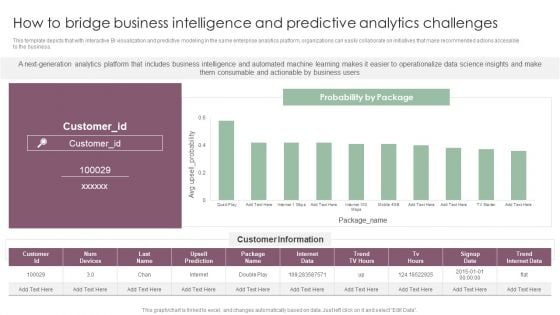
How To Bridge Business Intelligence And Predictive Analytics Challenges Mockup PDF
This template depicts that with interactive BI visualization and predictive modeling in the same enterprise analytics platform, organizations can easily collaborate on initiatives that make recommended actions accessible to the business. If you are looking for a format to display your unique thoughts, then the professionally designed How To Bridge Business Intelligence And Predictive Analytics Challenges Mockup PDF is the one for you. You can use it as a Google Slides template or a PowerPoint template. Incorporate impressive visuals, symbols, images, and other charts. Modify or reorganize the text boxes as you desire. Experiment with shade schemes and font pairings. Alter, share or cooperate with other people on your work. Download How To Bridge Business Intelligence And Predictive Analytics Challenges Mockup PDF and find out how to give a successful presentation. Present a perfect display to your team and make your presentation unforgettable.

International Business Extension Expectations After Expanding Into Global Markets Diagrams PDF
This slide showcase graph that can help organization to estimate the impact on organizational sales after global expansion. It showcases sales in thousand dollars and forecast for a period of two years. If you are looking for a format to display your unique thoughts, then the professionally designed International Business Extension Expectations After Expanding Into Global Markets Diagrams PDF is the one for you. You can use it as a Google Slides template or a PowerPoint template. Incorporate impressive visuals, symbols, images, and other charts. Modify or reorganize the text boxes as you desire. Experiment with shade schemes and font pairings. Alter, share or cooperate with other people on your work. Download International Business Extension Expectations After Expanding Into Global Markets Diagrams PDF and find out how to give a successful presentation. Present a perfect display to your team and make your presentation unforgettable.


 Continue with Email

 Home
Home


