Project Org Chart
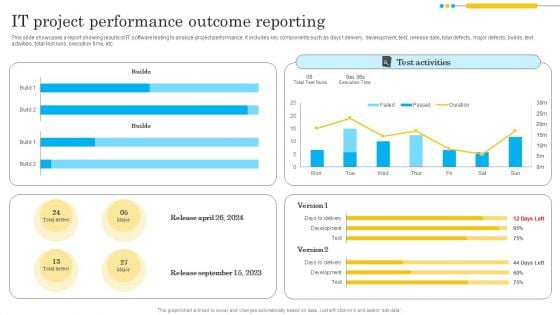
IT Project Performance Outcome Reporting Template PDF
This slide showcases a report showing results of IT software testing to analyze project performance. It includes key components such as days t delivery, development, test, release date, total defects, major defects, builds, test activities, total test runs, execution time, etc. Showcasing this set of slides titled IT Project Performance Outcome Reporting Template PDF. The topics addressed in these templates are Test Activities, Builds, Project Performance. All the content presented in this PPT design is completely editable. Download it and make adjustments in color, background, font etc. as per your unique business setting.
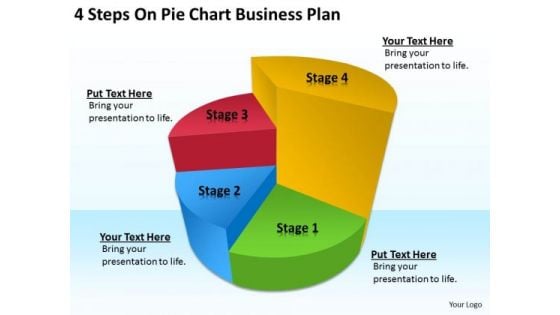
4 Steps On Pie Chart Business Plan Sample PowerPoint Templates
We present our 4 steps on pie chart business plan sample PowerPoint templates.Use our Flow Charts PowerPoint Templates because Your success is our commitment. Our PowerPoint Templates and Slides will ensure you reach your goal. Use our Process and Flows PowerPoint Templates because Our PowerPoint Templates and Slides will let you Hit the target. Go the full distance with ease and elan. Present our Marketing PowerPoint Templates because you can Set pulses racing with our PowerPoint Templates and Slides. They will raise the expectations of your team. Download our Success PowerPoint Templates because Our PowerPoint Templates and Slides help you meet the demand of the Market. Just browse and pick the slides that appeal to your intuitive senses. Download our Business PowerPoint Templates because Our PowerPoint Templates and Slides will let you Illuminate the road ahead to Pinpoint the important landmarks along the way.Use these PowerPoint slides for presentations relating to Chart, pie, bar, business, percent, forecasting, economy, piechart, white, achievement, future, sign, symbol, chartgraph, diagram, styles, finance, data, stock,report, marketing, analyzing, shape, graph, modern, economic, up, stair, money, solution, design, growth, colorful, progress, profit, inspiration,background, investment, successful, growthbusiness, prosperity, improvement, financial, concepts, structure, ideas. The prominent colors used in the PowerPoint template are Red, Yellow, Blue. Our 4 Steps On Pie Chart Business Plan Sample PowerPoint Templates are like angels. They take extraordinary care of your thoughts.
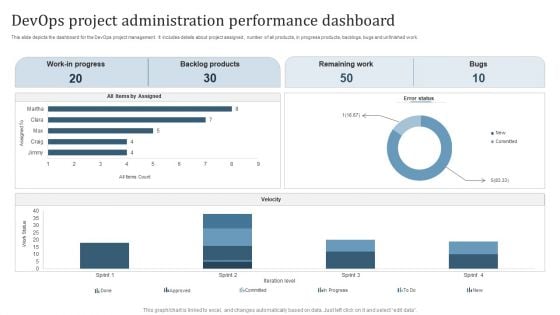
Devops Project Administration Performance Dashboard Themes PDF
This slide depicts the dashboard for the DevOps project management. It includes details about project assigned, number of all products, in progress products, backlogs, bugs and unfinished work. Pitch your topic with ease and precision using this Devops Project Administration Performance Dashboard Themes PDF. This layout presents information on Work In Progress, Backlog Products, Remaining Work, Bugs. It is also available for immediate download and adjustment. So, changes can be made in the color, design, graphics or any other component to create a unique layout.
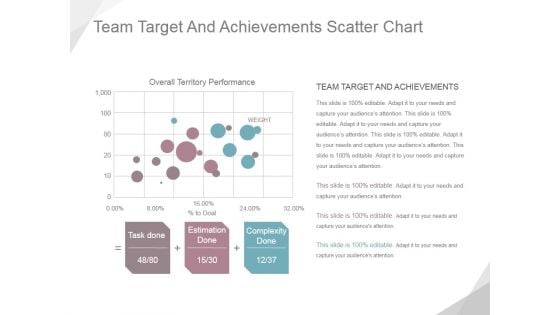
Team Target And Achievements Scatter Chart Ppt PowerPoint Presentation Example
This is a team target and achievements scatter chart ppt powerpoint presentation example. This is a three stage process. The stages in this process are overall territory performance, task done, estimation done, complexity done.
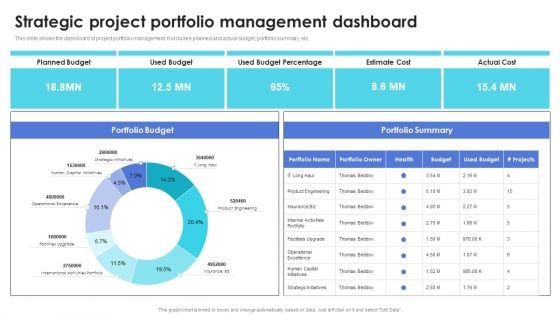
Strategic Project Portfolio Management Dashboard Download PDF
This slide shows the dashboard of project portfolio management. It includes planned and actual budget, portfolio summary, etc. Pitch your topic with ease and precision using this Strategic Project Portfolio Management Dashboard Download PDF. This layout presents information on Portfolio Budget, Portfolio Summary, Planned Budget. It is also available for immediate download and adjustment. So, changes can be made in the color, design, graphics or any other component to create a unique layout.
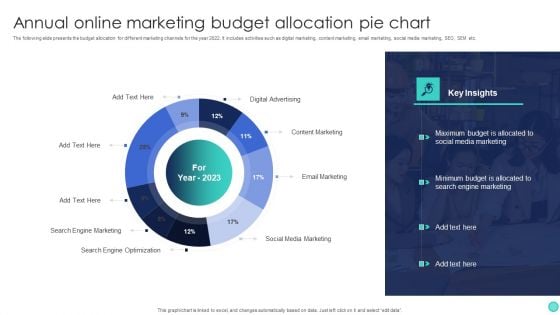
Annual Online Marketing Budget Allocation Pie Chart Pictures PDF
The following slide presents the budget allocation for different marketing channels for the year 2022. It includes activities such as digital marketing, content marketing, email marketing, social media marketing, SEO, SEM etc. Showcasing this set of slides titled Annual Online Marketing Budget Allocation Pie Chart Pictures PDF. The topics addressed in these templates are Digital Advertising, Content Marketing, Email Marketing, Social Media Marketing, Search Engine Optimization. All the content presented in this PPT design is completely editable. Download it and make adjustments in color, background, font etc. as per your unique business setting.
Product Marketing And Promotional Budget Spends Pie Chart Icons PDF
This slide covers marketing expenditures from budget allotted. It includes percentages for online advertising, sales training, conventions, trade shows, print advertising, publications, radio advertisements, magazines, catalogues and brochures. Pitch your topic with ease and precision using this Product Marketing And Promotional Budget Spends Pie Chart Icons PDF. This layout presents information on Conventions Were Maximum, Drive Maximum, Profit And Sales. It is also available for immediate download and adjustment. So, changes can be made in the color, design, graphics or any other component to create a unique layout.
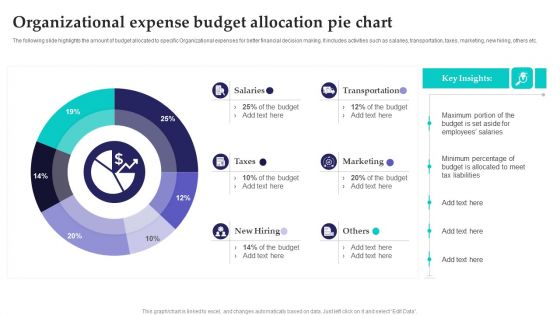
Organizational Expense Budget Allocation Pie Chart Inspiration PDF
The following slide highlights the amount of budget allocated to specific Organizational expenses for better financial decision making. It includes activities such as salaries, transportation, taxes, marketing, new hiring, others etc. Pitch your topic with ease and precision using this Organizational Expense Budget Allocation Pie Chart Inspiration PDF. This layout presents information on Transportation, Marketing, Budget. It is also available for immediate download and adjustment. So, changes can be made in the color, design, graphics or any other component to create a unique layout.
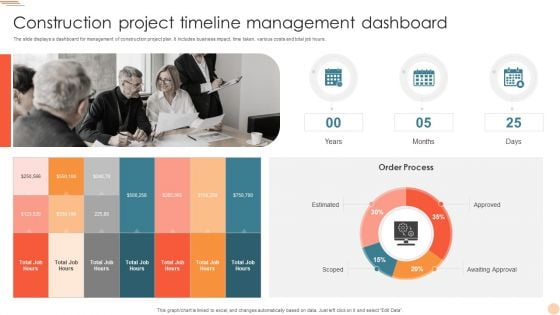
Construction Project Timeline Management Dashboard Clipart PDF
The slide displays a dashboard for management of construction project plan. It includes business impact, time taken, various costs and total job hours. Showcasing this set of slides titled Construction Project Timeline Management Dashboard Clipart PDF. The topics addressed in these templates are Order Process, Awaiting Approval, Months. All the content presented in this PPT design is completely editable. Download it and make adjustments in color, background, font etc. as per your unique business setting.
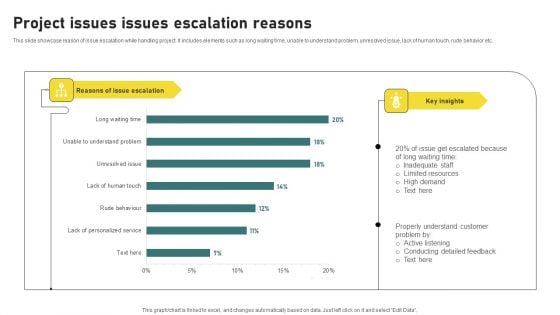
Project Issues Issues Escalation Reasons Information PDF
This slide showcase reason of issue escalation while handling project. It includes elements such as long waiting time, unable to understand problem, unresolved issue, lack of human touch, rude behavior etc. Showcasing this set of slides titled Project Issues Issues Escalation Reasons Information PDF. The topics addressed in these templates are Inadequate Staff, High Demand. All the content presented in this PPT design is completely editable. Download it and make adjustments in color, background, font etc. as per your unique business setting.
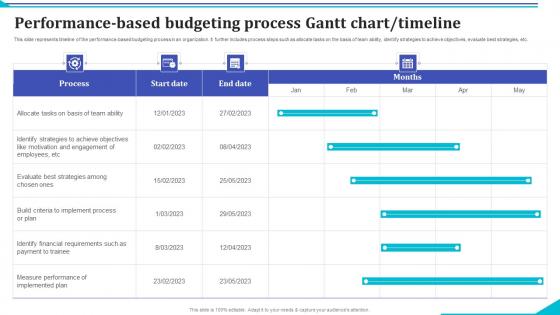
Performance Based Budgeting Process Gantt Chart Timeline Rules Pdf
This slide represents timeline of the performance based budgeting process in an organization. It further includes process steps such as allocate tasks on the basis of team ability, identify strategies to achieve objectives, evaluate best strategies, etc.Showcasing this set of slides titled Performance Based Budgeting Process Gantt Chart Timeline Rules Pdf The topics addressed in these templates are Build Criteria, Implement Process, Identify Financial Requirements, Payment Trainee All the content presented in this PPT design is completely editable. Download it and make adjustments in color, background, font etc. as per your unique business setting. This slide represents timeline of the performance based budgeting process in an organization. It further includes process steps such as allocate tasks on the basis of team ability, identify strategies to achieve objectives, evaluate best strategies, etc.
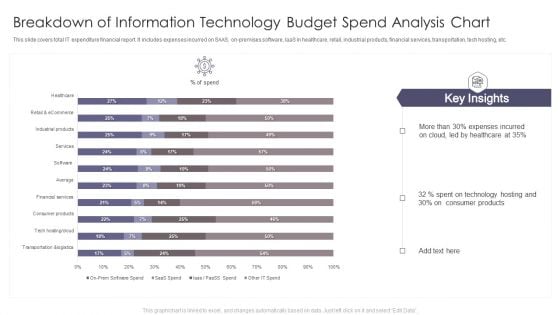
Breakdown Of Information Technology Budget Spend Analysis Chart Download PDF
This slide covers total IT expenditure financial report. It includes expenses incurred on SAAS, on-premises software, laaS in healthcare, retail, industrial products, financial services, transportation, tech hosting, etc. Pitch your topic with ease and precision using this Breakdown Of Information Technology Budget Spend Analysis Chart Download PDF. This layout presents information on Expenses Incurred, Technology Hosting, Consumer Products. It is also available for immediate download and adjustment. So, changes can be made in the color, design, graphics or any other component to create a unique layout.
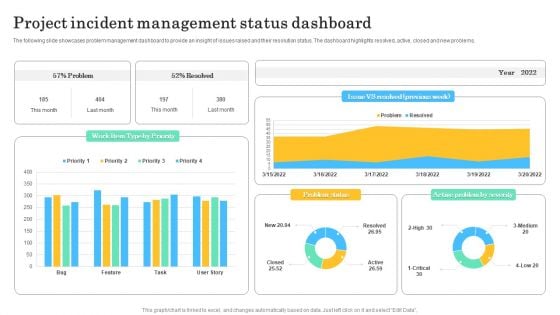
Project Incident Management Status Dashboard Sample PDF
The following slide showcases problem management dashboard to provide an insight of issues raised and their resolution status. The dashboard highlights resolved, active, closed and new problems. Pitch your topic with ease and precision using this Project Incident Management Status Dashboard Sample PDF. This layout presents information on Project Incident, Management Status Dashboard. It is also available for immediate download and adjustment. So, changes can be made in the color, design, graphics or any other component to create a unique layout.
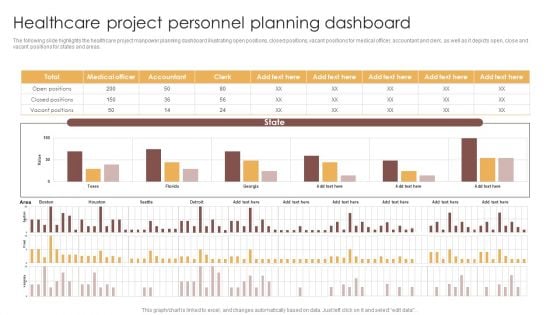
Healthcare Project Personnel Planning Dashboard Designs PDF
The following slide highlights the healthcare project manpower planning dashboard illustrating open positions, closed positions, vacant positions for medical officer, accountant and clerk, as well as it depicts open, close and vacant positions for states and areas. Showcasing this set of slides titled Healthcare Project Personnel Planning Dashboard Designs PDF. The topics addressed in these templates are Total, Medical Officer, Accountant. All the content presented in this PPT design is completely editable. Download it and make adjustments in color, background, font etc. as per your unique business setting.
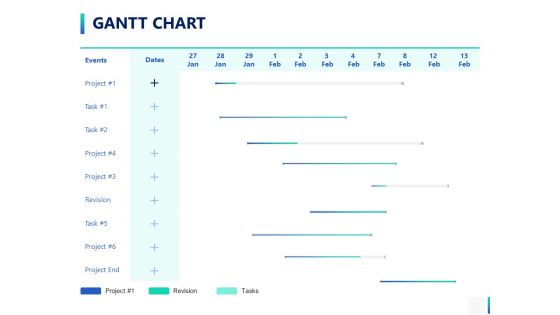
Gantt Chart Management Ppt PowerPoint Presentation Infographic Template Designs
Presenting this set of slides with name gantt chart management ppt powerpoint presentation infographic template designs. The topics discussed in these slide is project, revision, tasks. This is a completely editable PowerPoint presentation and is available for immediate download. Download now and impress your audience.
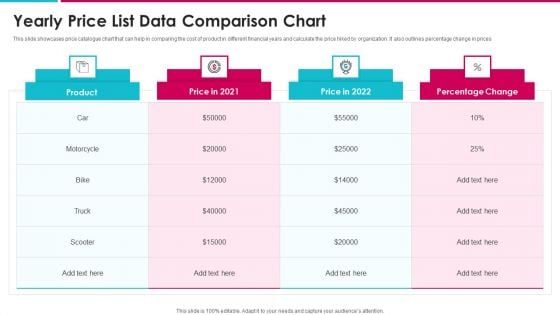
Yearly Price List Data Comparison Chart Structure PDF
This slide showcases price catalogue chart that can help in comparing the cost of product in different financial years and calculate the price hiked by organization. It also outlines percentage change in prices Showcasing this set of slides titled yearly price list data comparison chart structure pdf. The topics addressed in these templates are yearly price list data comparison chart. All the content presented in this PPT design is completely editable. Download it and make adjustments in color, background, font etc. as per your unique business setting.
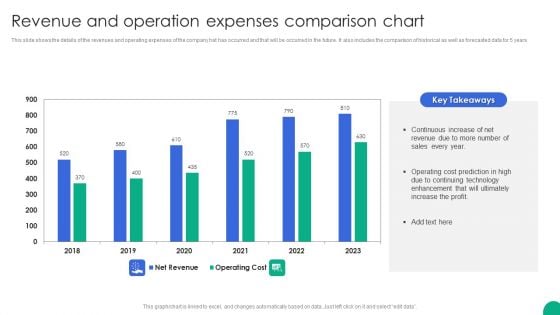
Revenue And Operation Expenses Comparison Chart Slides PDF
This slide shows the details of the revenues and operating expenses of the company hat has occurred and that will be occurred in the future. It also includes the comparison of historical as well as forecasted data for 5 years.Showcasing this set of slides titled Revenue And Operation Expenses Comparison Chart Slides PDF. The topics addressed in these templates are Continuous Increase, Operating Cost, Enhancement Ultimately. All the content presented in this PPT design is completely editable. Download it and make adjustments in color, background, font etc. as per your unique business setting.
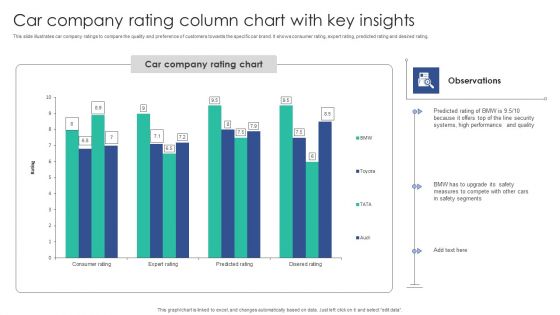
Car Company Rating Column Chart With Key Insights Structure PDF
This slide illustrates car company ratings to compare the quality and preference of customers towards the specific car brand. It shows consumer rating, expert rating, predicted rating and desired rating.Showcasing this set of slides titled Car Company Rating Column Chart With Key Insights Structure PDF. The topics addressed in these templates are Performance Quality, Top Security, Predicted Rating. All the content presented in this PPT design is completely editable. Download it and make adjustments in color, background, font etc. as per your unique business setting.
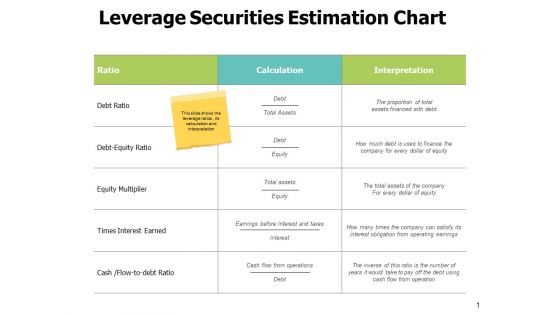
Leverage Securities Estimation Chart Ppt PowerPoint Presentation Professional Structure
This is a leverage securities estimation chart ppt powerpoint presentation professional structure. This is a three stage process. The stages in this process are compare, marketing, business, management, planning.
Six Months Business Valuation Chart Ppt Styles Icons PDF
This slide shows the 6 months graph to measure company valuation. It is representing that highest valuation of company was calculated in the month of June due to increase in sales. Pitch your topic with ease and precision using this Six Months Business Valuation Chart Ppt Styles Icons PDF. This layout presents information on Increase Sales, Company Valuation. It is also available for immediate download and adjustment. So, changes can be made in the color, design, graphics or any other component to create a unique layout.
Product Marketing Budget Spend Pie Chart Icon Designs PDF
Presenting Product Marketing Budget Spend Pie Chart Icon Designs PDF to dispense important information. This template comprises Three stages. It also presents valuable insights into the topics including Product Marketing, Budget Spend, Pie Chart Icon. This is a completely customizable PowerPoint theme that can be put to use immediately. So, download it and address the topic impactfully.
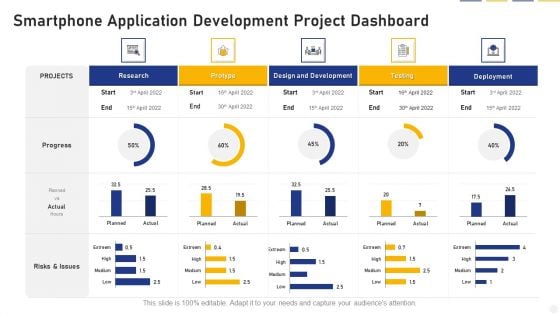
Smartphone Application Development Project Dashboard Microsoft PDF
Showcasing this set of slides titled smartphone application development project dashboard microsoft pdf. The topics addressed in these templates are research, protype, design and development, testing, deployment. All the content presented in this PPT design is completely editable. Download it and make adjustments in color, background, font etc. as per your unique business setting.
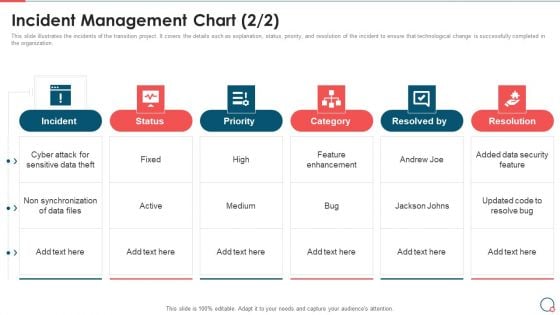
Incident Management Chart Information Technology Change Implementation Plan Professional PDF
This slide illustrates the incidents of the transition project. It covers the details such as explanation, status, priority, and resolution of the incident to ensure that technological change is successfully completed in the organization. Deliver and pitch your topic in the best possible manner with this Incident Management Chart Information Technology Change Implementation Plan Professional PDF. Use them to share invaluable insights on Incident, Priority, Resolved By, Resolution, High, Medium and impress your audience. This template can be altered and modified as per your expectations. So, grab it now.
Project Development Activity Monitoring Sheet Icons PDF
This slide illustrates project management monitoring chart for all activities. It includes activities, responsible, start date, end date, days, status, etc. Showcasing this set of slides titled Project Development Activity Monitoring Sheet Icons PDF. The topics addressed in these templates are Project Development, Activity Monitoring Sheet. All the content presented in this PPT design is completely editable. Download it and make adjustments in color, background, font etc. as per your unique business setting.
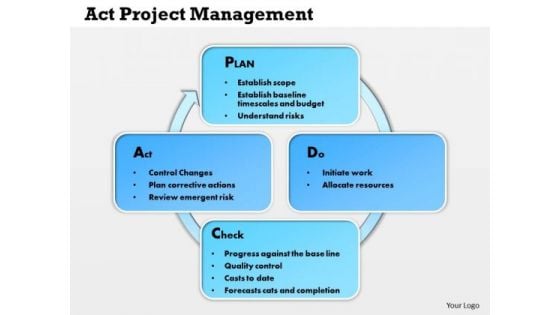
Business Framework Act Project Management PowerPoint Presentation
This act project diagram make your audience understands essential elements of your overall strategy and also shows an organized view of business processes. This unique diagram makes your presentations more professional.
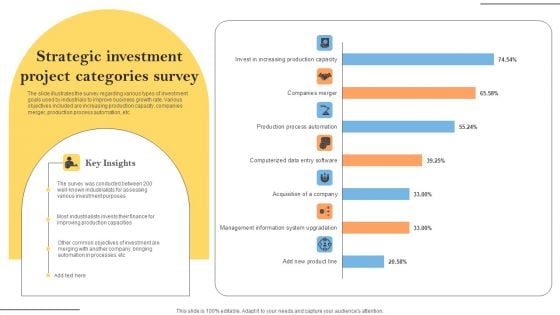
Strategic Investment Project Categories Survey Infographics PDF
The slide illustrates the survey regarding various types of investment goals used by industrials to improve business growth rate. Various objectives included are increasing production capacity, companies merger, production process automation, etc . Showcasing this set of slides titled Strategic Investment Project Categories Survey Infographics PDF. The topics addressed in these templates are Investment, Automation In Processes, Key Insights. All the content presented in this PPT design is completely editable. Download it and make adjustments in color, background, font etc. as per your unique business setting.
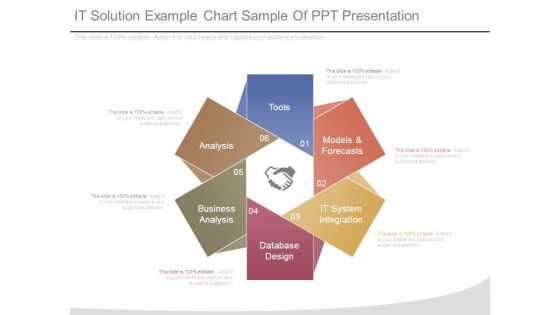
It Solution Example Chart Sample Of Ppt Presentation
This is a it solution example chart sample of ppt presentation. This is a six stage process. The stages in this process are tools, models and forecasts, it system integration, database design, business analysis, analysis.
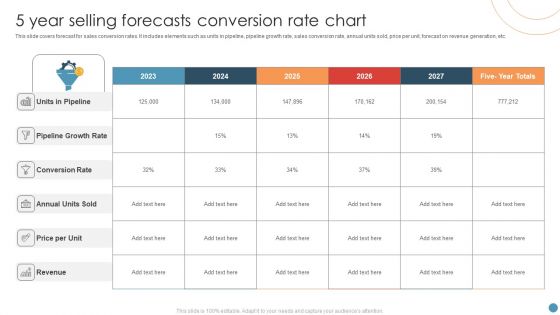
5 Year Selling Forecasts Conversion Rate Chart Microsoft PDF
This slide covers forecast for sales conversion rates. It includes elements such as units in pipeline, pipeline growth rate, sales conversion rate, annual units sold, price per unit, forecast on revenue generation, etc. Pitch your topic with ease and precision using this 5 Year Selling Forecasts Conversion Rate Chart Microsoft PDF. This layout presents information on Conversion Rate, Price Per Unit, Growth Rate. It is also available for immediate download and adjustment. So, changes can be made in the color, design, graphics or any other component to create a unique layout.
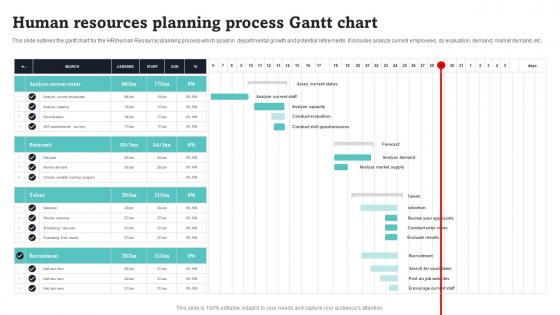
Human Resources Planning Process Gantt Chart Portrait Pdf
This slide outlines the gantt chart for the HRhuman Resource planning process which assist in departmental growth and potential retirements. It includes analyze current employees, do evaluation, demand, market demand, etc. Pitch your topic with ease and precision using this Human Resources Planning Process Gantt Chart Portrait Pdf. This layout presents information on Analyze Current Status, Forecast, Talent. It is also available for immediate download and adjustment. So, changes can be made in the color, design, graphics or any other component to create a unique layout. This slide outlines the gantt chart for the HRhuman Resource planning process which assist in departmental growth and potential retirements. It includes analyze current employees, do evaluation, demand, market demand, etc.
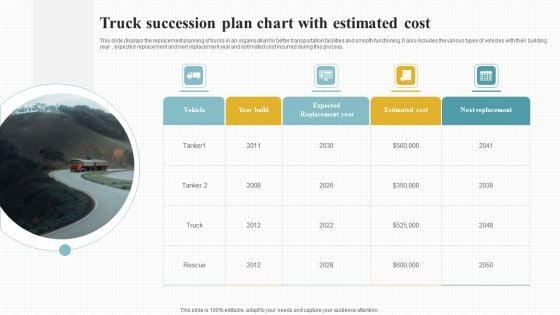
Truck Succession Plan Chart With Estimated Cost Pictures PDF
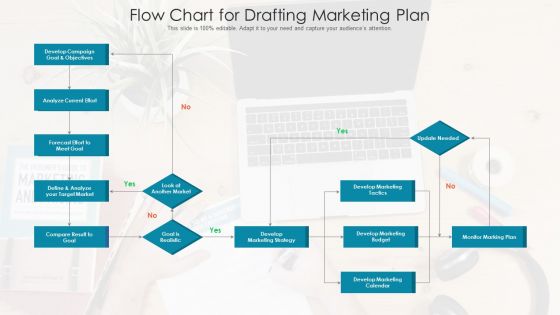
Marketing Planning Process Flow Chart Ppt Model Templates PDF
Presenting marketing planning process flow chart ppt model templates pdf to dispense important information. This template comprises one stage. It also presents valuable insights into the topics including develop marketing tactics, monitor marking plan, develop marketing budget, develop marketing strategy. This is a completely customizable PowerPoint theme that can be put to use immediately. So, download it and address the topic impactfully.
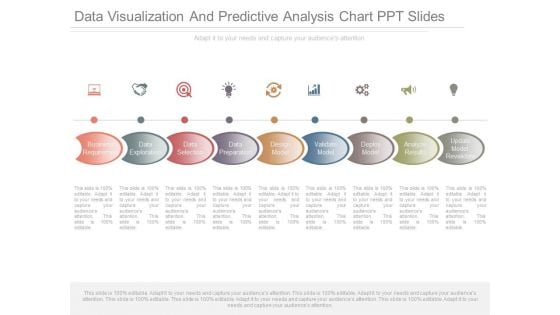
Data Visualization And Predictive Analysis Chart Ppt Slides
This is a data visualization and predictive analysis chart ppt slides. This is a nine stage process. The stages in this process are business requirement, data exploration, data selection, data preparation, design model, validate model, deploy model, analyze results, update model, revalidate.
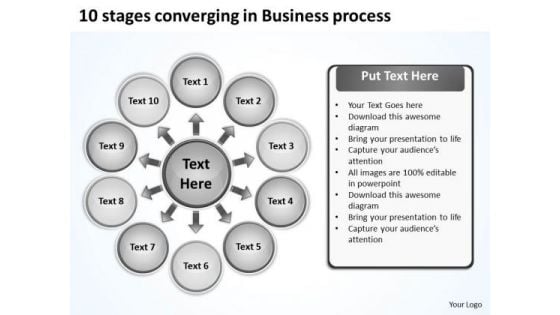
In World Business PowerPoint Templates Process Cycle Chart Slides
We present our in world business powerpoint templates process Cycle Chart Slides.Download and present our Arrows PowerPoint Templates because with the help of our Slides you can Illustrate your ideas one by one and demonstrate how each is an important cog in running the entire wheel. Use our Business PowerPoint Templates because you can Lead your flock steadily to greater heights. Look around at the vast potential of achievement around you. Download and present our Signs PowerPoint Templates because this is An innovative slide design depicting driving home the relevance of a steady rhythm. Download our Shapes PowerPoint Templates because your marketing strategies can funnel down to the cone, stage by stage, refining as you go along. Use our Spheres PowerPoint Templates because your business and plans for its growth consist of processes that are highly co-related.Use these PowerPoint slides for presentations relating to Arrows, Business, Chart, Circular, Commerce, Concept, Contribution, Cycle, Development, Diagram, Global, Idea, Informative, Internet, Join, Making, Manage, Management, Market, Marketing, Partner, Paying, Performance, Plans, Process, Productive, Productivity, Profit, Profitable, Project. The prominent colors used in the PowerPoint template are White, Black, Gray. Professionals tell us our in world business powerpoint templates process Cycle Chart Slides are Elevated. You can be sure our Cycle PowerPoint templates and PPT Slides are Perfect. Customers tell us our in world business powerpoint templates process Cycle Chart Slides are the best it can get when it comes to presenting. Professionals tell us our Cycle PowerPoint templates and PPT Slides are Magnificent. People tell us our in world business powerpoint templates process Cycle Chart Slides are One-of-a-kind. People tell us our Contribution PowerPoint templates and PPT Slides are topically designed to provide an attractive backdrop to any subject. Taste success with our In World Business PowerPoint Templates Process Cycle Chart Slides. You will come out on top.
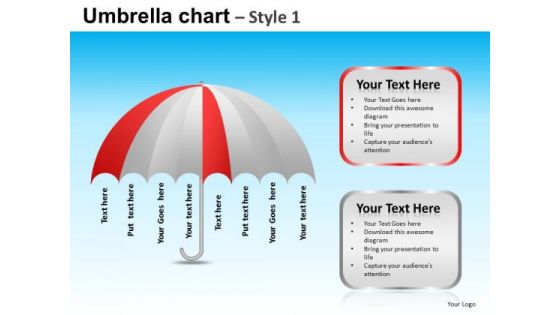
PowerPoint Template Executive Leadership Targets Umbrella Chart Ppt Layouts
PowerPoint Template Executive Leadership Targets Umbrella Chart PPT Layouts-These high quality, editable pre-designed powerpoint slides have been carefully created by our professional team to help you impress your audience. Each graphic in every slide is vector based and is 100% editable in powerpoint. Each and every property of any slide - color, size, shading etc can be modified to build an effective powerpoint presentation. Use these slides to convey complex business concepts in a simplified manner. Any text can be entered at any point in the powerpoint slide. Simply DOWNLOAD, TYPE and PRESENT! Our PowerPoint Template Executive Leadership Targets Umbrella Chart Ppt Layouts have an eclectic outlook. They are conducive to all customs.
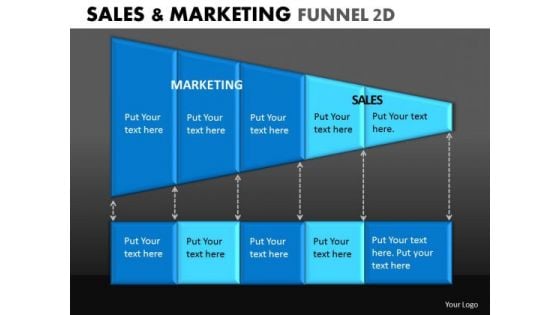
Fully Editable Funnel Chart Diagram For Business PowerPoint Slides
Fully_Editable_Funnel_Chart_Diagram_for_Business_PowerPoint_Slides-These high quality powerpoint pre-designed slides and powerpoint templates have been carefully created by our professional team to help you impress your audience. All slides have been created and are 100% editable in powerpoint. Each and every property of any graphic - color, size, orientation, shading, outline etc. can be modified to help you build an effective powerpoint presentation. Any text can be entered at any point in the powerpoint template or slide. Simply DOWNLOAD, TYPE and PRESENT!-These PowerPoint Presentation slides can be used to represent themes like-3d, arrow, art, blank, blue, business, buttons, channel, channeling, chart, clip, clipart, combine, compression, cone, conical, copy, diagram, flow, funnel, graphic, green, icon, illustration, isolated, management, merge, mix, perspective, pipe, process, project, set, space, stage, stages-Fully_Editable_Funnel_Chart_Diagram_for_Business_PowerPoint_Slides Ditch the blues with our Fully Editable Funnel Chart Diagram For Business PowerPoint Slides. Your thoughts will find joy.
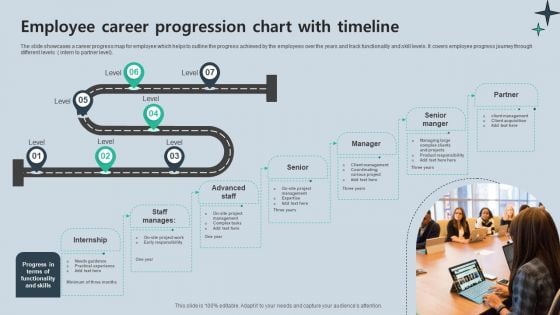
Employee Career Progression Chart With Timeline Inspiration PDF
The slide showcases a career progress map for employee which helps to outline the progress achieved by the employees over the years and track functionality and skill levels. It covers employee progress journey through different levels intern to partner level. Persuade your audience using this Employee Career Progression Chart With Timeline Inspiration PDF. This PPT design covers one stages, thus making it a great tool to use. It also caters to a variety of topics including Management, Product Responsibility, Various Project. Download this PPT design now to present a convincing pitch that not only emphasizes the topic but also showcases your presentation skills.
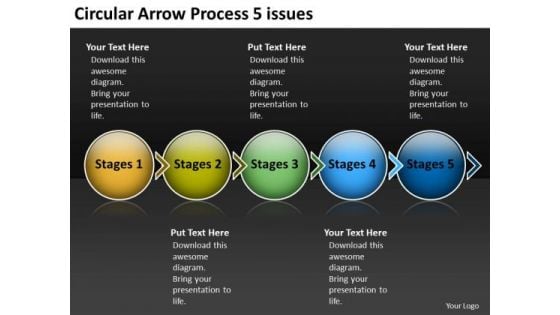
Circular Arrow Process 5 Issues Best Flow Chart PowerPoint Slides
We present our circular arrow process 5 issues best flow chart PowerPoint Slides. Use our Spheres PowerPoint Templates because, it is in your DNA to analyses possible causes to the minutest detail. Use our Arrows PowerPoint Templates because; demonstrate how you think out of the box. Use our Symbol PowerPoint Templates because; Give them an overview of your capability and insight into the minute details of the overall picture highlighting the interdependence at every operational level. Use our Marketing PowerPoint Templates because, you are going along well but your foresight shows that it may need a slight change in plans or direction. Use our Process and Flows PowerPoint Templates because, Stable ideas are the building blocks of a successful structure. Use these PowerPoint slides for presentations relating to Account, Arrow, Arrows, Away, Box, Business, Chart, Choice, Choose, Concept, Concepts, Consultation, Corporate, Design, Diagram, Direction, Elements, Flow, Follow, Follows, Future, Group, Grow, Increase, Lines, Many, Month, Move, Past, Period, Phase, Project, Report, Rise, Row, Step, Success, Spheres, Text, Time, Timeline, Today, Up, Way, Ways, Work, Year. The prominent colors used in the PowerPoint template are Yellow, Green, and Blue Exhort your team with our Circular Arrow Process 5 Issues Best Flow Chart PowerPoint Slides. Urge them on to go one better.
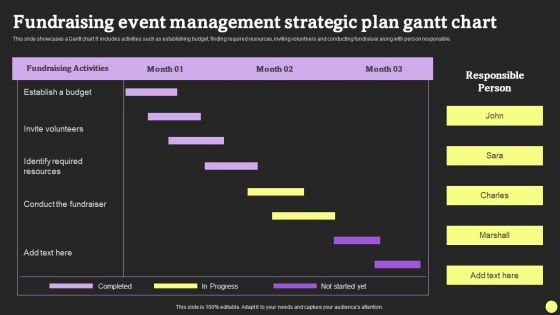
Fundraising Event Management Strategic Plan Gantt Chart Formats PDF
This slide showcases a Gantt chart It includes activities such as establishing budget, finding required resources, inviting volunteers and conducting fundraiser along with person responsible. Pitch your topic with ease and precision using this Fundraising Event Management Strategic Plan Gantt Chart Formats PDF. This layout presents information on Fundraising Activities, Invite Volunteers, Conduct The Fundraiser. It is also available for immediate download and adjustment. So, changes can be made in the color, design, graphics or any other component to create a unique layout.
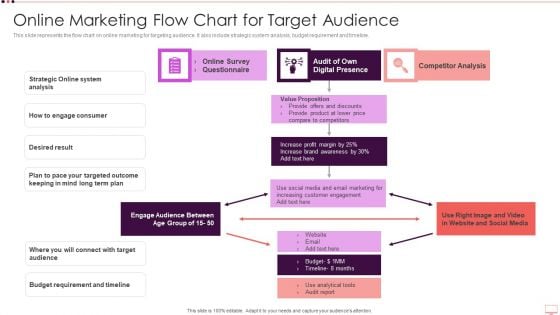
Online Marketing Flow Chart For Target Audience Slides PDF
This slide represents the flow chart on online marketing for targeting audience. It also include strategic system analysis, budget requirement and timeline. Showcasing this set of slides titled Online Marketing Flow Chart For Target Audience Slides PDF. The topics addressed in these templates are Plan, Consumer, System. All the content presented in this PPT design is completely editable. Download it and make adjustments in color, background, font etc. as per your unique business setting.
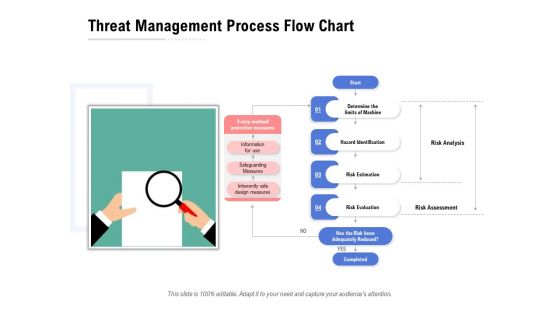
Threat Management Process Flow Chart Ppt PowerPoint Presentation Inspiration Structure
Presenting this set of slides with name threat management process flow chart ppt powerpoint presentation inspiration structure. This is a four stage process. The stages in this process are hazard identification, risk estimation, risk evaluation. This is a completely editable PowerPoint presentation and is available for immediate download. Download now and impress your audience.
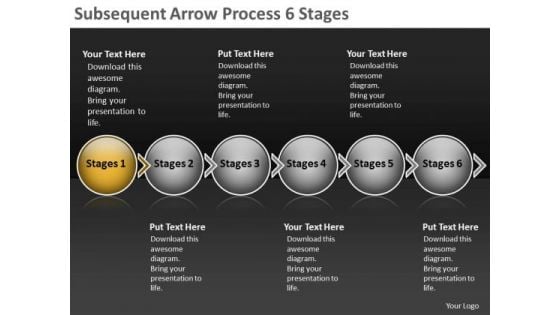
Subsequent Arrow Process 6 Stages Free Flow Chart Slides PowerPoint
We present our subsequent arrow process 6 stages free flow chart Slides PowerPoint. Use our Spheres PowerPoint Templates because, like your thoughts arrows are inherently precise and true. Use our Arrows PowerPoint Templates because, But you have the ideas, you have got a brainwave. Use our Symbol PowerPoint Templates because, Knowledge is power goes the popular saying. Use our Marketing PowerPoint Templates because; explain the contribution of each of the elements and how they provide impetus to the next phase. Use our Process and Flows PowerPoint Templates because, the alphabetical order is a time honored concept. Use these PowerPoint slides for presentations relating to Account, Arrow, Arrows, Away, Box, Business, Chart, Choice, Choose, Concept, Concepts, Consultation, Corporate, Design, Diagram, Direction, Elements, Flow, Follow, Follows, Future, Group, Grow, Increase, Lines, Many, Month, Move, Past, Period, Phase, Project, Report, Rise, Row, Step, Success, Spheres, Text, Time, Timeline, Today, Up, Way, Ways, Work, Year. The prominent colors used in the PowerPoint template are Yellow, Gray, and Black Deal with the matter in an even handed way. Continue to be cool with our Subsequent Arrow Process 6 Stages Free Flow Chart Slides PowerPoint.

PowerPoint Designs Corporate Teamwork Bridge Chart Ppt Layout
PowerPoint Designs Corporate Teamwork Bridge Chart PPT Layout-These high quality powerpoint pre-designed slides and powerpoint templates have been carefully created by our professional team to help you impress your audience. All slides have been created and are 100% editable in powerpoint. Each and every property of any graphic - color, size, orientation, shading, outline etc. can be modified to help you build an effective powerpoint presentation. Any text can be entered at any point in the powerpoint template or slide. Simply DOWNLOAD, TYPE and PRESENT! Exceed estimates with our PowerPoint Designs Corporate Teamwork Bridge Chart Ppt Layout. Your ideas will deliver a breakthrough.
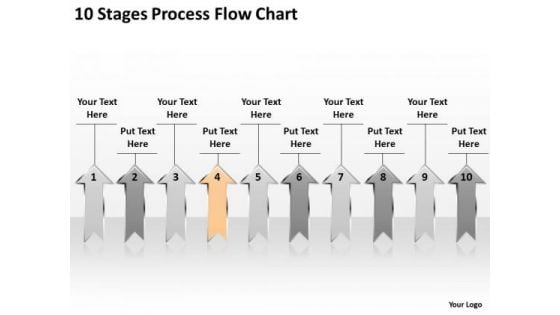
Explain Parallel Processing 10 Stages Flow Chart PowerPoint Templates
We present our explain parallel processing 10 stages flow chart PowerPoint templates.Download and present our Business PowerPoint Templates because Our PowerPoint Templates and Slides will let Your superior ideas hit the target always and everytime. Download and present our Arrows PowerPoint Templates because Our PowerPoint Templates and Slides will steer your racing mind. Hit the right buttons and spur on your audience. Present our Shapes PowerPoint Templates because You can Stir your ideas in the cauldron of our PowerPoint Templates and Slides. Cast a magic spell on your audience. Use our Success PowerPoint Templates because Our PowerPoint Templates and Slides are focused like a searchlight beam. They highlight your ideas for your target audience. Download and present our Signs PowerPoint Templates because You will get more than you ever bargained for. Use these PowerPoint slides for presentations relating to 3d, achievement, aim, arrows, business, career, chart, competition,development, direction, education, financial, forecast, forward, glossy, graph,group, growth, higher, icon, increase, investment, leader, leadership, moving,onwards, outlook, path, plan, prediction, price, profit, progress, property, race,sales, series, success, target, team, teamwork, turn, up, upwards, vector, win,winner. The prominent colors used in the PowerPoint template are Tan, Gray, White. We assure you our explain parallel processing 10 stages flow chart PowerPoint templates are designed by professionals PowerPoint presentation experts tell us our arrows PowerPoint templates and PPT Slides will save the presenter time. The feedback we get is that our explain parallel processing 10 stages flow chart PowerPoint templates look good visually. We assure you our chart PowerPoint templates and PPT Slides have awesome images to get your point across. PowerPoint presentation experts tell us our explain parallel processing 10 stages flow chart PowerPoint templates will make you look like a winner. We assure you our arrows PowerPoint templates and PPT Slides are specially created by a professional team with vast experience. They diligently strive to come up with the right vehicle for your brilliant Ideas. Factor it all in with our Explain Parallel Processing 10 Stages Flow Chart PowerPoint Templates. They account for every element.
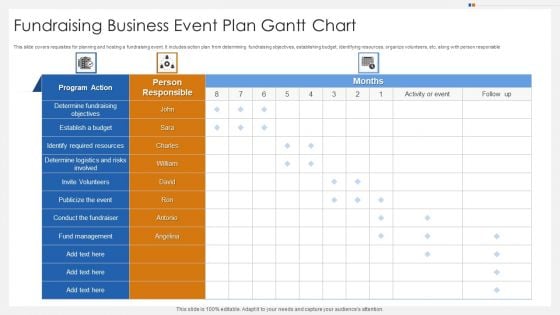
Fundraising Business Event Plan Gantt Chart Microsoft PDF
This slide covers requisites for planning and hosting a fundraising event. It includes action plan from determining fundraising objectives, establishing budget, identifying resources, organize volunteers, etc. along with person responsible. Pitch your topic with ease and precision using this Fundraising Business Event Plan Gantt Chart Microsoft PDF. This layout presents information on Establish A Budget, Fund Management, Identify Required Resources. It is also available for immediate download and adjustment. So, changes can be made in the color, design, graphics or any other component to create a unique layout.
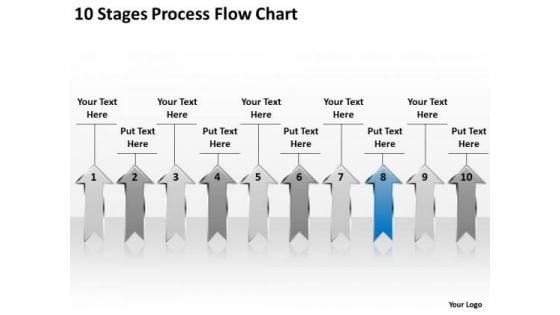
Example Of Parallel Processing 10 Stages Flow Chart PowerPoint Templates
We present our example of parallel processing 10 stages flow chart PowerPoint templates.Use our Business PowerPoint Templates because It can Conjure up grand ideas with our magical PowerPoint Templates and Slides. Leave everyone awestruck by the end of your presentation. Use our Arrows PowerPoint Templates because Our PowerPoint Templates and Slides will let you Hit the right notes. Watch your audience start singing to your tune. Download and present our Shapes PowerPoint Templates because You can Stir your ideas in the cauldron of our PowerPoint Templates and Slides. Cast a magic spell on your audience. Download and present our Success PowerPoint Templates because You can Create a matrix with our PowerPoint Templates and Slides. Feel the strength of your ideas click into place. Use our Signs PowerPoint Templates because Our PowerPoint Templates and Slides are the chords of your song. String them along and provide the lilt to your views.Use these PowerPoint slides for presentations relating to 3d, achievement, aim, arrows, business, career, chart, competition,development, direction, education, financial, forecast, forward, glossy, graph,group, growth, higher, icon, increase, investment, leader, leadership, moving,onwards, outlook, path, plan, prediction, price, profit, progress, property, race,sales, series, success, target, team, teamwork, turn, up, upwards, vector, win,winner. The prominent colors used in the PowerPoint template are Blue, Gray, White. We assure you our example of parallel processing 10 stages flow chart PowerPoint templates are the best it can get when it comes to presenting. PowerPoint presentation experts tell us our aim PowerPoint templates and PPT Slides look good visually. The feedback we get is that our example of parallel processing 10 stages flow chart PowerPoint templates will make the presenter look like a pro even if they are not computer savvy. We assure you our career PowerPoint templates and PPT Slides are designed by professionals PowerPoint presentation experts tell us our example of parallel processing 10 stages flow chart PowerPoint templates effectively help you save your valuable time. We assure you our competition PowerPoint templates and PPT Slides are specially created by a professional team with vast experience. They diligently strive to come up with the right vehicle for your brilliant Ideas. Our Example Of Parallel Processing 10 Stages Flow Chart PowerPoint Templates are really captivating. The audience will not take their eyes off you.
Business Organizational Chart Examples 3d Man With Sad PowerPoint Templates
We present our business organizational chart examples 3d man with sad PowerPoint templates.Present our People PowerPoint Templates because These PowerPoint Templates and Slides will give the updraft to your ideas. See them soar to great heights with ease. Use our Business PowerPoint Templates because You should Kick up a storm with our PowerPoint Templates and Slides. The heads of your listeners will swirl with your ideas. Download and present our Shapes PowerPoint Templates because Our PowerPoint Templates and Slides will provide weight to your words. They will bring out the depth of your thought process. Use our Marketing PowerPoint Templates because Our PowerPoint Templates and Slides offer you the needful to organise your thoughts. Use them to list out your views in a logical sequence. Download our Metaphors-Visual Concepts PowerPoint Templates because Our PowerPoint Templates and Slides will effectively help you save your valuable time. They are readymade to fit into any presentation structure. Use these PowerPoint slides for presentations relating to 3d, Cartoon, Character, Concept, Condolences, Consolation, Console, Counsel, Counselor, Depressed, Depression, Down, Emotion, Empathy, Encouragement, Friend, Grief, Health, Help, Idea, Isolated, Loss, Man, Mental, Mourn, People, Render, Sad, Sympathetic, Sympathize, Sympathy\n. The prominent colors used in the PowerPoint template are Red, White, Maroon. PowerPoint presentation experts tell us our business organizational chart examples 3d man with sad PowerPoint templates are second to none. Professionals tell us our Counselor PowerPoint templates and PPT Slides will help them to explain complicated concepts. People tell us our business organizational chart examples 3d man with sad PowerPoint templates will save the presenter time. Presenters tell us our Condolences PowerPoint templates and PPT Slides are designed by professionals Professionals tell us our business organizational chart examples 3d man with sad PowerPoint templates will help them to explain complicated concepts. We assure you our Concept PowerPoint templates and PPT Slides are effectively colour coded to prioritise your plans They automatically highlight the sequence of events you desire. Exceed estimates with our Business Organizational Chart Examples 3d Man With Sad PowerPoint Templates. Your ideas will deliver a breakthrough.
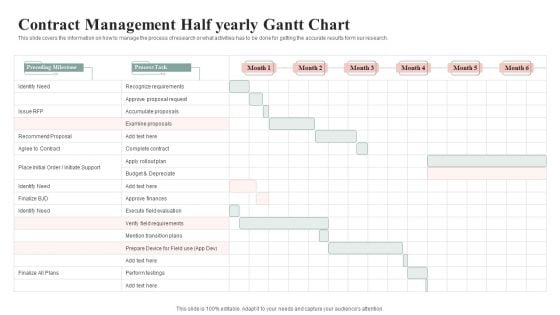
Contract Management Half Yearly Gantt Chart Mockup PDF
This slide covers the information on how to manage the process of research or what activities has to be done for getting the accurate results form our research. Pitch your topic with ease and precision using this Contract Management Half Yearly Gantt Chart Mockup PDF. This layout presents information on Recognize Requirements, Budget, Execute Field Evaluation. It is also available for immediate download and adjustment. So, changes can be made in the color, design, graphics or any other component to create a unique layout.
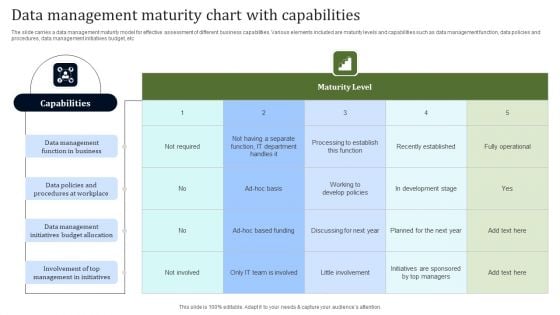
Data Management Maturity Chart With Capabilities Topics PDF
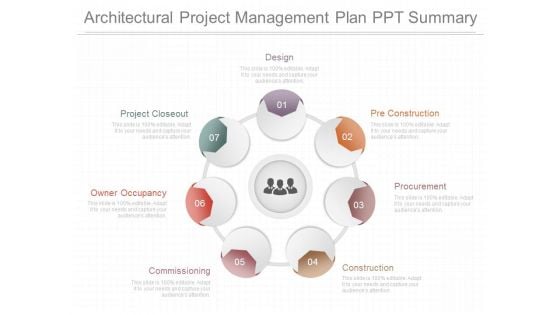
Architectural Project Management Plan Ppt Summary
This is a architectural project management plan ppt summary. This is a seven stage process. The stages in this process are design, project closeout, owner occupancy, commissioning, construction, procurement, pre construction.

Erp Project Metrics Plan Dashboard Slides PDF
This slide focuses on project management dashboard for enterprise resource planning which covers the total hours spent that includes project preparation, business blueprint, project realization, final preparation, go live and support with gantt chart showing detailed tasks. Pitch your topic with ease and precision using this Erp Project Metrics Plan Dashboard Slides PDF. This layout presents information on Business Blueprint, Project Preparation, Project Realization. It is also available for immediate download and adjustment. So, changes can be made in the color, design, graphics or any other component to create a unique layout.
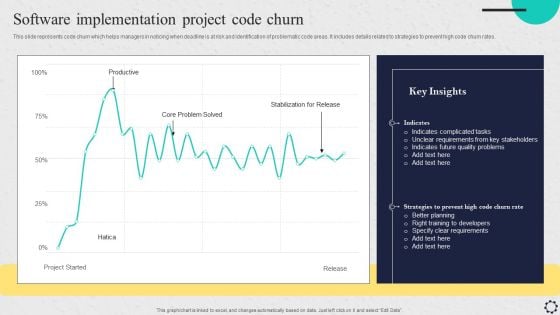
Software Implementation Project Code Churn Introduction PDF
This slide represents code churn which helps managers in noticing when deadline is at risk and identification of problematic code areas. It includes details related to strategies to prevent high code churn rates. This Software Implementation Project Code Churn Introduction PDF from Slidegeeks makes it easy to present information on your topic with precision. It provides customization options, so you can make changes to the colors, design, graphics, or any other component to create a unique layout. It is also available for immediate download, so you can begin using it right away. Slidegeeks has done good research to ensure that you have everything you need to make your presentation stand out. Make a name out there for a brilliant performance.
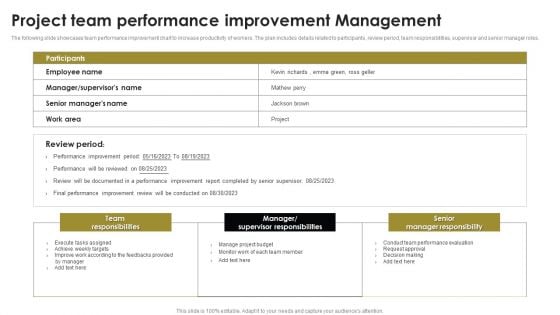
Project Team Performance Improvement Management Sample PDF
The following slide showcases team performance improvement chart to increase productivity of workers. The plan includes details related to participants, review period, team responsibilities, supervisor and senior manager roles. Pitch your topic with ease and precision using this Project Team Performance Improvement Management Sample PDF. This layout presents information on Team Responsibilities, Senior Manager Responsibility, Team Performance Evaluation. It is also available for immediate download and adjustment. So, changes can be made in the color, design, graphics or any other component to create a unique layout.
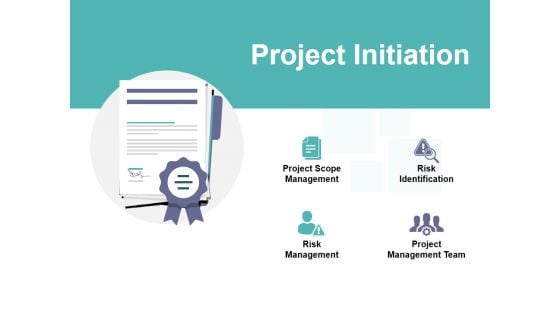
Project Initiation Ppt PowerPoint Presentation Slides Designs
This is a . This is a three stage process. The stages in this process are project scope management, risk identification, risk management, project management team.
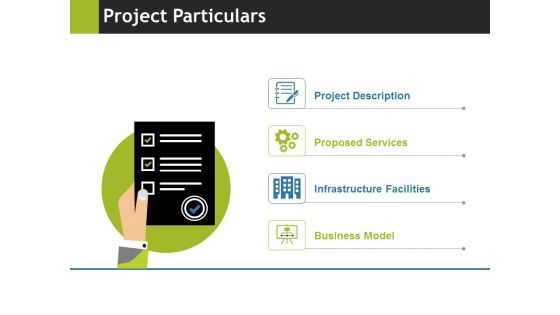
Project Particulars Ppt PowerPoint Presentation File Show
This is a project particulars ppt powerpoint presentation file show. This is a four stage process. The stages in this process are business, project description, proposed services, infrastructure facilities, business model.
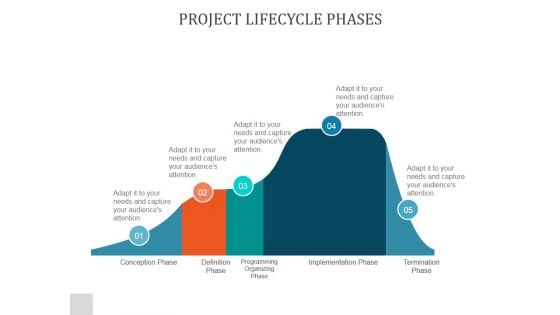
Project Lifecycle Phases Ppt PowerPoint Presentation Information
This is a project lifecycle phases ppt powerpoint presentation information. This is a five stage process. The stages in this process are conception phase, definition phase , programming organizing phase, implementation phase, termination phase.
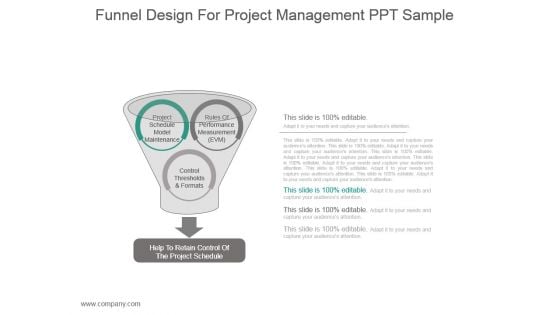
Funnel Design For Project Management Ppt Sample
This is a funnel design for project management ppt sample. This is a three stage process. The stages in this process are help to retain control of the project schedule, project schedule model maintenance rules of performance measurement evm, control thresholds and formats.

Project Description Ppt PowerPoint Presentation Gallery Brochure
This is a project description ppt powerpoint presentation gallery brochure. This is a five stage process. The stages in this process are agenda, business, management, marketing, planning.
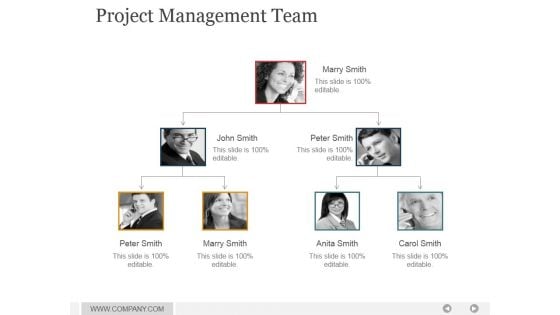
Project Management Team Ppt PowerPoint Presentation Guide
This is a project management team ppt powerpoint presentation guide. This is a three stage process. The stages in this process are john smith, marry smith, peter smith, peter smith, marry smith, anita smith, carol smith.
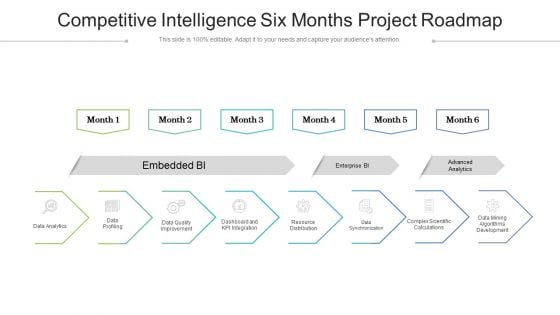
Competitive Intelligence Six Months Project Roadmap Graphics
We present our competitive intelligence six months project roadmap graphics. This PowerPoint layout is easy to edit so you can change the font size, font type, color, and shape conveniently. In addition to this, the PowerPoint layout is Google Slides compatible, so you can share it with your audience and give them access to edit it. Therefore, download and save this well researched competitive intelligence six months project roadmap graphics in different formats like PDF, PNG, and JPG to smoothly execute your business plan.
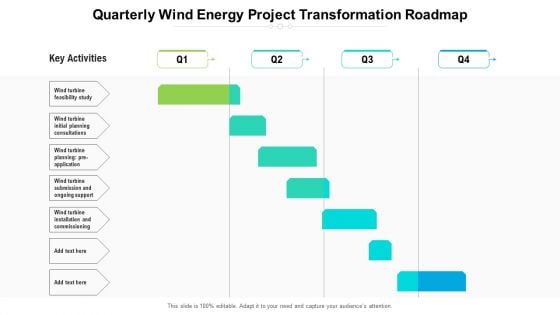
Quarterly Wind Energy Project Transformation Roadmap Diagrams
Introducing our quarterly wind energy project transformation roadmap diagrams. This PPT presentation is Google Slides compatible, therefore, you can share it easily with the collaborators for measuring the progress. Also, the presentation is available in both standard screen and widescreen aspect ratios. So edit the template design by modifying the font size, font type, color, and shapes as per your requirements. As this PPT design is fully editable it can be presented in PDF, JPG and PNG formats.


 Continue with Email

 Home
Home


