Project Organization Chart
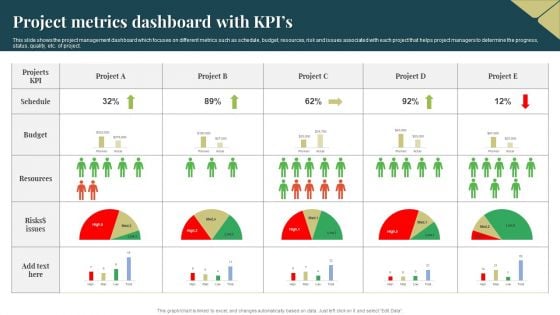
Project Metrics Dashboard With Kpis Ideas PDF
This slide shows the project management dashboard which focuses on different metrics such as schedule, budget, resources, risk and issues associated with each project that helps project managers to determine the progress, status, quality, etc. of project. Pitch your topic with ease and precision using this Project Metrics Dashboard With Kpis Ideas PDF. This layout presents information on Resources, Budget, Risks. It is also available for immediate download and adjustment. So, changes can be made in the color, design, graphics or any other component to create a unique layout.
Project Tracking Cost Tracker Dashboard Elements PDF
The following slide highlights the cost analysis of various projects to perform feasibility analysis. It includes budgeted versus actual cost, project wise cost and revenue allocation etc. Showcasing this set of slides titled Project Tracking Cost Tracker Dashboard Elements PDF. The topics addressed in these templates are Budgeted Costs, Resource Allocation, Project Costs. All the content presented in this PPT design is completely editable. Download it and make adjustments in color, background, font etc. as per your unique business setting.

Devops Project Incident Administration Dashboard Diagrams PDF
This slide depicts developer operations DevOps project incident management dashboard. It provides information about after hour, daytime, escalation policy, escalations made, etc. Showcasing this set of slides titled Devops Project Incident Administration Dashboard Diagrams PDF. The topics addressed in these templates are Devops Project Incident, Administration Dashboard. All the content presented in this PPT design is completely editable. Download it and make adjustments in color, background, font etc. as per your unique business setting.
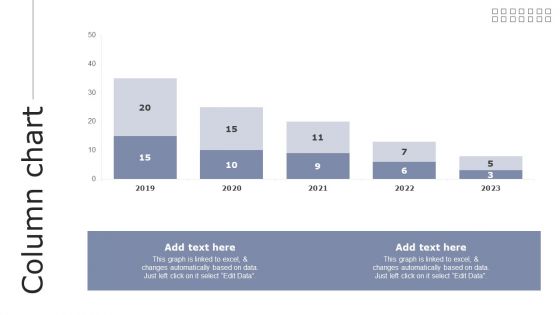
Column Chart Guide To Asset Cost Estimation Inspiration PDF
Do you have to make sure that everyone on your team knows about any specific topic I yes, then you should give Column Chart Guide To Asset Cost Estimation Inspiration PDF a try. Our experts have put a lot of knowledge and effort into creating this impeccable Column Chart Guide To Asset Cost Estimation Inspiration PDF. You can use this template for your upcoming presentations, as the slides are perfect to represent even the tiniest detail. You can download these templates from the Slidegeeks website and these are easy to edit. So grab these today.
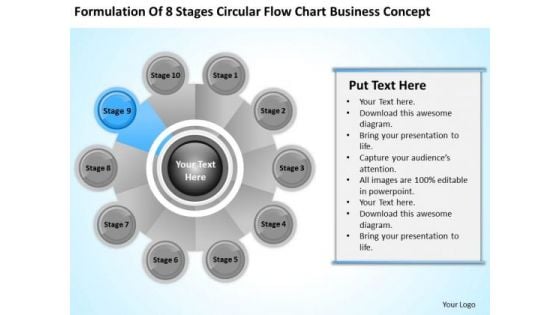
Business PowerPoint Examples Stages Circular Flow Chart Concept Templates
We present our business powerpoint examples stages circular flow chart concept templates.Use our Business PowerPoint Templates because Our PowerPoint Templates and Slides help you meet the demand of the Market. Just browse and pick the slides that appeal to your intuitive senses. Download and present our Circle Charts PowerPoint Templates because you can Add colour to your speech with our PowerPoint Templates and Slides. Your presentation will leave your audience speechless. Download our Shapes PowerPoint Templates because You will get more than you ever bargained for. Download our Process and Flows PowerPoint Templates because It will Give impetus to the hopes of your colleagues. Our PowerPoint Templates and Slides will aid you in winning their trust. Present our Leadership PowerPoint Templates because Our PowerPoint Templates and Slides have the Brilliant backdrops. Guaranteed to illuminate the minds of your audience.Use these PowerPoint slides for presentations relating to project, flow, process, business, system, success, chart, work, innovation, implementation, plan, concept, evaluation, presentation, symbol, internet, diagram, analysis, flowchart, analyzing, technology, idea, development, management, steps, strategy, addie, design, outcome, assessment, structure. The prominent colors used in the PowerPoint template are Blue light, Gray, White. Let them breathe in with our Business PowerPoint Examples Stages Circular Flow Chart Concept Templates. They will find your ideas easier to fathom.
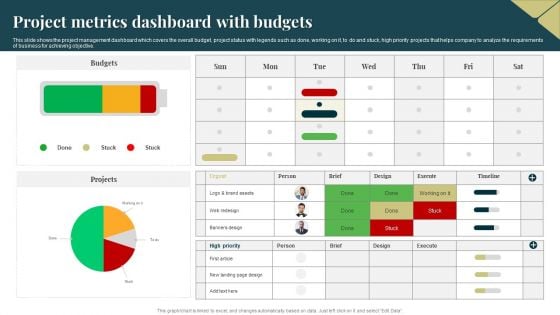
Project Metrics Dashboard With Budgets Topics PDF
This slide shows the project management dashboard which covers the overall budget, project status with legends such as done, working on it, to do and stuck, high priority projects that helps company to analyze the requirements of business for achieving objective. Pitch your topic with ease and precision using this Project Metrics Dashboard With Budgets Topics PDF. This layout presents information on Budgets, Projects, Banners Design. It is also available for immediate download and adjustment. So, changes can be made in the color, design, graphics or any other component to create a unique layout.
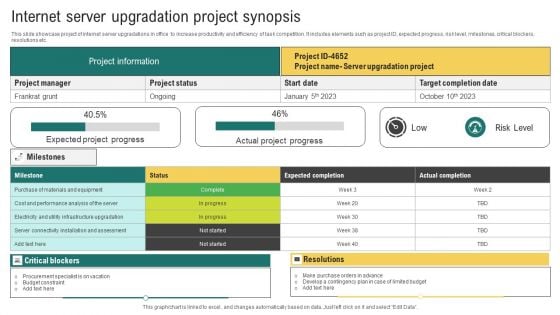
Internet Server Upgradation Project Synopsis Microsoft PDF
This slide showcase project of internet server upgradations in office to increase productivity and efficiency of task competition. It includes elements such as project ID, expected progress, risk level, milestones, critical blockers, resolutions etc. Showcasing this set of slides titled Internet Server Upgradation Project Synopsis Microsoft PDF. The topics addressed in these templates are Project Information, Server Upgradation Project, Expected Completion. All the content presented in this PPT design is completely editable. Download it and make adjustments in color, background, font etc. as per your unique business setting.
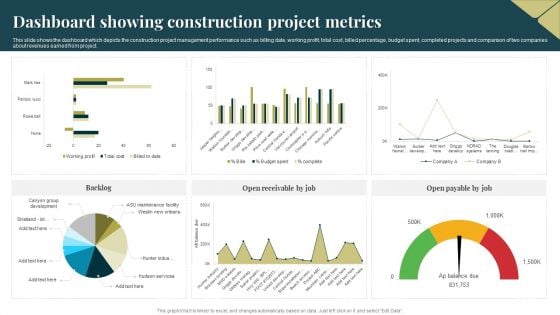
Dashboard Showing Construction Project Metrics Sample PDF
This slide shows the dashboard which depicts the construction project management performance such as billing date, working profit, total cost, billed percentage, budget spent, completed projects and comparison of two companies about revenues earned from project. Showcasing this set of slides titled Dashboard Showing Construction Project Metrics Sample PDF. The topics addressed in these templates are Dashboard, Construction Project Metrics. All the content presented in this PPT design is completely editable. Download it and make adjustments in color, background, font etc. as per your unique business setting.

Business Development Skills Business Development Skills Chart Slides
This is a business development skills business development skills chart slides. This is a eleven stage process. The stages in this process are entrepreneur, strategies, commercial, project, leadership, marketing, international, innovation, gestation, management, developer.
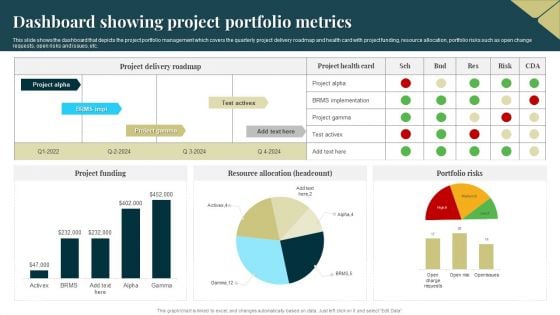
Dashboard Showing Project Portfolio Metrics Microsoft PDF
This slide shows the dashboard that depicts the project portfolio management which covers the quarterly project delivery roadmap and health card with project funding, resource allocation, portfolio risks such as open change requests, open risks and issues, etc. Pitch your topic with ease and precision using this Dashboard Showing Project Portfolio Metrics Microsoft PDF. This layout presents information on Resource Allocation, Portfolio Risks, Project Funding. It is also available for immediate download and adjustment. So, changes can be made in the color, design, graphics or any other component to create a unique layout.
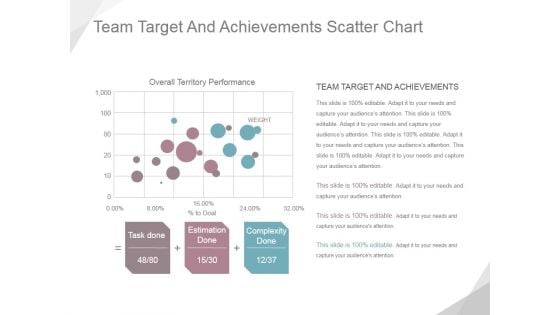
Team Target And Achievements Scatter Chart Ppt PowerPoint Presentation Example
This is a team target and achievements scatter chart ppt powerpoint presentation example. This is a three stage process. The stages in this process are overall territory performance, task done, estimation done, complexity done.
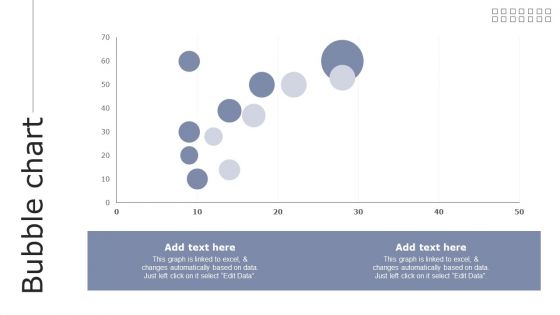
Bubble Chart Guide To Asset Cost Estimation Structure PDF
There are so many reasons you need a Bubble Chart Guide To Asset Cost Estimation Structure PDF. The first reason is you can not spend time making everything from scratch, Thus, Slidegeeks has made presentation templates for you too. You can easily download these templates from our website easily.
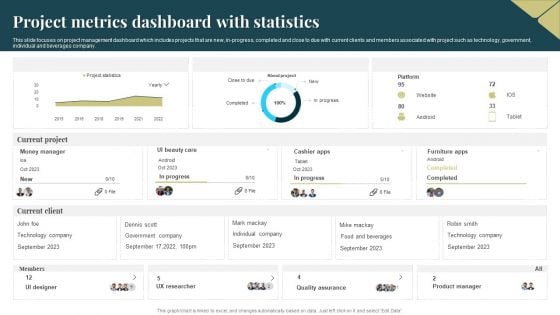
Project Metrics Dashboard With Statistics Slides PDF
This slide focuses on project management dashboard which includes projects that are new, in progress, completed and close to due with current clients and members associated with project such as technology, government, individual and beverages company. Showcasing this set of slides titled Project Metrics Dashboard With Statistics Slides PDF. The topics addressed in these templates are Quality Assurance, Product Manager, Technology. All the content presented in this PPT design is completely editable. Download it and make adjustments in color, background, font etc. as per your unique business setting.
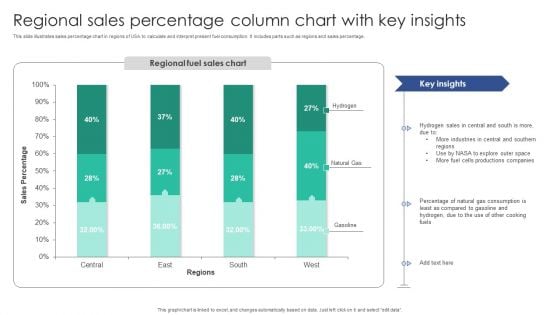
Regional Sales Percentage Column Chart With Key Insights Diagrams PDF
This slide illustrates sales percentage chart in regions of USA to calculate and interpret present fuel consumption. It includes parts such as regions and sales percentage.Pitch your topic with ease and precision using this Regional Sales Percentage Column Chart With Key Insights Diagrams PDF. This layout presents information on Industries Central, Sales Central, Productions Companies. It is also available for immediate download and adjustment. So, changes can be made in the color, design, graphics or any other component to create a unique layout.
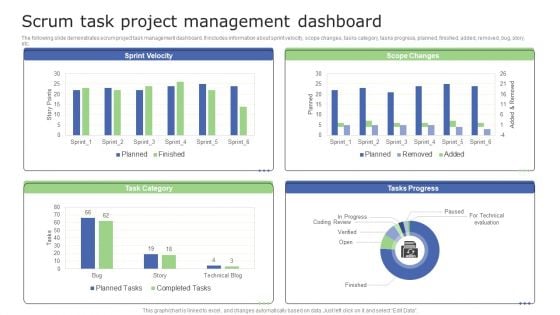
Scrum Task Project Management Dashboard Information PDF
The following slide demonstrates scrum project task management dashboard. It includes information about sprint velocity, scope changes, tasks category, tasks progress, planned, finished, added, removed, bug, story, etc. Pitch your topic with ease and precision using this Scrum Task Project Management Dashboard Information PDF. This layout presents information on Scrum Task Project, Management Dashboard. It is also available for immediate download and adjustment. So, changes can be made in the color, design, graphics or any other component to create a unique layout.
Performance Chart Business PowerPoint Templates And PowerPoint Backgrounds 0311
Microsoft PowerPoint Template and Background with business picture about analysis graph arrow and target Illustrate the essential elements of the project. Delve into the basic nature with our Performance Chart Business PowerPoint Templates And PowerPoint Backgrounds 0311.
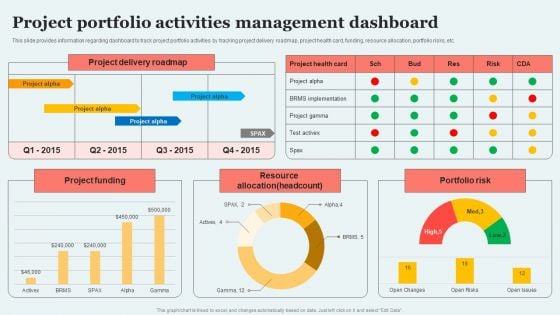
Project Portfolio Activities Management Dashboard Introduction PDF
This slide provides information regarding dashboard to track project portfolio activities by tracking project delivery roadmap, project health card, funding, resource allocation, portfolio risks, etc. This Project Portfolio Activities Management Dashboard Introduction PDF from Slidegeeks makes it easy to present information on your topic with precision. It provides customization options, so you can make changes to the colors, design, graphics, or any other component to create a unique layout. It is also available for immediate download, so you can begin using it right away. Slidegeeks has done good research to ensure that you have everything you need to make your presentation stand out. Make a name out there for a brilliant performance.
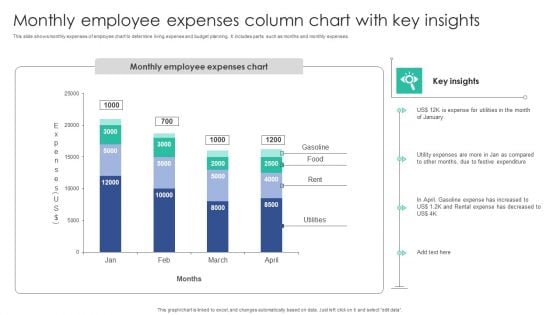
Monthly Employee Expenses Column Chart With Key Insights Download PDF
This slide shows monthly expenses of employee chart to determine living expense and budget planning. It includes parts such as months and monthly expenses.Showcasing this set of slides titled Monthly Employee Expenses Column Chart With Key Insights Download PDF. The topics addressed in these templates are Expense Utilities, Festive Expenditure, Gasoline Expense. All the content presented in this PPT design is completely editable. Download it and make adjustments in color, background, font etc. as per your unique business setting.

Digital Advertisement Spend Trend Chart By Industries Elements PDF
This slide depicts expenditure trends for digital advertising by top industries. It includes retail, automotive, financial services, telecom, consumer products, travel, healthcare, media, entertainment, etc. Showcasing this set of slides titled Digital Advertisement Spend Trend Chart By Industries Elements PDF. The topics addressed in these templates are Retail Sector, Total Budget, Chart By Industries. All the content presented in this PPT design is completely editable. Download it and make adjustments in color, background, font etc. as per your unique business setting.
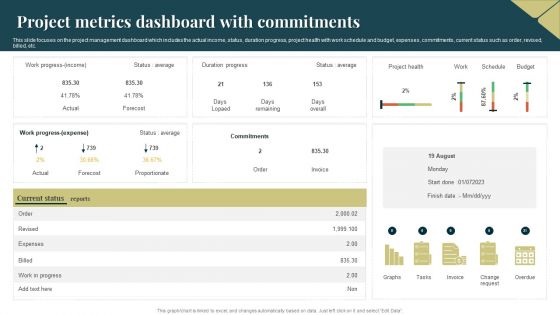
Project Metrics Dashboard With Commitments Mockup PDF
This slide focuses on the project management dashboard which includes the actual income, status, duration progress, project health with work schedule and budget, expenses, commitments, current status such as order, revised, billed, etc. Showcasing this set of slides titled Project Metrics Dashboard With Commitments Mockup PDF. The topics addressed in these templates are Expenses, Budget, Average. All the content presented in this PPT design is completely editable. Download it and make adjustments in color, background, font etc. as per your unique business setting.
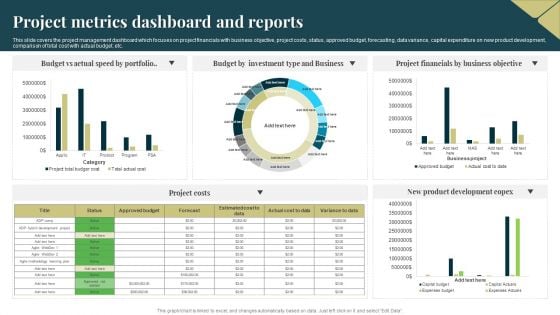
Project Metrics Dashboard And Reports Portrait PDF
This slide covers the project management dashboard which focuses on project financials with business objective, project costs, status, approved budget, forecasting, data variance, capital expenditure on new product development, comparison of total cost with actual budget, etc. Showcasing this set of slides titled Project Metrics Dashboard And Reports Portrait PDF. The topics addressed in these templates are Budget, Portfolio, Investment. All the content presented in this PPT design is completely editable. Download it and make adjustments in color, background, font etc. as per your unique business setting.
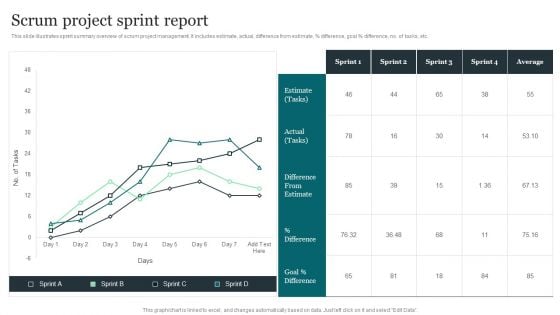
Scrum Project Sprint Report Guidelines PDF
This slide illustrates sprint summary overview of scrum project management. It includes estimate, actual, difference from estimate, percent difference, goal percent difference, no. of tasks, etc. Pitch your topic with ease and precision using this Scrum Project Sprint Report Guidelines PDF. This layout presents information on Scrum Project, Sprint Report. It is also available for immediate download and adjustment. So, changes can be made in the color, design, graphics or any other component to create a unique layout.
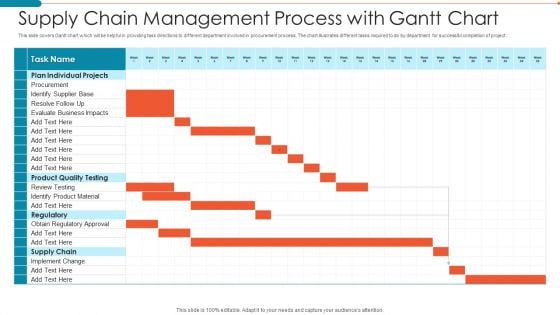
Supply Chain Management Process With Gantt Chart Ideas PDF
This slide covers Gantt chart which will be helpful in providing task directions to different department involved in procurement process. The chart illustrates different tasks required to do by department for successful completion of project.Showcasing this set of slides titled Supply Chain Management Process With Gantt Chart Ideas PDF. The topics addressed in these templates are Supply Chain Management Process With Gantt Chart. All the content presented in this PPT design is completely editable. Download it and make adjustments in color, background, font etc. as per your unique business setting.
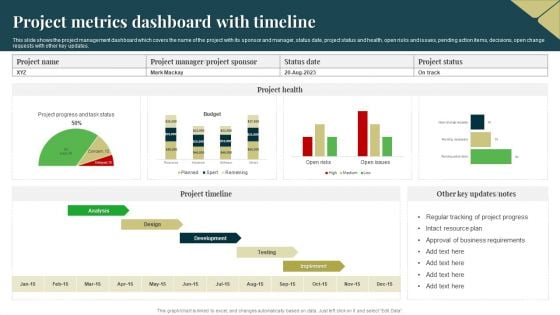
Project Metrics Dashboard With Timeline Themes PDF
This slide shows the project management dashboard which covers the name of the project with its sponsor and manager, status date, project status and health, open risks and issues, pending action items, decisions, open change requests with other key updates. Showcasing this set of slides titled Project Metrics Dashboard With Timeline Themes PDF. The topics addressed in these templates are Resource Plan, Business Requirements, Development. All the content presented in this PPT design is completely editable. Download it and make adjustments in color, background, font etc. as per your unique business setting.
Project Tracking Tracker Status Report Structure PDF
The following slide represents the status report for project tracking to assess key aspects of projects. It includes kpis such as schedule, budget, resources, risks, issues and quality etc. Showcasing this set of slides titled Project Tracking Tracker Status Report Structure PDF. The topics addressed in these templates are Budget, Quality, Risk And Issues. All the content presented in this PPT design is completely editable. Download it and make adjustments in color, background, font etc. as per your unique business setting.
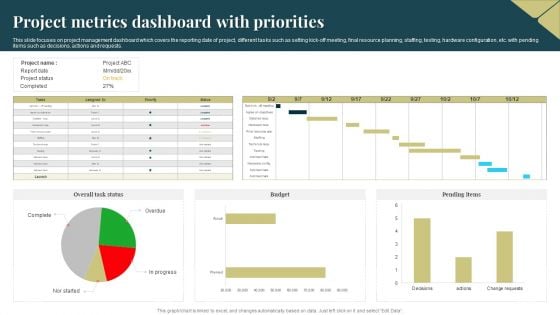
Project Metrics Dashboard With Priorities Formats PDF
This slide focuses on project management dashboard which covers the reporting date of project, different tasks such as setting kick-off meeting, final resource planning, staffing, testing, hardware configuration, etc. with pending items such as decisions, actions and requests. Showcasing this set of slides titled Project Metrics Dashboard With Priorities Formats PDF. The topics addressed in these templates are Budget, Project Metrics Dashboard. All the content presented in this PPT design is completely editable. Download it and make adjustments in color, background, font etc. as per your unique business setting.
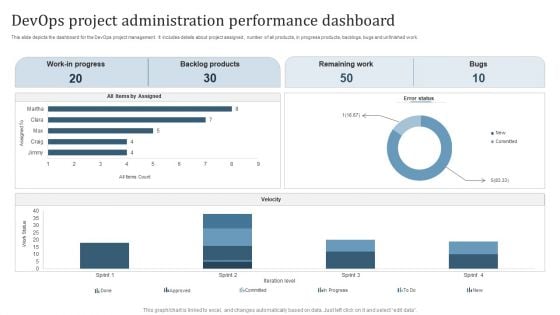
Devops Project Administration Performance Dashboard Themes PDF
This slide depicts the dashboard for the DevOps project management. It includes details about project assigned, number of all products, in progress products, backlogs, bugs and unfinished work. Pitch your topic with ease and precision using this Devops Project Administration Performance Dashboard Themes PDF. This layout presents information on Work In Progress, Backlog Products, Remaining Work, Bugs. It is also available for immediate download and adjustment. So, changes can be made in the color, design, graphics or any other component to create a unique layout.
Project Tracking Issue Tracker Dashboard Rules PDF
The following slide highlights the project tracking issues in project management to determine and resolve them quickly. It includes metrics such as issue summary, priorities, responsible head, reporting and closing date etc. Showcasing this set of slides titled Project Tracking Issue Tracker Dashboard Rules PDF. The topics addressed in these templates are Inappropriate Supplies, Project, Tracker Dashboard. All the content presented in this PPT design is completely editable. Download it and make adjustments in color, background, font etc. as per your unique business setting.
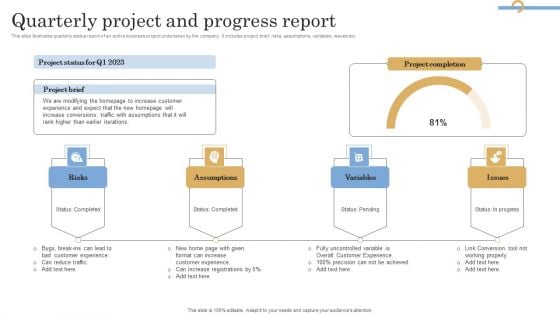
Quarterly Project And Progress Report Infographics PDF
This slide illustrates quarterly status report of an active business project undertaken by the company. it includes project brief, risks, assumptions, variables, issues etc. Showcasing this set of slides titled Quarterly Project And Progress Report Infographics PDF. The topics addressed in these templates are Risks, Assumptions, Variables. All the content presented in this PPT design is completely editable. Download it and make adjustments in color, background, font etc. as per your unique business setting.
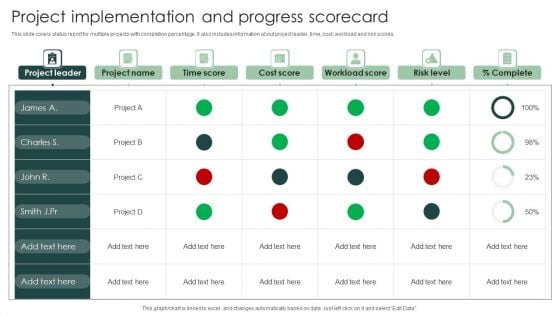
Project Implementation And Progress Scorecard Clipart PDF
This slide covers status report for multiple projects with completion percentage. It also includes information about project leader, time, cost, workload and risk scores. Showcasing this set of slides titled Project Implementation And Progress Scorecard Clipart PDF. The topics addressed in these templates are Cost Score, Workload Score, Risk Level. All the content presented in this PPT design is completely editable. Download it and make adjustments in color, background, font etc. as per your unique business setting.
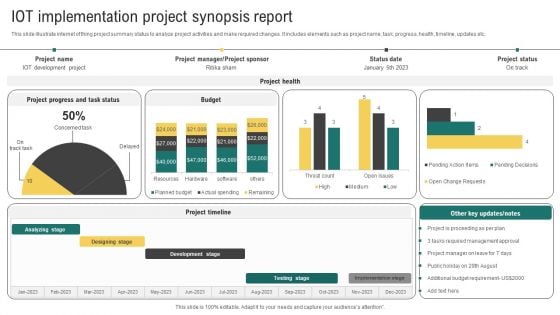
IOT Implementation Project Synopsis Report Summary PDF
This slide illustrate internet of thing project summary status to analyze project activities and make required changes. It includes elements such as project name, task, progress, health, timeline, updates etc. Pitch your topic with ease and precision using this IOT Implementation Project Synopsis Report Summary PDF. This layout presents information on Development Stage, Testing Stage, Implementation Stage. It is also available for immediate download and adjustment. So, changes can be made in the color, design, graphics or any other component to create a unique layout.
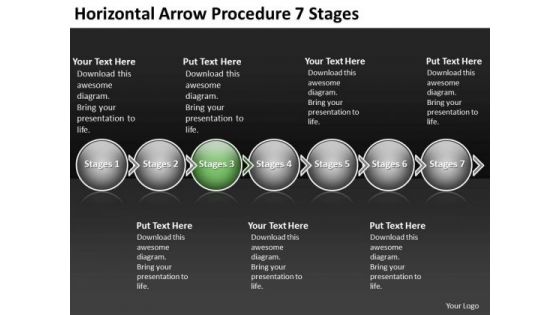
Horizontal Arrow Procedure 7 Stages Flow Chart PowerPoint Slides
We present our horizontal arrow procedure 7 stages flow chart PowerPoint Slides. Use our Leadership PowerPoint Templates because, explore the minutest detail of each concept and follow the trail to its conclusion. Use our Arrows PowerPoint Templates because, the foundation stones of many a life. Use our Circle Charts PowerPoint Templates because, discuss each one and slowly but surely move up the pyramid narrowing down to the best and most success oriented project. Use our Process and Flows PowerPoint Templates because, you know the path so show the way. Use our Shapes PowerPoint Templates because, are truly some of the wonders of our life. Use these PowerPoint slides for presentations relating to Arrow, business, circle, circular, collection, connection, cursor, decoration, design, dimensional, direction, element, icon, illustration, information, modern, motion, perspective, pointing, process, recycle, recycling, reflective, shape, shiny, sign, symbol, technology. The prominent colors used in the PowerPoint template are Green, White, and Gray The people behind our Horizontal Arrow Procedure 7 Stages Flow Chart PowerPoint Slides are an erudite lot. They are known to be very well read.
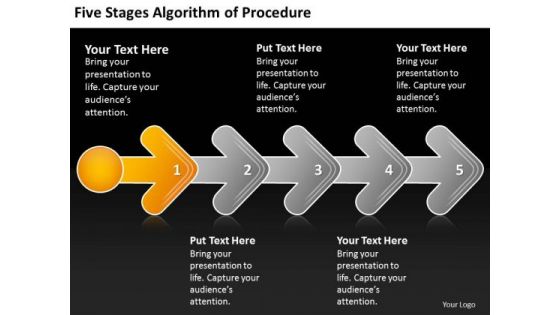
Five Stages Agorithm Of Procedure Flow Chart Description PowerPoint Templates
We present our five stages agorithm of procedure flow chart description PowerPoint templates.Download and present our Arrows PowerPoint Templates because clear thnking is your strength, transmit your thoughts to your eager team. Download our Shapes PowerPoint Templates because this slide is Designed to help bullet-point your views and thoughts. Present our Business PowerPoint Templates because like the famed William Tell, they put aside all emotions and concentrate on the target. Use our Circle Charts PowerPoint Templates because you should take your team soaring to the pinnacle they crave. Use our Process and Flows PowerPoint Templates because your foot is on the pedal and your company is purring along smoothly.Use these PowerPoint slides for presentations relating to 3d, action, algorithm, algorithmic, arrow, automatic, automation, block, calculation, chart, computer, cycle, development, diagram, digital, engineering, flow, flowchart, informatics, information, logic, mathematical, mathematics, operation, plan, procedure, process, program, programme, programming, scheme, science, software, solve, task, technology. The prominent colors used in the PowerPoint template are Orange, Gray, White. The feedback we get is that our five stages agorithm of procedure flow chart description PowerPoint templates are Delightful. PowerPoint presentation experts tell us our calculation PowerPoint templates and PPT Slides are Flirty. People tell us our five stages agorithm of procedure flow chart description PowerPoint templates are Elegant. Professionals tell us our arrow PowerPoint templates and PPT Slides are Multicolored. You can be sure our five stages agorithm of procedure flow chart description PowerPoint templates are Charming. We assure you our automatic PowerPoint templates and PPT Slides are Fabulous. Face up to facts with our Five Stages Agorithm Of Procedure Flow Chart Description PowerPoint Templates. Your thoughts will let the truth dominate.
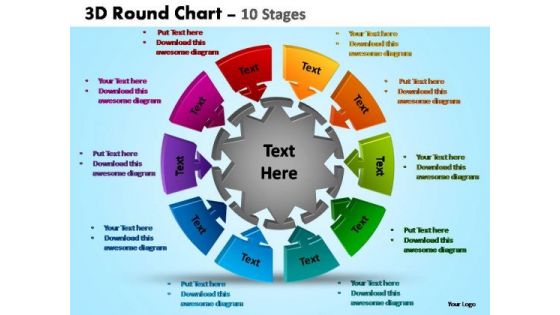
PowerPoint Slidelayout Diagram Pie Chart With Arrows Ppt Design
PowerPoint Slidelayout Diagram Pie Chart with Arrows PPT Design-These amazing PowerPoint pre-designed slides and PowerPoint templates have been carefully created by our team of experts to help you impress your audience. Our stunning collection of Powerpoint slides are 100% editable and can easily fit in any PowerPoint presentations. By using these animations and graphics in PowerPoint and you can easily make professional presentations. Any text can be entered at any point in the PowerPoint template or slide. Just DOWNLOAD our awesome PowerPoint templates and you are ready to go. Beat the budget with our PowerPoint Slidelayout Diagram Pie Chart With Arrows Ppt Design. Have enough to spare in the end.
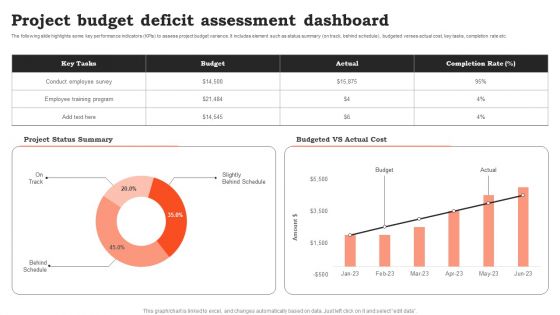
Project Budget Deficit Assessment Dashboard Brochure PDF
Pitch your topic with ease and precision using this Project Budget Deficit Assessment Dashboard Brochure PDF. This layout presents information on Project Budget, Deficit Assessment Dashboard. It is also available for immediate download and adjustment. So, changes can be made in the color, design, graphics or any other component to create a unique layout.
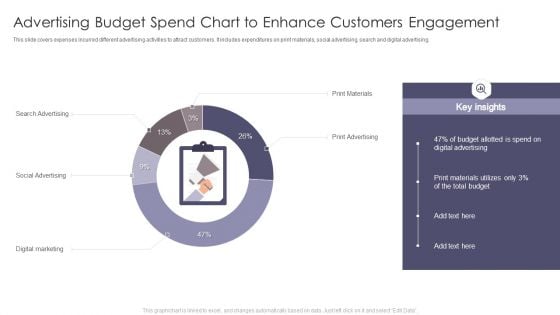
Advertising Budget Spend Chart To Enhance Customers Engagement Demonstration PDF
This slide covers expenses incurred different advertising activities to attract customers. It includes expenditures on print materials, social advertising, search and digital advertising. Showcasing this set of slides titled Advertising Budget Spend Chart To Enhance Customers Engagement Demonstration PDF. The topics addressed in these templates are Search Advertising, Print Materials. All the content presented in this PPT design is completely editable. Download it and make adjustments in color, background, font etc. as per your unique business setting.
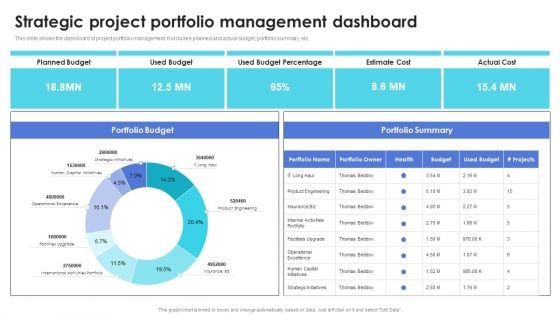
Strategic Project Portfolio Management Dashboard Download PDF
This slide shows the dashboard of project portfolio management. It includes planned and actual budget, portfolio summary, etc. Pitch your topic with ease and precision using this Strategic Project Portfolio Management Dashboard Download PDF. This layout presents information on Portfolio Budget, Portfolio Summary, Planned Budget. It is also available for immediate download and adjustment. So, changes can be made in the color, design, graphics or any other component to create a unique layout.
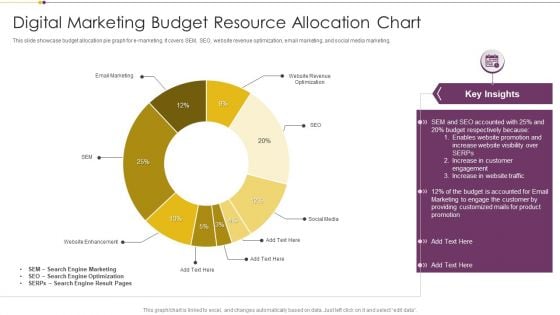
Digital Marketing Budget Resource Allocation Chart Download PDF
This slide showcase budget allocation pie graph for e marketing. It covers SEM, SEO, website revenue optimization, email marketing, and social media marketing. Pitch your topic with ease and precision using this Digital Marketing Budget Resource Allocation Chart Download PDF. This layout presents information on Search Engine Marketing, Search Engine Optimization, Budget. It is also available for immediate download and adjustment. So, changes can be made in the color, design, graphics or any other component to create a unique layout.
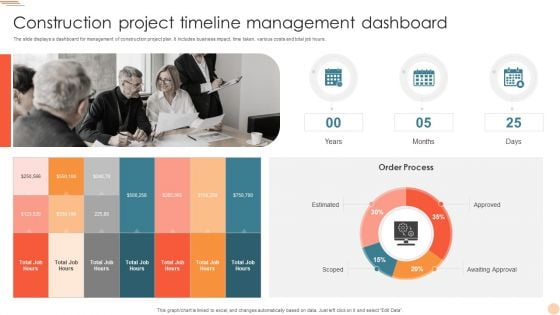
Construction Project Timeline Management Dashboard Clipart PDF
The slide displays a dashboard for management of construction project plan. It includes business impact, time taken, various costs and total job hours. Showcasing this set of slides titled Construction Project Timeline Management Dashboard Clipart PDF. The topics addressed in these templates are Order Process, Awaiting Approval, Months. All the content presented in this PPT design is completely editable. Download it and make adjustments in color, background, font etc. as per your unique business setting.
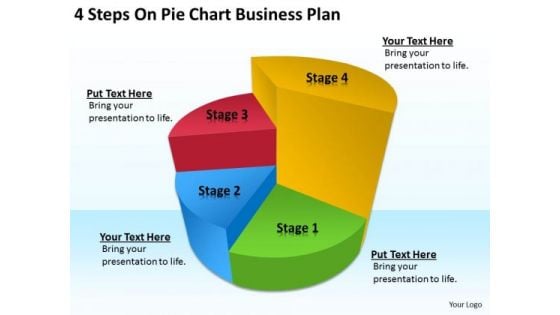
4 Steps On Pie Chart Business Plan Sample PowerPoint Templates
We present our 4 steps on pie chart business plan sample PowerPoint templates.Use our Flow Charts PowerPoint Templates because Your success is our commitment. Our PowerPoint Templates and Slides will ensure you reach your goal. Use our Process and Flows PowerPoint Templates because Our PowerPoint Templates and Slides will let you Hit the target. Go the full distance with ease and elan. Present our Marketing PowerPoint Templates because you can Set pulses racing with our PowerPoint Templates and Slides. They will raise the expectations of your team. Download our Success PowerPoint Templates because Our PowerPoint Templates and Slides help you meet the demand of the Market. Just browse and pick the slides that appeal to your intuitive senses. Download our Business PowerPoint Templates because Our PowerPoint Templates and Slides will let you Illuminate the road ahead to Pinpoint the important landmarks along the way.Use these PowerPoint slides for presentations relating to Chart, pie, bar, business, percent, forecasting, economy, piechart, white, achievement, future, sign, symbol, chartgraph, diagram, styles, finance, data, stock,report, marketing, analyzing, shape, graph, modern, economic, up, stair, money, solution, design, growth, colorful, progress, profit, inspiration,background, investment, successful, growthbusiness, prosperity, improvement, financial, concepts, structure, ideas. The prominent colors used in the PowerPoint template are Red, Yellow, Blue. Our 4 Steps On Pie Chart Business Plan Sample PowerPoint Templates are like angels. They take extraordinary care of your thoughts.
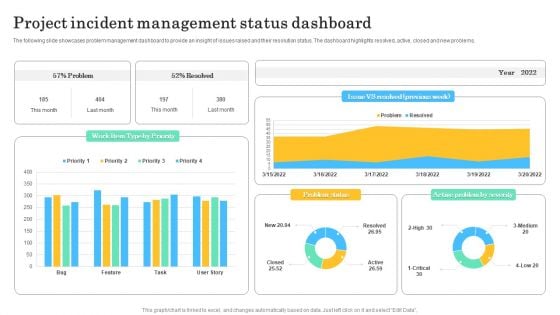
Project Incident Management Status Dashboard Sample PDF
The following slide showcases problem management dashboard to provide an insight of issues raised and their resolution status. The dashboard highlights resolved, active, closed and new problems. Pitch your topic with ease and precision using this Project Incident Management Status Dashboard Sample PDF. This layout presents information on Project Incident, Management Status Dashboard. It is also available for immediate download and adjustment. So, changes can be made in the color, design, graphics or any other component to create a unique layout.
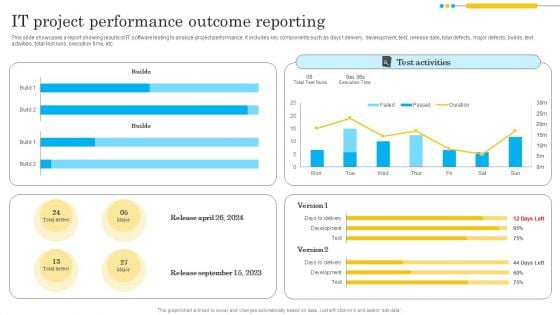
IT Project Performance Outcome Reporting Template PDF
This slide showcases a report showing results of IT software testing to analyze project performance. It includes key components such as days t delivery, development, test, release date, total defects, major defects, builds, test activities, total test runs, execution time, etc. Showcasing this set of slides titled IT Project Performance Outcome Reporting Template PDF. The topics addressed in these templates are Test Activities, Builds, Project Performance. All the content presented in this PPT design is completely editable. Download it and make adjustments in color, background, font etc. as per your unique business setting.
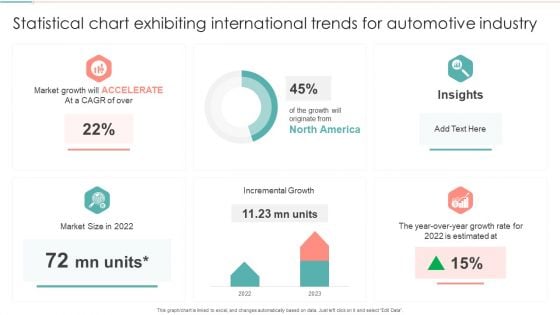
Statistical Chart Exhibiting International Trends For Automotive Industry Mockup PDF
Showcasing this set of slides titled Statistical Chart Exhibiting International Trends For Automotive Industry Mockup PDF. The topics addressed in these templates are Market Growth, Incremental Growth, Growth Estimated. All the content presented in this PPT design is completely editable. Download it and make adjustments in color, background, font etc. as per your unique business setting.
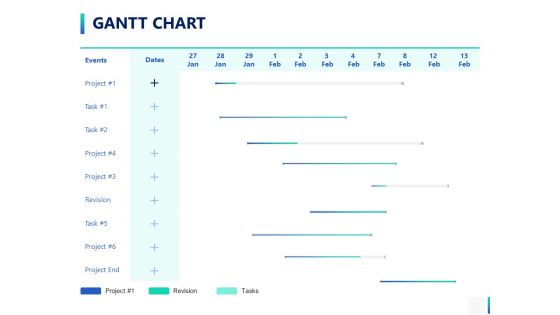
Gantt Chart Management Ppt PowerPoint Presentation Infographic Template Designs
Presenting this set of slides with name gantt chart management ppt powerpoint presentation infographic template designs. The topics discussed in these slide is project, revision, tasks. This is a completely editable PowerPoint presentation and is available for immediate download. Download now and impress your audience.
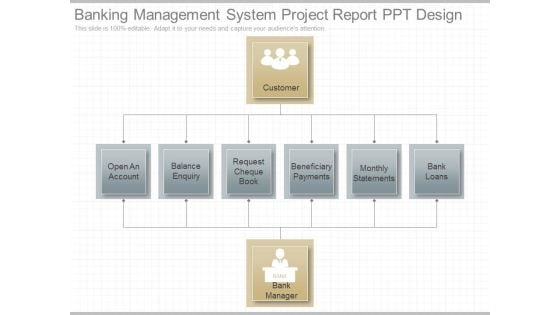
Banking Management System Project Report Ppt Design
This is a banking management system project report ppt design. This is a eight stage process. The stages in this process are customer, open an account, balance enquiry, request cheque book, beneficiary payments, monthly statements, bank loans, bank manager.
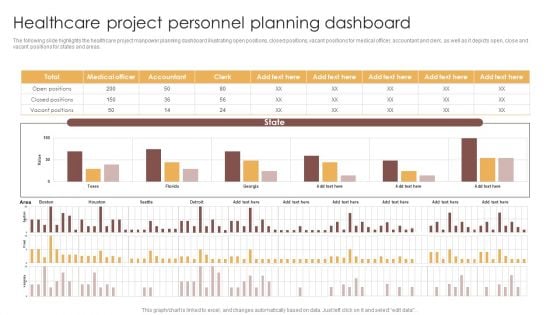
Healthcare Project Personnel Planning Dashboard Designs PDF
The following slide highlights the healthcare project manpower planning dashboard illustrating open positions, closed positions, vacant positions for medical officer, accountant and clerk, as well as it depicts open, close and vacant positions for states and areas. Showcasing this set of slides titled Healthcare Project Personnel Planning Dashboard Designs PDF. The topics addressed in these templates are Total, Medical Officer, Accountant. All the content presented in this PPT design is completely editable. Download it and make adjustments in color, background, font etc. as per your unique business setting.
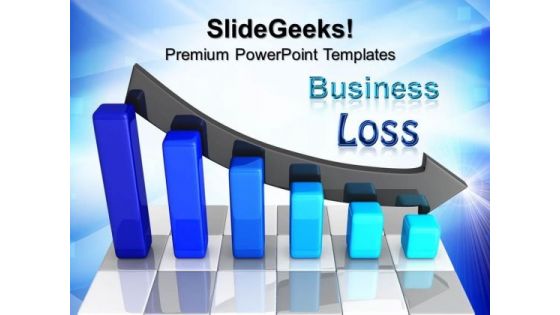
Loss Chart Business PowerPoint Templates And PowerPoint Themes 0812
Loss Chart Business PowerPoint Templates And PowerPoint Themes 0812-Microsoft Powerpoint Templates and Background with business failure graph down arrow Calculate your growing success with our Loss Chart Business PowerPoint Templates And PowerPoint Themes 0812. You will come out on top.
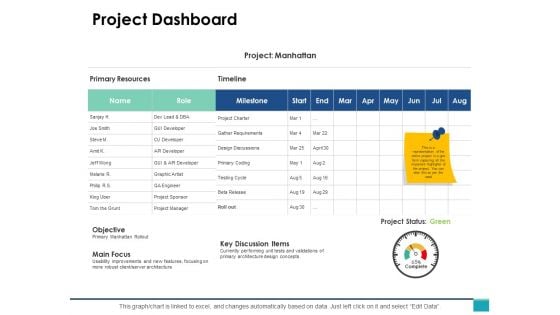
Project Dashboard Ppt PowerPoint Presentation Show Samples
This is a project dashboard ppt powerpoint presentation show samples. The topics discussed in this diagram are business, management, marketing, dashboard. This is a completely editable PowerPoint presentation, and is available for immediate download.
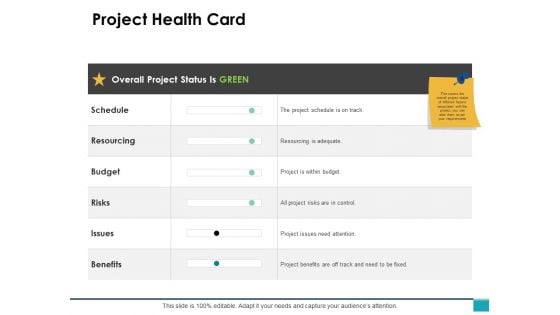
Project Health Card Ppt PowerPoint Presentation Clipart
This is a project health card ppt powerpoint presentation clipart. The topics discussed in this diagram are finance, marketing, management, investment. This is a completely editable PowerPoint presentation, and is available for immediate download.
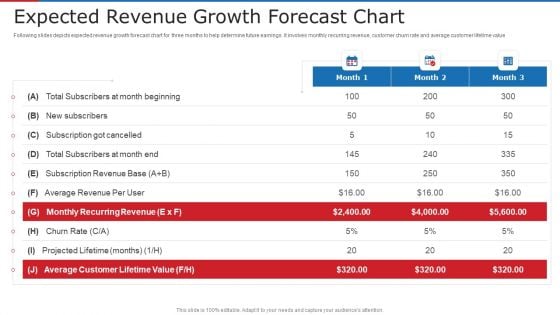
Expected Revenue Growth Forecast Chart Ppt Professional Graphics Tutorials PDF
Following slides depicts expected revenue growth forecast chart for three months to help determine future earnings. It involves monthly recurring revenue, customer churn rate and average customer lifetime value Deliver an awe inspiring pitch with this creative expected revenue growth forecast chart ppt professional graphics tutorials pdf bundle. Topics like average, revenue, rate can be discussed with this completely editable template. It is available for immediate download depending on the needs and requirements of the user.
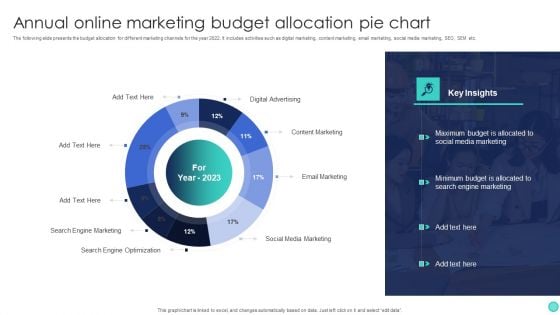
Annual Online Marketing Budget Allocation Pie Chart Pictures PDF
The following slide presents the budget allocation for different marketing channels for the year 2022. It includes activities such as digital marketing, content marketing, email marketing, social media marketing, SEO, SEM etc. Showcasing this set of slides titled Annual Online Marketing Budget Allocation Pie Chart Pictures PDF. The topics addressed in these templates are Digital Advertising, Content Marketing, Email Marketing, Social Media Marketing, Search Engine Optimization. All the content presented in this PPT design is completely editable. Download it and make adjustments in color, background, font etc. as per your unique business setting.
Product Marketing And Promotional Budget Spends Pie Chart Icons PDF
This slide covers marketing expenditures from budget allotted. It includes percentages for online advertising, sales training, conventions, trade shows, print advertising, publications, radio advertisements, magazines, catalogues and brochures. Pitch your topic with ease and precision using this Product Marketing And Promotional Budget Spends Pie Chart Icons PDF. This layout presents information on Conventions Were Maximum, Drive Maximum, Profit And Sales. It is also available for immediate download and adjustment. So, changes can be made in the color, design, graphics or any other component to create a unique layout.
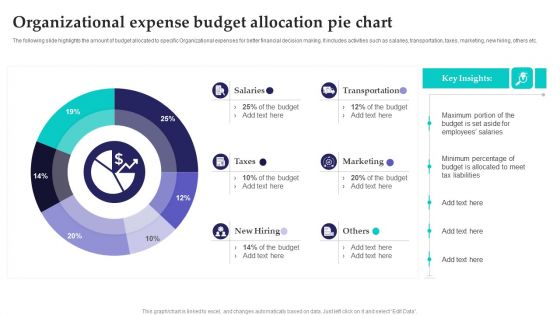
Organizational Expense Budget Allocation Pie Chart Inspiration PDF
The following slide highlights the amount of budget allocated to specific Organizational expenses for better financial decision making. It includes activities such as salaries, transportation, taxes, marketing, new hiring, others etc. Pitch your topic with ease and precision using this Organizational Expense Budget Allocation Pie Chart Inspiration PDF. This layout presents information on Transportation, Marketing, Budget. It is also available for immediate download and adjustment. So, changes can be made in the color, design, graphics or any other component to create a unique layout.
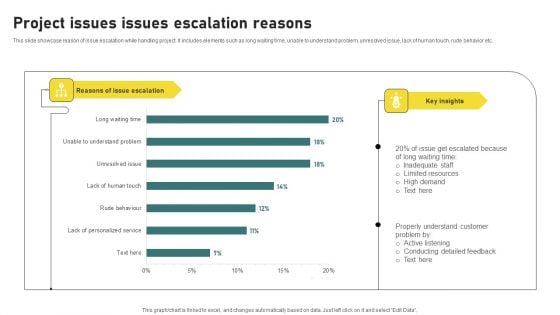
Project Issues Issues Escalation Reasons Information PDF
This slide showcase reason of issue escalation while handling project. It includes elements such as long waiting time, unable to understand problem, unresolved issue, lack of human touch, rude behavior etc. Showcasing this set of slides titled Project Issues Issues Escalation Reasons Information PDF. The topics addressed in these templates are Inadequate Staff, High Demand. All the content presented in this PPT design is completely editable. Download it and make adjustments in color, background, font etc. as per your unique business setting.
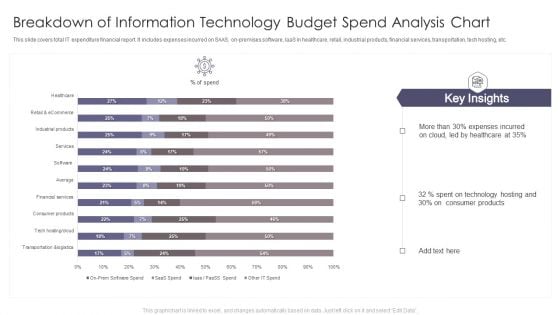
Breakdown Of Information Technology Budget Spend Analysis Chart Download PDF
This slide covers total IT expenditure financial report. It includes expenses incurred on SAAS, on-premises software, laaS in healthcare, retail, industrial products, financial services, transportation, tech hosting, etc. Pitch your topic with ease and precision using this Breakdown Of Information Technology Budget Spend Analysis Chart Download PDF. This layout presents information on Expenses Incurred, Technology Hosting, Consumer Products. It is also available for immediate download and adjustment. So, changes can be made in the color, design, graphics or any other component to create a unique layout.
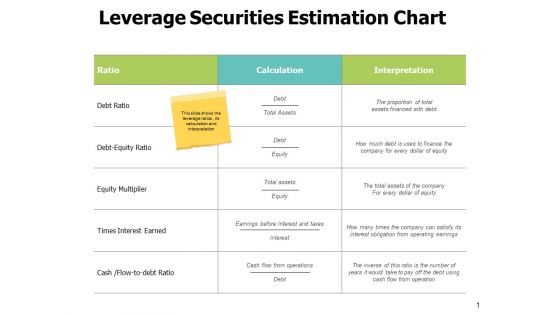
Leverage Securities Estimation Chart Ppt PowerPoint Presentation Professional Structure
This is a leverage securities estimation chart ppt powerpoint presentation professional structure. This is a three stage process. The stages in this process are compare, marketing, business, management, planning.
Calculating And Analyzing Share Market On Chart Icon Summary PDF
Presenting calculating and analyzing share market on chart icon summary pdf to dispense important information. This template comprises one stages. It also presents valuable insights into the topics including calculating and analyzing share market on chart icon. This is a completely customizable PowerPoint theme that can be put to use immediately. So, download it and address the topic impactfully.
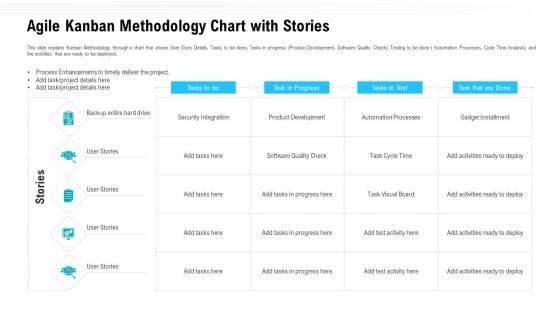
Agile Kanban Methodology Chart With Stories Ppt Model Show PDF
This slide explains Kanban Methodology through a chart that shows User Story Details, Tasks to be done, Tasks in progress Product Development, Software Quality Check, Testing to be done Automation Processes, Cycle Time Analysis and the activities that are ready to be deployed. Deliver an awe inspiring pitch with this creative agile kanban methodology chart with stories ppt model show pdf bundle. Topics like product development, process enhancements to timely deliver the project, agile kanban methodology chart with stories can be discussed with this completely editable template. It is available for immediate download depending on the needs and requirements of the user.
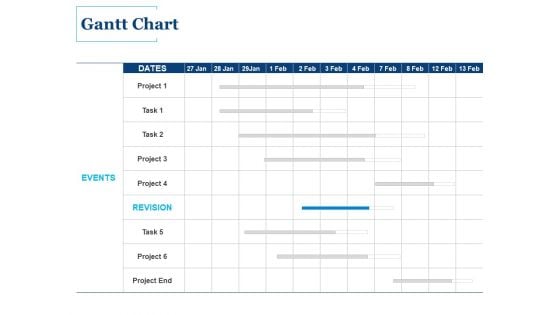
Gantt Chart Revision Ppt PowerPoint Presentation Pictures Professional
Presenting this set of slides with name gantt chart revision ppt powerpoint presentation pictures professional. The topics discussed in these slides are events, revision, project. This is a completely editable PowerPoint presentation and is available for immediate download. Download now and impress your audience.
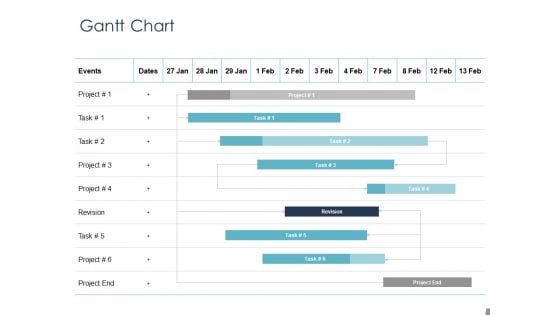
Job Estimate Gantt Chart Ppt Ideas Visuals PDF
Presenting this set of slides with name job estimate gantt chart ppt ideas visuals pdf. The topics discussed in these slides are gantt chart. This is a completely editable PowerPoint presentation and is available for immediate download. Download now and impress your audience.


 Continue with Email

 Home
Home


