Project Phases

Product Development Concepts Diagram Powerpoint Slides
This is a product development concepts diagram powerpoint slides. This is a six stage process. The stages in this process are contact, project release, review, deliver, schematic entry, design.
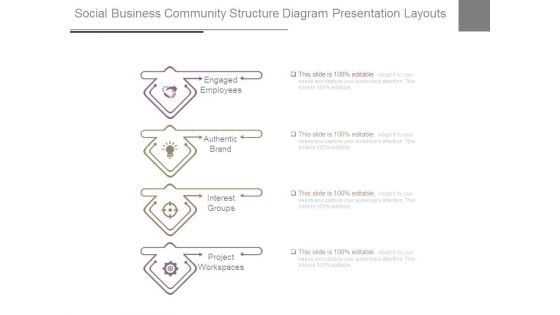
Social Business Community Structure Diagram Presentation Layouts
This is a social business community structure diagram presentation layouts. This is a four stage process. The stages in this process are engaged employees, authentic brand, interest groups, project workspaces.
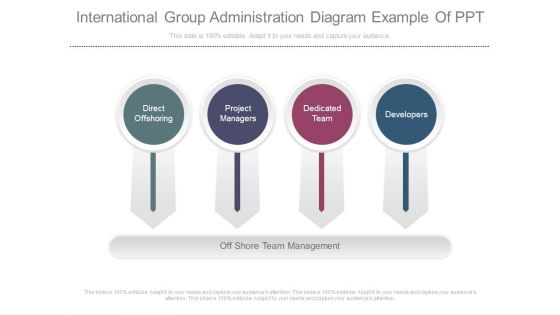
International Group Administration Diagram Example Of Ppt
This is a International Group Administration Diagram Example Of Ppt. This is a four stage process. The stages in this process are direct offshoring, project managers, dedicated team, developers.
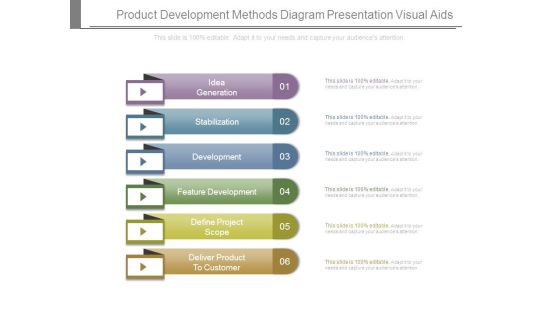
Product Development Methods Diagram Presentation Visual Aids
This is a product development methods diagram presentation visual aids. This is a six stage process. The stages in this process are idea generation, stabilization, development, feature development, define project scope, deliver product to customer.
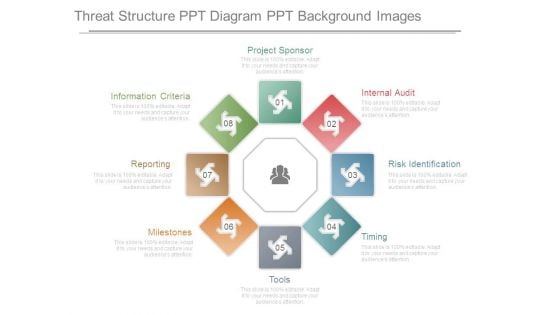
Threat Structure Ppt Diagram Ppt Background Images
This is a threat structure ppt diagram ppt background images. This is a eight stage process. The stages in this process are project sponsor, internal audit, risk identification, timing, tools, milestones, reporting, information criteria.
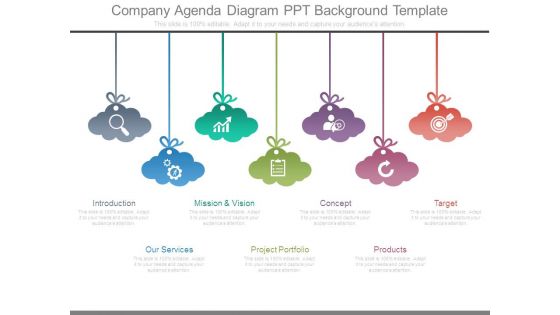
Company Agenda Diagram Ppt Background Template
This is a Company Agenda Diagram Ppt Background Template. This is a seven stage process. The stages in this process are introduction, our services, mission and vision, project portfolio, concept, products, target.
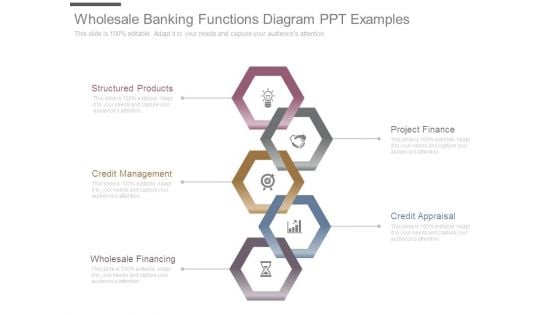
Wholesale Banking Functions Diagram Ppt Examples
This is a wholesale banking functions diagram ppt examples. This is a five stage process. The stages in this process are structured products, credit management, wholesale financing, project finance, credit appraisal.
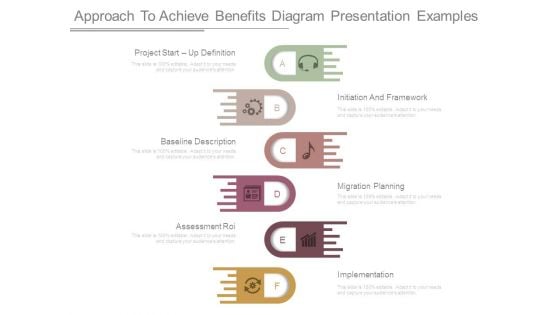
Approach To Achieve Benefits Diagram Presentation Examples
This is a approach to achieve benefits diagram presentation examples. This is a six stage process. The stages in this process are project start up definition, baseline description, assessment roi, initiation and framework, migration planning, implementation.
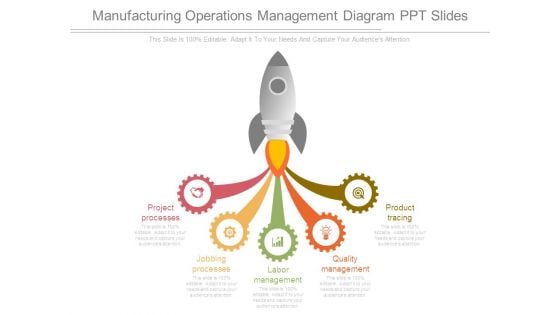
Manufacturing Operations Management Diagram Ppt Slides
This is a manufacturing operations management diagram ppt slides. This is a five stage process. The stages in this process are project processes, jobbing processes, labor management, quality management, product tracing.
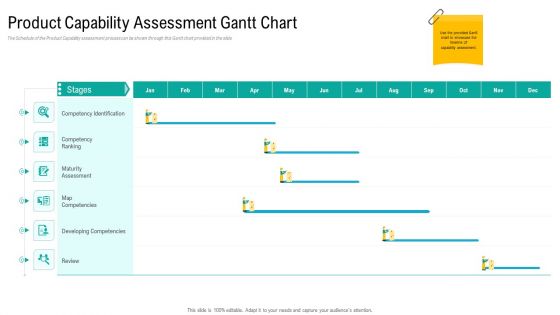
Product USP Product Capability Assessment Gantt Chart Ppt Infographics Pictures PDF
The Schedule of the Product Capability assessment process can be shown through this Gantt chart provided in the slide. Elucidate your project plan using our product usp product capability assessment gantt chart ppt infographics pictures pdf. Capture the timeframe for every release by outlining crucial details like project beginning and end date, status, and assigned team. Establish coordination with other team members, share your product plans, and discuss the project progress with the executives using this template. Furthermore, this task management chart helps you align your activities efficiently. Utilize the versatile nature of this template to initiate high-level resource planning and implement it flexibly for the benefit of your business. The slide is easy-to-edit so download it and schedule your projects resourcefully.
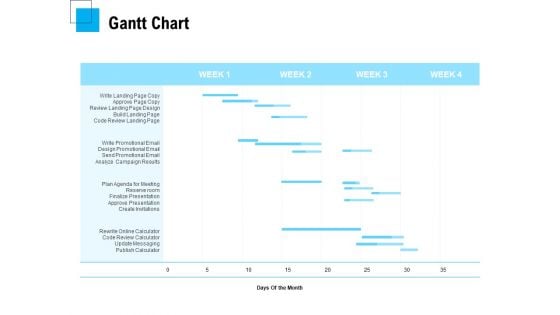
Freelancer RFP Gantt Chart Ppt PowerPoint Presentation Gallery Graphic Tips PDF
Our Gantt Chart PowerPoint Template is a modern and professional layout designed to create some of the vital components that help you to create timelines, roadmaps, project plans, etc. Communicate your project activity durations, milestones, tasks, subtasks, dependencies and other attributes with this content-ready PowerPoint template. Further, showcase precedence against time by employing this fully editable PowerPoint chart into your business tasks. With a single glance at this resourceful PPT layout, the audiences can get a complete overview of the tasks, duration, resources employed, and overlapping of the activities in a particular project, making it an ideal choice for project managers and leaders. Not only this, but the color scheme of this template is also such that it is sure to impress your audience, no matter which niche they
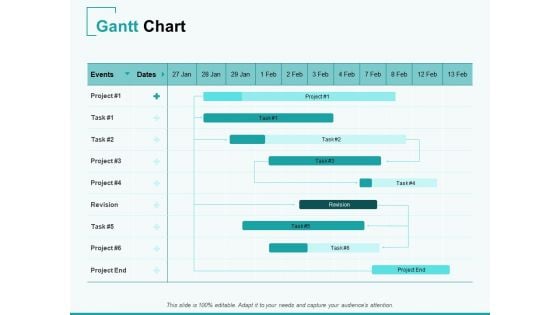
Home Remodeling Proposal Gantt Chart Ppt PowerPoint Presentation Slides Example Topics PDF
Our Gantt Chart PowerPoint Template is a modern and professional layout designed to create some of the vital components that help you to create timelines, roadmaps, project plans, etc. Communicate your project activity durations, milestones, tasks, subtasks, dependencies and other attributes with this content-ready PowerPoint template. Further, showcase precedence against time by employing this fully editable PowerPoint chart into your business tasks. With a single glance at this resourceful PPT layout, the audiences can get a complete overview of the tasks, duration, resources employed, and overlapping of the activities in a particular project, making it an ideal choice for project managers and leaders. Not only this, but the color scheme of this template is also such that it is sure to impress your audience, no matter which niche they
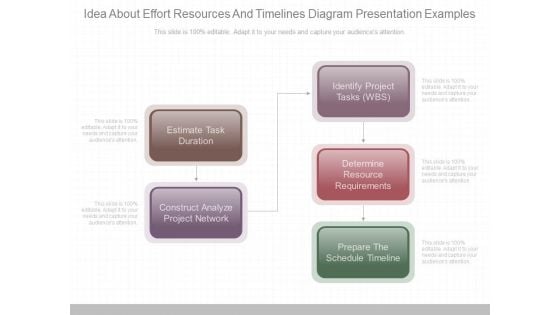
Idea About Effort Resources And Timelines Diagram Presentation Examples
This is a idea about effort resources and timelines diagram presentation examples. This is a five stage process. The stages in this process are estimate task duration, identify project tasks wbs, determine resource requirements, prepare the schedule timeline.
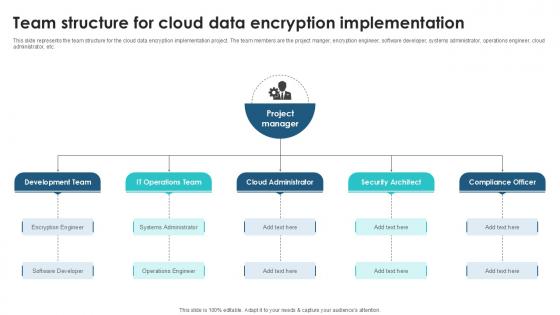
Team Structure For Cloud Data Client Side Encryption PPT Presentation
This slide represents the team structure for the cloud data encryption implementation project. The team members are the project manger, encryption engineer, software developer, systems administrator, operations engineer, cloud administrator, etc. Retrieve professionally designed Team Structure For Cloud Data Client Side Encryption PPT Presentation to effectively convey your message and captivate your listeners. Save time by selecting pre-made slideshows that are appropriate for various topics, from business to educational purposes. These themes come in many different styles, from creative to corporate, and all of them are easily adjustable and can be edited quickly. Access them as PowerPoint templates or as Google Slides themes. You do not have to go on a hunt for the perfect presentation because Slidegeeks got you covered from everywhere. This slide represents the team structure for the cloud data encryption implementation project. The team members are the project manger, encryption engineer, software developer, systems administrator, operations engineer, cloud administrator, etc.
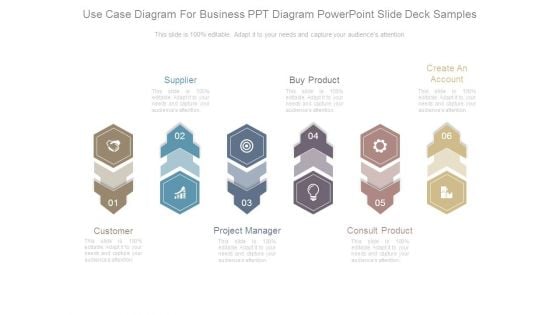
Use Case Diagram For Business Ppt Diagram Powerpoint Slide Deck Samples
This is a use case diagram for business ppt diagram powerpoint slide deck samples. This is a six stage process. The stages in this process are supplier, buy product, create an account, customer, project manager, consult product.
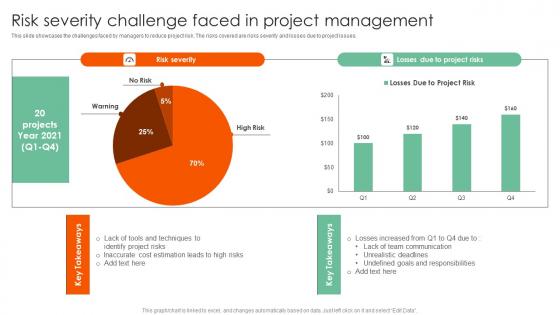
Risk Severity Challenge Faced In Complete Guide On How To Mitigate Elements Pdf
This slide showcases the challenges faced by managers to reduce project risk. The risks covered are risks severity and losses due to project issues. Do you know about Slidesgeeks Risk Severity Challenge Faced In Complete Guide On How To Mitigate Elements Pdf These are perfect for delivering any kind od presentation. Using it, create PowerPoint presentations that communicate your ideas and engage audiences. Save time and effort by using our pre designed presentation templates that are perfect for a wide range of topic. Our vast selection of designs covers a range of styles, from creative to business, and are all highly customizable and easy to edit. Download as a PowerPoint template or use them as Google Slides themes. This slide showcases the challenges faced by managers to reduce project risk. The risks covered are risks severity and losses due to project issues.
Database System PowerPoint Icon Cc
Microsoft PowerPoint Template and Background with database system for reports and data analysis Underline your erudition with our Database System PowerPoint Icon Cc. They will project your considerable expertise.
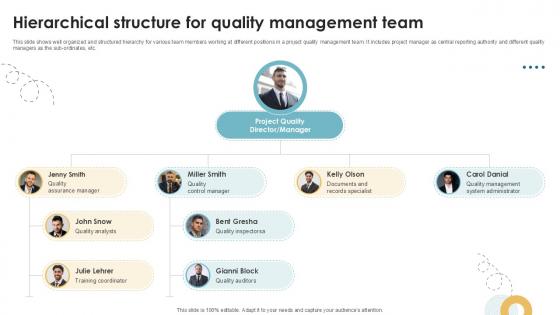
Hierarchical Structure For Quality Management Executing Quality Ppt Slides PM SS V
This slide shows well organized and structured hierarchy for various team members working at different positions in a project quality management team. It includes project manager as central reporting authority and different quality managers as the sub ordinates, etc. Make sure to capture your audiences attention in your business displays with our gratis customizable Hierarchical Structure For Quality Management Executing Quality Ppt Slides PM SS V. These are great for business strategies, office conferences, capital raising or task suggestions. If you desire to acquire more customers for your tech business and ensure they stay satisfied, create your own sales presentation with these plain slides. This slide shows well organized and structured hierarchy for various team members working at different positions in a project quality management team. It includes project manager as central reporting authority and different quality managers as the sub ordinates, etc.
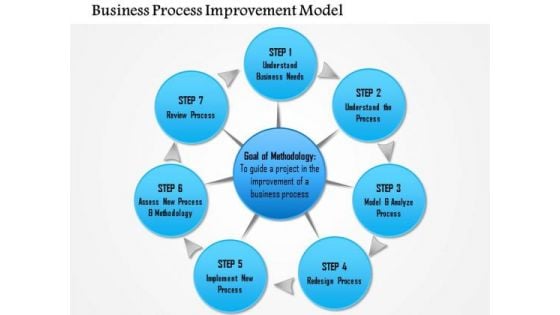
Business Diagram Business Process Improvement Model PowerPoint Ppt Presentation
This diagram presents business process improvement model. It contains circular diagram depicting seven steps of process improvement. Use this diagram to guide a project in the improvement of a business process.
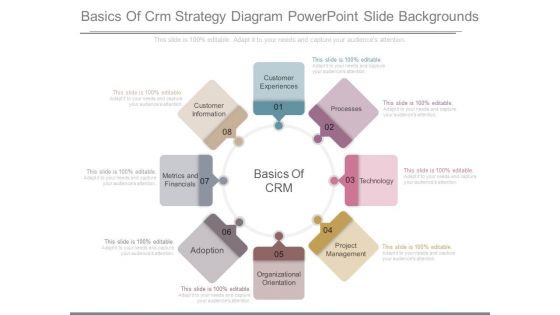
Basics Of Crm Strategy Diagram Powerpoint Slide Backgrounds
This is a basics of crm strategy diagram powerpoint slide backgrounds. This is a eight stage process. The stages in this process are customer experiences, processes, technology, project management, organizational orientation, adoption, metrics and financials, customer information.
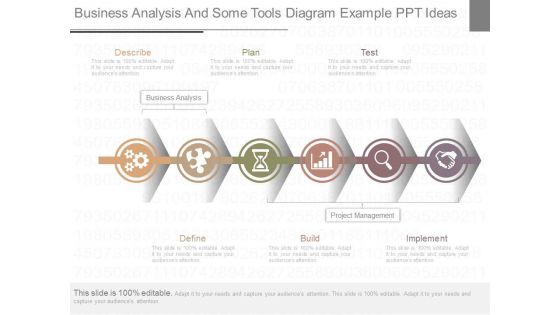
Business Analysis And Some Tools Diagram Example Ppt Ideas
This is a business analysis and some tools diagram example ppt ideas. This is a six stage process. The stages in this process are describe, plan, test, define, build, implement, business analysis, project management.
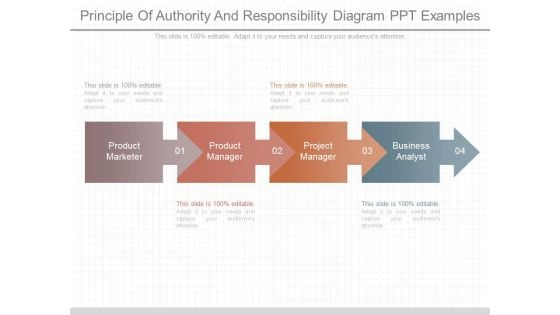
Principle Of Authority And Responsibility Diagram Ppt Examples
This is a principle of authority and responsibility diagram ppt examples. This is a four stage process. The stages in this process are product marketer, product manager, project manager, business analyst.

Enterprise Resource Planning Sample Diagram Ppt Slide Show
This is a enterprise resource planning sample diagram ppt slide show. This is a five stage process. The stages in this process are supply chain, human resource, finance and accounting, supply chain and vendor management, project and hr management.
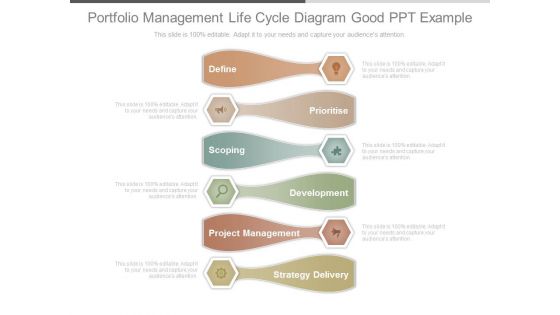
Portfolio Management Life Cycle Diagram Good Ppt Example
This is a portfolio management life cycle diagram good ppt example. This is a six stage process. The stages in this process are define, prioritise, scoping, development, project management, strategy delivery.
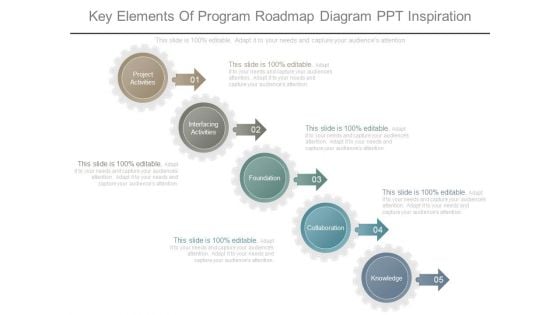
Key Elements Of Program Roadmap Diagram Ppt Inspiration
This is a key elements of program roadmap diagram ppt inspiration. This is a five stage process. The stages in this process are project activities, interfacing activities, foundation, collaboration, knowledge.
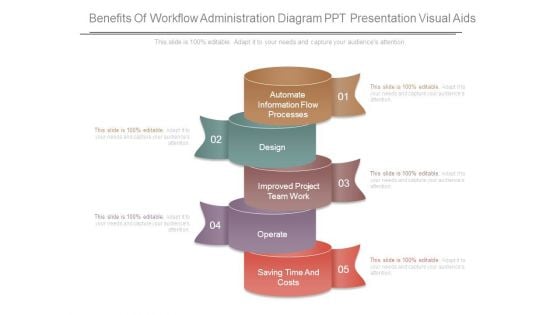
Benefits Of Workflow Administration Diagram Ppt Presentation Visual Aids
This is a benefits of workflow administration diagram ppt presentation visual aids. This is a five stage process. The stages in this process are automate information flow processes, design, improved project team work, operate, saving time and costs.
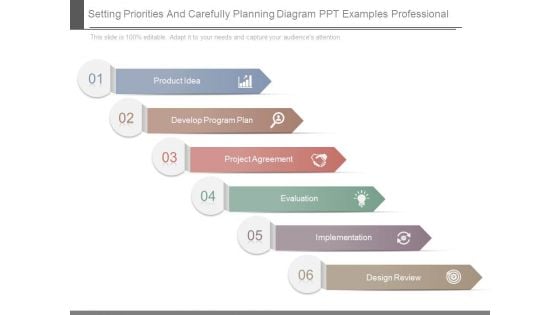
Setting Priorities And Carefully Planning Diagram Ppt Examples Professional
This is a setting priorities and carefully planning diagram ppt examples professional. This is a six stage process. The stages in this process are product idea, develop program plan, project agreement, evaluation, implementation, design review.
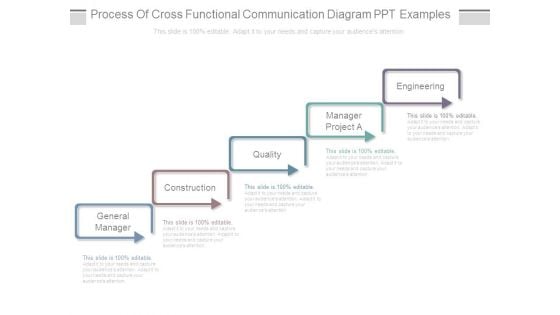
Process Of Cross Functional Communication Diagram Ppt Examples
This is a process of cross functional communication diagram ppt examples. This is a five stage process. The stages in this process are general manager, construction, quality, manager project a, engineering.
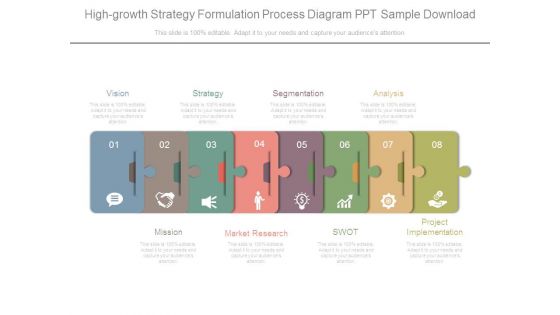
High Growth Strategy Formulation Process Diagram Ppt Sample Download
This is a high growth strategy formulation process diagram ppt sample download. This is a eight stage process. The stages in this process are vision, strategy, segmentation, analysis, mission, market research, swot, project implementation.
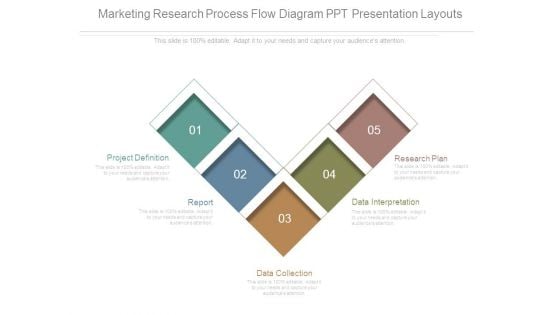
Marketing Research Process Flow Diagram Ppt Presentation Layouts
This is a marketing research process flow diagram ppt presentation layouts. This is a five stage process. The stages in this process are project definition, report, data collection, data interpretation, research plan.
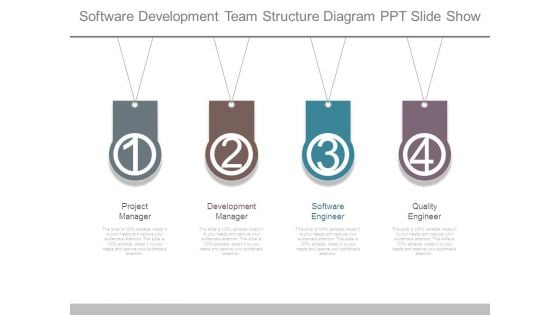
Software Development Team Structure Diagram Ppt Slide Show
This is a software development team structure diagram ppt slide show. This is a four stage process. The stages in this process are project manager, development manager, software engineer, quality engineer.
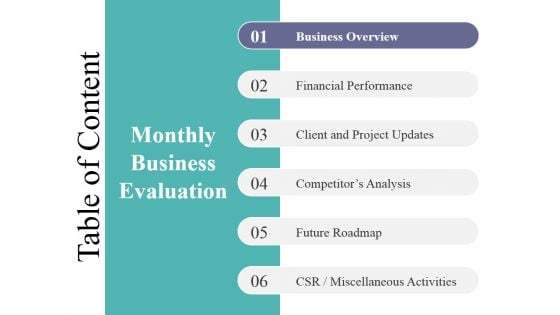
Table Of Content Template 2 Ppt PowerPoint Presentation Model Diagrams
This is a table of content template 2 ppt powerpoint presentation model diagrams. This is a six stage process. The stages in this process are business overview, financial performance, client and project updates, competitors analysis, future roadmap, csr miscellaneous activities.
People Running Towards Help Business PowerPoint Themes And PowerPoint Slides 0411
Microsoft PowerPoint Theme and Slide with group of people and lifebouy Our People Running Towards Help Business PowerPoint Themes And PowerPoint Slides 0411 project your erudite nature. They bring your depth of knowledge to the surface.
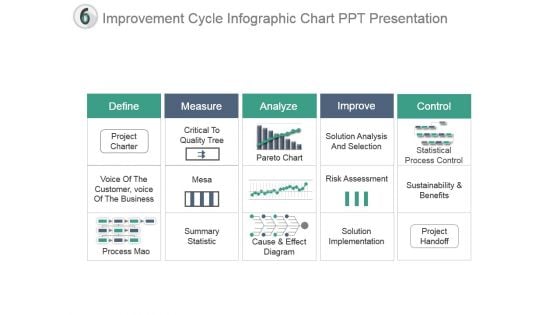
Improvement Cycle Infographic Chart Ppt Presentation
This is a improvement cycle infographic chart ppt presentation. This is a five stage process. The stages in this process are define, measure, analyze, improve, control, project charter, critical to quality tree, process mao, summary statistic, mesa, pareto chart, cause and effect diagram, solution analysis and selection, risk assessment, solution implementation, sustainability and benefits, project handoff, statistical process control, voice of the customer, voice of the business.
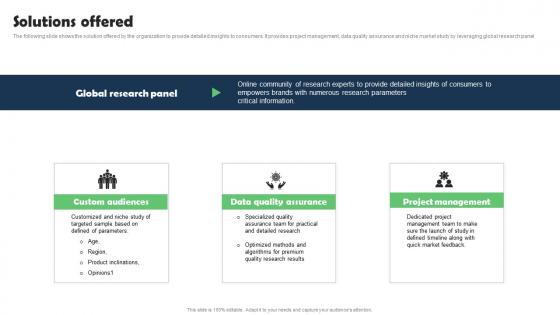
Solutions Offered Marketing Research Services Management Business Diagrams Pdf
The following slide shows the solution offered by the organization to provide detailed insights to consumers. It provides project management, data quality assurance and niche market study by leveraging global research panel. Take your projects to the next level with our ultimate collection of Solutions Offered Marketing Research Services Management Business Diagrams Pdf. Slidegeeks has designed a range of layouts that are perfect for representing task or activity duration, keeping track of all your deadlines at a glance. Tailor these designs to your exact needs and give them a truly corporate look with your own brand colors they well make your projects stand out from the rest. The following slide shows the solution offered by the organization to provide detailed insights to consumers. It provides project management, data quality assurance and niche market study by leveraging global research panel.

Stepping Stones Timeline Diagram For Business Powerpoint Slides
Download this timeline template for project planning, management and also for innovation process. This PPT slide contains graphics of stepping stones. Present your views using our self-explanatory PowerPoint template.
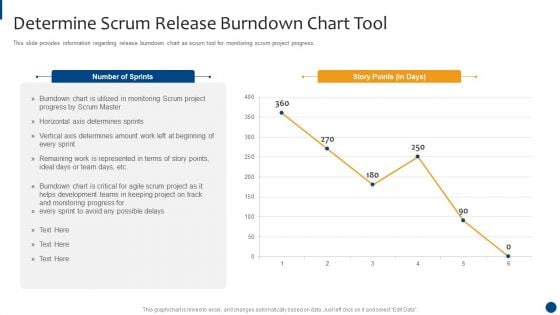
Scrum Master Approaches And Tools IT Determine Scrum Release Burndown Chart Tool Diagrams PDF
This slide provides information regarding release burndown chart as scrum tool for monitoring scrum project progress. Deliver and pitch your topic in the best possible manner with this scrum master approaches and tools it determine scrum release burndown chart tool diagrams pdf. Use them to share invaluable insights on determines, team, development, project, progress and impress your audience. This template can be altered and modified as per your expectations. So, grab it now.
Dices On Financial Graph PowerPoint Icon S
Microsoft PowerPoint Template and Background with dices on financial graph Our Dices On Financial Graph PowerPoint Icon S project your erudite nature. They bring your depth of knowledge to the surface.
Sipoc Analysis Ppt PowerPoint Presentation Icon Information
This is a sipoc analysis ppt powerpoint presentation icon information. This is a two stage process. The stages in this process are process project name, suppliers, inputs, process, outputs.
Actual Cost Ppt PowerPoint Presentation Icon Professional
This is a actual cost ppt powerpoint presentation icon professional. This is a three stage process. The stages in this process are project tasks, labor hours, labor hours, material cost.
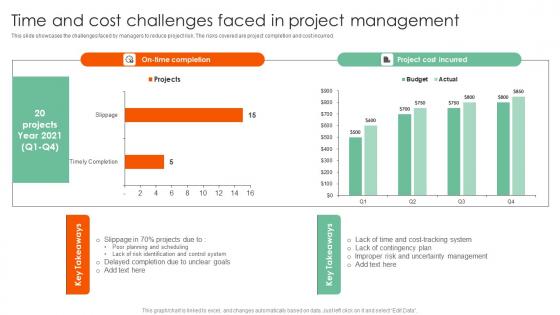
Time And Cost Challenges Faced In Complete Guide On How To Mitigate Pictures Pdf
This slide showcases the challenges faced by managers to reduce project risk. The risks covered are project completion and cost incurred. Get a simple yet stunning designed Time And Cost Challenges Faced In Complete Guide On How To Mitigate Pictures Pdf. It is the best one to establish the tone in your meetings. It is an excellent way to make your presentations highly effective. So, download this PPT today from Slidegeeks and see the positive impacts. Our easy to edit Time And Cost Challenges Faced In Complete Guide On How To Mitigate Pictures Pdf can be your go to option for all upcoming conferences and meetings. So, what are you waiting for Grab this template today. This slide showcases the challenges faced by managers to reduce project risk. The risks covered are project completion and cost incurred.
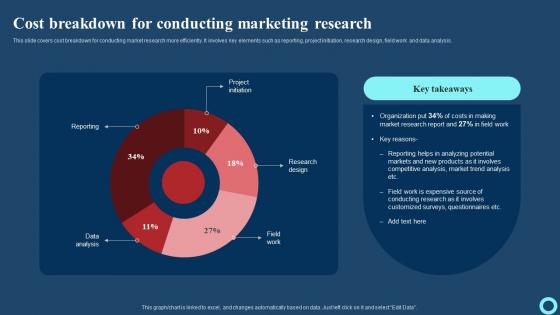
Cost Breakdown For Conducting Marketing Research Effective Strategies To Enhance Graphics Pdf
This slide covers cost breakdown for conducting market research more efficiently. It involves key elements such as reporting, project initiation, research design, field work and data analysis. Take your projects to the next level with our ultimate collection of Cost Breakdown For Conducting Marketing Research Effective Strategies To Enhance Graphics Pdf Slidegeeks has designed a range of layouts that are perfect for representing task or activity duration, keeping track of all your deadlines at a glance. Tailor these designs to your exact needs and give them a truly corporate look with your own brand colors they well make your projects stand out from the rest. This slide covers cost breakdown for conducting market research more efficiently. It involves key elements such as reporting, project initiation, research design, field work and data analysis.

Web Consulting Business Web Design Company Management Team Structure
Mentioned slide provides information about company team structure. It includes key members such as CEO, project manager, project architect, UI or UXD designer, graphic designer, web developer, etc. Welcome to our selection of the Web Consulting Business Web Design Company Management Team Structure. These are designed to help you showcase your creativity and bring your sphere to life. Planning and Innovation are essential for any business that is just starting out. This collection contains the designs that you need for your everyday presentations. All of our PowerPoints are 100Percent editable, so you can customize them to suit your needs. This multi-purpose template can be used in various situations. Grab these presentation templates today. Mentioned slide provides information about company team structure. It includes key members such as CEO, project manager, project architect, UI or UXD designer, graphic designer, web developer, etc.
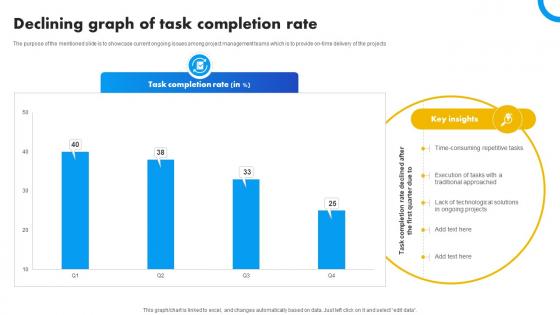
Declining Graph Of Task Completion Rate Strategies For Success In Digital
The purpose of the mentioned slide is to showcase current ongoing issues among project management teams which is to provide on-time delivery of the projects. From laying roadmaps to briefing everything in detail, our templates are perfect for you. You can set the stage with your presentation slides. All you have to do is download these easy-to-edit and customizable templates. Declining Graph Of Task Completion Rate Strategies For Success In Digital will help you deliver an outstanding performance that everyone would remember and praise you for. Do download this presentation today. The purpose of the mentioned slide is to showcase current ongoing issues among project management teams which is to provide on-time delivery of the projects.
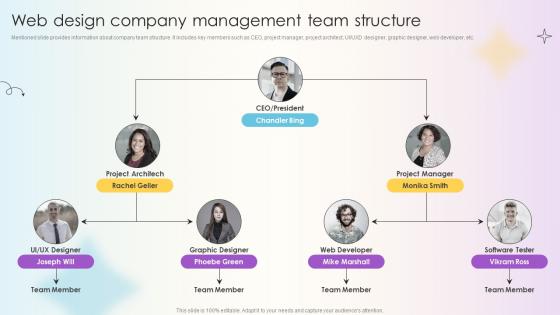
Managing Technical And Non Web Design Company Management Team Structure
Mentioned slide provides information about company team structure. It includes key members such as CEO, project manager, project architect, UI or UXD designer, graphic designer, web developer, etc. Coming up with a presentation necessitates that the majority of the effort goes into the content and the message you intend to convey. The visuals of a PowerPoint presentation can only be effective if it supplements and supports the story that is being told. Keeping this in mind our experts created Managing Technical And Non Web Design Company Management Team Structure to reduce the time that goes into designing the presentation. This way, you can concentrate on the message while our designers take care of providing you with the right template for the situation. Mentioned slide provides information about company team structure. It includes key members such as CEO, project manager, project architect, UI or UXD designer, graphic designer, web developer, etc.
Unlocking Potential Enhancing Team Members Performance Tracking Dashboards
This slide depicts performance tracking dashboard for project manager to analyze work being done by the team. It includes average rating for the week, total work done and weekly change, employee rating and work done. Take your projects to the next level with our ultimate collection of Unlocking Potential Enhancing Team Members Performance Tracking Dashboards. Slidegeeks has designed a range of layouts that are perfect for representing task or activity duration, keeping track of all your deadlines at a glance. Tailor these designs to your exact needs and give them a truly corporate look with your own brand colors they will make your projects stand out from the rest This slide depicts performance tracking dashboard for project manager to analyze work being done by the team. It includes average rating for the week, total work done and weekly change, employee rating and work done.
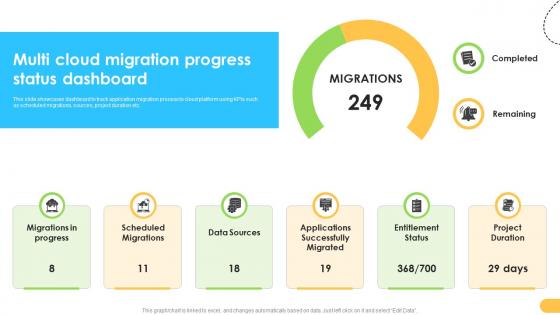
Multi Cloud Migration Progress Status Dashboard Data Migration From On Premises
This slide showcases dashboard to track application migration process to cloud platform using KPIs such as scheduled migrations, sources, project duration etc. Take your projects to the next level with our ultimate collection of Multi Cloud Migration Progress Status Dashboard Data Migration From On Premises. Slidegeeks has designed a range of layouts that are perfect for representing task or activity duration, keeping track of all your deadlines at a glance. Tailor these designs to your exact needs and give them a truly corporate look with your own brand colors they will make your projects stand out from the rest This slide showcases dashboard to track application migration process to cloud platform using KPIs such as scheduled migrations, sources, project duration etc.
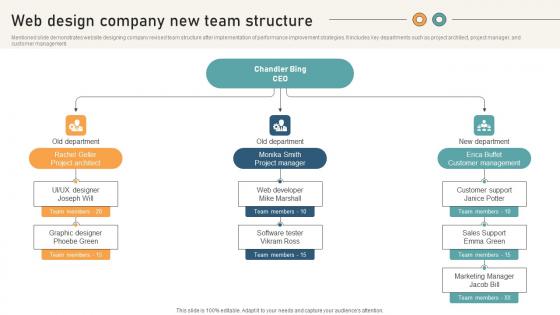
Comprehensive Guide For Website Development Web Design Company New Team Structure
Mentioned slide demonstrates website designing company revised team structure after implementation of performance improvement strategies. It includes key departments such as project architect, project manager, and customer management. The Comprehensive Guide For Website Development Web Design Company New Team Structure is a compilation of the most recent design trends as a series of slides. It is suitable for any subject or industry presentation, containing attractive visuals and photo spots for businesses to clearly express their messages. This template contains a variety of slides for the user to input data, such as structures to contrast two elements, bullet points, and slides for written information. Slidegeeks is prepared to create an impression. Mentioned slide demonstrates website designing company revised team structure after implementation of performance improvement strategies. It includes key departments such as project architect, project manager, and customer management.
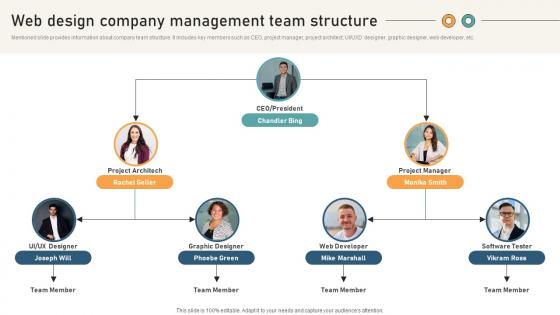
Comprehensive Guide For Website Web Design Company Management Team Structure
Mentioned slide provides information about company team structure. It includes key members such as CEO, project manager, project architect, UI or UXD designer, graphic designer, web developer, etc. Coming up with a presentation necessitates that the majority of the effort goes into the content and the message you intend to convey. The visuals of a PowerPoint presentation can only be effective if it supplements and supports the story that is being told. Keeping this in mind our experts created Comprehensive Guide For Website Web Design Company Management Team Structure to reduce the time that goes into designing the presentation. This way, you can concentrate on the message while our designers take care of providing you with the right template for the situation. Mentioned slide provides information about company team structure. It includes key members such as CEO, project manager, project architect, UI or UXD designer, graphic designer, web developer, etc.
Three Text Tags With Icons For Business Planning Ppt PowerPoint Presentation Icon Templates
This is a three text tags with icons for business planning ppt powerpoint presentation icon templates. This is a three stage process. The stages in this process are 3 month timeline, project plan, plan requirement.
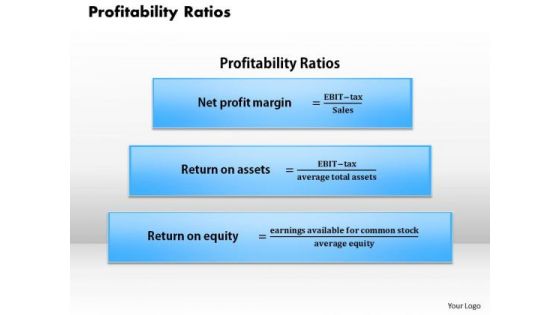
Business Framework Profitability Ratios PowerPoint Presentation
This diagram displays project program cycle management diagram. Use this diagram in your business and marketing presentations to depict management and planning. This diagram will enhance the quality of your presentations.

Administering Quality Assurance Conduct Root Cause Analysis Through Fishbone Diagram PM SS V
This slide shows sample root cause analysis of a project that encountered some quality issues at time of project delivery to the client. It include different causes such as team issues, materials and methodology, etc. From laying roadmaps to briefing everything in detail, our templates are perfect for you. You can set the stage with your presentation slides. All you have to do is download these easy-to-edit and customizable templates. Administering Quality Assurance Conduct Root Cause Analysis Through Fishbone Diagram PM SS V will help you deliver an outstanding performance that everyone would remember and praise you for. Do download this presentation today. This slide shows sample root cause analysis of a project that encountered some quality issues at time of project delivery to the client. It include different causes such as team issues, materials and methodology, etc.
Example Of Brand Digital Campaign Ppt Example Ppt Icon
This is a example of brand digital campaign ppt example ppt icon. This is a eight stage process. The stages in this process are graphic designers, ux and ui designers, writers, content editors, project managers, content producers, insight, heritage.
Executive Management Team Roles And Responsibilities Ppt Icon
This is a executive management team roles and responsibilities ppt icon. This is a eight stage process. The stages in this process are reporting, oversight, planning, messaging, monitoring, risk analysis, project manager, implementing.
Table Of Content Template 1 Ppt PowerPoint Presentation Icon Ideas
This is a table of content template 1 ppt powerpoint presentation icon ideas. This is a six stage process. The stages in this process are future roadmap, competitors analysis, client and project updates, financial performance, business overview.
Table Of Content Template 2 Ppt PowerPoint Presentation Professional Icon
This is a table of content template 2 ppt powerpoint presentation professional icon. This is a six stage process. The stages in this process are financial performance, client and project updates, competitors analysis, future roadmap.
Enterprise Resource Planning Funnel Ppt PowerPoint Presentation Infographics Icons
This is a enterprise resource planning funnel ppt powerpoint presentation infographics icons. This is a five stage process. The stages in this process are project preparation, situational analysis, software selection, realization and implementation, support from management.
Enterprise Resource Planning Funnel Ppt PowerPoint Presentation Icon Ideas
This is a enterprise resource planning funnel ppt powerpoint presentation icon ideas. This is a five stage process. The stages in this process are project preparation, situational analysis basic target concept, software selection, concept fine tuning, realization and implementation.
Event Planning Guide With Icons Ppt PowerPoint Presentation Infographics Ideas
This is a event planning guide with icons ppt powerpoint presentation infographics ideas. This is a four stage process. The stages in this process are project management, event management, event planning.
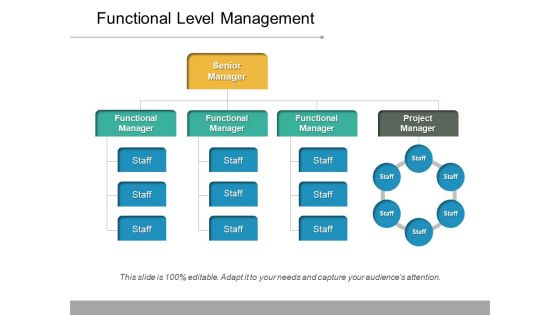
Functional Level Management Ppt PowerPoint Presentation Infographics Images
This is a functional level management ppt powerpoint presentation infographics images. This is a three stage process. The stages in this process are organization chart, org chart, project team structure.


 Continue with Email

 Home
Home


