Project Portfolio Management Dashboard
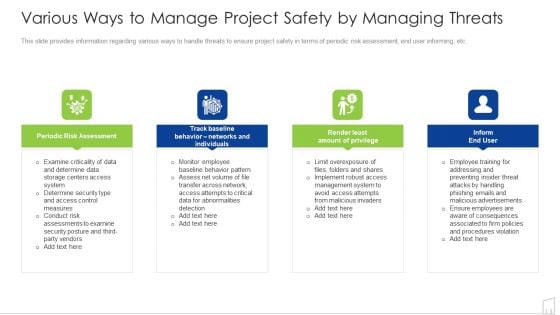
Various Ways To Manage Project Safety By Managing Threats Ppt Ideas Deck PDF
This slide provides information regarding various ways to handle threats to ensure project safety in terms of periodic risk assessment, end user informing, etc. Presenting various ways to manage project safety by managing threats ppt ideas deck pdf to provide visual cues and insights. Share and navigate important information on four stages that need your due attention. This template can be used to pitch topics like determine, system, data, risk, periodic. In addtion, this PPT design contains high resolution images, graphics, etc, that are easily editable and available for immediate download.
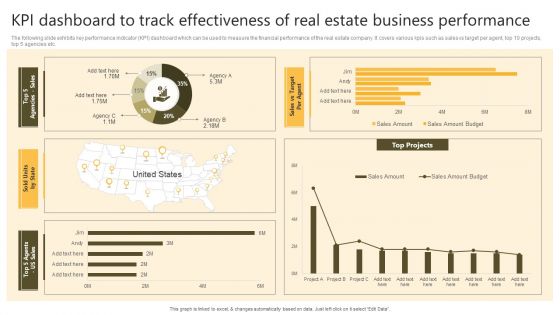
Successful Risk Administration KPI Dashboard To Track Effectiveness Of Real Estate Business Template PDF
The following slide exhibits key performance indicator KPI dashboard which can be used to measure the financial performance of the real estate company. It covers various kpis such as sales vs target per agent, top 10 projects, top 5 agencies etc. If your project calls for a presentation, then Slidegeeks is your go-to partner because we have professionally designed, easy-to-edit templates that are perfect for any presentation. After downloading, you can easily edit Successful Risk Administration KPI Dashboard To Track Effectiveness Of Real Estate Business Template PDF and make the changes accordingly. You can rearrange slides or fill them with different images. Check out all the handy templates.
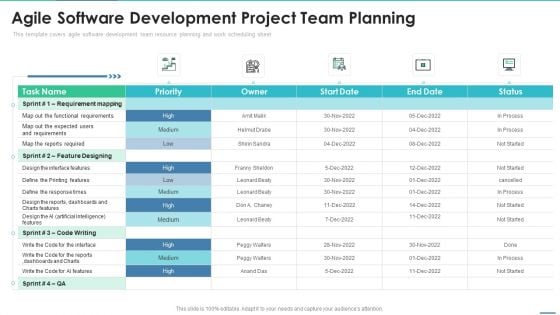
Agile Project Team Delegation IT Agile Software Development Project Team Planning Ideas PDF
This template covers agile software development team resource planning and work scheduling sheet. Deliver and pitch your topic in the best possible manner with this agile project team delegation it agile software development project team planning ideas pdf. Use them to share invaluable insights on requirement mapping, design, dashboards and impress your audience. This template can be altered and modified as per your expectations. So, grab it now.
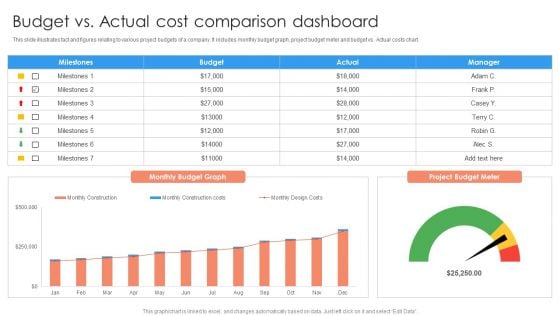
Budget Vs Actual Cost Comparison Dashboard Ppt PowerPoint Presentation Professional Format Ideas PDF
This slide illustrates fact and figures relating to various project budgets of a company. It includes monthly budget graph, project budget meter and budget vs. Actual costs chart.Pitch your topic with ease and precision using this Budget Vs Actual Cost Comparison Dashboard Ppt PowerPoint Presentation Professional Format Ideas PDF. This layout presents information on Milestones, Budget Graph, Manager. It is also available for immediate download and adjustment. So, changes can be made in the color, design, graphics or any other component to create a unique layout.

Firm KPI Dashboard With Schedule Performance Index Ppt Visual Aids PDF
This graph or chart is linked to excel, and changes automatically based on data. Just left click on it and select Edit Data. Pitch your topic with ease and precision using this Firm KPI Dashboard With Schedule Performance Index Ppt Visual Aids PDF. This layout presents information on Project Cost Performance, Project Planning Stage, Monitor And Control. It is also available for immediate download and adjustment. So, changes can be made in the color, design, graphics or any other component to create a unique layout.
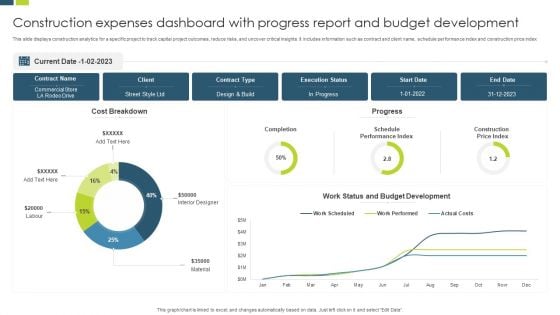
Construction Expenses Dashboard With Progress Report And Budget Development Background PDF
This slide displays construction analytics for a specific project to track capital project outcomes, reduce risks, and uncover critical insights. It includes information such as contract and client name, schedule performance index and construction price index. Showcasing this set of slides titled Construction Expenses Dashboard With Progress Report And Budget Development Background PDF. The topics addressed in these templates are Budget Development, Execution Status, Commercial Store. All the content presented in this PPT design is completely editable. Download it and make adjustments in color, background, font etc. as per your unique business setting.

Equity Asset Allocation Dashboard Analytics Strategic Investment Plan For Optimizing Risk SS V
This slide represents an equity asset allocation dashboard to measure and manage the performance of equity overtime. It tracks KPIs such as, average position size, market cap distribution, average PE distribution, ratio and yield, by geography, industry, currency and holding lists.If your project calls for a presentation, then Slidegeeks is your go-to partner because we have professionally designed, easy-to-edit templates that are perfect for any presentation. After downloading, you can easily edit Equity Asset Allocation Dashboard Analytics Strategic Investment Plan For Optimizing Risk SS V and make the changes accordingly. You can rearrange slides or fill them with different images. Check out all the handy templates This slide represents an equity asset allocation dashboard to measure and manage the performance of equity overtime. It tracks KPIs such as, average position size, market cap distribution, average PE distribution, ratio and yield, by geography, industry, currency and holding lists.
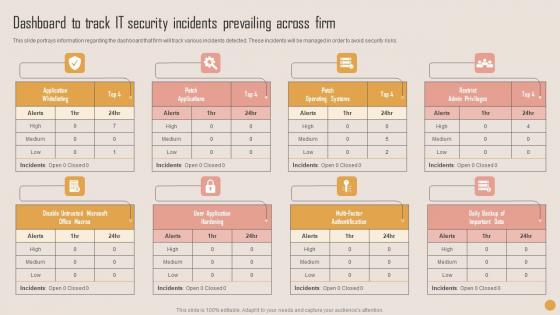
Dashboard To Track IT Security Playbook For Strategic Actions To Improve IT Performance Summary Pdf
This slide portrays information regarding the dashboard that firm will track various incidents detected. These incidents will be managed in order to avoid security risks. If your project calls for a presentation, then Slidegeeks is your go to partner because we have professionally designed, easy to edit templates that are perfect for any presentation. After downloading, you can easily edit Dashboard To Track IT Security Playbook For Strategic Actions To Improve IT Performance Summary Pdf and make the changes accordingly. You can rearrange slides or fill them with different images. Check out all the handy templates This slide portrays information regarding the dashboard that firm will track various incidents detected. These incidents will be managed in order to avoid security risks.
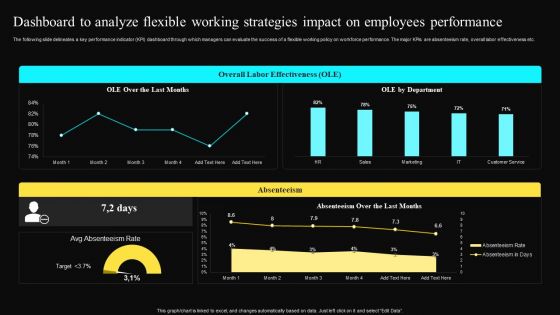
Dashboard To Analyze Flexible Working Strategies Impact On Employees Performance Rules PDF
The following slide delineates a key performance indicator KPI dashboard through which managers can evaluate the success of a flexible working policy on workforce performance. The major KPIs are absenteeism rate, overall labor effectiveness etc.If your project calls for a presentation, then Slidegeeks is your go-to partner because we have professionally designed, easy to edit templates that are perfect for any presentation. After downloading, you can easily edit Dashboard To Analyze Flexible Working Strategies Impact On Employees Performance Rules PDF and make the changes accordingly. You can rearrange slides or fill them with different images. Check out all the handy templates
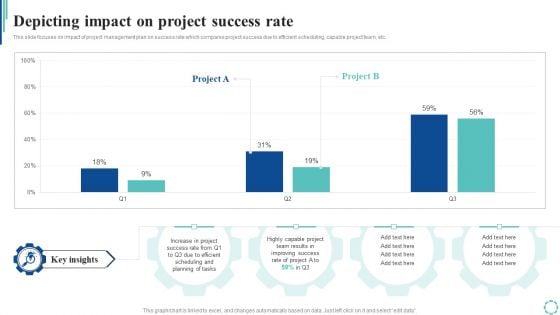
Depicting Impact On Project Success Rate Strategies To Enhance Project Lifecycle Infographics PDF
This slide focuses on impact of project management plan on success rate which compares project success due to efficient scheduling, capable project team, etc.This Depicting Impact On Project Success Rate Strategies To Enhance Project Lifecycle Infographics PDF from Slidegeeks makes it easy to present information on your topic with precision. It provides customization options, so you can make changes to the colors, design, graphics, or any other component to create a unique layout. It is also available for immediate download, so you can begin using it right away. Slidegeeks has done good research to ensure that you have everything you need to make your presentation stand out. Make a name out there for a brilliant performance.
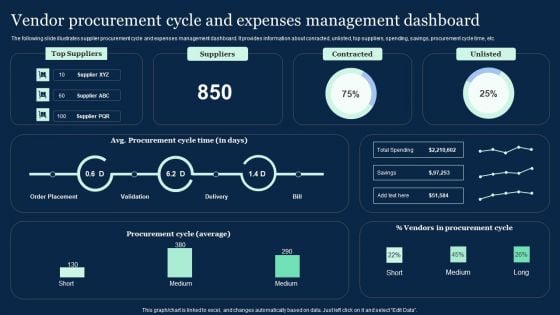
Vendor Procurement Cycle And Expenses Management Effective Vendor Management For Enhancing Introduction PDF
The following slide illustrates supplier procurement cycle and expenses management dashboard. It provides information about conracted, unlisted, top suppliers, spending, savings, procurement cycle time, etc. If your project calls for a presentation, then Slidegeeks is your go-to partner because we have professionally designed, easy-to-edit templates that are perfect for any presentation. After downloading, you can easily edit Vendor Procurement Cycle And Expenses Management Effective Vendor Management For Enhancing Introduction PDF and make the changes accordingly. You can rearrange slides or fill them with different images. Check out all the handy templates
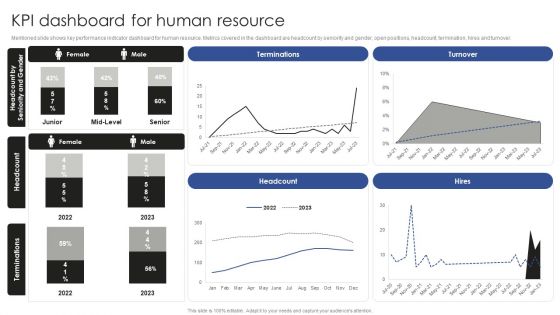
Talent Administration And Succession KPI Dashboard For Human Resource Rules PDF
Mentioned slide shows key performance indicator dashboard for human resource. Metrics covered in the dashboard are headcount by seniority and gender, open positions, headcount, termination, hires and turnover. If your project calls for a presentation, then Slidegeeks is your go-to partner because we have professionally designed, easy-to-edit templates that are perfect for any presentation. After downloading, you can easily edit Talent Administration And Succession KPI Dashboard For Human Resource Rules PDF and make the changes accordingly. You can rearrange slides or fill them with different images. Check out all the handy templates

Data Processing Facts Management Arrows Diagram Ppt PowerPoint Presentation Templates
This is a data processing facts management arrows diagram ppt powerpoint presentation templates. This is a eight stage process. The stages in this process are marketing, arrows, management, facts, data processing.

AI High Tech PowerPoint Templates Machine Learning Ppt Portfolio Portrait PDF
Presenting this set of slides with name ai high tech powerpoint templates machine learning ppt portfolio portrait pdf. The topics discussed in these slides are machine learning is a type of ai that enables machines to learn from data and deliver predictive models. This is a completely editable PowerPoint presentation and is available for immediate download. Download now and impress your audience.
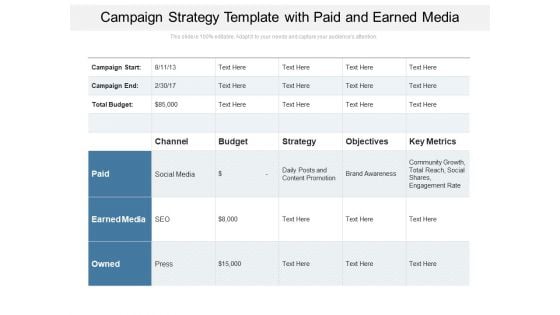
Campaign Strategy Template With Paid And Earned Media Ppt PowerPoint Presentation Gallery Portfolio PDF
Presenting this set of slides with name campaign strategy template with paid and earned media ppt powerpoint presentation gallery portfolio pdf. The topics discussed in these slides are budget, strategy, key metrics. This is a completely editable PowerPoint presentation and is available for immediate download. Download now and impress your audience.
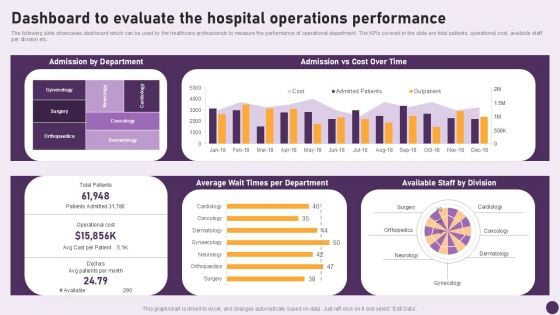
Guide To Healthcare Services Administration Dashboard To Evaluate The Hospital Operations Performance Infographics PDF
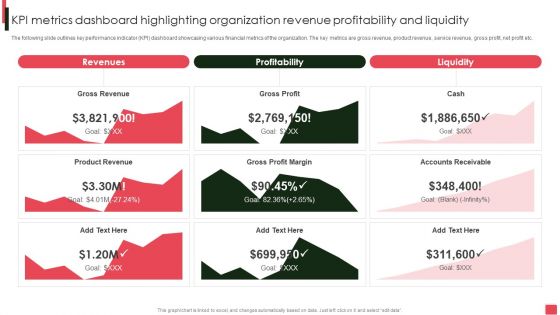
Overview Of Organizational Kpi Metrics Dashboard Highlighting Organization Revenue Brochure PDF
The following slide outlines key performance indicator KPI dashboard showcasing various financial metrics of the organization. The key metrics are gross revenue, product revenue, service revenue, gross profit, net profit etc. If your project calls for a presentation, then Slidegeeks is your go-to partner because we have professionally designed, easy-to-edit templates that are perfect for any presentation. After downloading, you can easily edit Overview Of Organizational Kpi Metrics Dashboard Highlighting Organization Revenue Brochure PDF and make the changes accordingly. You can rearrange slides or fill them with different images. Check out all the handy templates.
Conformance Testing Performance Tracking Dashboard Compliance Assessment Ppt Layouts Graphics PDF
This slide depicts the conformance testing performance tracking dashboard by covering details of test case analysis, tests linked to requirements, test case breakdown, tests per requirement, and so on. If your project calls for a presentation, then Slidegeeks is your go-to partner because we have professionally designed, easy-to-edit templates that are perfect for any presentation. After downloading, you can easily edit Conformance Testing Performance Tracking Dashboard Compliance Assessment Ppt Layouts Graphics PDF and make the changes accordingly. You can rearrange slides or fill them with different images. Check out all the handy templates
Robotic Process Automation Shipping And Logistics Tracking Dashboard With Shipments Clipart PDF
This slide covers Key performance indicators to track the automation system of the company. This dashboard includes Logistics Efficiency Status, delivery time accuracy etc. If your project calls for a presentation, then Slidegeeks is your go-to partner because we have professionally designed, easy-to-edit templates that are perfect for any presentation. After downloading, you can easily edit Robotic Process Automation Shipping And Logistics Tracking Dashboard With Shipments Clipart PDF and make the changes accordingly. You can rearrange slides or fill them with different images. Check out all the handy templates
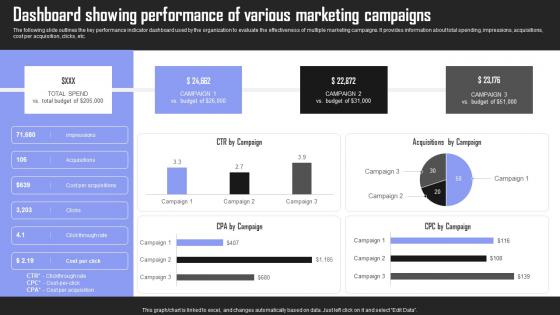
Dashboard Showing Performance Brand Building Techniques To Gain Competitive Edge Topics Pdf
The following slide outlines the key performance indicator dashboard used by the organization to evaluate the effectiveness of multiple marketing campaigns. It provides information about total spending, impressions, acquisitions, cost per acquisition, clicks, etc. If your project calls for a presentation, then Slidegeeks is your go to partner because we have professionally designed, easy to edit templates that are perfect for any presentation. After downloading, you can easily edit Dashboard Showing Performance Brand Building Techniques To Gain Competitive Edge Topics Pdf and make the changes accordingly. You can rearrange slides or fill them with different images. Check out all the handy templates The following slide outlines the key performance indicator dashboard used by the organization to evaluate the effectiveness of multiple marketing campaigns. It provides information about total spending, impressions, acquisitions, cost per acquisition, clicks, etc.
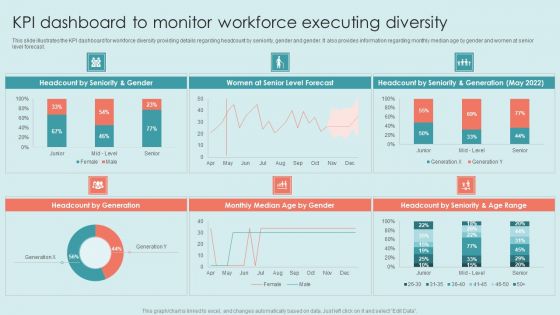
Executing Diversity KPI Dashboard To Monitor Workforce Executing Diversity Background PDF
This slide covers information regarding the key traits of inclusive leadership such as commitment, courage, cognize bias, curiosity etc. It also provides details about thinking to develop and behavior to adopt for becoming an effective inclusive leader. If your project calls for a presentation, then Slidegeeks is your go-to partner because we have professionally designed, easy-to-edit templates that are perfect for any presentation. After downloading, you can easily edit Executing Diversity KPI Dashboard To Monitor Workforce Executing Diversity Background PDF and make the changes accordingly. You can rearrange slides or fill them with different images. Check out all the handy templates.
Dashboard To Measure Performance Of E Commerce Retail Business Growth Marketing Techniques Icons PDF
This following slide displays the key metrics that can help an organization to measure effectiveness of e-commerce strategies. These can be revenue generated using e-commerce platform, conversion rates etc. If your project calls for a presentation, then Slidegeeks is your go to partner because we have professionally designed, easy to edit templates that are perfect for any presentation. After downloading, you can easily edit Dashboard To Measure Performance Of E Commerce Retail Business Growth Marketing Techniques Icons PDF and make the changes accordingly. You can rearrange slides or fill them with different images. Check out all the handy templates
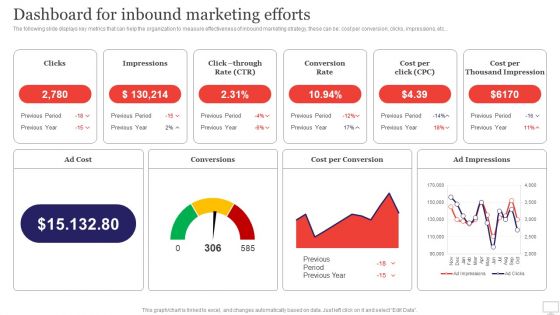
Target Audience Strategy For B2B And B2C Business Dashboard For Inbound Marketing Efforts Graphics PDF
The following slide displays key metrics that can help the organization to measure effectiveness of inbound marketing strategy, these can be cost per conversion, clicks, impressions, etc. If your project calls for a presentation, then Slidegeeks is your go-to partner because we have professionally designed, easy-to-edit templates that are perfect for any presentation. After downloading, you can easily edit Target Audience Strategy For B2B And B2C Business Dashboard For Inbound Marketing Efforts Graphics PDF and make the changes accordingly. You can rearrange slides or fill them with different images. Check out all the handy templates
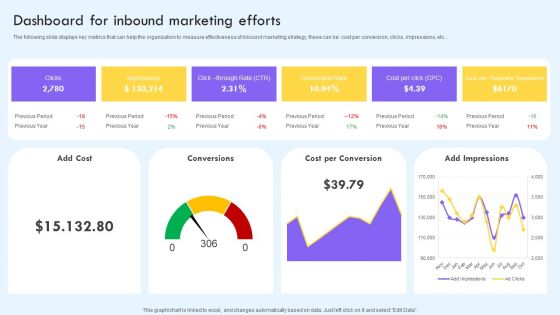
Dashboard For Inbound Marketing Efforts Ppt PowerPoint Presentation File Infographic Template PDF
The following slide displays key metrics that can help the organization to measure effectiveness of inbound marketing strategy, these can be cost per conversion, clicks, impressions, etc. If your project calls for a presentation, then Slidegeeks is your go to partner because we have professionally designed, easy to edit templates that are perfect for any presentation. After downloading, you can easily edit Dashboard For Inbound Marketing Efforts Ppt PowerPoint Presentation File Infographic Template PDF and make the changes accordingly. You can rearrange slides or fill them with different images. Check out all the handy templates.
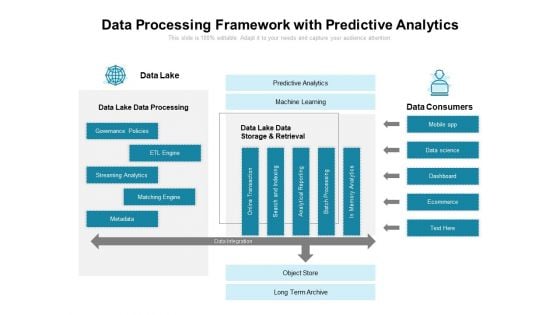
Data Processing Framework With Predictive Analytics Ppt PowerPoint Presentation Pictures Portfolio
Presenting this set of slides with name data processing framework with predictive analytics ppt powerpoint presentation pictures portfolio. The topics discussed in these slides are predictive analytics, machine learning, object store, long term archive. This is a completely editable PowerPoint presentation and is available for immediate download. Download now and impress your audience.
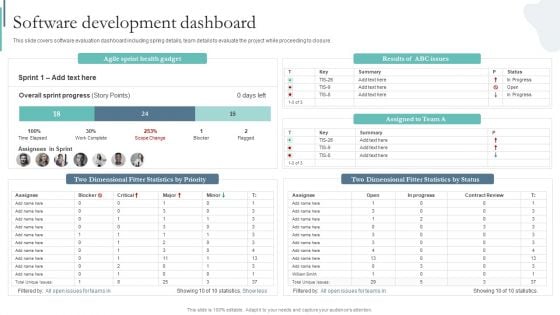
Agile Playbook For Program Designers Software Development Dashboard Ppt Infographics Brochure PDF
This slide covers software evaluation dashboard including spring details, team details to evaluate the project while proceeding to closure. If you are looking for a format to display your unique thoughts, then the professionally designed Agile Playbook For Program Designers Software Development Dashboard Ppt Infographics Brochure PDF is the one for you. You can use it as a Google Slides template or a PowerPoint template. Incorporate impressive visuals, symbols, images, and other charts. Modify or reorganize the text boxes as you desire. Experiment with shade schemes and font pairings. Alter, share or cooperate with other people on your work. Download Agile Playbook For Program Designers Software Development Dashboard Ppt Infographics Brochure PDF and find out how to give a successful presentation. Present a perfect display to your team and make your presentation unforgettable.
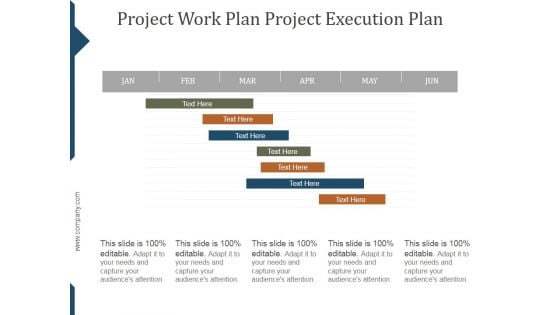
Project Work Plan Project Execution Plan Template Ppt PowerPoint Presentation Styles
This is a project work plan project execution plan template ppt powerpoint presentation styles. This is a seven stage process. The stages in this process are project, management, business, marketing, success.
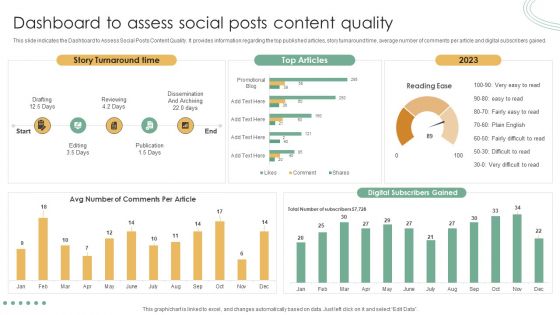
Online Marketing Techniques Assessment Approach Dashboard To Assess Social Posts Content Quality Information PDF
Take your projects to the next level with our ultimate collection of Online Marketing Techniques Assessment Approach Dashboard To Assess Social Posts Content Quality Information PDF. Slidegeeks has designed a range of layouts that are perfect for representing task or activity duration, keeping track of all your deadlines at a glance. Tailor these designs to your exact needs and give them a truly corporate look with your own brand colors they will make your projects stand out from the rest.
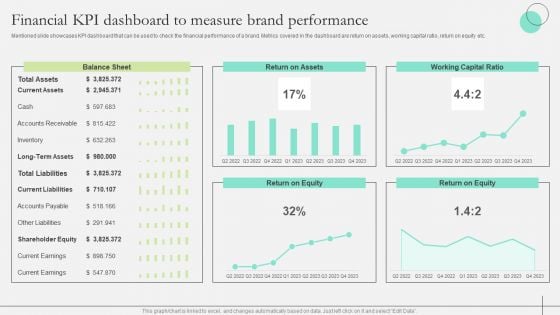
Comprehensive Guide To Strengthen Brand Equity Financial KPI Dashboard Measure Brand Structure PDF
Mentioned slide showcases KPI dashboard that can be used to check the financial performance of a brand. Metrics covered in the dashboard are return on assets, working capital ratio, return on equity etc. Take your projects to the next level with our ultimate collection of Comprehensive Guide To Strengthen Brand Equity Financial KPI Dashboard Measure Brand Structure PDF. Slidegeeks has designed a range of layouts that are perfect for representing task or activity duration, keeping track of all your deadlines at a glance. Tailor these designs to your exact needs and give them a truly corporate look with your own brand colors they will make your projects stand out from the rest
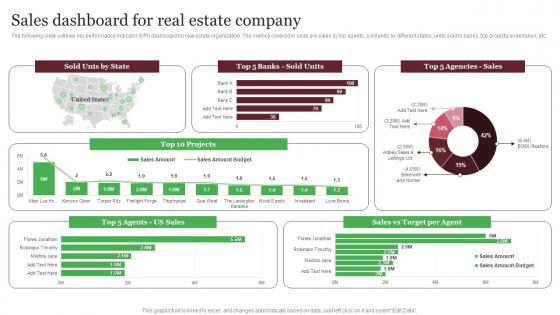
Sales Dashboard For Real Estate Company Out Of The Box Real Designs Pdf
The following slide outlines key performance indicator KPI dashboard for real estate organization. The metrics covered in slide are sales by top agents, sold units by different states, units sold to banks, top projects undertaken, etc. Make sure to capture your audiences attention in your business displays with our gratis customizable Sales Dashboard For Real Estate Company Out Of The Box Real Designs Pdf These are great for business strategies, office conferences, capital raising or task suggestions. If you desire to acquire more customers for your tech business and ensure they stay satisfied, create your own sales presentation with these plain slides. The following slide outlines key performance indicator KPI dashboard for real estate organization. The metrics covered in slide are sales by top agents, sold units by different states, units sold to banks, top projects undertaken, etc.
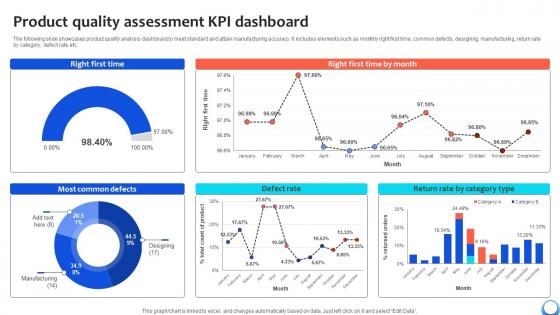
Product Quality Assessment KPI Dashboard Automating Production Process Strategy SS V
The following slide showcases product quality analysis dashboard to meet standard and attain manufacturing accuracy. It includes elements such as monthly right first time, common defects, designing, manufacturing, return rate by category, defect rate etc. Take your projects to the next level with our ultimate collection of Product Quality Assessment KPI Dashboard Automating Production Process Strategy SS V. Slidegeeks has designed a range of layouts that are perfect for representing task or activity duration, keeping track of all your deadlines at a glance. Tailor these designs to your exact needs and give them a truly corporate look with your own brand colors they will make your projects stand out from the rest The following slide showcases product quality analysis dashboard to meet standard and attain manufacturing accuracy. It includes elements such as monthly right first time, common defects, designing, manufacturing, return rate by category, defect rate etc.
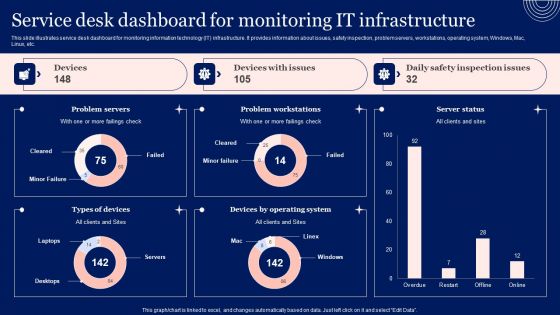
Implementing Advanced Service Help Desk Administration Program Service Desk Dashboard For Monitoring It Infrastructure Summary PDF
This slide illustrates service desk dashboard for monitoring information technology IT infrastructure. It provides information about issues, safety inspection, problem servers, workstations, operating system, Windows, Mac, Linux, etc. Take your projects to the next level with our ultimate collection of Implementing Advanced Service Help Desk Administration Program Service Desk Dashboard For Monitoring It Infrastructure Summary PDF. Slidegeeks has designed a range of layouts that are perfect for representing task or activity duration, keeping track of all your deadlines at a glance. Tailor these designs to your exact needs and give them a truly corporate look with your own brand colors they will make your projects stand out from the rest
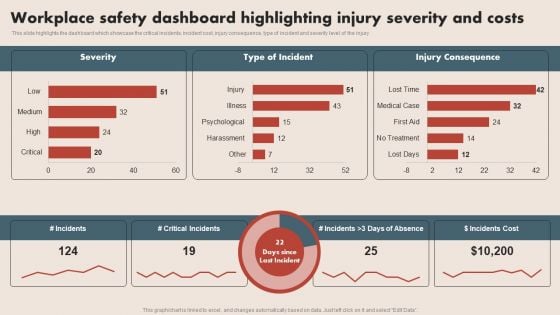
Deploying Safe Operating Procedures In The Organization Workplace Safety Dashboard Highlighting Injury Professional PDF
This slide highlights the dashboard which showcase the critical incidents, incident cost, injury consequence, type of incident and severity level of the injury. Take your projects to the next level with our ultimate collection of Deploying Safe Operating Procedures In The Organization Workplace Safety Dashboard Highlighting Injury Professional PDF. Slidegeeks has designed a range of layouts that are perfect for representing task or activity duration, keeping track of all your deadlines at a glance. Tailor these designs to your exact needs and give them a truly corporate look with your own brand colors they will make your projects stand out from the rest.
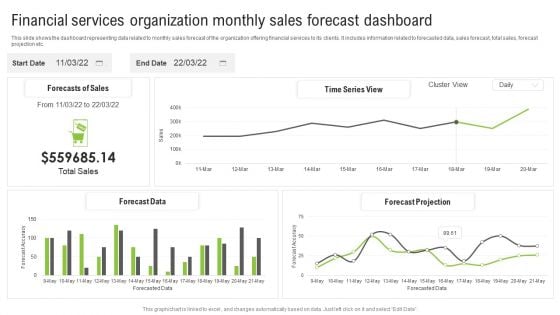
Financial Services Organization Monthly Sales Forecast Dashboard Ppt Summary Slideshow PDF
This slide shows the dashboard representing data related to monthly sales forecast of the organization offering financial services to its clients. It includes information related to forecasted data, sales forecast, total sales, forecast projection etc. Showcasing this set of slides titled Financial Services Organization Monthly Sales Forecast Dashboard Ppt Summary Slideshow PDF. The topics addressed in these templates are Forecasts Sales, Time Series View, Forecast Projection. All the content presented in this PPT design is completely editable. Download it and make adjustments in color, background, font etc. as per your unique business setting.
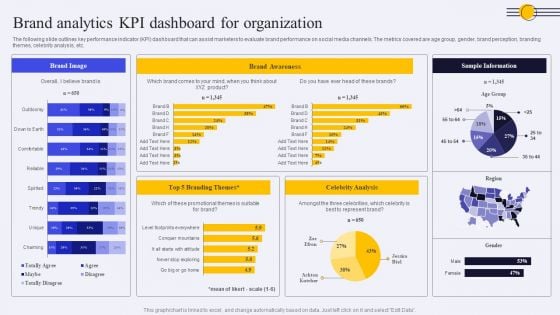
Brand Analytics KPI Dashboard For Organization Ppt PowerPoint Presentation Diagram PDF
The following slide outlines key performance indicator KPI dashboard that can assist marketers to evaluate brand performance on social media channels. The metrics covered are age group, gender, brand perception, branding themes, celebrity analysis, etc. Take your projects to the next level with our ultimate collection of Brand Analytics KPI Dashboard For Organization Ppt PowerPoint Presentation Diagram PDF. Slidegeeks has designed a range of layouts that are perfect for representing task or activity duration, keeping track of all your deadlines at a glance. Tailor these designs to your exact needs and give them a truly corporate look with your own brand colors they will make your projects stand out from the rest.
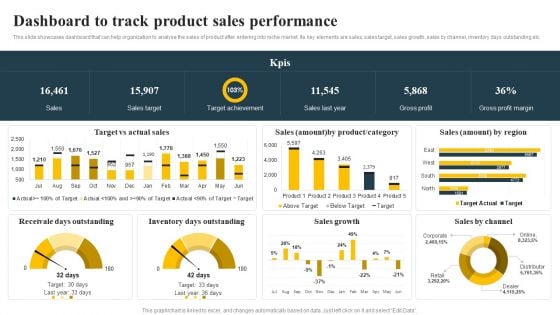
Dashboard To Track Product Sales Performance Implementing Focus Strategy To Improve Designs PDF
This slide showcases dashboard that can help organization to analyse the sales of product after entering into niche market. Its key elements are sales, sales target, sales growth, sales by channel, inventory days outstanding etc.Take your projects to the next level with our ultimate collection of Dashboard To Track Product Sales Performance Implementing Focus Strategy To Improve Designs PDF. Slidegeeks has designed a range of layouts that are perfect for representing task or activity duration, keeping track of all your deadlines at a glance. Tailor these designs to your exact needs and give them a truly corporate look with your own brand colors they all make your projects stand out from the rest.
Intelligent Process Automation IPA Hyper Automation Performance Tracking Dashboard Sample PDF
This slide depicts the performance tracking dashboard for hyper-automation, covering the number of rules triggered, automated emails, average originator, recipient, average click-through rate for automated emails, and quick links. Take your projects to the next level with our ultimate collection of Intelligent Process Automation IPA Hyper Automation Performance Tracking Dashboard Sample PDF. Slidegeeks has designed a range of layouts that are perfect for representing task or activity duration, keeping track of all your deadlines at a glance. Tailor these designs to your exact needs and give them a truly corporate look with your own brand colors they will make your projects stand out from the rest

Workplace Training Techniques For Departments And Individual Staff Dashboard To Track Employee Training Program Formats PDF
This slide showcases dashboard that can help organization to track on job training program. Its key components are training number, training status, budget, duration, training type and number of trainees. Take your projects to the next level with our ultimate collection of Workplace Training Techniques For Departments And Individual Staff Dashboard To Track Employee Training Program Formats PDF. Slidegeeks has designed a range of layouts that are perfect for representing task or activity duration, keeping track of all your deadlines at a glance. Tailor these designs to your exact needs and give them a truly corporate look with your own brand colors they will make your projects stand out from the rest.
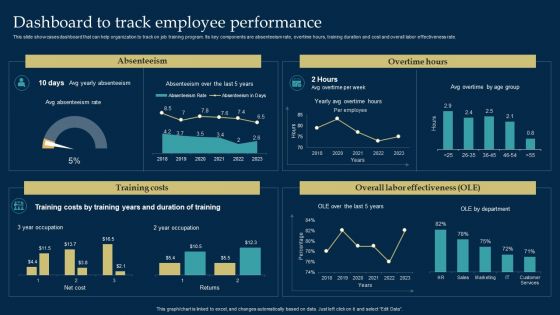
Employee Training And Development Strategy Dashboard To Track Employee Performance Slides PDF
This slide showcases dashboard that can help organization to track on job training program. Its key components are absenteeism rate, overtime hours, training duration and cost and overall labor effectiveness rate. Take your projects to the next level with our ultimate collection of Employee Training And Development Strategy Dashboard To Track Employee Performance Slides PDF. Slidegeeks has designed a range of layouts that are perfect for representing task or activity duration, keeping track of all your deadlines at a glance. Tailor these designs to your exact needs and give them a truly corporate look with your own brand colors they will make your projects stand out from the rest.
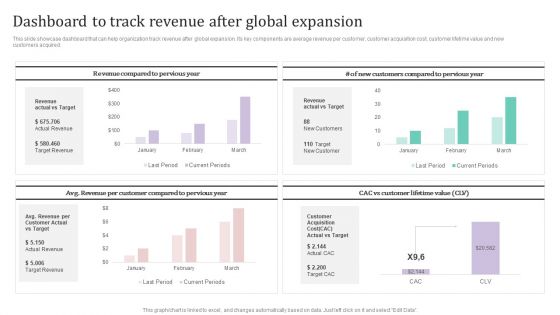
Dashboard To Track Revenue After Global Expansion Ppt PowerPoint Presentation File Example PDF
This slide showcase dashboard that can help organization track revenue after global expansion. Its key components are average revenue per customer, customer acquisition cost, customer lifetime value and new customers acquired.Take your projects to the next level with our ultimate collection of Dashboard To Track Revenue After Global Expansion Ppt PowerPoint Presentation File Example PDF. Slidegeeks has designed a range of layouts that are perfect for representing task or activity duration, keeping track of all your deadlines at a glance. Tailor these designs to your exact needs and give them a truly corporate look with your own brand colors they all make your projects stand out from the rest.
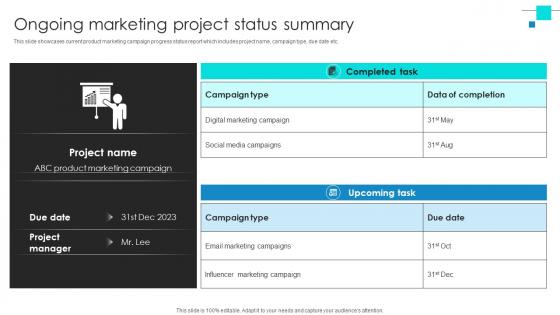
Project Benchmarking Process Ongoing Marketing Project Status Summary CRP DK SS V
This slide showcases current product marketing campaign progress status report which includes project name, campaign type, due date etc. Take your projects to the next level with our ultimate collection of Project Benchmarking Process Ongoing Marketing Project Status Summary CRP DK SS V. Slidegeeks has designed a range of layouts that are perfect for representing task or activity duration, keeping track of all your deadlines at a glance. Tailor these designs to your exact needs and give them a truly corporate look with your own brand colors they will make your projects stand out from the rest This slide showcases current product marketing campaign progress status report which includes project name, campaign type, due date etc.
Driving Results Designing A Team Training And Development Program Tracking Dashboard
This slide depicts team development program tracking dashboard to analyze the impact of implementing training plan for the members. It includes training satisfaction rate, engagement score, drop-out rate and top 5 trainees. Take your projects to the next level with our ultimate collection of Driving Results Designing A Team Training And Development Program Tracking Dashboard. Slidegeeks has designed a range of layouts that are perfect for representing task or activity duration, keeping track of all your deadlines at a glance. Tailor these designs to your exact needs and give them a truly corporate look with your own brand colors they will make your projects stand out from the rest This slide depicts team development program tracking dashboard to analyze the impact of implementing training plan for the members. It includes training satisfaction rate, engagement score, drop-out rate and top 5 trainees.
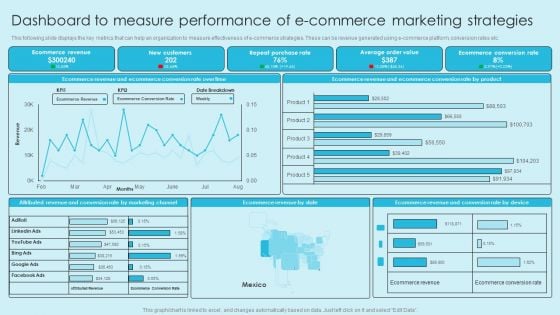
Online Marketing Techniques For Acquiring Clients Dashboard To Measure Performance Information PDF
This following slide displays the key metrics that can help an organization to measure effectiveness of social media strategies. These can be leads generated, leads by region, web traffic targets etc. Take your projects to the next level with our ultimate collection of Online Marketing Techniques For Acquiring Clients Dashboard To Measure Performance Information PDF. Slidegeeks has designed a range of layouts that are perfect for representing task or activity duration, keeping track of all your deadlines at a glance. Tailor these designs to your exact needs and give them a truly corporate look with your own brand colors they will make your projects stand out from the rest.
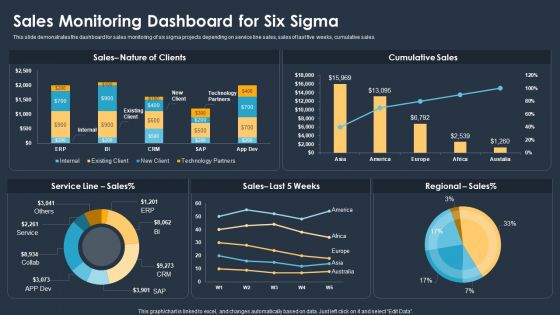
Six Sigma Methodologies For Process Optimization Sales Monitoring Dashboard For Six Sigma Elements PDF
This slide demonstrates the dashboard for sales monitoring of six sigma projects depending on service line sales, sales of last five weeks, cumulative sales. Showcasing this set of slides titled Six Sigma Methodologies For Process Optimization Sales Monitoring Dashboard For Six Sigma Elements PDF. The topics addressed in these templates are Sales, Service Line, Technology Partners. All the content presented in this PPT design is completely editable. Download it and make adjustments in color, background, font etc. as per your unique business setting.
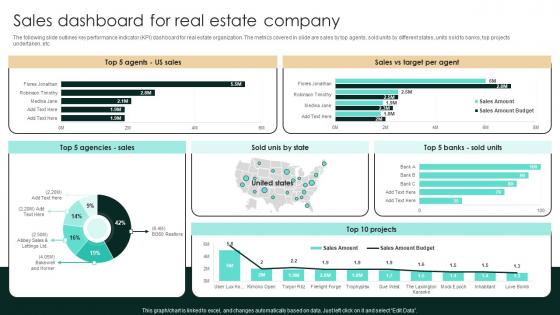
Sales Dashboard For Real Estate Company Strategic Real Estate Introduction Pdf
The following slide outlines key performance indicator KPI dashboard for real estate organization. The metrics covered in slide are sales by top agents, sold units by different states, units sold to banks, top projects undertaken, etc. If you are looking for a format to display your unique thoughts, then the professionally designed Sales Dashboard For Real Estate Company Strategic Real Estate Introduction Pdf is the one for you. You can use it as a Google Slides template or a PowerPoint template. Incorporate impressive visuals, symbols, images, and other charts. Modify or reorganize the text boxes as you desire. Experiment with shade schemes and font pairings. Alter, share or cooperate with other people on your work. Download Sales Dashboard For Real Estate Company Strategic Real Estate Introduction Pdf and find out how to give a successful presentation. Present a perfect display to your team and make your presentation unforgettable. The following slide outlines key performance indicator KPI dashboard for real estate organization. The metrics covered in slide are sales by top agents, sold units by different states, units sold to banks, top projects undertaken, etc.
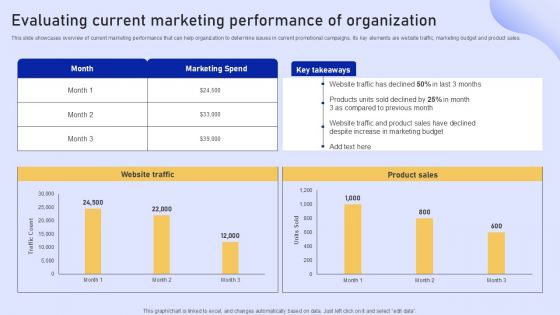
Online Marketing Strategy For Lead Generation Dashboard To Track Website Traffic During Performance Icons PDF
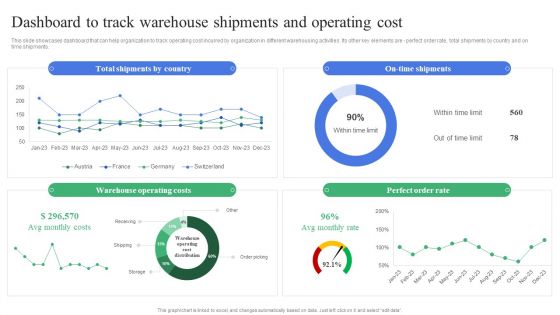
Strategic Guidelines To Administer Dashboard To Track Warehouse Shipments And Operating Sample PDF
This slide showcases dashboard that can help organization to track operating cost incurred by organization in different warehousing activities. Its other key elements are - perfect order rate, total shipments by country and on time shipments. Take your projects to the next level with our ultimate collection of Strategic Guidelines To Administer Dashboard To Track Warehouse Shipments And Operating Sample PDF. Slidegeeks has designed a range of layouts that are perfect for representing task or activity duration, keeping track of all your deadlines at a glance. Tailor these designs to your exact needs and give them a truly corporate look with your own brand colors theyll make your projects stand out from the rest.
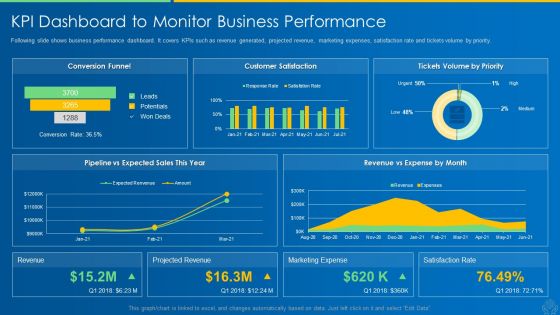
AI And ML Driving Monetary Value For Organization KPI Dashboard To Monitor Business Performance Graphics PDF
Following slide shows business performance dashboard. It covers KPIs such as revenue generated, projected revenue, marketing expenses, satisfaction rate and tickets volume by priority. Deliver and pitch your topic in the best possible manner with this ai and ml driving monetary value for organization kpi dashboard to monitor business performance graphics pdf. Use them to share invaluable insights on business offerings, current impact, product innovations, customer service and impress your audience. This template can be altered and modified as per your expectations. So, grab it now.
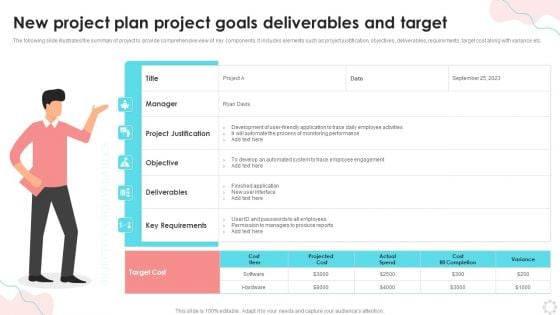
New Project Plan Project Goals Deliverables And Target Ppt PowerPoint Presentation Infographics Graphics Download PDF
The following slide illustrates the summary of project to provide comprehensive view of key components. It includes elements such as project justification, objectives, deliverables, requirements, target cost along with variance etc. Showcasing this set of slides titled New Project Plan Project Goals Deliverables And Target Ppt PowerPoint Presentation Infographics Graphics Download PDF. The topics addressed in these templates are Monitoring Performance, Key Requirements, Permission Managers. All the content presented in this PPT design is completely editable. Download it and make adjustments in color, background, font etc. as per your unique business setting.

IoT Solutions For Oil Oil And Gas Production Monitoring KPI Dashboard IoT SS V
This slide exhibits monthly performance of oil and gas production to track wellhead uptime and overall efficiency. It includes various elements such as production efficiency, well uptime, gas production rate, oil production rate, top performing gas producing wells, etc. Take your projects to the next level with our ultimate collection of IoT Solutions For Oil Oil And Gas Production Monitoring KPI Dashboard IoT SS V. Slidegeeks has designed a range of layouts that are perfect for representing task or activity duration, keeping track of all your deadlines at a glance. Tailor these designs to your exact needs and give them a truly corporate look with your own brand colors they will make your projects stand out from the rest This slide exhibits monthly performance of oil and gas production to track wellhead uptime and overall efficiency. It includes various elements such as production efficiency, well uptime, gas production rate, oil production rate, top performing gas producing wells, etc.
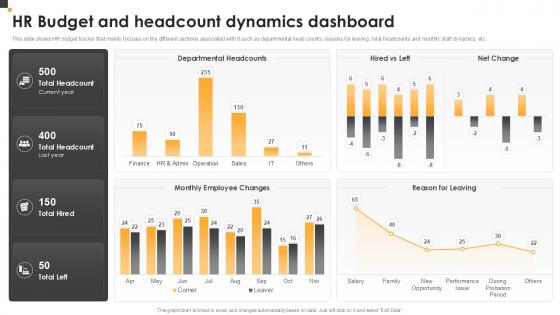
HR Budget And Headcount Dynamics Dashboard HR Budget Planning Ppt Slide
There are so many reasons you need a HR Budget And Headcount Dynamics Dashboard HR Budget Planning Ppt Slide. The first reason is you can not spend time making everything from scratch, Thus, Slidegeeks has made presentation templates for you too. You can easily download these templates from our website easily. This HR Budget Tracker slide provides a comprehensive overview of various key HR metrics, including departmental headcounts, reasons for employee departures, total staff count, and monthly staff dynamics. It is designed to help HR professionals efficiently monitor and manage personnel-related costs, providing valuable insights into workforce changes and trends.
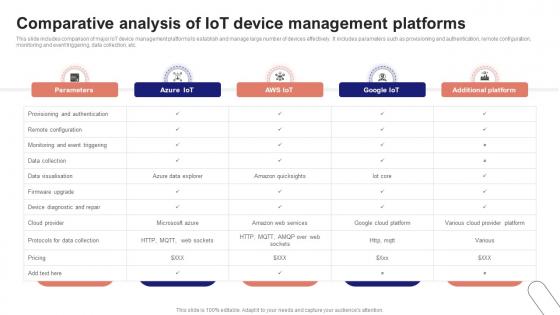
IoT Device Management Fundamentals Comparative Analysis Of IoT Device Management Platforms IoT Ss V
This slide includes comparison of major IoT device management platforms to establish and manage large number of devices effectively. It includes parameters such as provisioning and authentication, remote configuration, monitoring and event triggering, data collection, etc. If your project calls for a presentation, then Slidegeeks is your go-to partner because we have professionally designed, easy-to-edit templates that are perfect for any presentation. After downloading, you can easily edit IoT Device Management Fundamentals Comparative Analysis Of IoT Device Management Platforms IoT SS V and make the changes accordingly. You can rearrange slides or fill them with different images. Check out all the handy templates This slide includes comparison of major IoT device management platforms to establish and manage large number of devices effectively. It includes parameters such as provisioning and authentication, remote configuration, monitoring and event triggering, data collection, etc.
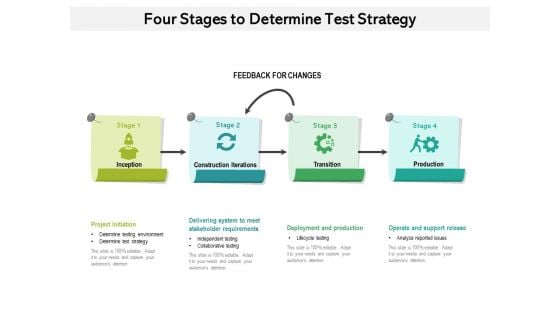
Four Stages To Determine Test Strategy Ppt PowerPoint Presentation Portfolio Example PDF
Persuade your audience using this four stages to determine test strategy ppt powerpoint presentation portfolio example pdf. This PPT design covers four stages, thus making it a great tool to use. It also caters to a variety of topics including inception, construction iterations, transition, production, project initiation, deployment and production,analyze reported issues. Download this PPT design now to present a convincing pitch that not only emphasizes the topic but also showcases your presentation skills
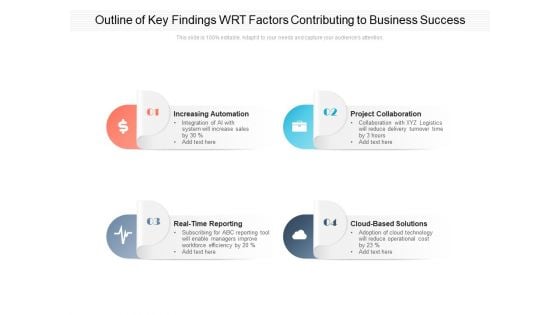
Outline Of Key Findings WRT Factors Contributing To Business Success Ppt PowerPoint Presentation Portfolio Vector PDF
Presenting outline of key findings wrt factors contributing to business success ppt powerpoint presentation portfolio vector pdf to dispense important information. This template comprises four stages. It also presents valuable insights into the topics including increasing automation, real time reporting, cloud based solutions, project collaboration. This is a completely customizable PowerPoint theme that can be put to use immediately. So, download it and address the topic impactfully.
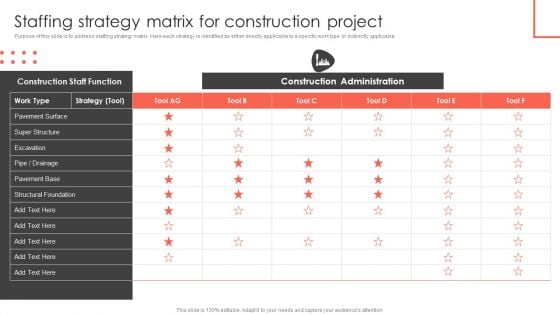
Staffing Strategy Matrix For Construction Project Construct Project Feasibility Analysis Report Themes PDF
Purpose of this slide is to address staffing strategy matrix. Here each strategy is identified as either directly applicable to a specific work type or indirectly applicable. The Staffing Strategy Matrix For Construction Project Construct Project Feasibility Analysis Report Themes PDF is a compilation of the most recent design trends as a series of slides. It is suitable for any subject or industry presentation, containing attractive visuals and photo spots for businesses to clearly express their messages. This template contains a variety of slides for the user to input data, such as structures to contrast two elements, bullet points, and slides for written information. Slidegeeks is prepared to create an impression.
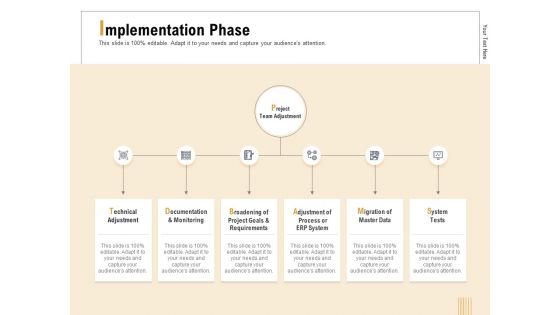
Business Activity Flows Optimization Implementation Phase Ppt PowerPoint Presentation Portfolio Smartart PDF
Presenting this set of slides with name business activity flows optimization implementation phase ppt powerpoint presentation portfolio smartart pdf. This is a eight stage process. The stages in this process are technical adjustment, documentation and monitoring, broadening of project goals and requirements, adjustment of process or erp system, migration of master data, system tests. This is a completely editable PowerPoint presentation and is available for immediate download. Download now and impress your audience.
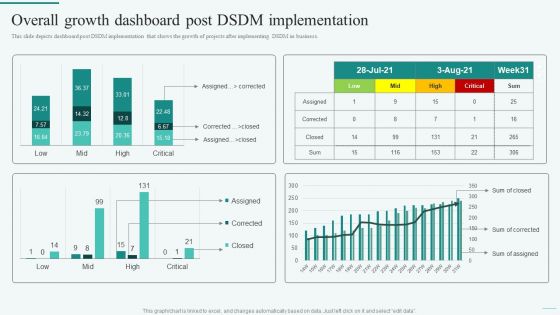
Overall Growth Dashboard Post DSDM Implementation Integration Of Dynamic System To Enhance Processes Designs PDF
This slide depicts dashboard post DSDM implementation that shows the growth of projects after implementing DSDM in business.Here you can discover an assortment of the finest PowerPoint and Google Slides templates. With these templates, you can create presentations for a variety of purposes while simultaneously providing your audience with an eye-catching visual experience. Download Overall Growth Dashboard Post DSDM Implementation Integration Of Dynamic System To Enhance Processes Designs PDF to deliver an impeccable presentation. These templates will make your job of preparing presentations much quicker, yet still, maintain a high level of quality. Slidegeeks has experienced researchers who prepare these templates and write high-quality content for you. Later on, you can personalize the content by editing the Overall Growth Dashboard Post DSDM Implementation Integration Of Dynamic System To Enhance Processes Designs PDF.
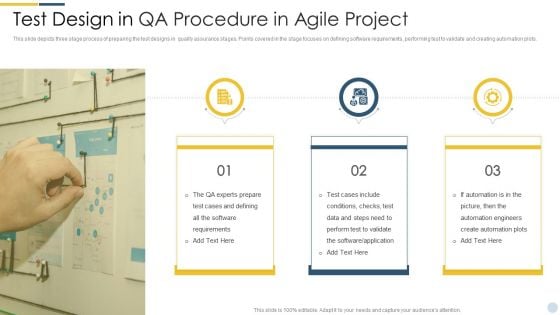
Quality Assurance Procedure In Agile Project Test Design In Qa Procedure In Agile Project Information PDF
This slide depicts three stage process of preparing the test designs in quality assurance stages. Points covered in the stage focuses on defining software requirements, performing test to validate and creating automation plots. This is a quality assurance procedure in agile project test design in qa procedure in agile project information pdf template with various stages. Focus and dispense information on three stages using this creative set, that comes with editable features. It contains large content boxes to add your information on topics like the qa experts prepare test cases, test cases include conditions, checks, test data, automation engineers create automation plots. You can also showcase facts, figures, and other relevant content using this PPT layout. Grab it now.
SFA Dashboard To Track Performance Ppt PowerPoint Presentation Icon Example File PDF
This Slide visually represents sales force automation dashboard to track performance which can be utilized by marketing managers to streamline the process of automated selling. It includes information about sales pipeline, competitors, opportunities, key competitors, etc. Pitch your topic with ease and precision using this sfa dashboard to track performance ppt powerpoint presentation icon example file pdf. This layout presents information on sales pipeline, sales pipeline by sales rep, key competitors, forecast by month, key opportunities. It is also available for immediate download and adjustment. So, changes can be made in the color, design, graphics or any other component to create a unique layout.
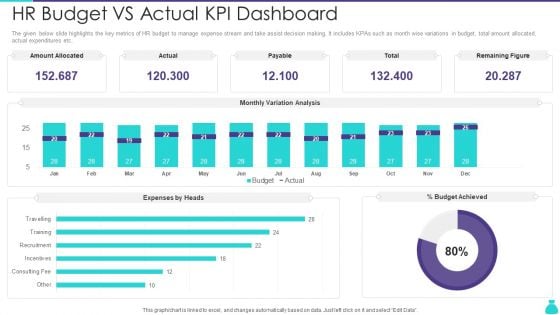
HR Budget Vs Actual KPI Dashboard Ppt PowerPoint Presentation File Structure PDF
The given below slide highlights the key metrics of HR budget to manage expense stream and take assist decision making. It includes KPAs such as month wise variations in budget, total amount allocated, actual expenditures etc. Pitch your topic with ease and precision using this HR Budget Vs Actual KPI Dashboard Ppt PowerPoint Presentation File Structure PDF. This layout presents information on Amount Allocated, Expenses by Heads, Budget Achieved. It is also available for immediate download and adjustment. So, changes can be made in the color, design, graphics or any other component to create a unique layout.


 Continue with Email

 Home
Home


