Promote Icon
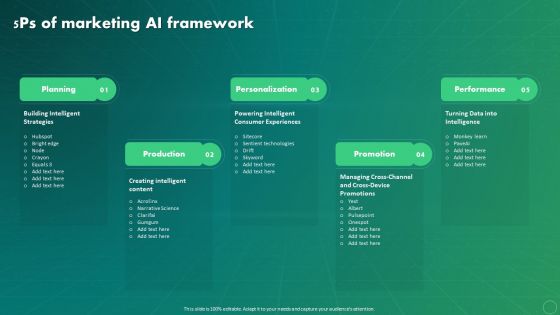
Maximizing Business Impact Through ML 5Ps Of Marketing AI Framework Diagrams PDF
Do you have to make sure that everyone on your team knows about any specific topic I yes, then you should give Maximizing Business Impact Through ML 5Ps Of Marketing AI Framework Diagrams PDF a try. Our experts have put a lot of knowledge and effort into creating this impeccable Maximizing Business Impact Through ML 5Ps Of Marketing AI Framework Diagrams PDF. You can use this template for your upcoming presentations, as the slides are perfect to represent even the tiniest detail. You can download these templates from the Slidegeeks website and these are easy to edit. So grab these today.
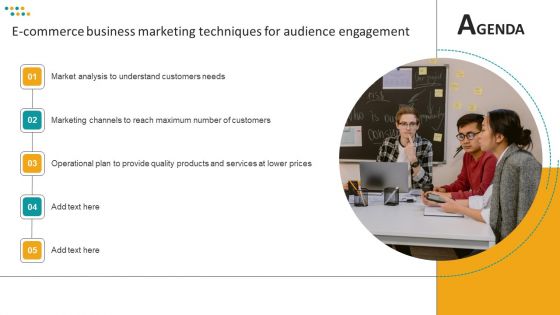
Agenda E Commerce Business Marketing Techniques For Audience Engagement Diagrams PDF
Crafting an eye-catching presentation has never been more straightforward. Let your presentation shine with this tasteful yet straightforward Agenda E Commerce Business Marketing Techniques For Audience Engagement Diagrams PDF template. It offers a minimalistic and classy look that is great for making a statement. The colors have been employed intelligently to add a bit of playfulness while still remaining professional. Construct the ideal Agenda E Commerce Business Marketing Techniques For Audience Engagement Diagrams PDF that effortlessly grabs the attention of your audience Begin now and be certain to wow your customers.
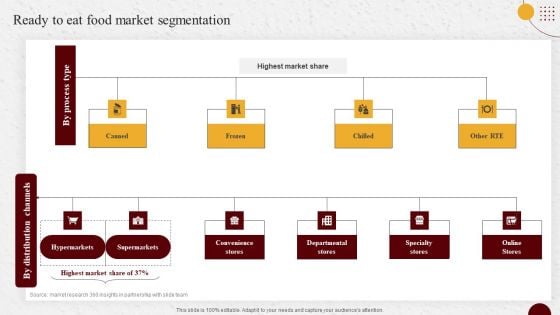
Industry Report Of Packaged Food Products Part 1 Ready To Eat Food Market Segmentation Diagrams PDF
Explore a selection of the finest Industry Report Of Packaged Food Products Part 1 Ready To Eat Food Market Segmentation Diagrams PDF here. With a plethora of professionally designed and pre made slide templates, you can quickly and easily find the right one for your upcoming presentation. You can use our Industry Report Of Packaged Food Products Part 1 Ready To Eat Food Market Segmentation Diagrams PDF to effectively convey your message to a wider audience. Slidegeeks has done a lot of research before preparing these presentation templates. The content can be personalized and the slides are highly editable. Grab templates today from Slidegeeks.
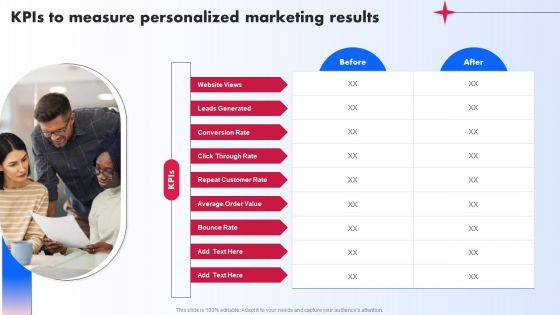
Kpis To Measure Personalized Marketing Results Ppt PowerPoint Presentation Diagram PDF
This Kpis To Measure Personalized Marketing Results Ppt PowerPoint Presentation Diagram PDF is perfect for any presentation, be it in front of clients or colleagues. It is a versatile and stylish solution for organizing your meetings. The Kpis To Measure Personalized Marketing Results Ppt PowerPoint Presentation Diagram PDF features a modern design for your presentation meetings. The adjustable and customizable slides provide unlimited possibilities for acing up your presentation. Slidegeeks has done all the homework before launching the product for you. So, do not wait, grab the presentation templates today
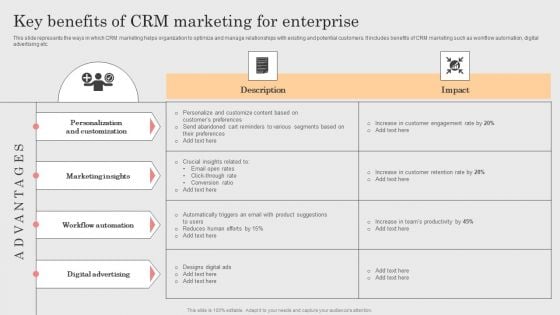
Integrating CRM Solution To Acquire Potential Customers Key Benefits Of CRM Marketing For Enterprise Diagrams PDF
This Integrating CRM Solution To Acquire Potential Customers Key Benefits Of CRM Marketing For Enterprise Diagrams PDF is perfect for any presentation, be it in front of clients or colleagues. It is a versatile and stylish solution for organizing your meetings. The Integrating CRM Solution To Acquire Potential Customers Key Benefits Of CRM Marketing For Enterprise Diagrams PDF features a modern design for your presentation meetings. The adjustable and customizable slides provide unlimited possibilities for acing up your presentation. Slidegeeks has done all the homework before launching the product for you. So, do not wait, grab the presentation templates today
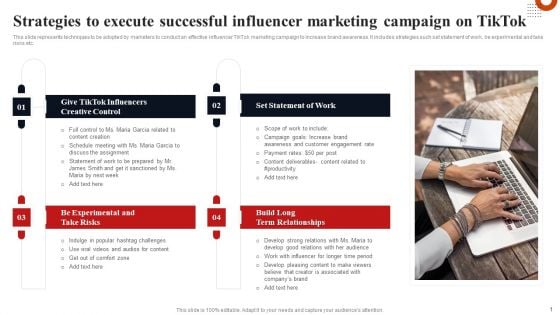
Strategies To Execute Successful Influencer Marketing Campaign On Tiktok Diagrams PDF
Do you have an important presentation coming up Are you looking for something that will make your presentation stand out from the rest Look no further than Strategies To Execute Successful Influencer Marketing Campaign On Tiktok Diagrams PDF. With our professional designs, you can trust that your presentation will pop and make delivering it a smooth process. And with Slidegeeks, you can trust that your presentation will be unique and memorable. So why wait Grab Strategies To Execute Successful Influencer Marketing Campaign On Tiktok Diagrams PDF today and make your presentation stand out from the rest.
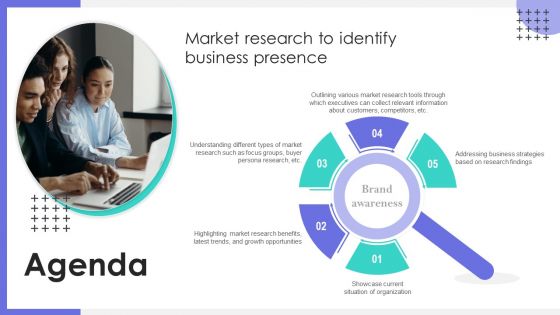
Agenda Market Research To Identify Business Presence Ppt Professional Diagrams PDF
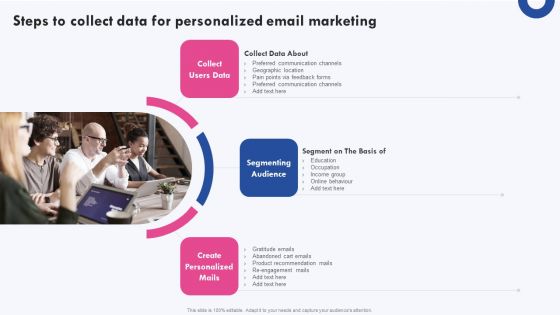
Targeted Marketing Campaigns To Improve Buyers Experience Steps To Collect Data For Personalized Email Diagrams PDF
Do you have an important presentation coming up Are you looking for something that will make your presentation stand out from the rest Look no further than Targeted Marketing Campaigns To Improve Buyers Experience Steps To Collect Data For Personalized Email Diagrams PDF. With our professional designs, you can trust that your presentation will pop and make delivering it a smooth process. And with Slidegeeks, you can trust that your presentation will be unique and memorable. So why wait Grab Targeted Marketing Campaigns To Improve Buyers Experience Steps To Collect Data For Personalized Email Diagrams PDF today and make your presentation stand out from the rest.
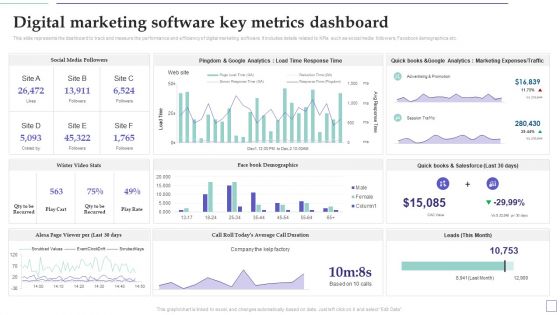
System Deployment Project Digital Marketing Software Key Metrics Dashboard Graphics PDF
This slide represents the dashboard to track and measure the performance and efficiency of digital marketing software. It includes details related to KPIs such as social media followers, Facebook demographics etc. If you are looking for a format to display your unique thoughts, then the professionally designed System Deployment Project Digital Marketing Software Key Metrics Dashboard Graphics PDF is the one for you. You can use it as a Google Slides template or a PowerPoint template. Incorporate impressive visuals, symbols, images, and other charts. Modify or reorganize the text boxes as you desire. Experiment with shade schemes and font pairings. Alter, share or cooperate with other people on your work. Download System Deployment Project Digital Marketing Software Key Metrics Dashboard Graphics PDF and find out how to give a successful presentation. Present a perfect display to your team and make your presentation unforgettable.
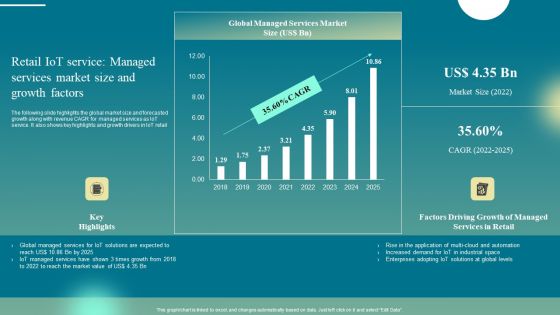
Retail Iot Service Managed Services Market Size And Growth Factors Introduction PDF
The following slide highlights the global market size and forecasted growth along with revenue CAGR for managed services as IoT service. It also shows key highlights and growth drivers in IoT retail. If you are looking for a format to display your unique thoughts, then the professionally designed Retail Iot Service Managed Services Market Size And Growth Factors Introduction PDF is the one for you. You can use it as a Google Slides template or a PowerPoint template. Incorporate impressive visuals, symbols, images, and other charts. Modify or reorganize the text boxes as you desire. Experiment with shade schemes and font pairings. Alter, share or cooperate with other people on your work. Download Retail Iot Service Managed Services Market Size And Growth Factors Introduction PDF and find out how to give a successful presentation. Present a perfect display to your team and make your presentation unforgettable.
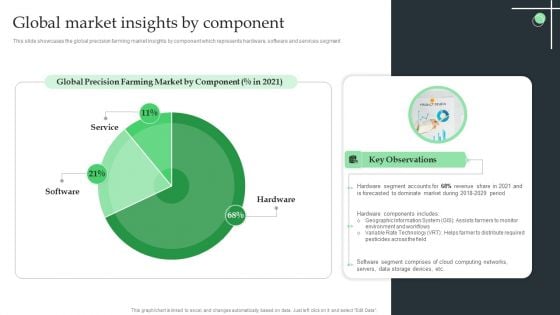
Global Market Insights By Component Ppt Infographic Template Background Designs PDF
This slide showcases the global precision farming market insights by component which represents hardware, software and services segment. If you are looking for a format to display your unique thoughts, then the professionally designed Global Market Insights By Component Ppt Infographic Template Background Designs PDF is the one for you. You can use it as a Google Slides template or a PowerPoint template. Incorporate impressive visuals, symbols, images, and other charts. Modify or reorganize the text boxes as you desire. Experiment with shade schemes and font pairings. Alter, share or cooperate with other people on your work. Download Global Market Insights By Component Ppt Infographic Template Background Designs PDF and find out how to give a successful presentation. Present a perfect display to your team and make your presentation unforgettable.
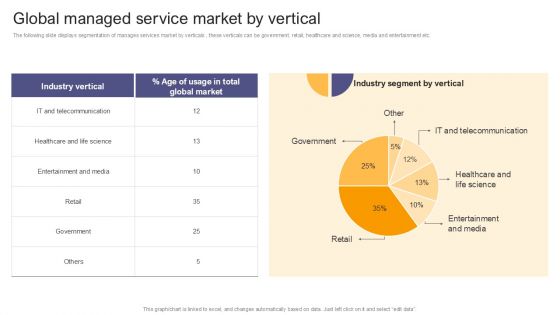
Per Device Pricing Strategy For Managed Solutions Global Managed Service Market By Vertical Topics PDF
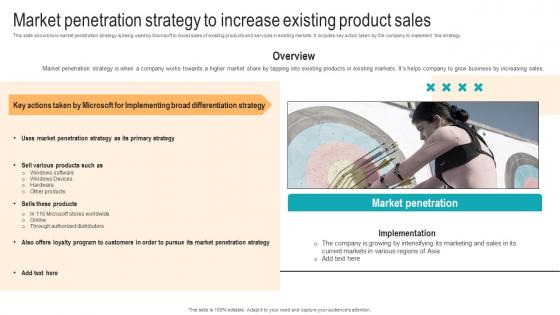
Market Penetration Strategy To Increase Existing Strategic Advancements By Microsofts Slides Pdf
This slide shows how market penetration strategy is being used by Microsoft to boost sales of existing products and services in existing markets. It includes key action taken by the company to implement this strategy. The Market Penetration Strategy To Increase Existing Strategic Advancements By Microsofts Slides Pdf is a compilation of the most recent design trends as a series of slides. It is suitable for any subject or industry presentation, containing attractive visuals and photo spots for businesses to clearly express their messages. This template contains a variety of slides for the user to input data, such as structures to contrast two elements, bullet points, and slides for written information. Slidegeeks is prepared to create an impression. This slide shows how market penetration strategy is being used by Microsoft to boost sales of existing products and services in existing markets. It includes key action taken by the company to implement this strategy.
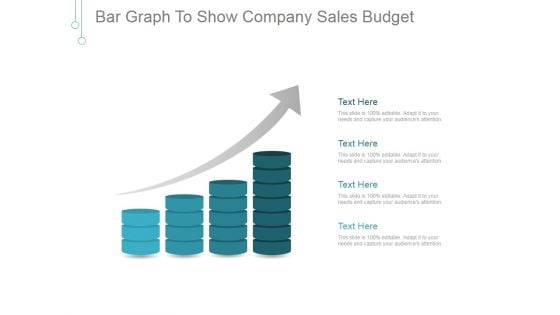
Bar Graph To Show Company Sales Budget Ppt PowerPoint Presentation Sample
This is a bar graph to show company sales budget ppt powerpoint presentation sample. This is a four stage process. The stages in this process are business, finance, growth, success, marketing, arrow.
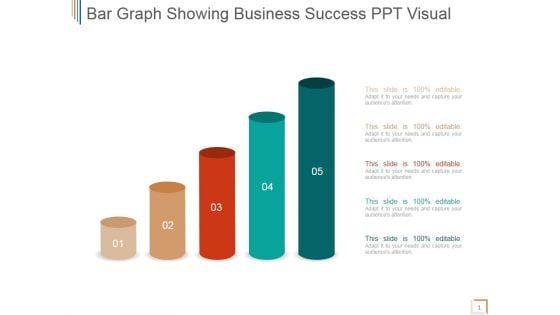
Bar Graph Showing Business Success Ppt PowerPoint Presentation Inspiration
This is a bar graph showing business success ppt powerpoint presentation inspiration. This is a five stage process. The stages in this process are business, success, marketing, management, strategy.
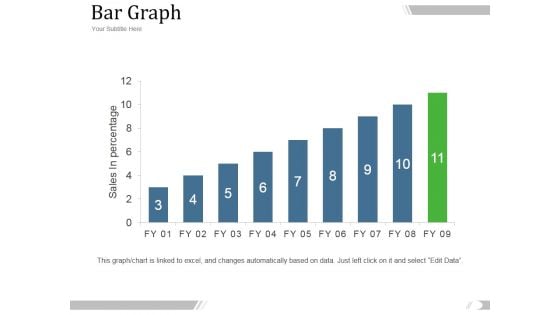
Bar Graph Ppt PowerPoint Presentation Introduction
This is a bar graph ppt powerpoint presentation introduction. This is a eleven stage process. The stages in this process are management, marketing, business, fy, graph, sales in percentage.
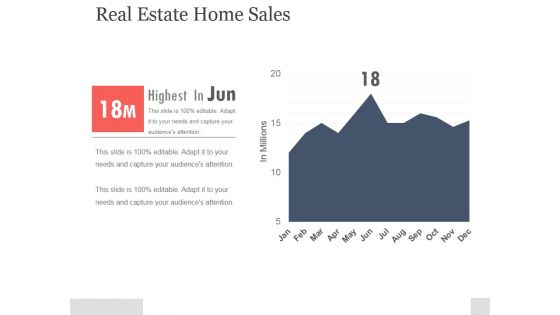
Real Estate Home Sales Ppt PowerPoint Presentation Pictures
This is a real estate home sales ppt powerpoint presentation pictures. This is a one stage process. The stages in this process are bar graph, business, marketing, success, management.
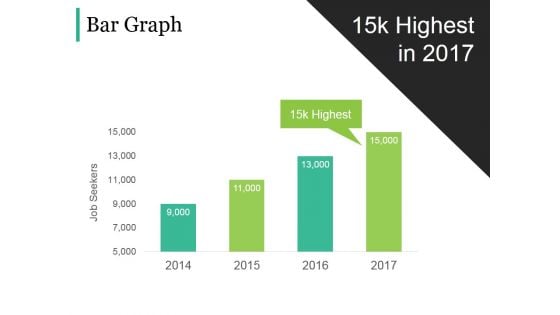
Bar Graph Ppt PowerPoint Presentation Gallery Example Topics
This is a bar graph ppt powerpoint presentation gallery example topics. This is a four stage process. The stages in this process are business, strategy, marketing, analysis, finance, bar graph.
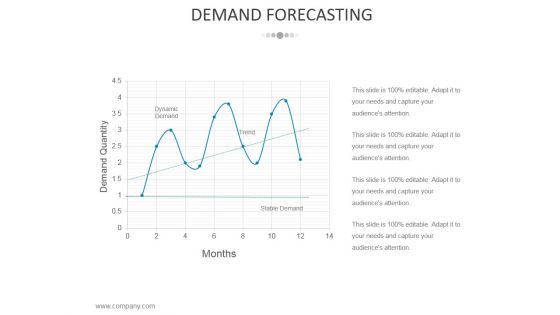
Demand Forecasting Template 2 Ppt PowerPoint Presentation Slides Deck
This is a demand forecasting template 2 ppt powerpoint presentation slides deck. This is a four stage process. The stages in this process are business, strategy, marketing, analysis, growth.
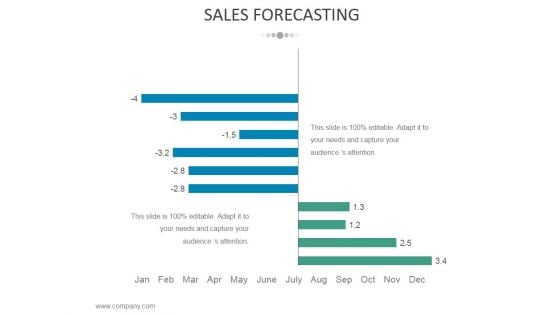
Sales Forecasting Template 1 Ppt PowerPoint Presentation Infographic Template Maker
This is a sales forecasting template 1 ppt powerpoint presentation infographic template maker. This is a two stage process. The stages in this process are business, strategy, marketing, analysis, finance.
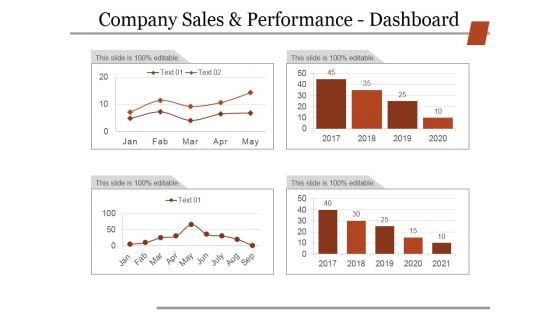
Company Sales And Performance Dashboard Ppt PowerPoint Presentation Slides Grid
This is a company sales and performance dashboard ppt powerpoint presentation slides grid. This is a four stage process. The stages in this process are business, strategy, marketing, finance, analysis.
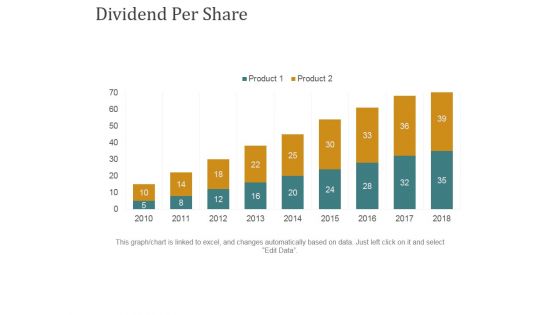
Dividend Per Share Ppt PowerPoint Presentation Summary Rules
This is a dividend per share ppt powerpoint presentation summary rules. This is a nine stage process. The stages in this process are business, bar graph, finance, marketing, strategy, growth.
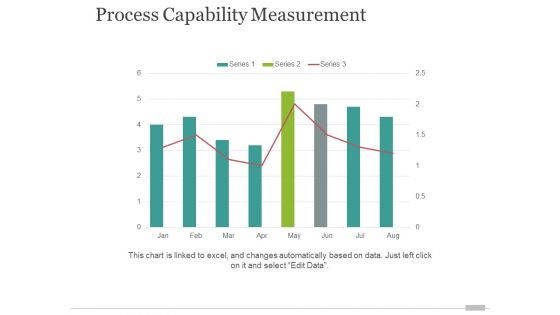
Process Capability Measurement Template 2 Ppt PowerPoint Presentation Gallery Graphics Example
This is a process capability measurement template 2 ppt powerpoint presentation gallery graphics example. This is a eight stage process. The stages in this process are finance, analysis, business, strategy, marketing.
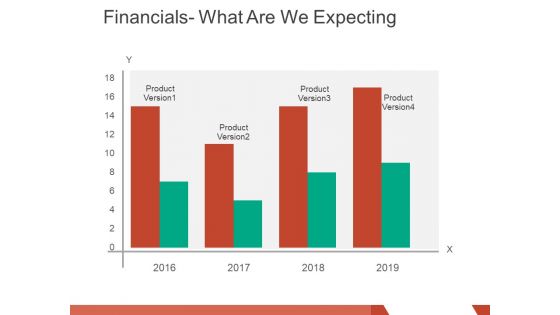
financials what are we expecting ppt powerpoint presentation layouts graphics pictures
This is a financials what are we expecting ppt powerpoint presentation layouts graphics pictures. This is a four stage process. The stages in this process are product version, business, marketing, finance, graph.
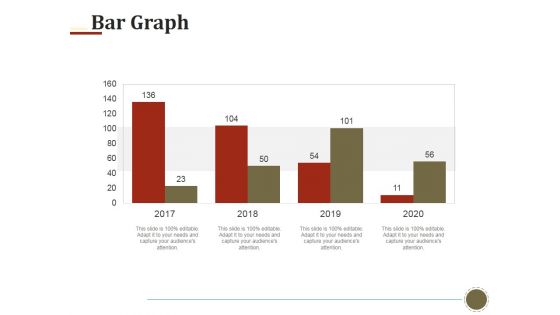
Bar Graph Ppt PowerPoint Presentation Styles Model
This is a bar graph ppt powerpoint presentation styles model. This is a four stage process. The stages in this process are bar graph, finance, marketing, analysis, investment, business.
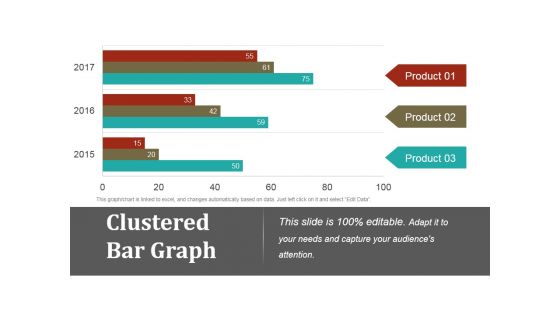
Clustered Bar Graph Ppt PowerPoint Presentation Gallery Graphics Example
This is a clustered bar graph ppt powerpoint presentation gallery graphics example. This is a three stage process. The stages in this process are clustered bar graph, finance, marketing, strategy, business.
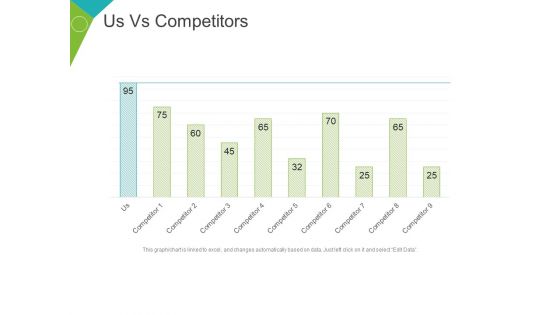
Us Vs Competitors Template 2 Ppt PowerPoint Presentation File Show
This is a us vs competitors template 2 ppt powerpoint presentation file show. This is a nine stage process. The stages in this process are competitor, graph, business, marketing, finance.
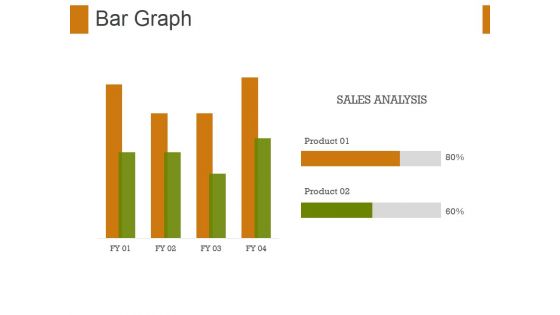
Bar Graph Ppt PowerPoint Presentation File Graphic Tips
This is a bar graph ppt powerpoint presentation file graphic tips. This is a two stage process. The stages in this process are bar graph, finance, marketing, strategy, sales, business.
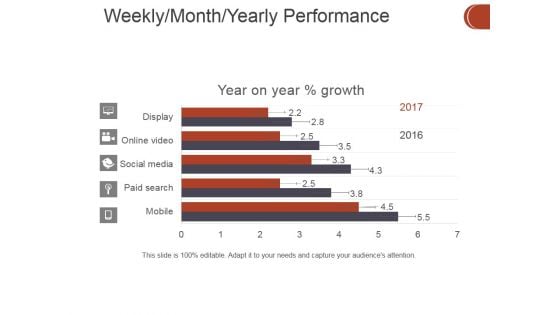
Weekly Month Yearly Performance Ppt PowerPoint Presentation Ideas Maker
This is a weekly month yearly performance ppt powerpoint presentation ideas maker. This is a five stage process. The stages in this process are business, finance, marketing, strategy, analysis, investment.
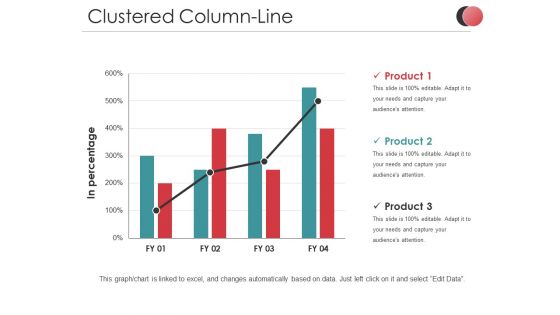
Clustered Column Line Ppt PowerPoint Presentation Infographics Templates
This is a clustered column line ppt powerpoint presentation infographics templates. This is a three stage process. The stages in this process are in percentage, business, marketing, product, finance, graph.
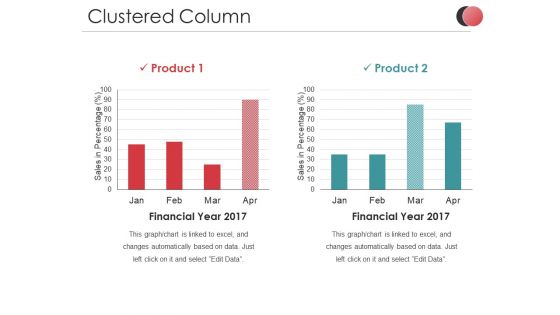
Clustered Column Ppt PowerPoint Presentation Slides Ideas
This is a clustered column ppt powerpoint presentation slides ideas. This is a two stage process. The stages in this process are sales in percentage, business, marketing, finance, graph.
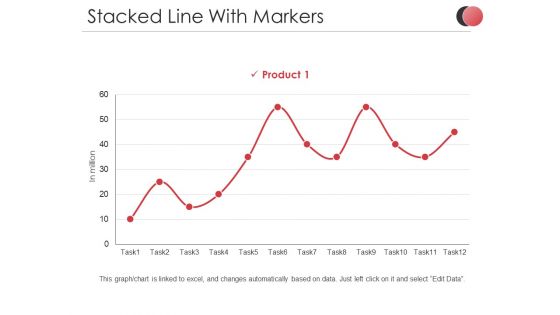
Stacked Line With Markers Ppt PowerPoint Presentation Slides Demonstration
This is a stacked line with markers ppt powerpoint presentation slides demonstration. This is a one stage process. The stages in this process are in million, product, percentage, business, marketing, finance.
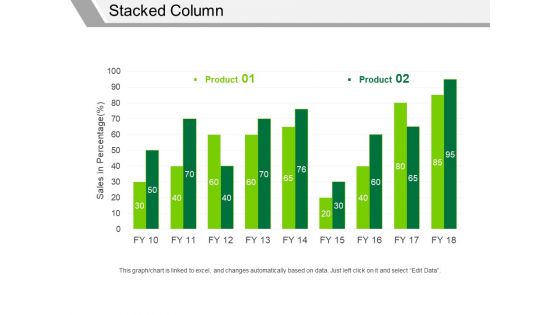
Stacked Column Ppt PowerPoint Presentation Infographics Samples
This is a stacked column ppt powerpoint presentation infographics samples. This is a two stage process. The stages in this process are product, sales in percentage, business, marketing, graph.
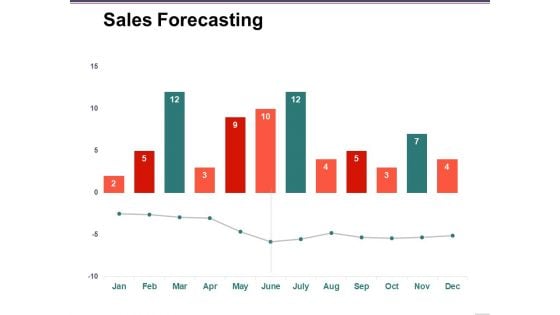
Sales Forecasting Template 2 Ppt PowerPoint Presentation Infographic Template Examples
This is a sales forecasting template 2 ppt powerpoint presentation infographic template examples. This is a two stage process. The stages in this process are forecasting, business, marketing, finance, graph.
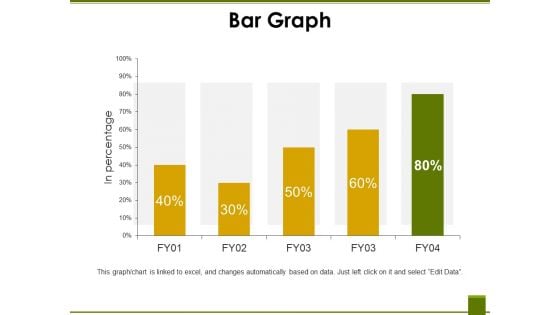
Bar Graph Template 2 Ppt PowerPoint Presentation Ideas Files
This is a bar graph template 2 ppt powerpoint presentation ideas files. This is a five stage process. The stages in this process are in percentage, business, marketing, finance, graph.
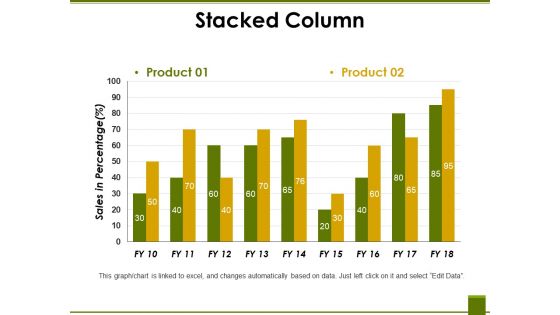
Stacked Column Ppt PowerPoint Presentation Professional Vector
This is a stacked column ppt powerpoint presentation professional vector. This is a two stage process. The stages in this process are product, sales in percentage, business, marketing, graph.
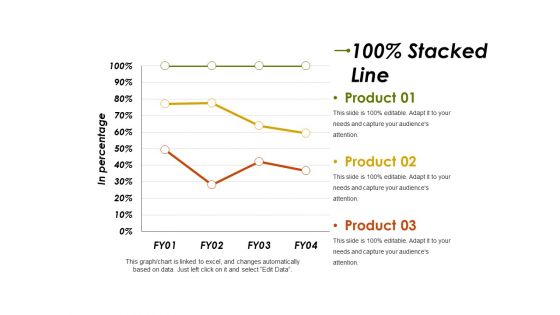
Stacked Line Ppt PowerPoint Presentation Infographic Template Graphics Template
This is a stacked line ppt powerpoint presentation infographic template graphics template. This is a three stage process. The stages in this process are product, in percentage, business, marketing, finance.
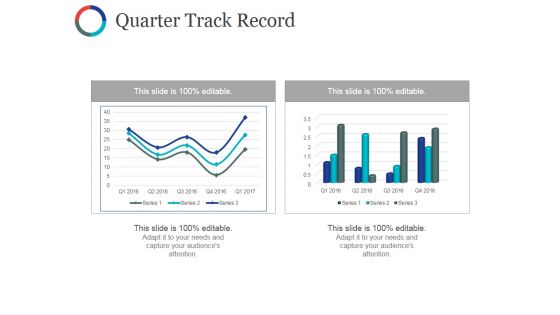
Quarter Track Record Ppt PowerPoint Presentation Professional Layout Ideas
This is a quarter track record ppt powerpoint presentation professional layout ideas. This is a two stage process. The stages in this process are business, marketing, finance, graph, plan.
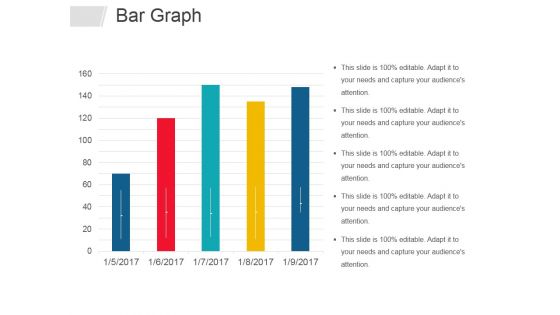
Bar Graph Ppt PowerPoint Presentation Infographics Graphics Design
This is a bar graph ppt powerpoint presentation infographics graphics design. This is a five stage process. The stages in this process are bar graph, business, years, marketing, management.
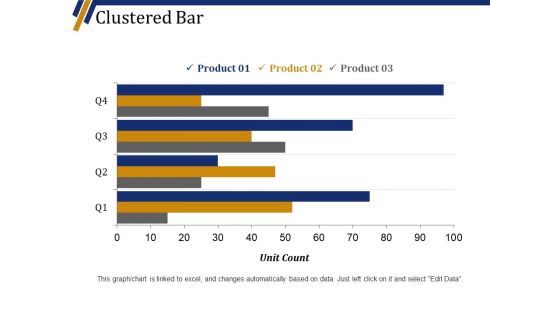
Clustered Bar Ppt PowerPoint Presentation Show Slide Portrait
This is a clustered bar ppt powerpoint presentation show slide portrait. This is a four stage process. The stages in this process are product, unit count, graph, business, marketing.
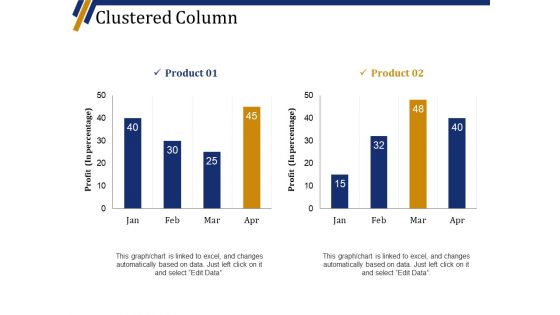
Clustered Column Ppt PowerPoint Presentation Professional Graphic Tips
This is a clustered column ppt powerpoint presentation professional graphic tips. This is a two stage process. The stages in this process are product, profit in percentage, graph, business, marketing.
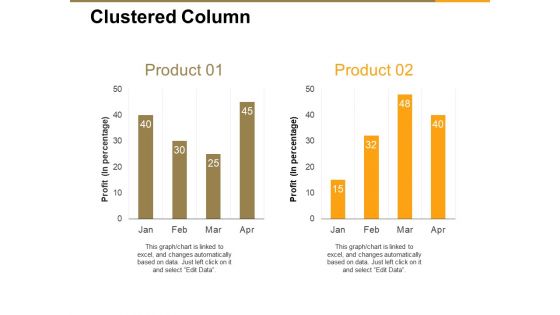
Clustered Column Ppt PowerPoint Presentation Inspiration Shapes
This is a clustered column ppt powerpoint presentation inspiration shapes. This is a two stage process. The stages in this process are profit in percentage, business, marketing, graph, finance.
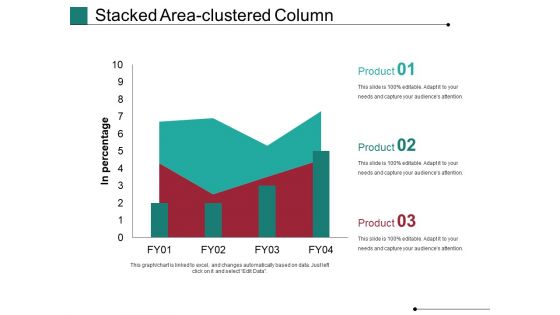
Stacked Area Clustered Column Ppt PowerPoint Presentation Ideas Show
This is a stacked area clustered column ppt powerpoint presentation ideas show. This is a three stage process. The stages in this process are in percentage, business, marketing, finance, graph.
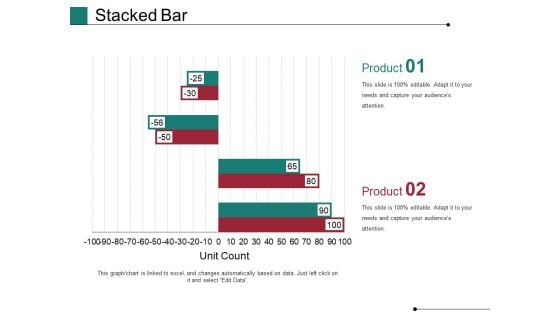
Stacked Bar Template 1 Ppt PowerPoint Presentation Show Slides
This is a stacked bar template 1 ppt powerpoint presentation show slides. This is a two stage process. The stages in this process are Unit Count, Business, Marketing, Graph, Finance.
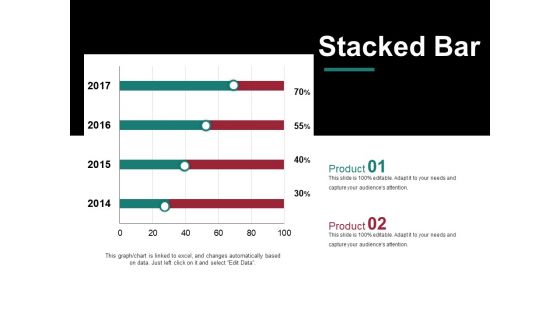
Stacked Bar Template 2 Ppt PowerPoint Presentation Model Graphic Images
This is a stacked bar template 2 ppt powerpoint presentation model graphic images. This is a two stage process. The stages in this process are business, years, marketing, percentage, finance.
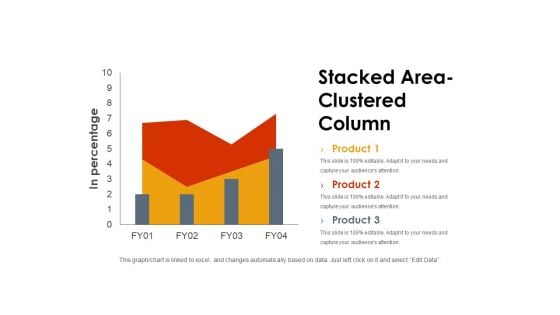
Stacked Area Clustered Column Ppt PowerPoint Presentation Styles Background Image
This is a stacked area clustered column ppt powerpoint presentation styles background image. This is a three stage process. The stages in this process are in percentage, graph, business, marketing, finance.
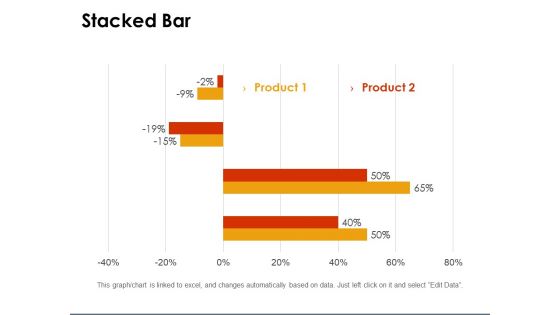
Stacked Bar Template 1 Ppt PowerPoint Presentation Gallery Clipart
This is a stacked bar template 1 ppt powerpoint presentation gallery clipart. This is a two stage process. The stages in this process are percentage, graph, business, marketing, finance.
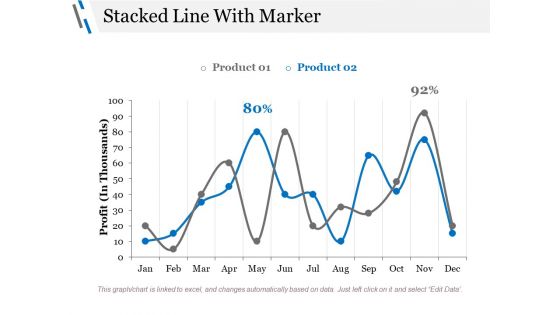
Stacked Line With Marker Ppt PowerPoint Presentation Styles Graphics Design
This is a stacked line with marker ppt powerpoint presentation styles graphics design. This is a three stage process. The stages in this process are profit, business, marketing, finance, percentage.
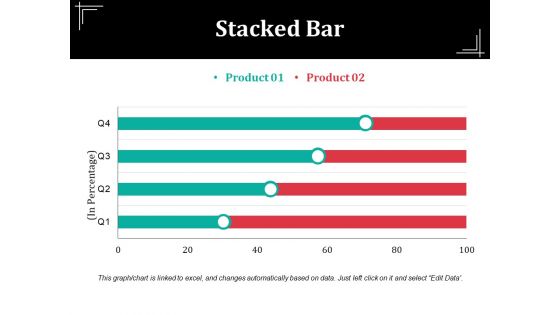
Stacked Bar Template Ppt PowerPoint Presentation Summary Visual Aids
This is a stacked bar template ppt powerpoint presentation summary visual aids. This is a three stage process. The stages in this process are unit count, business, marketing, finance, graph.
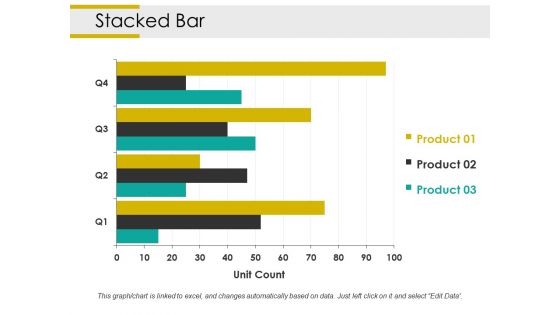
Stacked Bar Ppt PowerPoint Presentation Styles Slide Portrait
This is a stacked bar ppt powerpoint presentation styles slide portrait. This is a three stage process. The stages in this process are unit count, business, marketing, strategy, graph, finance.
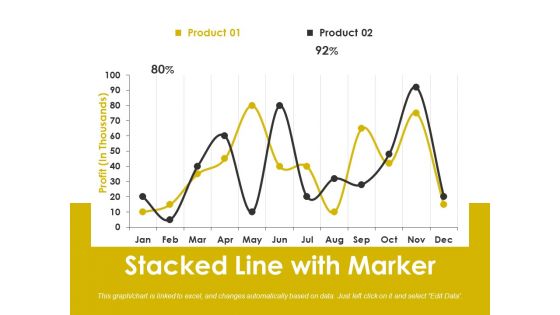
Stacked Line With Marker Ppt PowerPoint Presentation Slides File Formats
This is a stacked line with marker ppt powerpoint presentation slides file formats. This is a two stage process. The stages in this process are business, marketing, strategy, graph, finance, percentage.
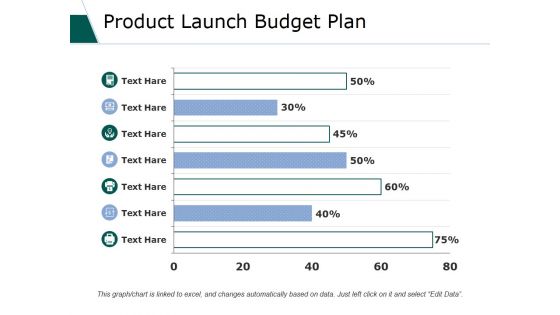
Product Launch Budget Plan Ppt PowerPoint Presentation File Formats
This is a product launch budget plan ppt powerpoint presentation file formats. This is a seven stage process. The stages in this process are business, marketing, strategy, planning, bar graph.
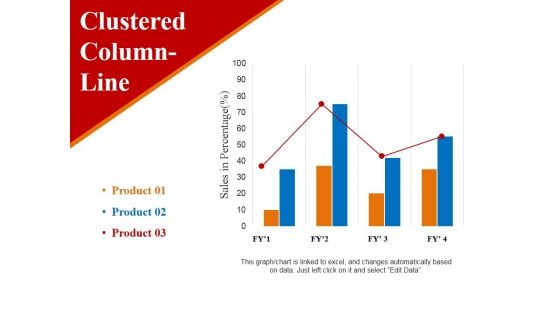
clustered column line ppt powerpoint presentation ideas example
This is a clustered column line ppt powerpoint presentation ideas example. This is a three stage process. The stages in this process are sales in percentage, business, marketing, finance, graph.
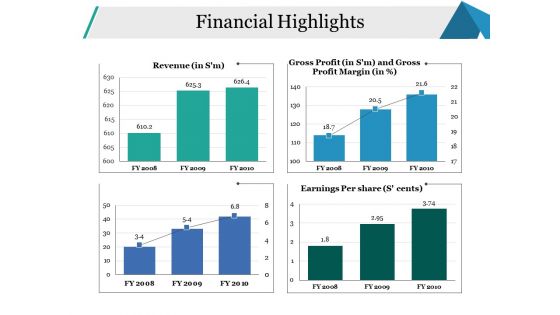
Financial Highlights Ppt PowerPoint Presentation File Background Designs
This is a financial highlights ppt powerpoint presentation file background designs. This is a four stage process. The stages in this process are revenue, earnings per share, financial, business, marketing.
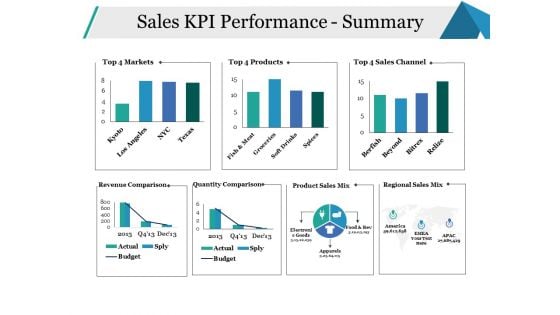
Sales KPI Performance Summary Ppt PowerPoint Presentation Infographics Model
This is a sales kpi performance summary ppt powerpoint presentation infographics model. This is a seven stage process. The stages in this process are sales channel, revenue comparison, quantity comparison, business, marketing.
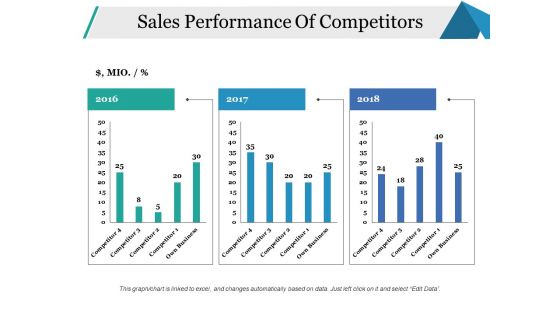
Sales Performance Of Competitors Ppt PowerPoint Presentation Portfolio Sample
This is a sales performance of competitors ppt powerpoint presentation portfolio sample. This is a three stage process. The stages in this process are business, marketing, finance, graph, years.
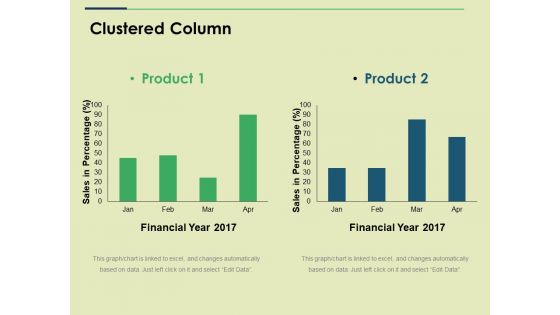
Clustered Column Ppt PowerPoint Presentation Show Graphics
This is a clustered column ppt powerpoint presentation show graphics. This is a two stage process. The stages in this process are financial year, sales in percentage, business, marketing, graph.
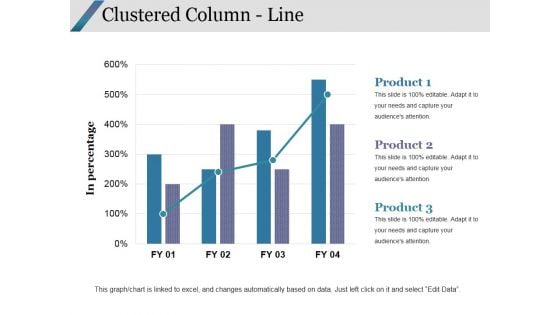
Clustered Column Line Ppt PowerPoint Presentation Portfolio Good
This is a clustered column line ppt powerpoint presentation portfolio good. This is a three stage process. The stages in this process are clustered column line, finance, marketing, strategy, analysis, business.
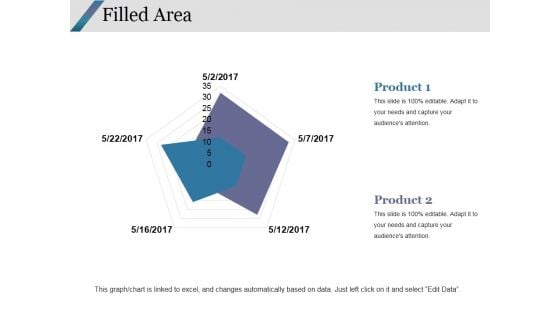
Filled Area Ppt PowerPoint Presentation Infographics Graphics Design
This is a filled area ppt powerpoint presentation infographics graphics design. This is a two stage process. The stages in this process are filled area, finance, marketing, strategy, analysis.
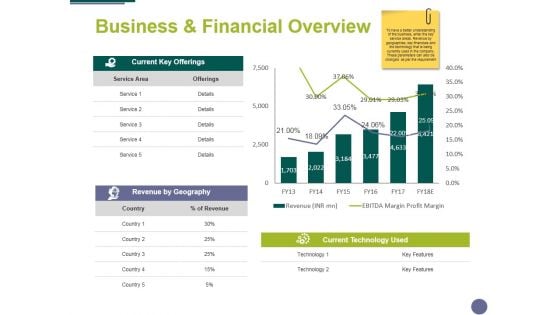
Business And Financial Overview Ppt PowerPoint Presentation Summary Format
This is a business and financial overview ppt powerpoint presentation summary format. This is a two stage process. The stages in this process are finance, analysis, marketing, business, compere.


 Continue with Email

 Home
Home


