Promote Icon
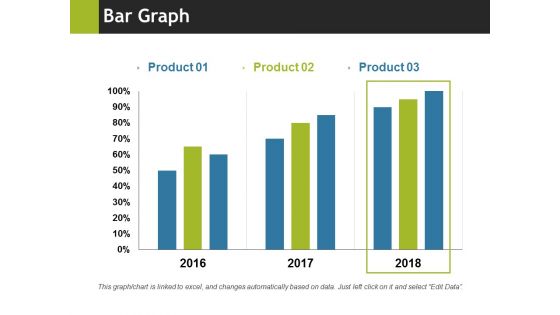
Bar Graph Ppt PowerPoint Presentation Summary Format
This is a bar graph ppt powerpoint presentation summary format. This is a three stage process. The stages in this process are bar graph, business, marketing, years, percentage, finance.
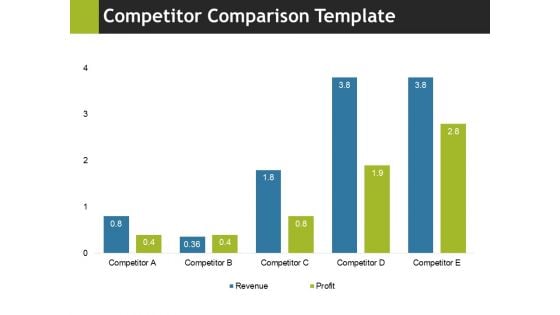
Competitor Comparison Template 1 Ppt PowerPoint Presentation Layouts Slide Portrait
This is a competitor comparison template 1 ppt powerpoint presentation layouts slide portrait. This is a four stage process. The stages in this process are business, marketing, graph, finance, strategy.
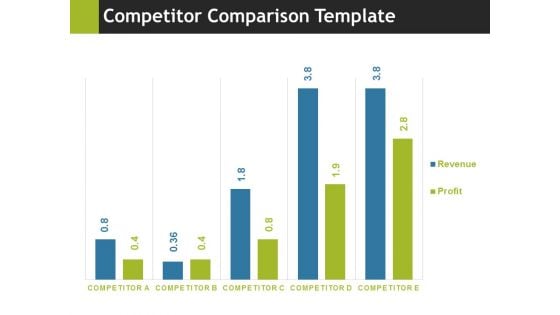
Competitor Comparison Template 2 Ppt PowerPoint Presentation Inspiration Images
This is a competitor comparison template 2 ppt powerpoint presentation inspiration images. This is a five stage process. The stages in this process are business, marketing, graph, finance, strategy.
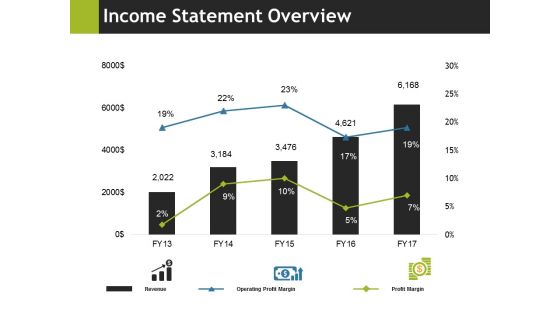
Income Statement Overview Ppt PowerPoint Presentation Professional Portfolio
This is a income statement overview ppt powerpoint presentation professional portfolio. This is a five stage process. The stages in this process are business, marketing, revenue, operating profit margin, profit margin.
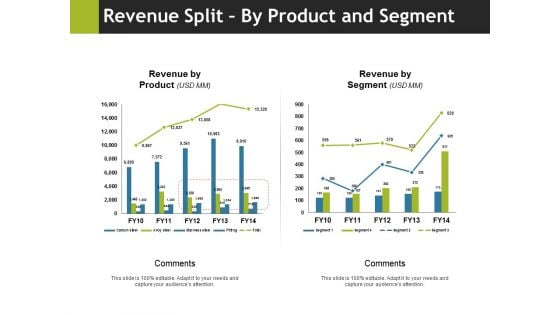
Revenue Split By Product And Segment Ppt PowerPoint Presentation Gallery Example
This is a revenue split by product and segment ppt powerpoint presentation gallery example. This is a two stage process. The stages in this process are comments, revenue by product, revenue by segment, business, marketing.
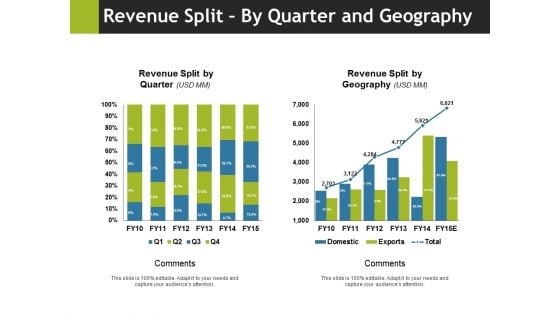
Revenue Split By Quarter And Geography Ppt PowerPoint Presentation Slides Vector
This is a revenue split by quarter and geography ppt powerpoint presentation slides vector. This is a two stage process. The stages in this process are revenue split by quarter, comments, revenue split by geography, business, marketing.
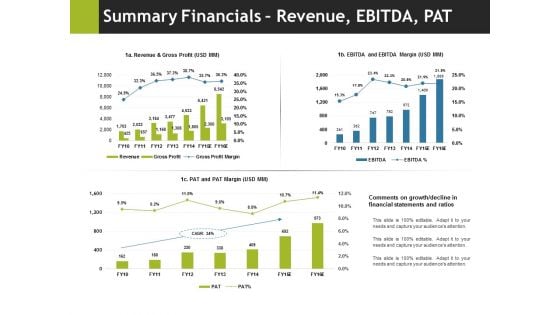
Summary Financials Revenue Ebitda Pat Ppt PowerPoint Presentation Pictures Outline
This is a summary financials revenue ebitda pat ppt powerpoint presentation pictures outline. This is a three stage process. The stages in this process are business, marketing, pat and pat margin, ebitda and ebitda margin, revenue and gross profit.
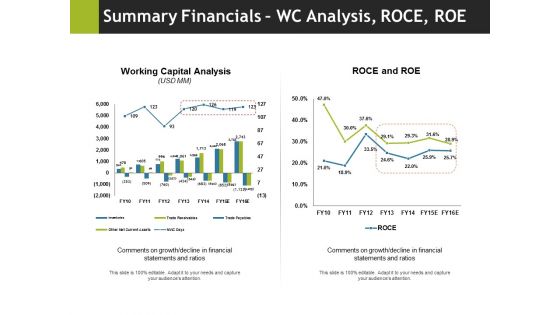
Summary Financials Wc Analysis Roce Roe Ppt PowerPoint Presentation Ideas Rules
This is a summary financials wc analysis roce roe ppt powerpoint presentation ideas rules. This is a two stage process. The stages in this process are business, marketing, working capital analysis, roce and roe, graph.
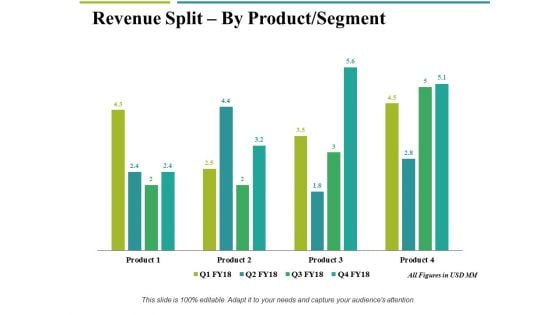
Revenue Split By Product Segment Template 2 Ppt PowerPoint Presentation Gallery Example File
This is a revenue split by product segment template 2 ppt powerpoint presentation gallery example file. This is a four stage process. The stages in this process are business, marketing, graph, finance, revenue split.
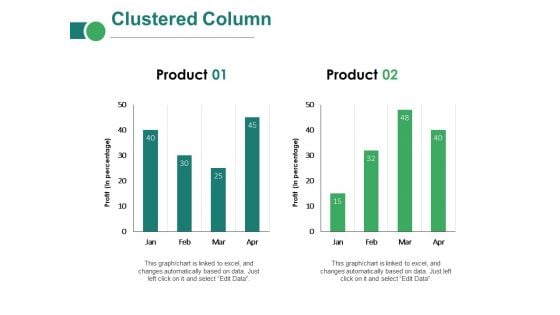
Clustered Column Ppt PowerPoint Presentation Inspiration Introduction
This is a clustered column ppt powerpoint presentation inspiration introduction. This is a two stage process. The stages in this process are business, marketing, in percentage, finance, graph, strategy.
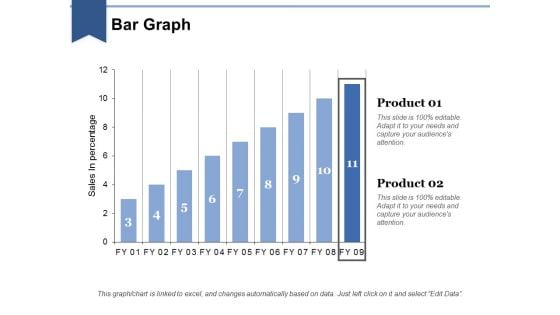
Bar Graph Ppt PowerPoint Presentation Layouts Influencers
This is a bar graph ppt powerpoint presentation layouts influencers. This is a two stage process. The stages in this process are business, marketing, in bar graph, sales in percentage, finance.

Income Statement Graphical Representation Ppt PowerPoint Presentation Visual Aids Layouts
This is a income statement graphical representation ppt powerpoint presentation visual aids layouts. This is a four stage process. The stages in this process are business, marketing, revenue, operating profit, net profit, cogs.
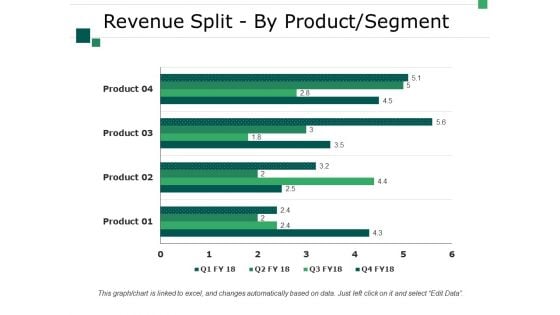
Revenue Split By Product Segment Template 2 Ppt PowerPoint Presentation Summary Good
This is a revenue split by product segment template 2 ppt powerpoint presentation summary good. This is a four stage process. The stages in this process are business, marketing, finance, strategy, graph.
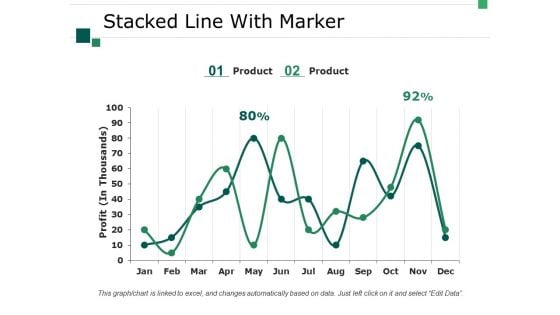
Stacked Line With Marker Ppt PowerPoint Presentation Professional Designs Download
This is a stacked line with marker ppt powerpoint presentation professional designs download. This is a two stage process. The stages in this process are business, marketing, strategy, graph, profit.
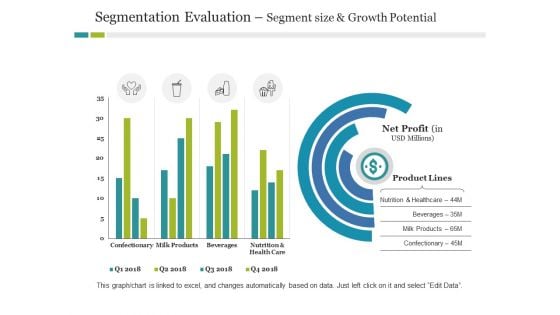
Segmentation Evaluation Segment Size And Growth Potential Ppt PowerPoint Presentation Infographic Template Outline
This is a segmentation evaluation segment size and growth potential ppt powerpoint presentation infographic template outline. This is a two stage process. The stages in this process are business, product lines, finance, marketing, strategy.
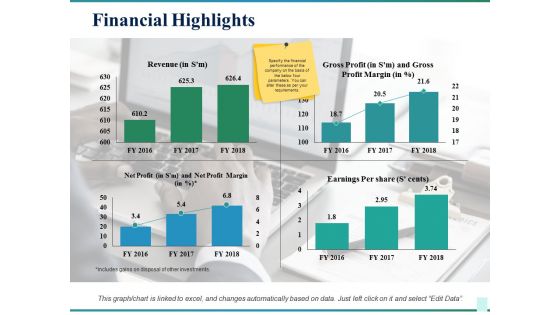
Financial Highlights Ppt PowerPoint Presentation Infographic Template Slide Download
This is a financial highlights ppt powerpoint presentation infographic template slide download. This is a four stage process. The stages in this process are business, revenue, gross profit, earnings per share, net profit, marketing.
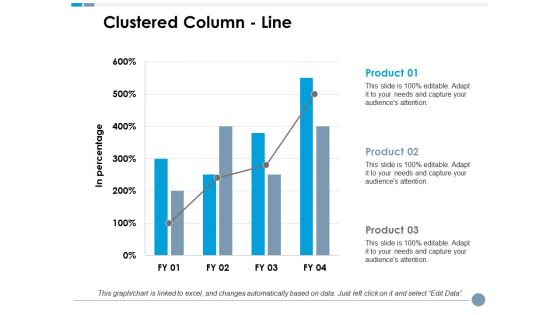
Clustered Column Line Ppt PowerPoint Presentation Model Graphics Tutorials
This is a clustered column line ppt powerpoint presentation model graphics tutorials. This is a three stage process. The stages in this process are business, marketing, in percentage, finance, graph.
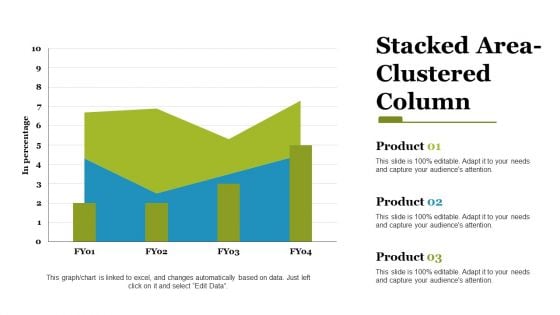
stacked area clustered column ppt powerpoint presentation styles files
This is a stacked area clustered column ppt powerpoint presentation styles files. This is a three stage process. The stages in this process are stacked area, clustered column, finance, marketing, strategy, business.
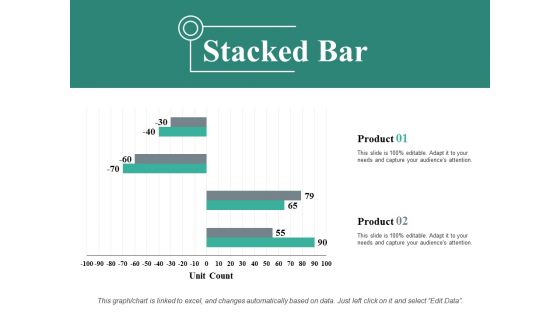
Stacked Bar Ppt PowerPoint Presentation Show Background Designs
This is a stacked bar ppt powerpoint presentation show background designs. This is a two stage process. The stages in this process are stacked bar, business, marketing, finance, unit count.
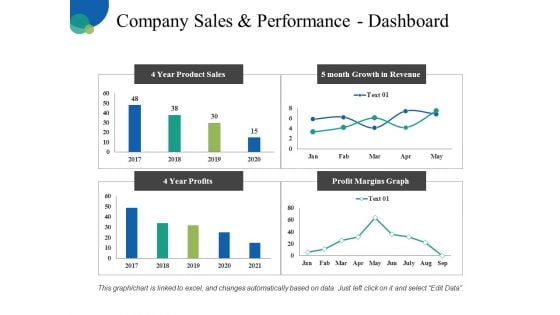
Company Sales And Performance Dashboard Ppt PowerPoint Presentation Pictures Infographic Template
This is a company sales and performance dashboard ppt powerpoint presentation pictures infographic template. This is a four stage process. The stages in this process are business, finance, analysis, management, marketing.
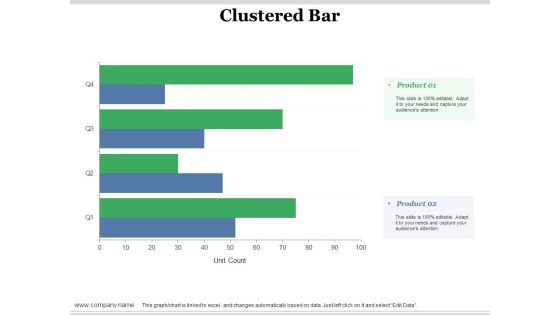
Clustered Bar Ppt PowerPoint Presentation Slides Example Topics
This is a clustered bar ppt powerpoint presentation slides example topics. This is a two stage process. The stages in this process are clustered bar, product, unit count, business, marketing.
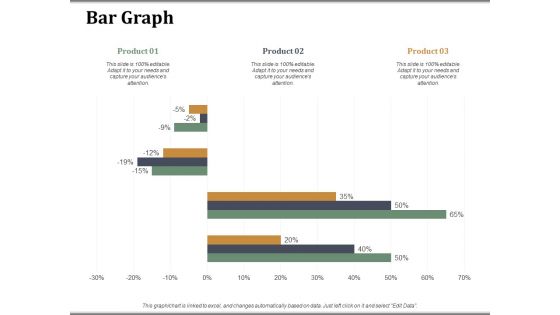
Bar Graph Companys Business Model Canvas Ppt PowerPoint Presentation Visual Aids Model
This is a bar graph companys business model canvas ppt powerpoint presentation visual aids model. This is a three stage process. The stages in this process are bar graph, finance, marketing, strategy, analysis, business.
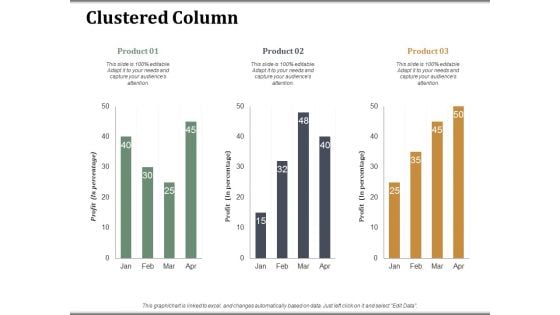
Clustered Column Companys Business Model Canvas Ppt PowerPoint Presentation Slides Topics
This is a clustered column companys business model canvas ppt powerpoint presentation slides topics. This is a three stage process. The stages in this process are clustered column, finance, marketing, strategy, analysis, investment.
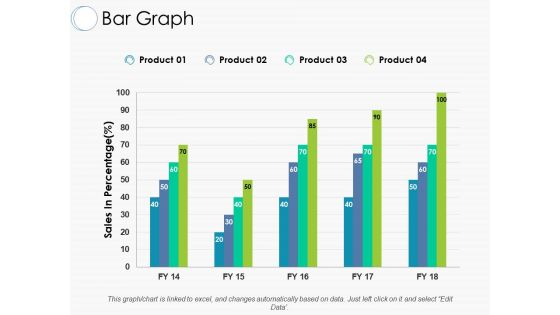
Bar Graph Ppt PowerPoint Presentation Summary Brochure
This is a bar graph ppt powerpoint presentation summary brochure. This is a four stage process. The stages in this process are business, market strategy, management, bar graph, product
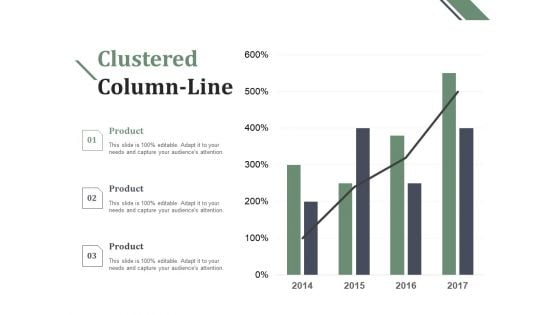
Clustered Column Line Ppt PowerPoint Presentation Layouts Graphics Tutorials
This is a clustered column line ppt powerpoint presentation layouts graphics tutorials. This is a three stage process. The stages in this process are marketing, business, management, planning, strategy.
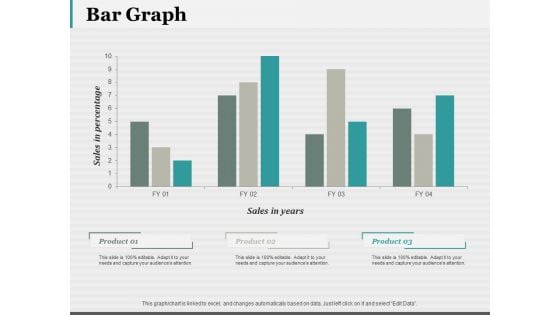
Bar Graph 7 QC Tools Ppt PowerPoint Presentation Styles Structure
This is a bar graph 7 qc tools ppt powerpoint presentation styles structure. This is a three stage process. The stages in this process are bar graph, finance, marketing, analysis, investment.
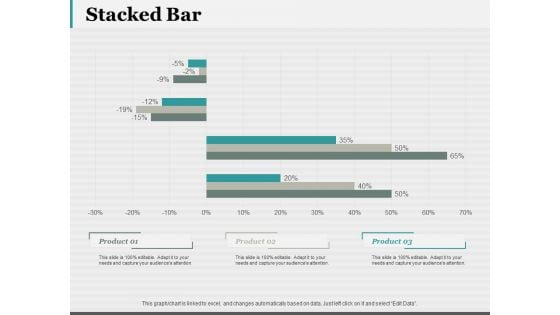
Stacked Bar 7 QC Tools Ppt PowerPoint Presentation Portfolio Smartart
This is a stacked bar 7 qc tools ppt powerpoint presentation portfolio smartart. This is a three stage process. The stages in this process are stacked bar, finance, marketing, strategy, business.
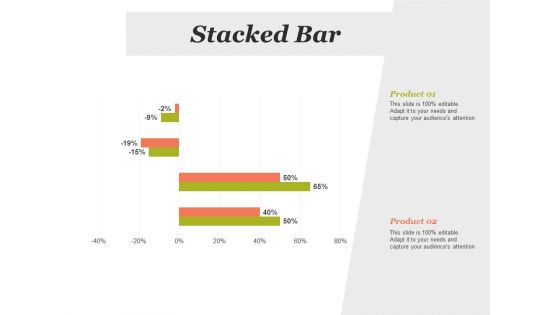
Stacked Bar Financial Analysis Ppt PowerPoint Presentation Infographic Template Slides
This is a stacked bar financial analysis ppt powerpoint presentation infographic template slides. This is a two stage process. The stages in this process are stacked bar, finance, marketing, strategy, analysis.
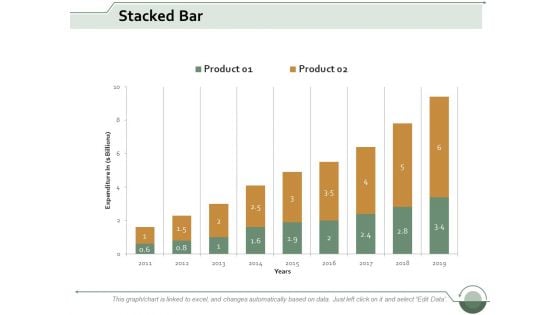
Stacked Bar Finance Ppt Powerpoint Presentation Inspiration Guide
This is a stacked bar finance ppt powerpoint presentation inspiration guide. This is a two stage process. The stages in this process are stacked bar, finance, marketing, management, analysis.
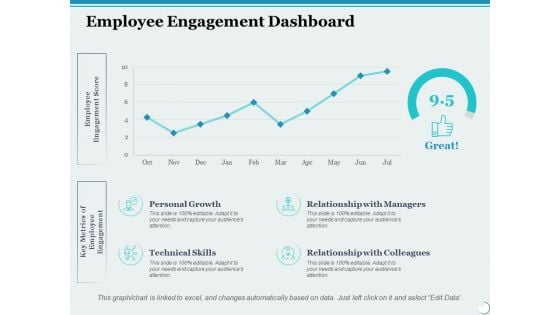
Employee Engagement Dashboard Ppt PowerPoint Presentation Inspiration Format
This is a employee engagement dashboard ppt powerpoint presentation inspiration format. This is a four stage process. The stages in this process are personal growth, relationship with managers, business, management, marketing.
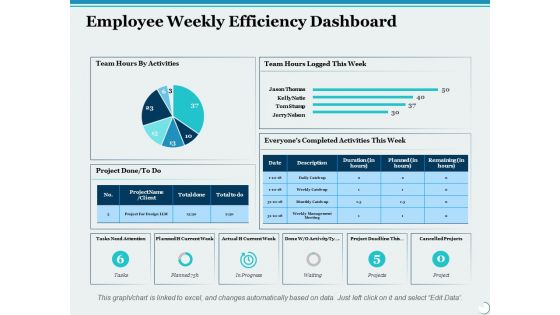
Employee Weekly Efficiency Dashboard Ppt PowerPoint Presentation Infographic Template Graphic Images
This is a employee weekly efficiency dashboard ppt powerpoint presentation infographic template graphic images. This is a six stage process. The stages in this process are percentage, product, business, management, marketing.
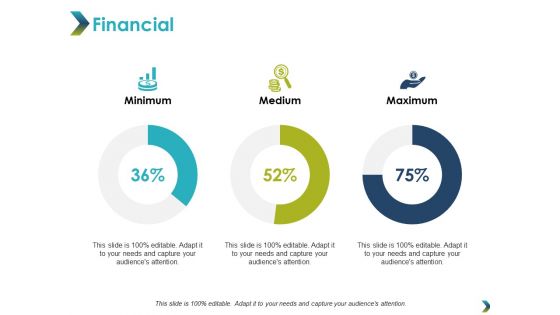
Financial Minimum Maximum Ppt PowerPoint Presentation Infographic Template Picture
This is a financial minimum maximum ppt powerpoint presentation infographic template picture. This is a three stage process. The stages in this process are financial, minimum, maximum, marketing, strategy.
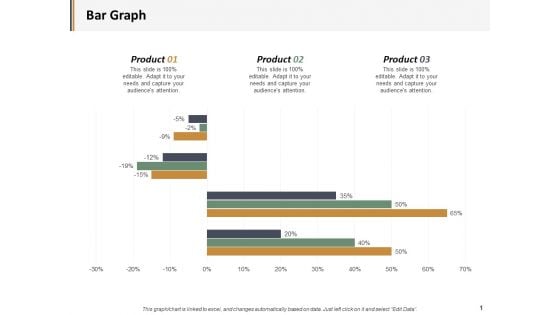
Bar Graph Percentage Product Ppt PowerPoint Presentation Layouts Microsoft
This is a bar graph percentage product ppt powerpoint presentation layouts microsoft. This is a three stage process. The stages in this process are business, management, marketing, percentage, product.
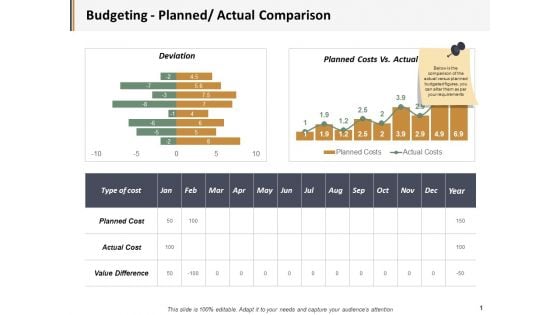
Budgeting Planned Actual Comparison Ppt PowerPoint Presentation Visual Aids Gallery
This is a budgeting planned actual comparison ppt powerpoint presentation visual aids gallery. This is a three stage process. The stages in this process are business, management, marketing, percentage, product.
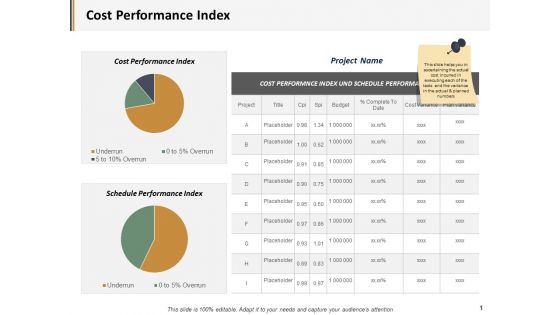
Cost Performance Index Ppt PowerPoint Presentation Inspiration Graphics Example
This is a cost performance index ppt powerpoint presentation inspiration graphics example. This is a three stage process. The stages in this process are business, management, marketing, percentage, product.
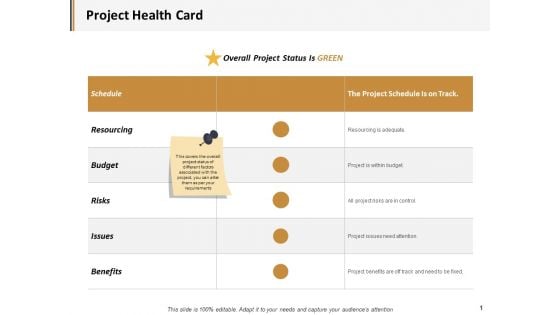
Project Health Card Resourcing Ppt PowerPoint Presentation Summary Graphics Download
This is a project health card resourcing ppt powerpoint presentation summary graphics download. This is a six stage process. The stages in this process are business, management, marketing, percentage, product.
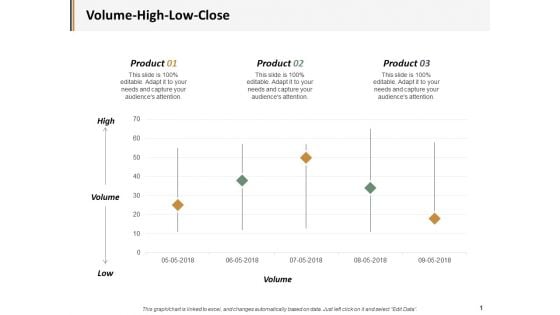
Volume High Low Close Ppt PowerPoint Presentation Ideas Example Introduction
This is a volume high low close ppt powerpoint presentation ideas example introduction. This is a three stage process. The stages in this process are business, management, marketing, percentage, product.
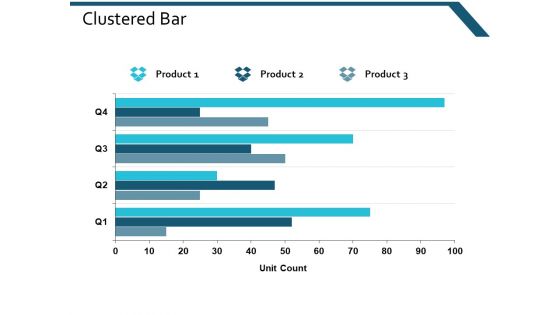
Clustered Bar Investment Ppt Powerpoint Presentation Gallery Clipart
This is a clustered bar investment ppt powerpoint presentation gallery clipart. This is a three stage process. The stages in this process are clustered bar, finance, marketing, management, analysis.
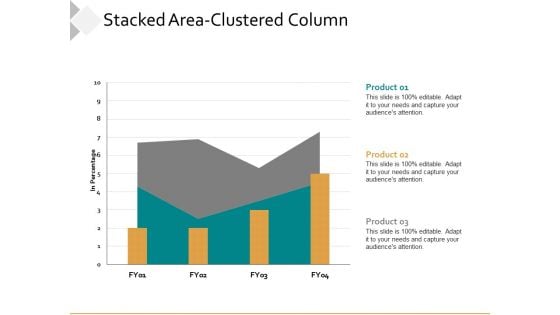
Stacked Area Clustered Column Ppt PowerPoint Presentation Model Slides
This is a stacked area clustered column ppt powerpoint presentation model slides. This is a three stage process. The stages in this process are business, management, percentage, product, marketing.
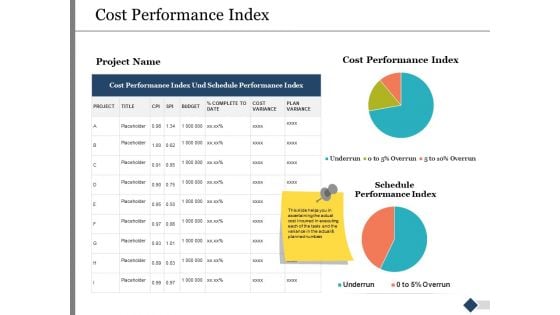
Cost Performance Index Ppt PowerPoint Presentation Infographics Mockup
This is a cost performance index ppt powerpoint presentation infographics mockup. This is a three stage process. The stages in this process are finance, marketing, management, investment, product, percentage.
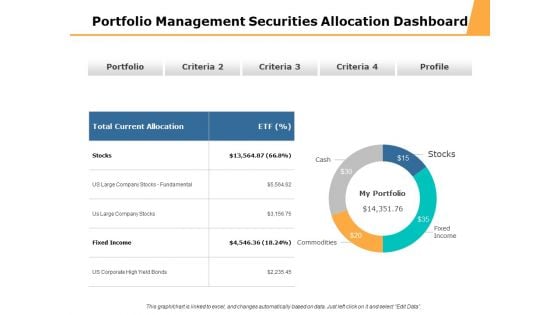
Portfolio Management Securities Allocation Dashboard Ppt PowerPoint Presentation Professional Design Ideas
This is a portfolio management securities allocation dashboard ppt powerpoint presentation professional design ideas. This is a four stage process. The stages in this process are percentage product, business, management, marketing.

Portfolio Summary Management Dashboard Ppt PowerPoint Presentation File Design Templates
This is a portfolio summary management dashboard ppt powerpoint presentation file design templates. This is a five stage process. The stages in this process are percentage product, business, management, marketing.
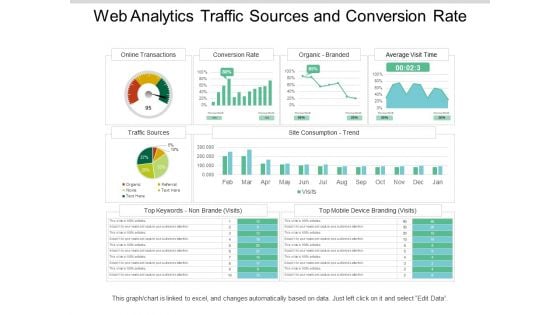
Web Analytics Traffic Sources And Conversion Rate Ppt PowerPoint Presentation Picture
This is a web analytics traffic sources and conversion rate ppt powerpoint presentation picture. This is a four stage process. The stages in this process are digital analytics, digital dashboard, marketing.
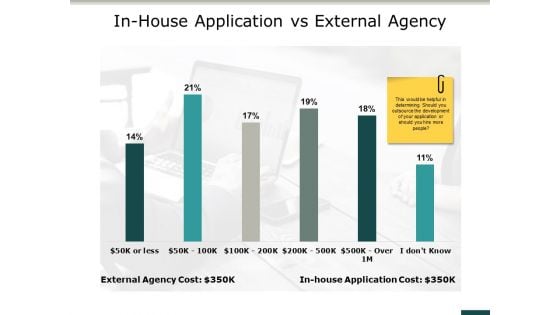
In House Application Vs External Agency Ppt PowerPoint Presentation Portfolio Images
This is a in house application vs external agency ppt powerpoint presentation portfolio images. This is a two stage process. The stages in this process are business, management, marketing, parentage, product.

Quality Control Kpi Dashboard Ppt PowerPoint Presentation Slides Topics
This is a quality control kpi dashboard ppt powerpoint presentation slides topics. This is a four stage process. The stages in this process are finance, marketing, management, investment, analysis.
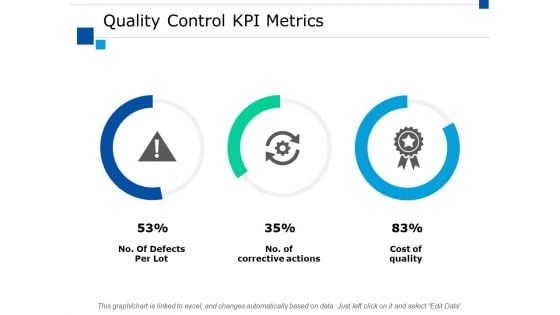
Quality Control Kpi Metrics Ppt PowerPoint Presentation Slides Guidelines
This is a quality control kpi metrics ppt powerpoint presentation slides guidelines. This is a three stage process. The stages in this process are finance, marketing, management, investment, analysis.
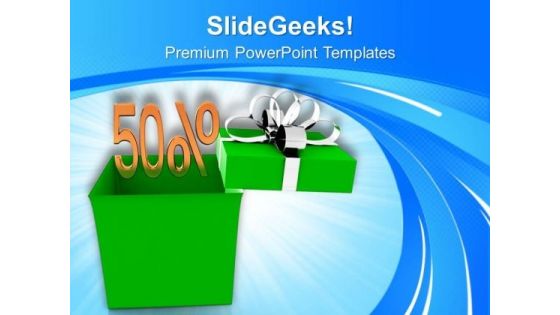
Do The Shopping In Festive Season PowerPoint Templates Ppt Backgrounds For Slides 0513
When in doubt use our Do The Shopping In Festive Season PowerPoint Templates PPT Backgrounds For Slides. The way ahead will become crystal clear. With our marketing powerpoint templates you will be doubly sure. They possess that stamp of authority. Our sales powerpoint templates do it in double quick time. Speed up the process in a tangible way. Settle all feuds with your thoughts. Conflicts die down with our Do The Shopping In Festive Season PowerPoint Templates Ppt Backgrounds For Slides 0513.

3d Man With Career PowerPoint Templates Ppt Backgrounds For Slides 0713
When in doubt use our 3d_Man_With_Career_PowerPoint_Templates_PPT_Backgrounds_For_Slides_0713 The way ahead will become crystal clear. With our marketing PowerPoint Templates you will be doubly sure. They possess that stamp of authority. Our business PowerPoint Templates do it in double quick time. Speed up the process in a tangible way. Do not fall for any popular fallacy. Ascertain the facts with our 3d Man With Career PowerPoint Templates Ppt Backgrounds For Slides 0713.
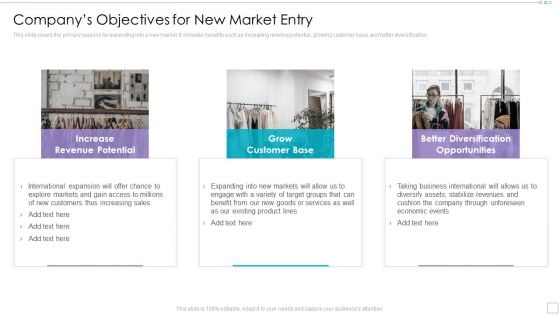
Clothing Business Market Entry Strategy Companys Objectives For New Market Entry Inspiration PDF
This slide covers the primary reasons for expanding into a new market. It includes benefits such as increasing revenue potential, growing customer base, and better diversification. Deliver and pitch your topic in the best possible manner with this Clothing Business Market Entry Strategy Companys Objectives For New Market Entry Inspiration PDF Use them to share invaluable insights on Revenue Potential, Grow Customer, Diversification Opportunities and impress your audience. This template can be altered and modified as per your expectations. So, grab it now.
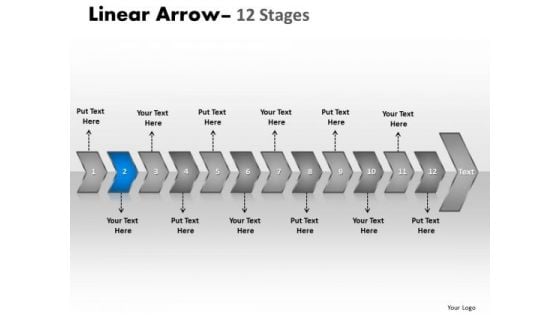
Process Ppt Template Seriate Representation Of 12 Shapes Arrows PowerPoint 3 Design
We present our process PPT template seriate representation of 12 shapes arrows PowerPoint 3 design. Use our Arrows PowerPoint Templates because, Shine the light on these thoughts and motivate your team to improve the quality of celebration for all around you. Use our Symbol PowerPoint Templates because, you have it all down to a T. Use our Business PowerPoint Templates because, Marketing Strategy Business Template: - Maximizing sales of your product is the intended destination. Use our Process and flows PowerPoint Templates because, and keep you group steady in the top bracket. Use our Abstract PowerPoint Templates because; transmit your passion via our creative templates. Use these PowerPoint slides for presentations relating to Arrow, Background, Business, Chart, Diagram, Financial, Flow, Graphic, Gray, Icon, Illustration, Linear, Management, Perspective, Process, Reflection, Spheres, Stage, Text. The prominent colors used in the PowerPoint template are Blue, Gray, and White String your bow with our Process Ppt Template Seriate Representation Of 12 Shapes Arrows PowerPoint 3 Design. Give your thoughts the power to fly.
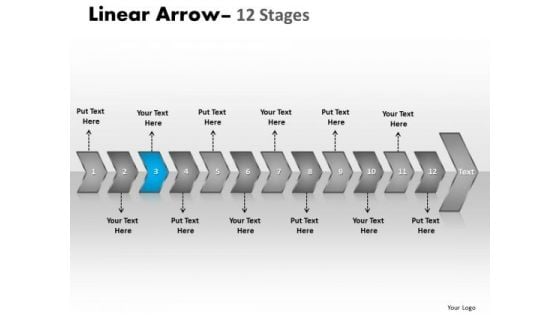
Process Ppt Template Seriate Representation Of 12 Shapes Arrows PowerPoint 4 Design
We present our process PPT template seriate representation of 12 shapes arrows PowerPoint 4 design. Use our Arrows PowerPoint Templates because; transmit this concern to your staff using our helpful slides. Use our Symbol PowerPoint Templates because, Activities which in themselves have many inherent business opportunities. Use our Business PowerPoint Templates because, Marketing Strategy Business Template: - Maximizing sales of your product is the intended destination. Use our Process and flows PowerPoint Templates because, Brainstorming Light Bulbs: - The atmosphere in the workplace is electric. Use our Abstract PowerPoint Templates because, Corporate Ladder: - The graphic is a symbol of growth and sucess.Use these PowerPoint slides for presentations relating to Arrow, Background, Business, Chart, Diagram, Financial, Flow, Graphic, Gray, Icon, Illustration, Linear, Management, Perspective, Process, Reflection, Spheres, Stage, Text. The prominent colors used in the PowerPoint template are Blue, Gray, and White Get it right each and every time. Our Process Ppt Template Seriate Representation Of 12 Shapes Arrows PowerPoint 4 Design have a great record of hits.
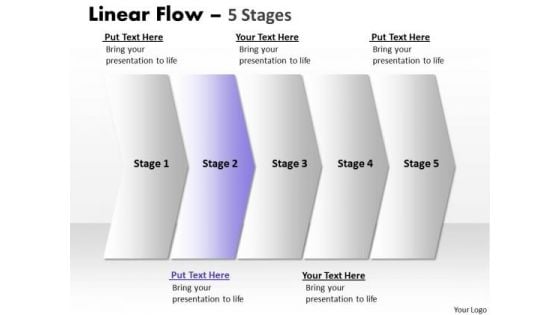
Process Ppt Template Unvarying Description Of 5 Practice The PowerPoint Macro Steps 3 Image
We present our process PPT template unvarying description of 5 practice the PowerPoint macro steps 3 Image. Use our Arrows PowerPoint Templates because, the lessons have been analyzed, studied and conclusions drawn. Use our Symbol PowerPoint Templates because; transmit your passion via our creative templates. Use our Business PowerPoint Templates because, Marketing Strategy Business Template: - Maximizing sales of your product is the intended destination. Use our Process and flows PowerPoint Templates because, are the seeds of many of our successes. Use our Abstract PowerPoint Templates because; Use this template to explain the value of its wellness to human life. Use these PowerPoint slides for presentations relating to Arrow, Background, Business, Chart, Diagram, Financial, Flow, Graphic, Gray, Icon, Illustration, Linear, Management, Orange, Perspective, Process, Reflection, Spheres, Stage, Text. The prominent colors used in the PowerPoint template are Purple, Gray, and White Our Process Ppt Template Unvarying Description Of 5 Practice The PowerPoint Macro Steps 3 Image are exhaustively detailed. They pay close attention to each and every aspect.
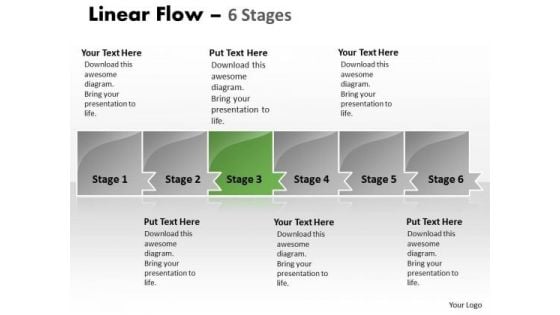
Process PowerPoint Template Steady Demonstration Of 6 Stages 4 Graphic
We present our process PowerPoint template steady demonstration of 6 stages 4 Graphic. Use our Symbol PowerPoint Templates because; educate your team and the attention you have paid. Use our Abstract PowerPoint Templates because; Use them to help you organize the logic of your views. Use our Process and Flows PowerPoint Templates because, Build on your foundation or prepare for change ahead to enhance the future. Use our Business PowerPoint Templates because, Marketing Strategy Business Template:- maximizing sales of your product is the intended destination. Use our Arrows PowerPoint Templates because, Targets: - You have a handle on all the targets, a master of the game, the experienced and consummate juggler. Use these PowerPoint slides for presentations relating to Arrow, Background, Business, Chart, Diagram, Financial, Flow, Graphic, Gray, Icon, Illustration, Linear, Management, Orange, Perspective, Process, Reflection, Spheres, Stage, Text. The prominent colors used in the PowerPoint template are Green, Gray, and Black Identify and solve problems with our Process PowerPoint Template Steady Demonstration Of 6 Stages 4 Graphic. Make sure your presentation gets the attention it deserves.
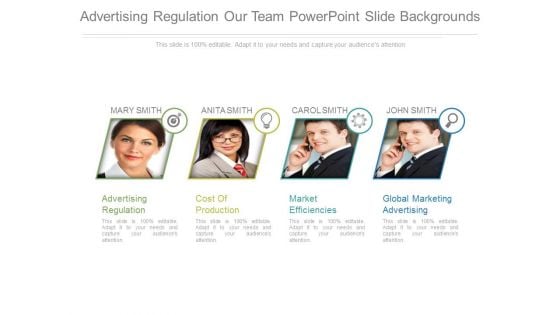
Advertising Regulation Our Team Powerpoint Slide Backgrounds
This is a advertising regulation our team powerpoint slide backgrounds. This is a four stage process. The stages in this process are advertising regulation, cost of production, market efficiencies, global marketing advertising.
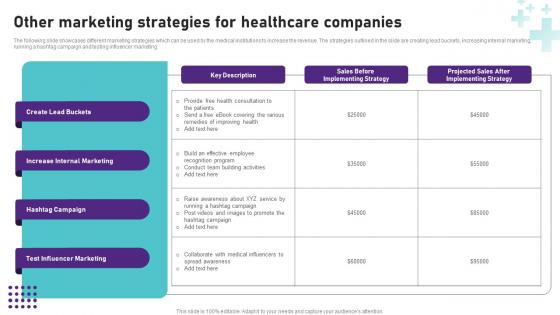
Other Marketing Strategies For Healthcare Companies Operational Areas Healthcare Graphics PDF
Take your projects to the next level with our ultimate collection of Other Marketing Strategies For Healthcare Companies Operational Areas Healthcare Graphics PDF. Slidegeeks has designed a range of layouts that are perfect for representing task or activity duration, keeping track of all your deadlines at a glance. Tailor these designs to your exact needs and give them a truly corporate look with your own brand colors they will make your projects stand out from the rest The following slide showcases different marketing strategies which can be used by the medical institutions to increase the revenue. The strategies outlined in the slide are creating lead buckets, increasing internal marketing, running a hashtag campaign and testing influencer marketing.

Ineffective Product Marketing Impact On Customer Retention Rate Ppt PowerPoint Presentation Diagram Lists PDF
This slide shows graphical presentation of impact of ineffective marketing on customer retention rate. Additionally, it provides the impact and reason behind the decline in retention rate Get a simple yet stunning designed Ineffective Product Marketing Impact On Customer Retention Rate Ppt PowerPoint Presentation Diagram Lists PDF. It is the best one to establish the tone in your meetings. It is an excellent way to make your presentations highly effective. So, download this PPT today from Slidegeeks and see the positive impacts. Our easy to edit Ineffective Product Marketing Impact On Customer Retention Rate Ppt PowerPoint Presentation Diagram Lists PDF can be your go to option for all upcoming conferences and meetings. So, what are you waiting for Grab this template today.
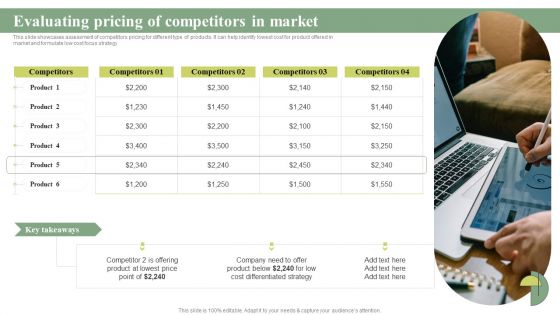
Evaluating Pricing Of Competitors In Market Cost Leadership Differentiation Strategy Diagrams PDF
This slide showcases assessment of competitors pricing for different type of products. It can help identify lowest cost for product offered in market and formulate low cost focus strategy. Do you have to make sure that everyone on your team knows about any specific topic I yes, then you should give Evaluating Pricing Of Competitors In Market Cost Leadership Differentiation Strategy Diagrams PDF a try. Our experts have put a lot of knowledge and effort into creating this impeccable Evaluating Pricing Of Competitors In Market Cost Leadership Differentiation Strategy Diagrams PDF. You can use this template for your upcoming presentations, as the slides are perfect to represent even the tiniest detail. You can download these templates from the Slidegeeks website and these are easy to edit. So grab these today
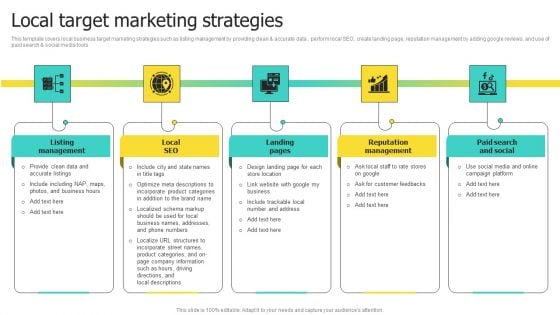
Choosing Target Audience And Target Audience Tactics Local Target Marketing Strategies Diagrams PDF
This template covers local business target marketing strategies such as listing management by providing clean and accurate data , perform local SEO, create landing page, reputation management by adding google reviews, and use of paid search and social media tools. Do you have to make sure that everyone on your team knows about any specific topic I yes, then you should give Choosing Target Audience And Target Audience Tactics Local Target Marketing Strategies Diagrams PDF a try. Our experts have put a lot of knowledge and effort into creating this impeccable Choosing Target Audience And Target Audience Tactics Local Target Marketing Strategies Diagrams PDF. You can use this template for your upcoming presentations, as the slides are perfect to represent even the tiniest detail. You can download these templates from the Slidegeeks website and these are easy to edit. So grab these today.
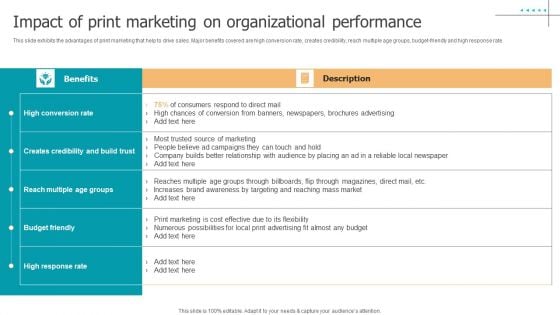
Techniques To Implement Impact Of Print Marketing On Organizational Performance Diagrams PDF
This slide exhibits the advantages of print marketing that help to drive sales. Major benefits covered are high conversion rate, creates credibility, reach multiple age groups, budget-friendly and high response rate. Do you have to make sure that everyone on your team knows about any specific topic I yes, then you should give Techniques To Implement Impact Of Print Marketing On Organizational Performance Diagrams PDF a try. Our experts have put a lot of knowledge and effort into creating this impeccable Techniques To Implement Impact Of Print Marketing On Organizational Performance Diagrams PDF. You can use this template for your upcoming presentations, as the slides are perfect to represent even the tiniest detail. You can download these templates from the Slidegeeks website and these are easy to edit. So grab these today.
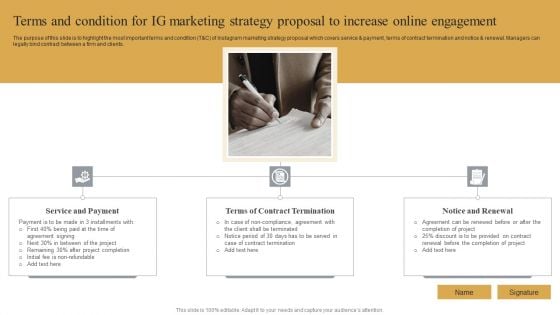
Terms And Condition For IG Marketing Strategy Proposal To Increase Online Engagement Diagrams PDF
The purpose of this slide is to highlight the most important terms and condition T and C of Instagram marketing strategy proposal which covers service and payment, terms of contract termination and notice and renewal. Managers can legally bind contract between a firm and clients. Do you have an important presentation coming up Are you looking for something that will make your presentation stand out from the rest Look no further than Terms And Condition For IG Marketing Strategy Proposal To Increase Online Engagement Diagrams PDF. With our professional designs, you can trust that your presentation will pop and make delivering it a smooth process. And with Slidegeeks, you can trust that your presentation will be unique and memorable. So why wait Grab Terms And Condition For IG Marketing Strategy Proposal To Increase Online Engagement Diagrams PDF today and make your presentation stand out from the rest.


 Continue with Email

 Home
Home


