Promote Icon
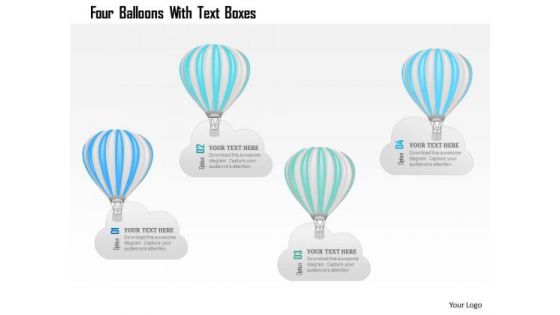
Business Diagram Four Balloons With Text Boxes PowerPoint Template
Graphic of four balloons style text box diagram has been used to design this power point template slide. This PPT slide contains the concept of business data flow. Use this PPT for your business and marketing related presentations.
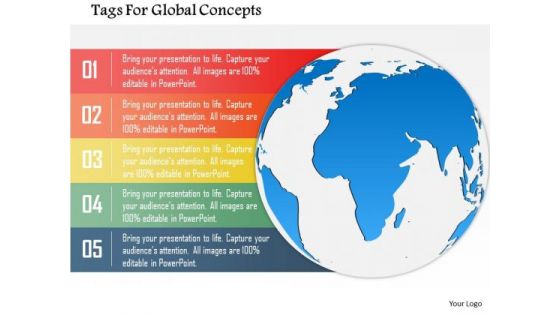
Business Diagram Tags For Global Concepts Presentation Template
Graphic of globe and five text boxes has been used to design this power point template. This diagram contains the concept of global marketing strategy. Amplify your thoughts via this appropriate business template.
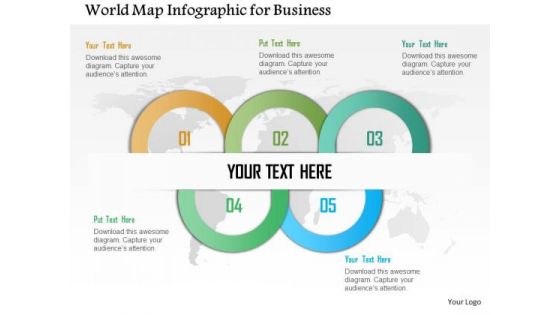
Business Diagram World Map Infographic For Business Presentation Template
World map infographic has been used to design this power point template. This diagram contains the concept of global marketing strategy. Amplify your thoughts via this appropriate business template.
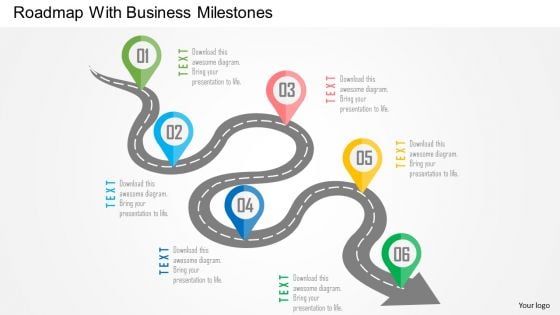
Business Diagram Roadmap With Business Milestones Presentation Template
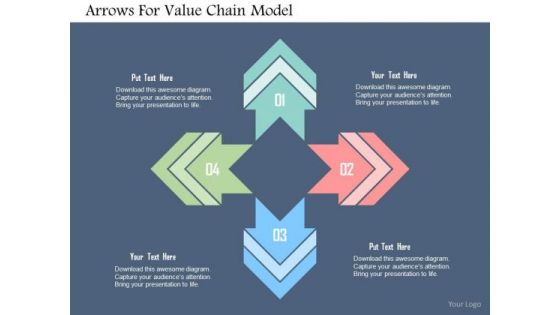
Business Diagram Arrows For Value Chain Model PowerPoint Templates
Four multicolored arrows have been used to design this business diagram slide. You may download this slide to depict value chain model. Develop your marketing strategy and communicate to your viewers.
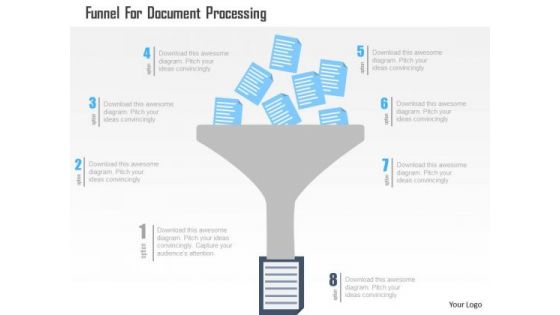
Business Diagram Funnel For Document Processing Presentation Template
This slide has been designed with graphics of funnel for document processing. This diagram is suitable for sales and marketing presentations. This professional slide helps in making an instant impact on viewers.
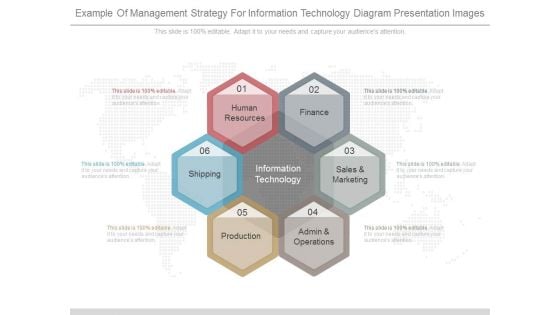
Example Of Management Strategy For Information Technology Diagram Presentation Images
This is a example of management strategy for information technology diagram presentation images. This is a six stage process. The stages in this process are human resources, finance, sales and marketing, admin and operations, production, shipping, information technology.
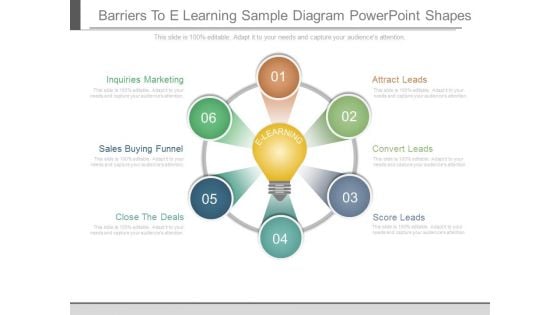
Barriers To E Learning Sample Diagram Powerpoint Shapes
This is a barriers to e learning sample diagram powerpoint shapes. This is a six stage process. The stages in this process are attract leads, convert leads, score leads, close the deals, sales buying funnel, inquiries marketing, e learning.
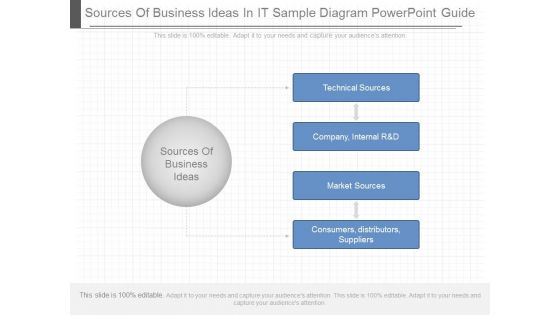
Sources Of Business Ideas In It Sample Diagram Powerpoint Guide
This is a sources of business ideas in it sample diagram powerpoint guide. This is a four stage process. The stages in this process are sources of business ideas, technical sources, company, internal, market sources, consumers distributors suppliers.
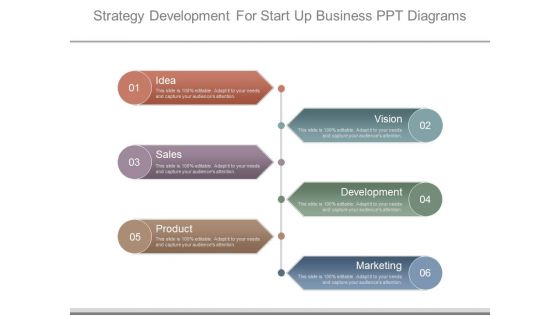
Strategy Development For Start Up Business Ppt Diagrams
This is a strategy development for start up business ppt diagrams. This is a six stage process. The stages in this process are idea, sales, product, vision, development, marketing.
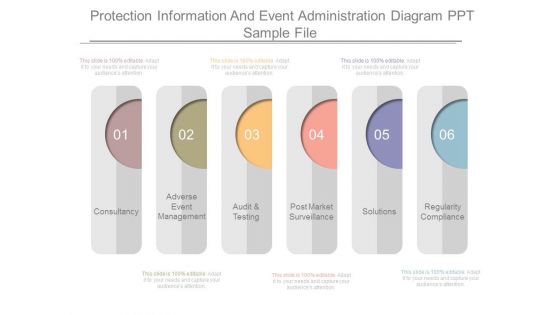
Protection Information And Event Administration Diagram Ppt Sample File
This is a protection information and event administration diagram ppt sample file. This is a six stage process. The stages in this process are consultancy, adverse event management, audit and testing, post market surveillance, solutions, regularity compliance.
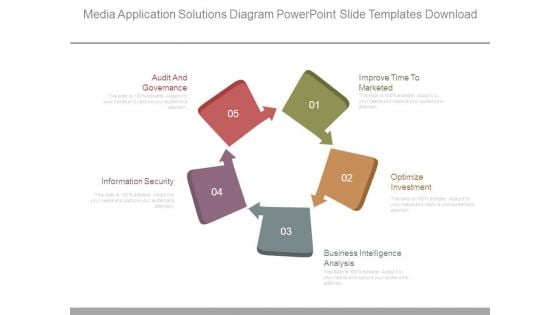
Media Application Solutions Diagram Powerpoint Slide Templates Download
This is a media application solutions diagram powerpoint slide templates download. This is a five stage process. The stages in this process are audit and governance, information security, improve time to marketed, optimize investment, business intelligence analysis.
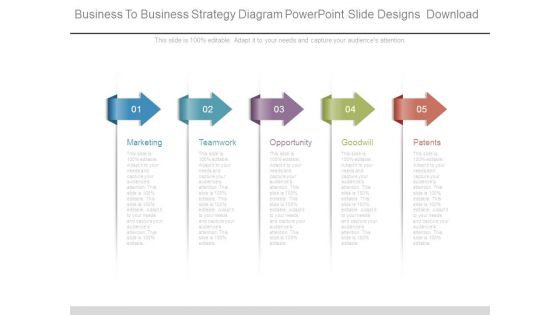
Business To Business Strategy Diagram Powerpoint Slide Designs Download
This is a Business To Business Strategy Diagram Powerpoint Slide Designs Download. This is a five stage process. The stages in this process are marketing, teamwork, opportunity, goodwill, patents.
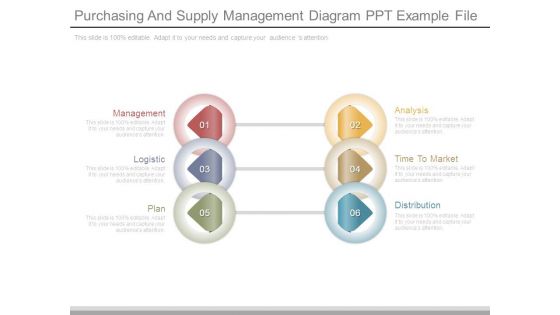
Purchasing And Supply Management Diagram Ppt Example File
This is a purchasing and supply management diagram ppt example file. This is a six stage process. The stages in this process are management, logistic, plan, analysis, time to market, distribution.
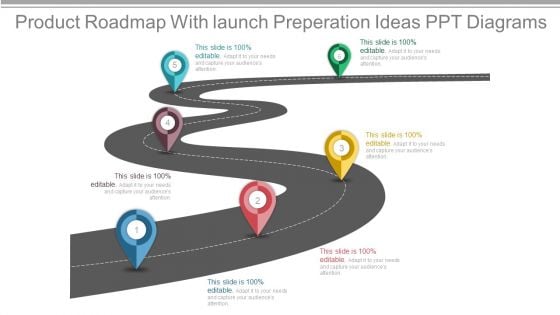
Product Roadmap With launch Preperation Ideas Ppt Diagrams
This is a product roadmap with launch preperation ideas ppt diagrams. This is a six stage process. The stages in this process are business, strategy, management, process, marketing, time planning, roadmap.
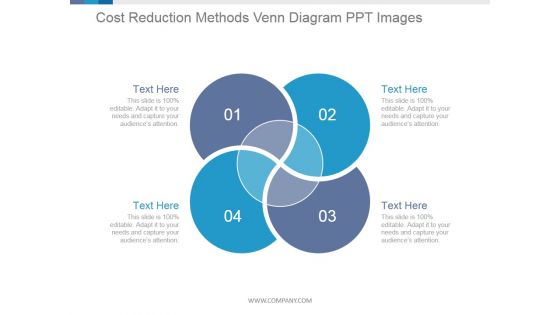
Cost Reduction Methods Venn Diagram Ppt PowerPoint Presentation Deck
This is a cost reduction methods venn diagram ppt powerpoint presentation deck. This is a four stage process. The stages in this process are circle, business, management, marketing, success.

Data Processing Facts Management Arrows Diagram Ppt PowerPoint Presentation Templates
This is a data processing facts management arrows diagram ppt powerpoint presentation templates. This is a eight stage process. The stages in this process are marketing, arrows, management, facts, data processing.

5 Steps Procedure Magnifying Glass Ppt PowerPoint Presentation Diagrams
This is a 5 steps procedure magnifying glass ppt powerpoint presentation diagrams. This is a five stage process. The stages in this process are technology, business, marketing, communication, success.
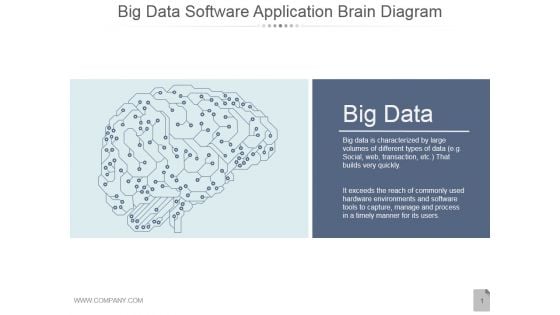
Big Data Software Application Brain Diagram Ppt PowerPoint Presentation Slides
This is a big data software application brain diagram ppt powerpoint presentation slides. This is a one stage process. The stages in this process are big data, communication, business, marketing, idea.
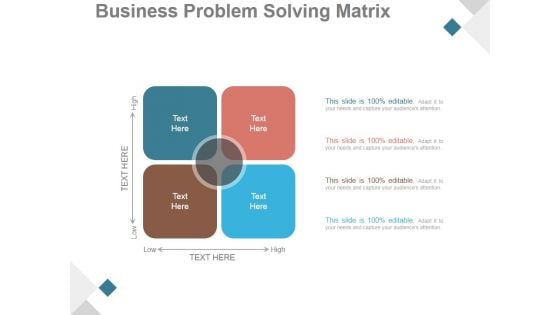
Business Problem Solving Matrix Ppt PowerPoint Presentation Diagrams
This is a business problem solving matrix ppt powerpoint presentation diagrams. This is a four stage process. The stages in this process are business, strategy, marketing, success, management, matrix.

Newspaper Diagram For Major Business Announcement Ppt PowerPoint Presentation Styles
This is a newspaper diagram for major business announcement ppt powerpoint presentation styles. This is a one stage process. The stages in this process are newspaper, ideas, marketing, presentation, business.
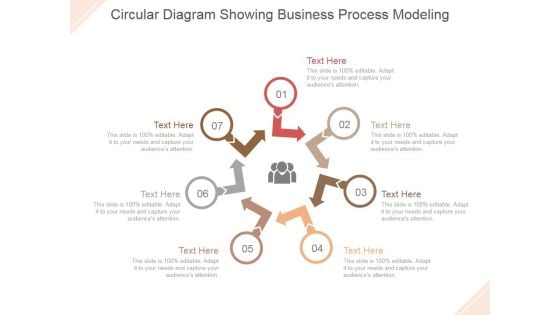
Circular Diagram Showing Business Process Modeling Ppt PowerPoint Presentation Templates
This is a circular diagram showing business process modeling ppt powerpoint presentation templates. This is a seven stage process. The stages in this process are arrows, business, marketing, management, process.
Our Mission Vision And Values Ppt PowerPoint Presentation Diagrams
This is a our mission vision and values ppt powerpoint presentation diagrams. This is a one stage process. The stages in this process are business, marketing, design, vision, management.
Elevator Pitch Template 3 Ppt PowerPoint Presentation Diagrams
This is a elevator pitch template 3 ppt powerpoint presentation diagrams. This is a one stage process. The stages in this process are business, marketing, management, elevator pitch, information.
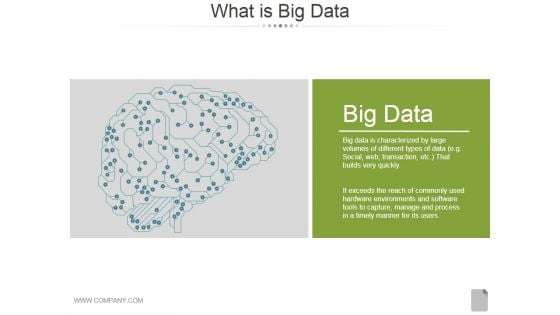
What Is Big Data Ppt PowerPoint Presentation Diagrams
This is a what is big data ppt powerpoint presentation diagrams. This is a one stage process. The stages in this process are big data, business, analysis, management, marketing.
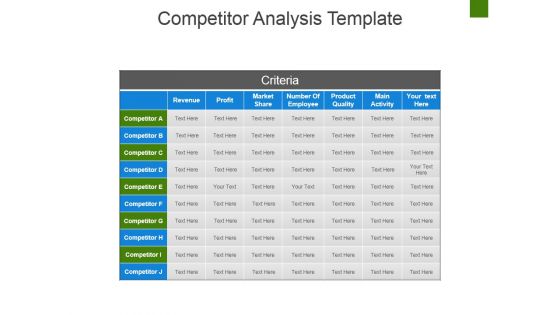
Competitor Analysis Template Ppt PowerPoint Presentation Pictures Diagrams
This is a competitor analysis template ppt powerpoint presentation pictures diagrams. This is a seven stage process. The stages in this process are revenue, profit, market share, number of employee, product quality, main activity.
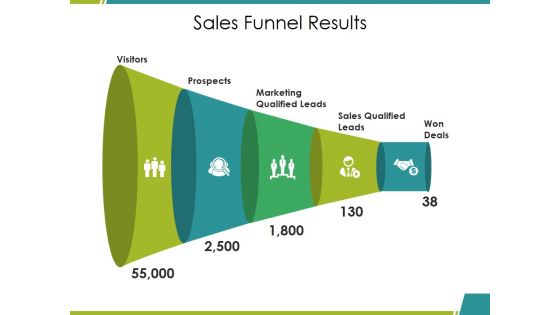
Sales Funnel Results Ppt PowerPoint Presentation Gallery Diagrams
This is a sales funnel results ppt powerpoint presentation gallery diagrams. This is a five stage process. The stages in this process are visitors, prospects, sales qualified leads, won, deals, marketing qualified leads.
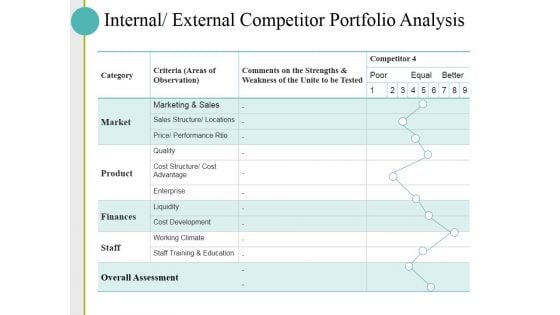
Internal External Competitor Portfolio Analysis Ppt PowerPoint Presentation Pictures Diagrams
This is a internal external competitor portfolio analysis ppt powerpoint presentation pictures diagrams. This is a five stage process. The stages in this process are market, product, finances, staff, overall assessment.
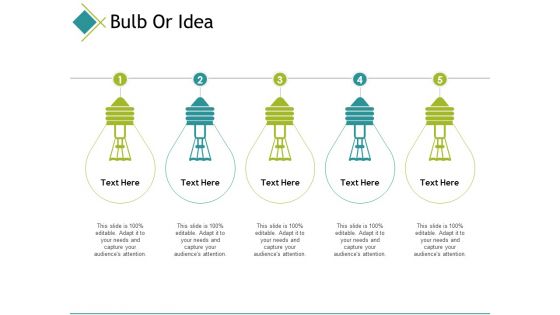
Bulb Or Idea Ppt PowerPoint Presentation Diagram Ppt
This is a bulb or idea ppt powerpoint presentation diagram ppt. This is a five stage process. The stages in this process are light bulbs, marketing, analysis, management, technology.
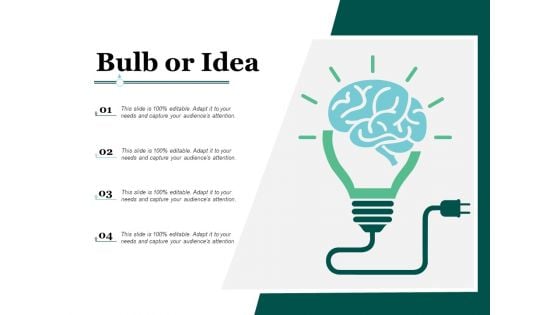
Bulb Or Idea Technology Ppt PowerPoint Presentation Summary Diagrams
This is a bulb or idea technology ppt powerpoint presentation summary diagrams. This is a four stage process. The stages in this process are technology, business, planning, marketing, management.
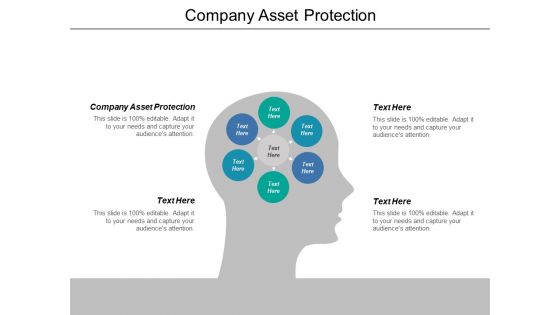
Company Asset Protection Ppt PowerPoint Presentation Inspiration Diagrams Cpb
This is a company asset protection ppt powerpoint presentation inspiration diagrams cpb. This is a six stage process. The stages in this process are company asset protection, business, management, marketing.

Our Target Arrow Planning Ppt PowerPoint Presentation Pictures Diagrams
This is a our target arrow planning ppt powerpoint presentation pictures diagrams. This is a one stage process. The stages in this process are arrow, marketing, strategy, competition, success.
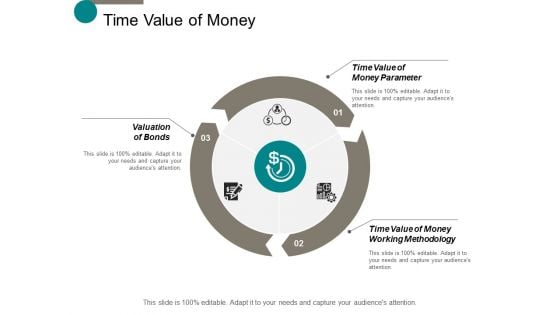
Time Value Of Money Ppt Powerpoint Presentation Show Diagrams
This is a time value of money ppt powerpoint presentation show diagrams. This is a three stage process. The stages in this process are business, management, planning, strategy, marketing.
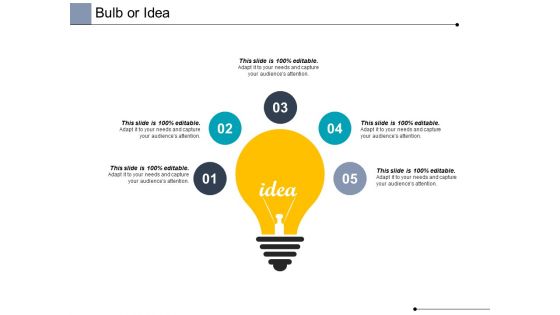
Bulb Or Idea Technology Ppt PowerPoint Presentation Diagram Lists
This is a bulb or idea technology ppt powerpoint presentation diagram lists. This is a five stage process. The stages in this process are technology, business, planning, marketing, knowledge.
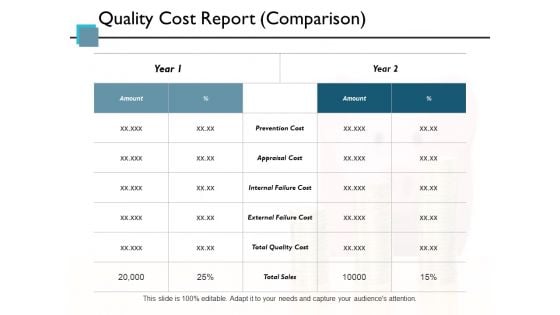
Quality Cost Report Comparison Ppt PowerPoint Presentation Diagram Lists
This is a quality cost report comparison ppt powerpoint presentation diagram lists. This is a two stage process. The stages in this process are business, management, analysis, strategy, marketing.
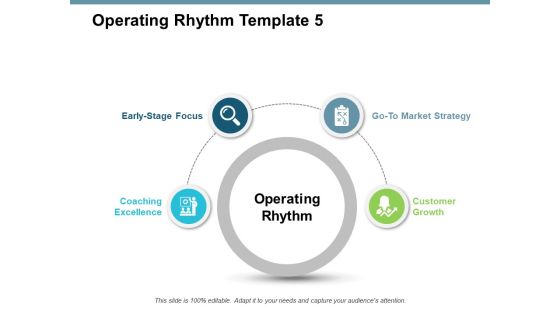
Operating Rhythm Template Business Ppt PowerPoint Presentation Infographic Template Diagrams
This is a operating rhythm template business ppt powerpoint presentation infographic template diagrams. This is a four stage process. The stages in this process are marketing, business, management, planning, strategy.
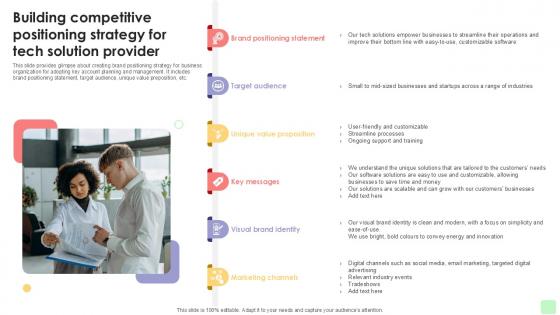
Building Competitive Positioning Detailed Business Account PPT Template Strategy SS V
This slide provides glimpse about creating brand positioning strategy for business organization for adopting key account planning and management. It includes brand positioning statement, target audience, unique value preposition, etc. While your presentation may contain top-notch content, if it lacks visual appeal, youre not fully engaging your audience. Introducing our Building Competitive Positioning Detailed Business Account PPT Template Strategy SS V deck, designed to engage your audience. Our complete deck boasts a seamless blend of Creativity and versatility. You can effortlessly customize elements and color schemes to align with your brand identity. Save precious time with our pre-designed template, compatible with Microsoft versions and Google Slides. Plus, its downloadable in multiple formats like JPG, JPEG, and PNG. Elevate your presentations and outshine your competitors effortlessly with our visually stunning 100 percent editable deck. This slide provides glimpse about creating brand positioning strategy for business organization for adopting key account planning and management. It includes brand positioning statement, target audience, unique value preposition, etc.
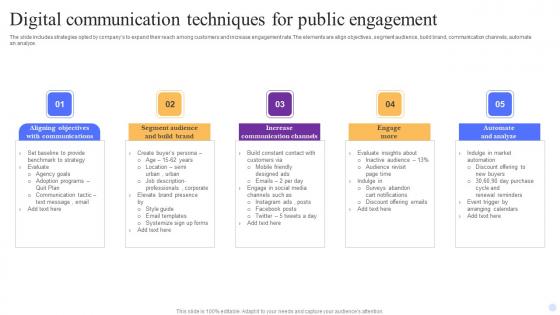
Digital Communication Techniques For Public Engagement Summary Pdf
The slide includes strategies opted by companys to expand their reach among customers and increase engagement rate.The elements are align objectives, segment audience, build brand, communication channels, automate an analyze. Showcasing this set of slides titled Digital Communication Techniques For Public Engagement Summary Pdf. The topics addressed in these templates are Aligning Objectives, Communications, Segment Audience, Build Brand. All the content presented in this PPT design is completely editable. Download it and make adjustments in color, background, font etc. as per your unique business setting. The slide includes strategies opted by companys to expand their reach among customers and increase engagement rate. The elements are align objectives, segment audience, build brand, communication channels, automate an analyze.
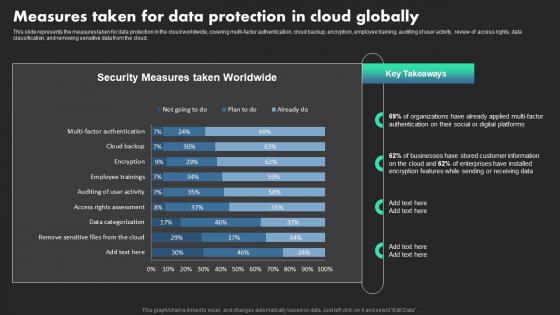
Measures Taken For Data Protection In Cloud Globally Ethical Dimensions Of Datafication Clipart Pdf
This slide represents the measures taken for data protection in the cloud worldwide, covering multi-factor authentication, cloud backup, encryption, employee training, auditing of user activity, review of access rights, data classification, and removing sensitive data from the cloud. Take your projects to the next level with our ultimate collection of Measures Taken For Data Protection In Cloud Globally Ethical Dimensions Of Datafication Clipart Pdf Slidegeeks has designed a range of layouts that are perfect for representing task or activity duration, keeping track of all your deadlines at a glance. Tailor these designs to your exact needs and give them a truly corporate look with your own brand colors they well make your projects stand out from the rest. This slide represents the measures taken for data protection in the cloud worldwide, covering multi-factor authentication, cloud backup, encryption, employee training, auditing of user activity, review of access rights, data classification, and removing sensitive data from the cloud.
KPI Dashboard For Tracking Monthly Personal Comprehensive Smartphone Banking Introduction Pdf
This slide shows dashboard which can be used by individuals to track monthly expenses in order to get better understanding of hisorher finances. It includes metrics such as users spending, savings, debt, etc.Take your projects to the next level with our ultimate collection of KPI Dashboard For Tracking Monthly Personal Comprehensive Smartphone Banking Introduction Pdf. Slidegeeks has designed a range of layouts that are perfect for representing task or activity duration, keeping track of all your deadlines at a glance. Tailor these designs to your exact needs and give them a truly corporate look with your own brand colors they all make your projects stand out from the rest. This slide shows dashboard which can be used by individuals to track monthly expenses in order to get better understanding of hisorher finances. It includes metrics such as users spending, savings, debt, etc.
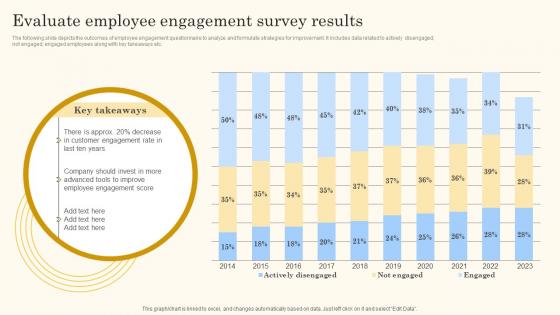
Evaluate Employee Engagement Action Steps For Employee Engagement Background Pdf
The following slide depicts the outcomes of employee engagement questionnaire to analyze and formulate strategies for improvement. It includes data related to actively disengaged,not engaged, engaged employees along with key takeaways etc.Take your projects to the next level with our ultimate collection of Evaluate Employee Engagement Action Steps For Employee Engagement Background Pdf. Slidegeeks has designed a range of layouts that are perfect for representing task or activity duration, keeping track of all your deadlines at a glance. Tailor these designs to your exact needs and give them a truly corporate look with your own brand colors they all make your projects stand out from the rest. The following slide depicts the outcomes of employee engagement questionnaire to analyze and formulate strategies for improvement. It includes data related to actively disengaged,not engaged, engaged employees along with key takeaways etc.
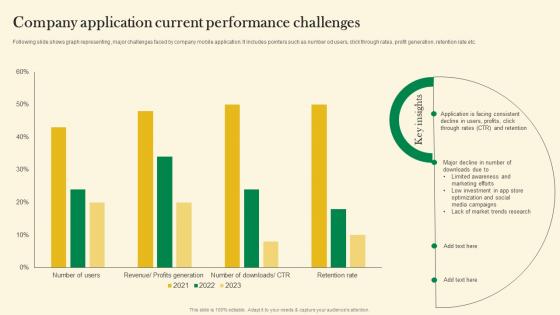
Company Application Current Performance Challenges Online Customer Acquisition Rules Pdf
Following slide shows graph representing ,major challenges faced by company mobile application. It includes pointers such as number od users, click through rates, profit generation, retention rate etc. Take your projects to the next level with our ultimate collection of Company Application Current Performance Challenges Online Customer Acquisition Rules Pdf Slidegeeks has designed a range of layouts that are perfect for representing task or activity duration, keeping track of all your deadlines at a glance. Tailor these designs to your exact needs and give them a truly corporate look with your own brand colors they well make your projects stand out from the rest. Following slide shows graph representing ,major challenges faced by company mobile application. It includes pointers such as number od users, click through rates, profit generation, retention rate etc.
Enhance Customer Retention Tracking The Actual Sales Figures After Deal Finalizing Graphics Pdf
This slide provides glimpse about dashboard analysis that can help the business to track the performance of the sales team. It includes KPIs such as revenues, profit, orders placed, conversion placed, conversion rate, customers, etc. Take your projects to the next level with our ultimate collection of Enhance Customer Retention Tracking The Actual Sales Figures After Deal Finalizing Graphics Pdf. Slidegeeks has designed a range of layouts that are perfect for representing task or activity duration, keeping track of all your deadlines at a glance. Tailor these designs to your exact needs and give them a truly corporate look with your own brand colors they well make your projects stand out from the rest. This slide provides glimpse about dashboard analysis that can help the business to track the performance of the sales team. It includes KPIs such as revenues, profit, orders placed, conversion placed, conversion rate, customers, etc.
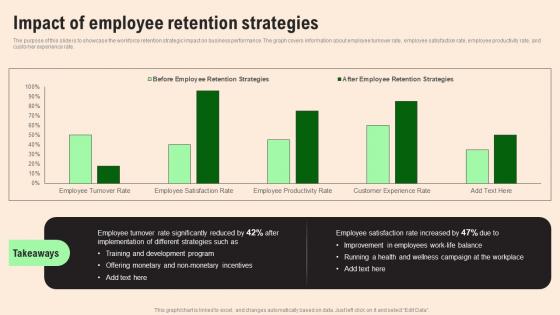
Impact Of Employee Retention HR Retention Techniques For Business Owners Structure Pdf
The purpose of this slide is to showcase the workforce retention strategic impact on business performance. The graph covers information about employee turnover rate, employee satisfaction rate, employee productivity rate, and customer experience rate. Take your projects to the next level with our ultimate collection of Impact Of Employee Retention HR Retention Techniques For Business Owners Structure Pdf. Slidegeeks has designed a range of layouts that are perfect for representing task or activity duration, keeping track of all your deadlines at a glance. Tailor these designs to your exact needs and give them a truly corporate look with your own brand colors they will make your projects stand out from the rest The purpose of this slide is to showcase the workforce retention strategic impact on business performance. The graph covers information about employee turnover rate, employee satisfaction rate, employee productivity rate, and customer experience rate.
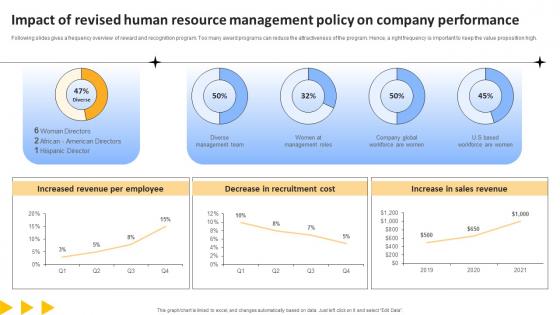
Workforce Productivity Improvement Impact Of Revised Human Resource Management Formats Pdf
Following slides gives a frequency overview of reward and recognition program. Too many award programs can reduce the attractiveness of the program. Hence, a right frequency is important to keep the value proposition high. Take your projects to the next level with our ultimate collection of Workforce Productivity Improvement Impact Of Revised Human Resource Management Formats Pdf. Slidegeeks has designed a range of layouts that are perfect for representing task or activity duration, keeping track of all your deadlines at a glance. Tailor these designs to your exact needs and give them a truly corporate look with your own brand colors they will make your projects stand out from the rest Following slides gives a frequency overview of reward and recognition program. Too many award programs can reduce the attractiveness of the program. Hence, a right frequency is important to keep the value proposition high.

Survey Results Depicting Enhancing Customer Service Operations Using CRM Technology Download Pdf
Following slide shows survey results to understand challenges in company billing system. It include pointers such as management issue, data manipulation, complexity, reporting concern etc. Take your projects to the next level with our ultimate collection of Survey Results Depicting Enhancing Customer Service Operations Using CRM Technology Download Pdf. Slidegeeks has designed a range of layouts that are perfect for representing task or activity duration, keeping track of all your deadlines at a glance. Tailor these designs to your exact needs and give them a truly corporate look with your own brand colors they will make your projects stand out from the rest Following slide shows survey results to understand challenges in company billing system. It include pointers such as management issue, data manipulation, complexity, reporting concern etc.
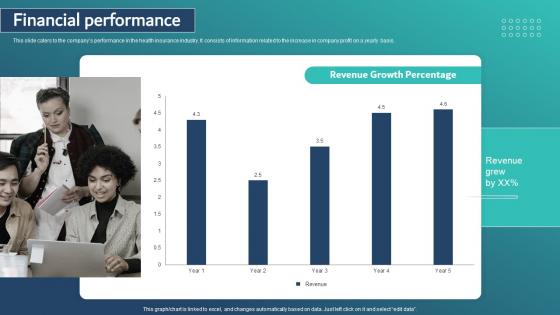
Financial Performance Healthcare Insurance App Capital Raising Pitch Deck Portrait Pdf
This slide caters to the companys performance in the health insurance industry. It consists of information related to the increase in company profit on a yearly basis. Take your projects to the next level with our ultimate collection of Financial Performance Healthcare Insurance App Capital Raising Pitch Deck Portrait Pdf. Slidegeeks has designed a range of layouts that are perfect for representing task or activity duration, keeping track of all your deadlines at a glance. Tailor these designs to your exact needs and give them a truly corporate look with your own brand colors they will make your projects stand out from the rest This slide caters to the companys performance in the health insurance industry. It consists of information related to the increase in company profit on a yearly basis.
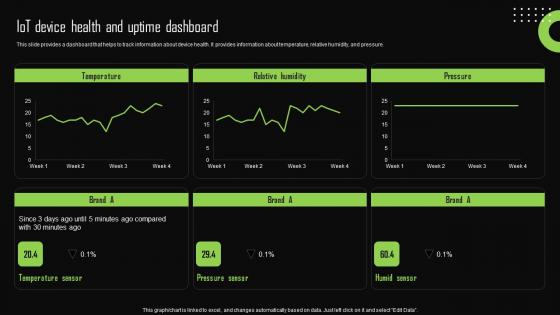
Iot Device Health And Uptime Dashboard Iot Device Management Graphics Pdf
This slide provides a dashboard that helps to track information about device health. It provides information about temperature, relative humidity, and pressure. Take your projects to the next level with our ultimate collection of Iot Device Health And Uptime Dashboard Iot Device Management Graphics Pdf. Slidegeeks has designed a range of layouts that are perfect for representing task or activity duration, keeping track of all your deadlines at a glance. Tailor these designs to your exact needs and give them a truly corporate look with your own brand colors they will make your projects stand out from the rest This slide provides a dashboard that helps to track information about device health. It provides information about temperature, relative humidity, and pressure.
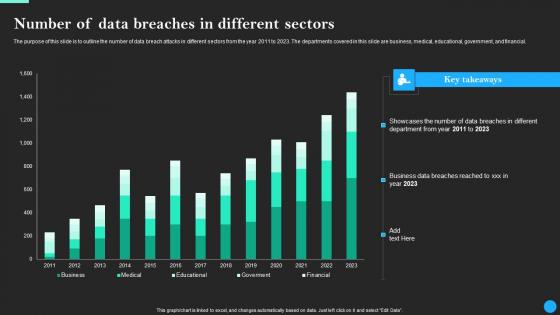
Number Of Data Breaches In Different Sectors Data Breach Prevention Microsoft Pdf
The purpose of this slide is to outline the number of data breach attacks in different sectors from the year 2011 to 2023. The departments covered in this slide are business, medical, educational, government, and financial. Take your projects to the next level with our ultimate collection of Number Of Data Breaches In Different Sectors Data Breach Prevention Microsoft Pdf. Slidegeeks has designed a range of layouts that are perfect for representing task or activity duration, keeping track of all your deadlines at a glance. Tailor these designs to your exact needs and give them a truly corporate look with your own brand colors they will make your projects stand out from the rest The purpose of this slide is to outline the number of data breach attacks in different sectors from the year 2011 to 2023. The departments covered in this slide are business, medical, educational, government, and financial.
Ultimate Guide To Cold Sales Agents Call Performance Tracking Dashboard SA SS V
This slide showcases company monthly call activity that helps to track agents performance including total answered calls, total agents, CSAT, etc. Take your projects to the next level with our ultimate collection of Ultimate Guide To Cold Sales Agents Call Performance Tracking Dashboard SA SS V. Slidegeeks has designed a range of layouts that are perfect for representing task or activity duration, keeping track of all your deadlines at a glance. Tailor these designs to your exact needs and give them a truly corporate look with your own brand colors they will make your projects stand out from the rest This slide showcases company monthly call activity that helps to track agents performance including total answered calls, total agents, CSAT, etc.
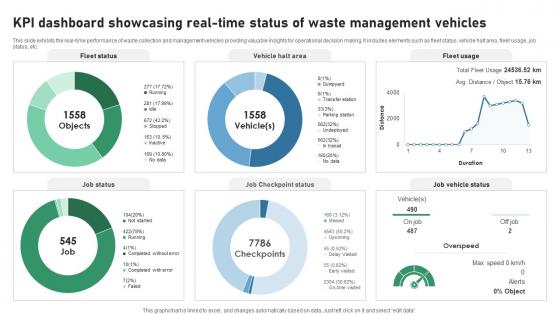
KPI Dashboard Showcasing Real Time Status Of Waste IOT Applications In Smart Waste IoT SS V
This slide exhibits the real-time performance of waste collection and management vehicles providing valuable insights for operational decision making. It includes elements such as fleet status, vehicle halt area, fleet usage, job status, etc. Take your projects to the next level with our ultimate collection of KPI Dashboard Showcasing Real Time Status Of Waste IOT Applications In Smart Waste IoT SS V. Slidegeeks has designed a range of layouts that are perfect for representing task or activity duration, keeping track of all your deadlines at a glance. Tailor these designs to your exact needs and give them a truly corporate look with your own brand colors they will make your projects stand out from the rest This slide exhibits the real-time performance of waste collection and management vehicles providing valuable insights for operational decision making. It includes elements such as fleet status, vehicle halt area, fleet usage, job status, etc.
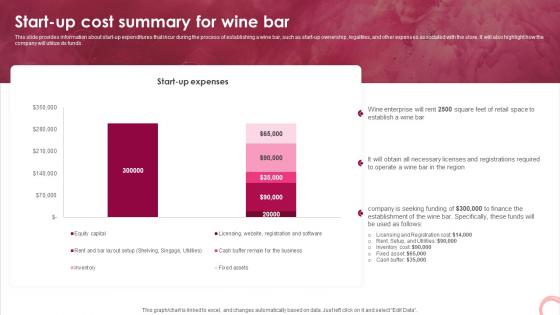
Wine Lounge Business Plan Start Up Cost Summary For Wine Bar BP SS V
This slide provides information about start-up expenditures that incur during the process of establishing a wine bar, such as start-up ownership, legalities, and other expenses associated with the store. It will also highlight how the company will utilize its funds. Take your projects to the next level with our ultimate collection of Wine Lounge Business Plan Start Up Cost Summary For Wine Bar BP SS V. Slidegeeks has designed a range of layouts that are perfect for representing task or activity duration, keeping track of all your deadlines at a glance. Tailor these designs to your exact needs and give them a truly corporate look with your own brand colors they will make your projects stand out from the rest This slide provides information about start-up expenditures that incur during the process of establishing a wine bar, such as start-up ownership, legalities, and other expenses associated with the store. It will also highlight how the company will utilize its funds.
Unlocking Potential Enhancing Team Members Performance Tracking Dashboards
This slide depicts performance tracking dashboard for project manager to analyze work being done by the team. It includes average rating for the week, total work done and weekly change, employee rating and work done. Take your projects to the next level with our ultimate collection of Unlocking Potential Enhancing Team Members Performance Tracking Dashboards. Slidegeeks has designed a range of layouts that are perfect for representing task or activity duration, keeping track of all your deadlines at a glance. Tailor these designs to your exact needs and give them a truly corporate look with your own brand colors they will make your projects stand out from the rest This slide depicts performance tracking dashboard for project manager to analyze work being done by the team. It includes average rating for the week, total work done and weekly change, employee rating and work done.
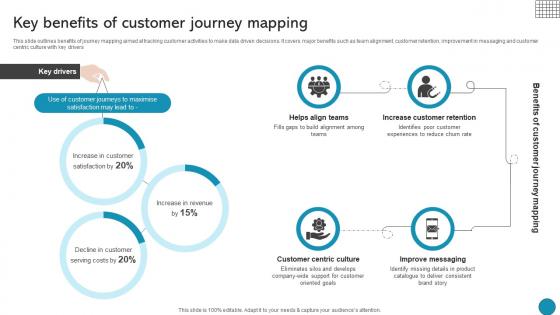
Key Benefits Of Customer Journey Mapping Driving Business Success Integrating Product
This slide outlines benefits of journey mapping aimed at tracking customer activities to make data driven decisions. It covers major benefits such as team alignment, customer retention, improvement in messaging and customer centric culture with key drivers Take your projects to the next level with our ultimate collection of Key Benefits Of Customer Journey Mapping Driving Business Success Integrating Product. Slidegeeks has designed a range of layouts that are perfect for representing task or activity duration, keeping track of all your deadlines at a glance. Tailor these designs to your exact needs and give them a truly corporate look with your own brand colors they will make your projects stand out from the rest This slide outlines benefits of journey mapping aimed at tracking customer activities to make data driven decisions. It covers major benefits such as team alignment, customer retention, improvement in messaging and customer centric culture with key drivers
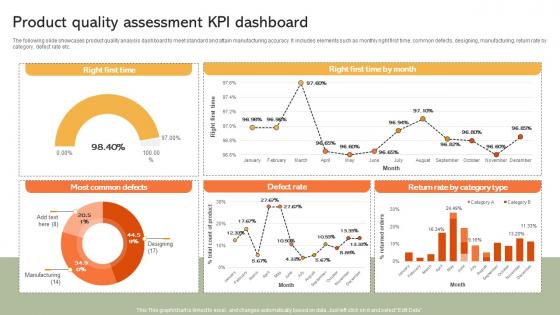
Product Quality Assessment KPI Dashboard Implementing Manufacturing Strategy SS V
The following slide showcases product quality analysis dashboard to meet standard and attain manufacturing accuracy. It includes elements such as monthly right first time, common defects, designing, manufacturing, return rate by category, defect rate etc. Take your projects to the next level with our ultimate collection of Product Quality Assessment KPI Dashboard Implementing Manufacturing Strategy SS V. Slidegeeks has designed a range of layouts that are perfect for representing task or activity duration, keeping track of all your deadlines at a glance. Tailor these designs to your exact needs and give them a truly corporate look with your own brand colors they will make your projects stand out from the rest The following slide showcases product quality analysis dashboard to meet standard and attain manufacturing accuracy. It includes elements such as monthly right first time, common defects, designing, manufacturing, return rate by category, defect rate etc.
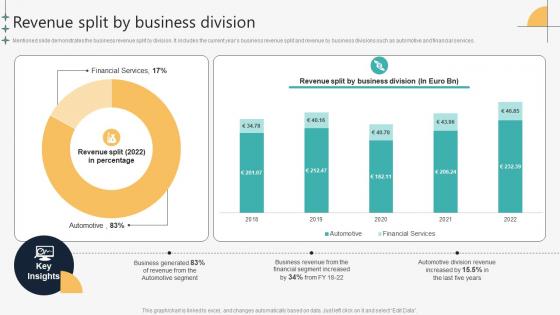
Revenue Split By Business Division Automotive Manufacturing Company Profile CP SS V
Mentioned slide demonstrates the business revenue split by division. It includes the current years business revenue split and revenue by business divisions such as automotive and financial services.Take your projects to the next level with our ultimate collection of Revenue Split By Business Division Automotive Manufacturing Company Profile CP SS V. Slidegeeks has designed a range of layouts that are perfect for representing task or activity duration, keeping track of all your deadlines at a glance. Tailor these designs to your exact needs and give them a truly corporate look with your own brand colors they will make your projects stand out from the rest Mentioned slide demonstrates the business revenue split by division. It includes the current years business revenue split and revenue by business divisions such as automotive and financial services.
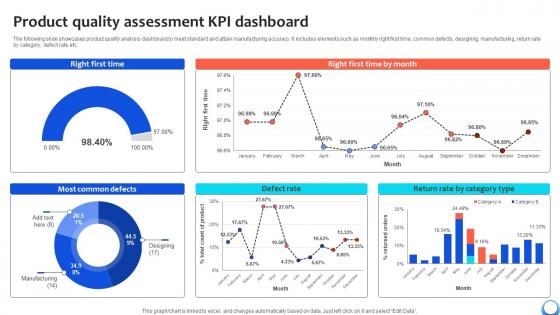
Product Quality Assessment KPI Dashboard Automating Production Process Strategy SS V
The following slide showcases product quality analysis dashboard to meet standard and attain manufacturing accuracy. It includes elements such as monthly right first time, common defects, designing, manufacturing, return rate by category, defect rate etc. Take your projects to the next level with our ultimate collection of Product Quality Assessment KPI Dashboard Automating Production Process Strategy SS V. Slidegeeks has designed a range of layouts that are perfect for representing task or activity duration, keeping track of all your deadlines at a glance. Tailor these designs to your exact needs and give them a truly corporate look with your own brand colors they will make your projects stand out from the rest The following slide showcases product quality analysis dashboard to meet standard and attain manufacturing accuracy. It includes elements such as monthly right first time, common defects, designing, manufacturing, return rate by category, defect rate etc.
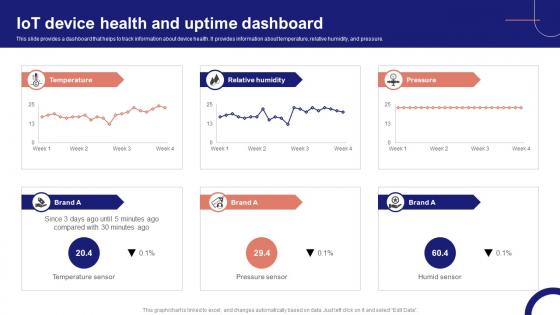
IoT Device Management Fundamentals IoT Device Health And Uptime Dashboard IoT Ss V
This slide provides a dashboard that helps to track information about device health. It provides information about temperature, relative humidity, and pressure. Take your projects to the next level with our ultimate collection of IoT Device Management Fundamentals IoT Device Health And Uptime Dashboard IoT SS V. Slidegeeks has designed a range of layouts that are perfect for representing task or activity duration, keeping track of all your deadlines at a glance. Tailor these designs to your exact needs and give them a truly corporate look with your own brand colors they will make your projects stand out from the rest This slide provides a dashboard that helps to track information about device health. It provides information about temperature, relative humidity, and pressure.
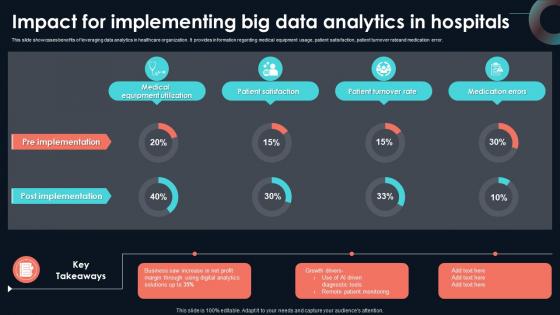
Impact For Implementing Big Data Analytics Developing Strategic Insights Using Big Data Analytics SS V
This slide showcases benefits of leveraging data analytics in healthcare organization. It provides information regarding medical equipment usage, patient satisfaction, patient turnover rateand medication error. Take your projects to the next level with our ultimate collection of Impact For Implementing Big Data Analytics Developing Strategic Insights Using Big Data Analytics SS V. Slidegeeks has designed a range of layouts that are perfect for representing task or activity duration, keeping track of all your deadlines at a glance. Tailor these designs to your exact needs and give them a truly corporate look with your own brand colors they will make your projects stand out from the rest This slide showcases benefits of leveraging data analytics in healthcare organization. It provides information regarding medical equipment usage, patient satisfaction, patient turnover rateand medication error.
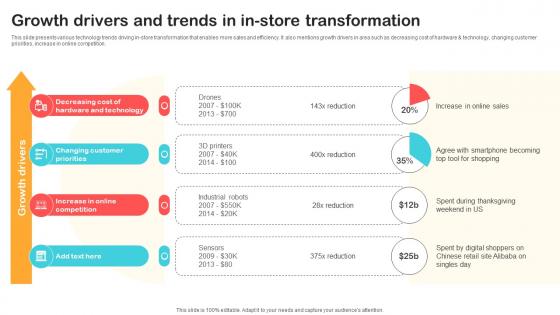
Growth Drivers And Trends In In Store Transformation Optimizing Retail Operations With Digital DT SS V
This slide presents various technology trends driving in-store transformation that enables more sales and efficiency. It also mentions growth drivers in area such as decreasing cost of hardware and technology, changing customer priorities, increase in online competition.Take your projects to the next level with our ultimate collection of Growth Drivers And Trends In In Store Transformation Optimizing Retail Operations With Digital DT SS V. Slidegeeks has designed a range of layouts that are perfect for representing task or activity duration, keeping track of all your deadlines at a glance. Tailor these designs to your exact needs and give them a truly corporate look with your own brand colors they will make your projects stand out from the rest This slide presents various technology trends driving in-store transformation that enables more sales and efficiency. It also mentions growth drivers in area such as decreasing cost of hardware and technology, changing customer priorities, increase in online competition.


 Continue with Email

 Home
Home


