Purchase Kpi
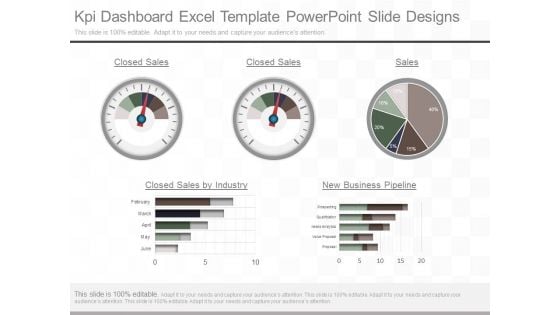
Kpi Dashboard Excel Template Powerpoint Slide Designs
This is a kpi dashboard excel template powerpoint slide designs. This is a five stage process. The stages in this process are closed sales, closed sales, sales, closed sales by industry, new business pipeline, february, march april, may, june, prospecting, qualification, needs analytics, value proposal, proposal.
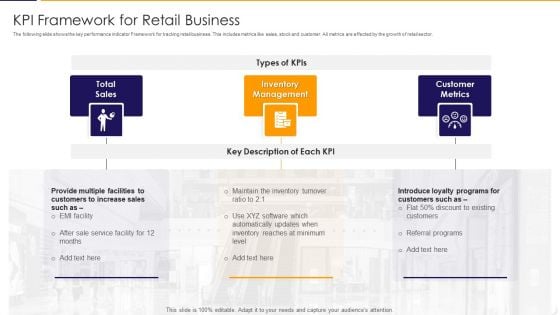
KPI Framework For Retail Business Elements PDF
The following slide shows the key performance indicator Framework for tracking retail business. This includes metrics like sales, stock and customer. All metrics are affected by the growth of retail sector. Presenting kpi framework for retail business elements pdf to dispense important information. This template comprises three stages. It also presents valuable insights into the topics including total sales, inventory management, customer metrics. This is a completely customizable PowerPoint theme that can be put to use immediately. So, download it and address the topic impactfully.
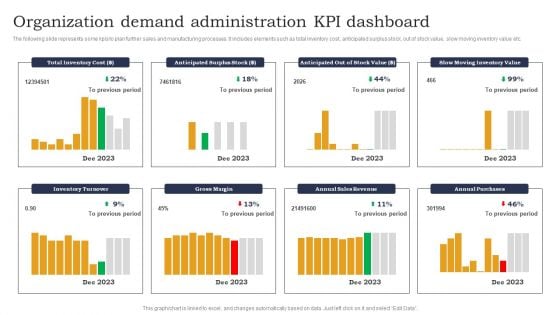
Organization Demand Administration KPI Dashboard Designs PDF
The following slide represents some kpis to plan further sales and manufacturing processes. It includes elements such as total inventory cost, anticipated surplus stock, out of stock value, slow moving inventory value etc. Pitch your topic with ease and precision using this Organization Demand Administration KPI Dashboard Designs PDF. This layout presents information on Anticipated Surplus Stock, Out Of Stock, Slow Moving Inventory. It is also available for immediate download and adjustment. So, changes can be made in the color, design, graphics or any other component to create a unique layout.
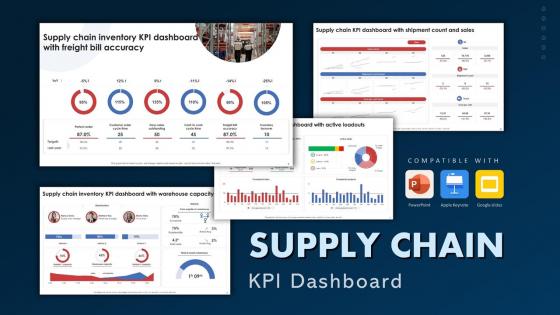
Supply Chain KPI Dashboard Powerpoint Ppt Template Bundles
Use this Supply Chain KPI Dashboard Powerpoint Ppt Template Bundles to ensure the business world gets to know you as a presentation expert with tremendous recall value. With its focus on providing the worlds best designs to highlight business ideas that have the potential to change the world, this PPT Template is sure to win you clients. The complete deck in Freight Bill KPI, Warehouse Capacity, Average Purchase Value, Supply Chain Metrics, Total Savings slides is a compendium of information, structured in a manner that provides the best framework for a presentation. Use this completely editable and customizable presentation to make an impact and improve your order book. Download now. Supply chain KPIs key performance indicators are metrics that measure the performance of a supply chain and help with decision-making. Our Supply Chain KPI Dashboard Powerpoint Ppt Template Bundles are topically designed to provide an attractive backdrop to any subject.
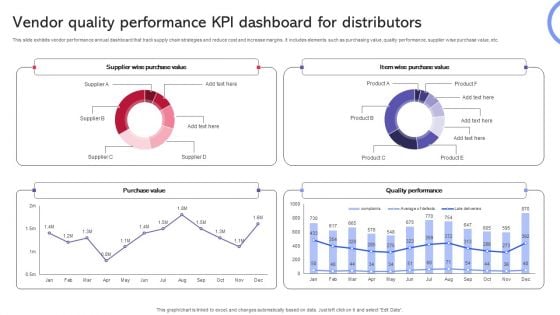
Vendor Quality Performance KPI Dashboard For Distributors Template PDF
This slide exhibits vendor performance annual dashboard that track supply chain strategies and reduce cost and increase margins. It includes elements such as purchasing value, quality performance, supplier wise purchase value, etc. Pitch your topic with ease and precision using this Vendor Quality Performance KPI Dashboard For Distributors Template PDF. This layout presents information on Purchase Value, Quality Performance, Supplier Wise Purchase Value. It is also available for immediate download and adjustment. So, changes can be made in the color, design, graphics or any other component to create a unique layout.
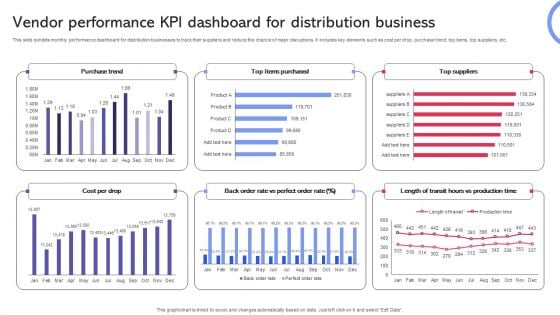
Vendor Performance KPI Dashboard For Distribution Business Formats PDF
This slide exhibits monthly performance dashboard for distribution businesses to track their suppliers and reduce the chance of major disruptions. It includes key elements such as cost per drop, purchase trend, top items, top suppliers, etc. Showcasing this set of slides titled Vendor Performance KPI Dashboard For Distribution Business Formats PDF. The topics addressed in these templates are Purchase Trend, Suppliers, Distribution Business. All the content presented in this PPT design is completely editable. Download it and make adjustments in color, background, font etc. as per your unique business setting.
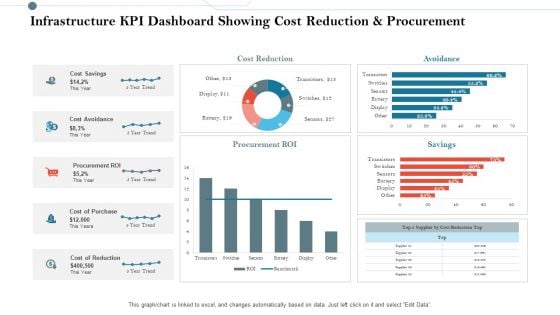
Infrastructure KPI Dashboard Showing Cost Reduction And Procurement Information PDF
Deliver an awe inspiring pitch with this creative infrastructure kpi dashboard showing cost reduction and procurement information pdf bundle. Topics like cost reduction, cost savings, cost avoidance, procurement roi, cost of purchase can be discussed with this completely editable template. It is available for immediate download depending on the needs and requirements of the user.

Infrastructure KPI Dashboard Showing Cost Reduction And Procurement Background PDF
Deliver and pitch your topic in the best possible manner with this infrastructure kpi dashboard showing cost reduction and procurement background pdf. Use them to share invaluable insights on cost reduction, cost savings, cost avoidance, cost of reduction, cost of purchase and impress your audience. This template can be altered and modified as per your expectations. So, grab it now.
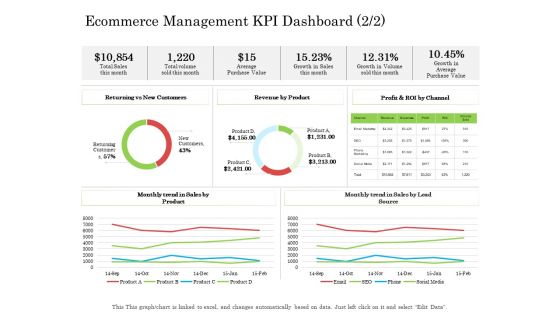
Ecommerce Management KPI Dashboard Ppt Styles Design Ideas PDF
Deliver and pitch your topic in the best possible manner with this ecommerce management kpi dashboard ppt styles design ideas pdf. Use them to share invaluable insights on average purchase value, revenue by product, sales by product and impress your audience. This template can be altered and modified as per your expectations. So, grab it now.
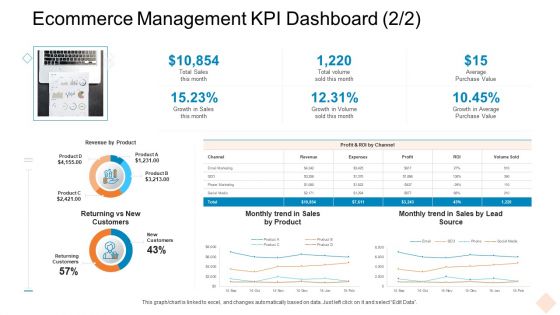
Ecommerce Management KPI Dashboard Ppt Infographics Graphics Example PDF
Deliver and pitch your topic in the best possible manner with this ecommerce management kpi dashboard ppt infographics graphics example pdf. Use them to share invaluable insights on revenue by product, sales by product, growth in average purchase value and impress your audience. This template can be altered and modified as per your expectations. So, grab it now.
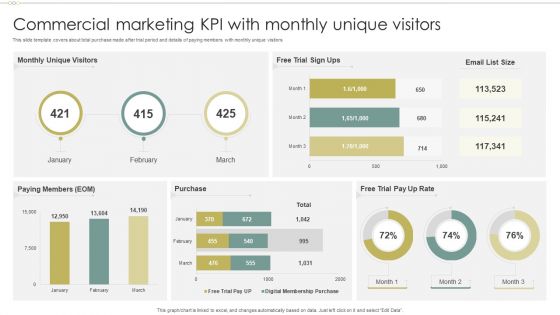
Commercial Marketing KPI With Monthly Unique Visitors Graphics PDF
This slide template covers about total purchase made after trial period and details of paying members with monthly unique visitors.Showcasing this set of slides titled Commercial Marketing KPI With Monthly Unique Visitors Graphics PDF. The topics addressed in these templates are Unique Visitors, Paying Members, Trial Pay. All the content presented in this PPT design is completely editable. Download it and make adjustments in color, background, font etc. as per your unique business setting.
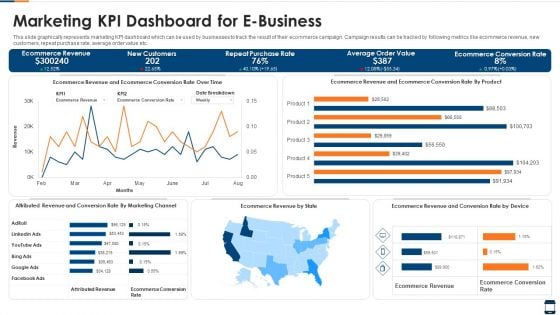
Marketing KPI Dashboard For E Business Brochure PDF
This slide graphically represents marketing KPI dashboard which can be used by businesses to track the result of their ecommerce campaign. Campaign results can be tracked by following metrics like ecommerce revenue, new customers, repeat purchase rate, average order value etc. Showcasing this set of slides titled marketing kpi dashboard for e business brochure pdf. The topics addressed in these templates are marketing kpi dashboard for e business. All the content presented in this PPT design is completely editable. Download it and make adjustments in color, background, font etc. as per your unique business setting.
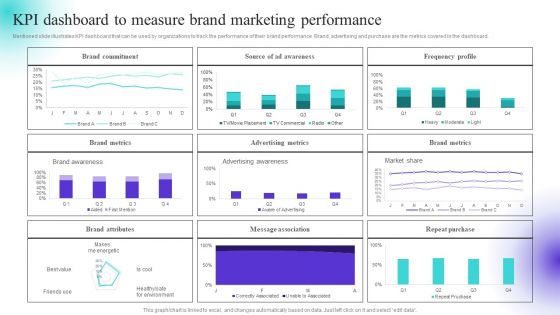
KPI Dashboard To Measure Brand Marketing Performance Inspiration PDF
Mentioned slide illustrates KPI dashboard that can be used by organizations to track the performance of their brand performance. Brand, advertising and purchase are the metrics covered in the dashboard. Boost your pitch with our creative KPI Dashboard To Measure Brand Marketing Performance Inspiration PDF. Deliver an awe inspiring pitch that will mesmerize everyone. Using these presentation templates you will surely catch everyones attention. You can browse the ppts collection on our website. We have researchers who are experts at creating the right content for the templates. So you do not have to invest time in any additional work. Just grab the template now and use them.

Create A Restaurant Marketing KPI Measuring After Implementing Restaurant
The following slide showcases various key performance indicators KPIs through which marketers can evaluate the success of traditional marketing performance. The metrics mentioned in slide are customer acquisition cost CAC , cross-sells, referrals, sales per square foot, repeat purchase rate, foot traffic, average order value, etc. Crafting an eye-catching presentation has never been more straightforward. Let your presentation shine with this tasteful yet straightforward Create A Restaurant Marketing KPI Measuring After Implementing Restaurant template. It offers a minimalistic and classy look that is great for making a statement. The colors have been employed intelligently to add a bit of playfulness while still remaining professional. Construct the ideal Create A Restaurant Marketing KPI Measuring After Implementing Restaurant that effortlessly grabs the attention of your audience Begin now and be certain to wow your customers The following slide showcases various key performance indicators KPIs through which marketers can evaluate the success of traditional marketing performance. The metrics mentioned in slide are customer acquisition cost CAC , cross-sells, referrals, sales per square foot, repeat purchase rate, foot traffic, average order value, etc.
Booting Brand Image By Tracking KPI Metrics Diagrams PDF
This slide consists of key performance indicators to be used by mangers to track the brand awareness . Key metrices covered are content reach, brand mention, blog shares, search volume data, repeat purchase and organic traffic. Showcasing this set of slides titled Booting Brand Image By Tracking KPI Metrics Diagrams PDF. The topics addressed in these templates are Content Reach, Brand Mentions, Blog Shares. All the content presented in this PPT design is completely editable. Download it and make adjustments in color, background, font etc. as per your unique business setting.
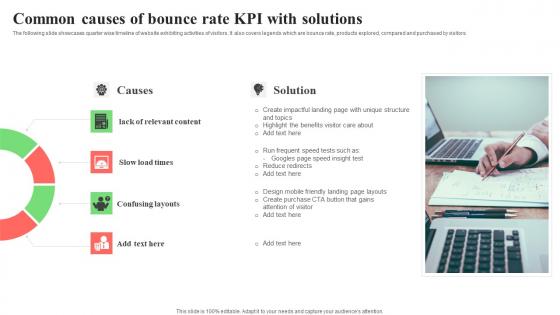
Common Causes Of Bounce Rate KPI With Solutions Topics Pdf
The following slide showcases quarter wise timeline of website exhibiting activities of visitors. It also covers legends which are bounce rate, products explored, compared and purchased by visitors. Showcasing this set of slides titled Common Causes Of Bounce Rate KPI With Solutions Topics Pdf. The topics addressed in these templates are Bounce Rate, Products Explored, Compared And Purchased. All the content presented in this PPT design is completely editable. Download it and make adjustments in color, background, font etc. as per your unique business setting. The following slide showcases quarter wise timeline of website exhibiting activities of visitors. It also covers legends which are bounce rate, products explored, compared and purchased by visitors.
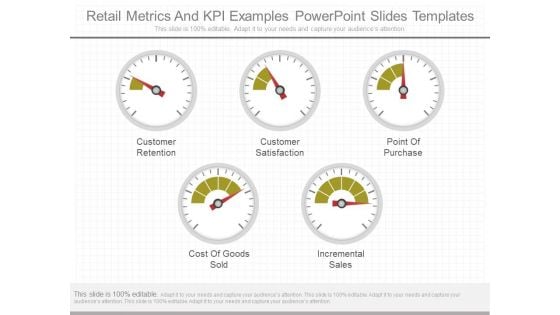
Retail Metrics And Kpi Examples Powerpoint Slides Templates
This is a retail metrics and kpi examples powerpoint slides templates. This is a five stage process. The stages in this process are customer retention, customer satisfaction, point of purchase, cost of goods sold, incremental sales.
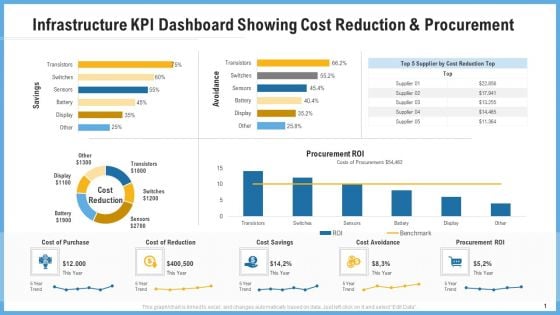
Infrastructure Kpi Dashboard Showing Cost Reduction And Procurement Graphics PDF
Deliver an awe inspiring pitch with this creative infrastructure kpi dashboard showing cost reduction and procurement graphics pdf bundle. Topics like cost of purchase, cost of reduction, cost saving, procurement roi can be discussed with this completely editable template. It is available for immediate download depending on the needs and requirements of the user.
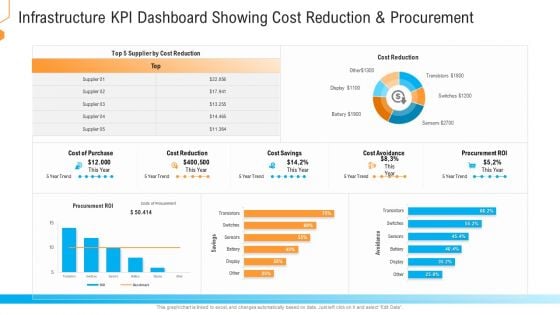
Kpi Dashboard Showing Cost Reduction And Procurement Demonstration PDF
Deliver an awe inspiring pitch with this creative kpi dashboard showing cost reduction and procurement demonstration pdf bundle. Topics like cost of purchase, cost reduction, cost savings, cost avoidance can be discussed with this completely editable template. It is available for immediate download depending on the needs and requirements of the user.

Media Buying Kpi Ppt PowerPoint Presentation Model Display Cpb
This is a media buying kpi ppt powerpoint presentation model display cpb. This is a four stage process. The stages in this process are media buying kpi.

Media Kpi Performance Evaluation Ppt PowerPoint Presentation Visual Aids
This is a media kpi performance evaluation ppt powerpoint presentation visual aids. This is a three stage process. The stages in this process are traffic, enagagement, conversion, website visitors, purchases, installs, sign ups.
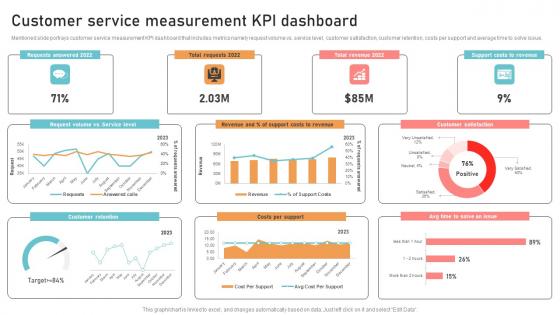
Optimizing Business Integration Customer Service Measurement KPI Template Pdf
Mentioned slide portrays customer service measurement KPI dashboard that includes metrics namely request volume vs. service level, customer satisfaction, customer retention, costs per support and average time to solve issue. Slidegeeks is here to make your presentations a breeze with Optimizing Business Integration Customer Service Measurement KPI Template Pdf With our easy to use and customizable templates, you can focus on delivering your ideas rather than worrying about formatting. With a variety of designs to choose from, you are sure to find one that suits your needs. And with animations and unique photos, illustrations, and fonts, you can make your presentation pop. So whether you are giving a sales pitch or presenting to the board, make sure to check out Slidegeeks first. Mentioned slide portrays customer service measurement KPI dashboard that includes metrics namely request volume vs. service level, customer satisfaction, customer retention, costs per support and average time to solve issue.
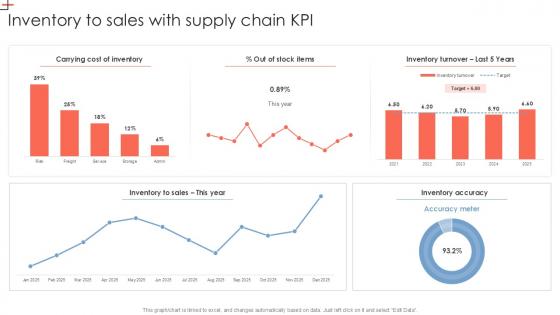
Inventory To Sales With Supply Chain KPI PPT Example SS
Slidegeeks is one of the best resources for PowerPoint templates. You can download easily and regulate Inventory To Sales With Supply Chain KPI PPT Example SS for your personal presentations from our wonderful collection. A few clicks is all it takes to discover and get the most relevant and appropriate templates. Use our Templates to add a unique zing and appeal to your presentation and meetings. All the slides are easy to edit and you can use them even for advertisement purposes. Our Inventory To Sales With Supply Chain KPI PPT Example SS are topically designed to provide an attractive backdrop to any subject. Use them to look like a presentation pro.
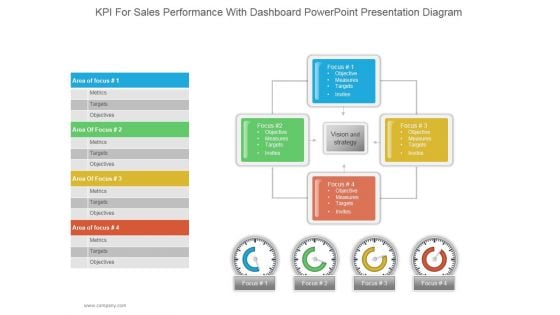
Kpi For Sales Performance With Dashboard Ppt PowerPoint Presentation Information
This is a kpi kpi for sales performance with dashboard ppt powerpoint presentation information. This is a four stage process. The stages in this process are metrics, targets, objectives, measures, targets, invites.
Supplier Compliance Kpi Dashboards Procurement Performance Tracker Slides PDF
This slide covers Procurement suppliers Performance Tracker dashboard including metrics like procurement cycle etc. Deliver and pitch your topic in the best possible manner with this supplier compliance kpi dashboards procurement performance tracker slides pdf. Use them to share invaluable insights on supplier compliance kpi dashboards procurement performance tracker and impress your audience. This template can be altered and modified as per your expectations. So, grab it now.
Strategic Brand Management KPI Dashboard To Monitor Icons Pdf
Mentioned slide shows the KPI dashboard that can be used to track win and lost sales opportunities. It includes metrics namely won opportunities, lost opportunities, pipeline by territory, total opportunities. This Strategic Brand Management KPI Dashboard To Monitor Icons Pdf from Slidegeeks makes it easy to present information on your topic with precision. It provides customization options, so you can make changes to the colors, design, graphics, or any other component to create a unique layout. It is also available for immediate download, so you can begin using it right away. Slidegeeks has done good research to ensure that you have everything you need to make your presentation stand out. Make a name out there for a brilliant performance. Mentioned slide shows the KPI dashboard that can be used to track win and lost sales opportunities. It includes metrics namely won opportunities, lost opportunities, pipeline by territory, total opportunities.
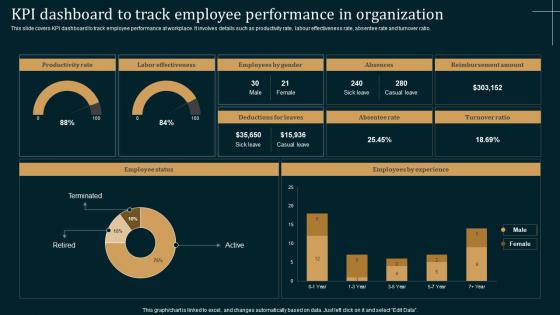
Employee Performance Improvement Strategies KPI Dashboard Track Employee Guidelines Pdf
This slide covers KPI dashboard to track employee performance at workplace. It involves details such as productivity rate, labour effectiveness rate, absentee rate and turnover ratio. Slidegeeks is here to make your presentations a breeze with Employee Performance Improvement Strategies KPI Dashboard Track Employee Guidelines Pdf With our easy to use and customizable templates, you can focus on delivering your ideas rather than worrying about formatting. With a variety of designs to choose from, you are sure to find one that suits your needs. And with animations and unique photos, illustrations, and fonts, you can make your presentation pop. So whether you are giving a sales pitch or presenting to the board, make sure to check out Slidegeeks first This slide covers KPI dashboard to track employee performance at workplace. It involves details such as productivity rate, labour effectiveness rate, absentee rate and turnover ratio.
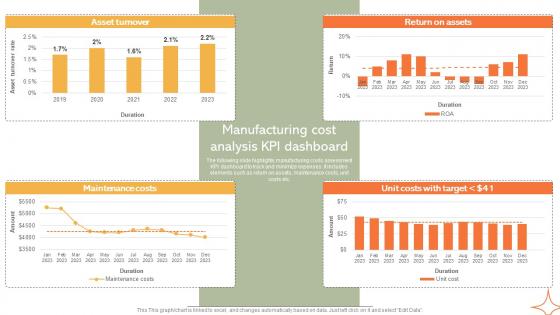
Manufacturing Cost Analysis KPI Dashboard Implementing Manufacturing Strategy SS V
The following slide highlights manufacturing costs assessment KPI dashboard to track and minimize expenses. It includes elements such as return on assets, maintenance costs, unit costs etc. Make sure to capture your audiences attention in your business displays with our gratis customizable Manufacturing Cost Analysis KPI Dashboard Implementing Manufacturing Strategy SS V. These are great for business strategies, office conferences, capital raising or task suggestions. If you desire to acquire more customers for your tech business and ensure they stay satisfied, create your own sales presentation with these plain slides. The following slide highlights manufacturing costs assessment KPI dashboard to track and minimize expenses. It includes elements such as return on assets, maintenance costs, unit costs etc.
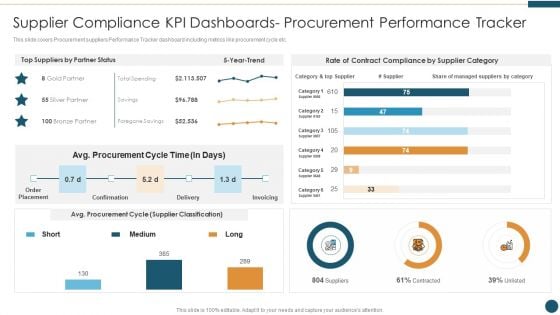
Supplier Relationship Management Supplier Compliance KPI Dashboards Structure PDF
This slide covers Procurement suppliers Performance Tracker dashboard including metrics like procurement cycle etc. Deliver an awe inspiring pitch with this creative Supplier Relationship Management Supplier Compliance KPI Dashboards Structure PDF bundle. Topics like Supplier Compliance Kpi Dashboards Procurement Performance Tracker can be discussed with this completely editable template. It is available for immediate download depending on the needs and requirements of the user.
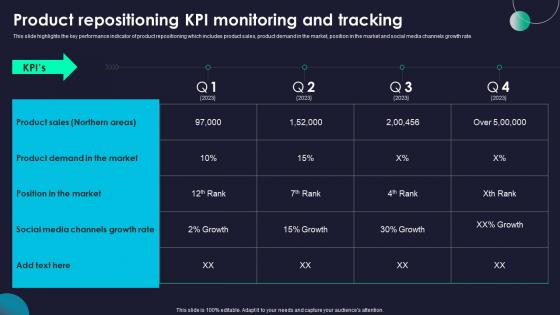
Product Repositioning KPI Rebranding Marketing Strategies For Effective Designs Pdf
This slide highlights the key performance indicator of product repositioning which includes product sales, product demand in the market, position in the market and social media channels growth rate. Explore a selection of the finest Product Repositioning KPI Rebranding Marketing Strategies For Effective Designs Pdf here. With a plethora of professionally designed and pre made slide templates, you can quickly and easily find the right one for your upcoming presentation. You can use our Product Repositioning KPI Rebranding Marketing Strategies For Effective Designs Pdf to effectively convey your message to a wider audience. Slidegeeks has done a lot of research before preparing these presentation templates. The content can be personalized and the slides are highly editable. Grab templates today from Slidegeeks. This slide highlights the key performance indicator of product repositioning which includes product sales, product demand in the market, position in the market and social media channels growth rate.
KPI Dashboard For Tracking Consumer Journey Touchpoints Clipart PDF
This slide covers a touchpoint dashboard with different customer journey stages. It also includes a detailed evaluation of each stage on the basis of experience, importance, etc. Deliver and pitch your topic in the best possible manner with this KPI Dashboard For Tracking Consumer Journey Touchpoints Clipart PDF. Use them to share invaluable insights on Consumer Journey, Purchasing, Consumer Service and impress your audience. This template can be altered and modified as per your expectations. So, grab it now.
Supplier Compliance KPI Dashboards Procurement Performance Tracker Ideas PDF
This slide covers Procurement suppliers Performance Tracker dashboard including metrics like procurement cycle etc. Deliver and pitch your topic in the best possible manner with this supplier compliance kpi dashboards procurement performance tracker ideas pdf. Use them to share invaluable insights on procurement, supplier, dashboard and impress your audience. This template can be altered and modified as per your expectations. So, grab it now.
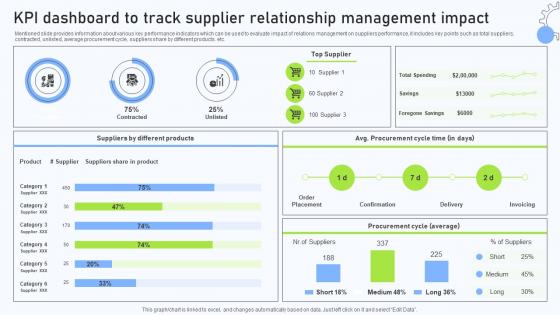
Relationship Management Automation KPI Dashboard To Track Supplier Relationship
Mentioned slide provides information about various key performance indicators which can be used to evaluate impact of relations management on suppliers performance, it includes key points such as total suppliers, contracted, unlisted, average procurement cycle, suppliers share by different products. etc. This Relationship Management Automation KPI Dashboard To Track Supplier Relationship is perfect for any presentation, be it in front of clients or colleagues. It is a versatile and stylish solution for organizing your meetings. The Relationship Management Automation KPI Dashboard To Track Supplier Relationship features a modern design for your presentation meetings. The adjustable and customizable slides provide unlimited possibilities for acing up your presentation. Slidegeeks has done all the homework before launching the product for you. So, do not wait, grab the presentation templates today Mentioned slide provides information about various key performance indicators which can be used to evaluate impact of relations management on suppliers performance, it includes key points such as total suppliers, contracted, unlisted, average procurement cycle, suppliers share by different products. etc.
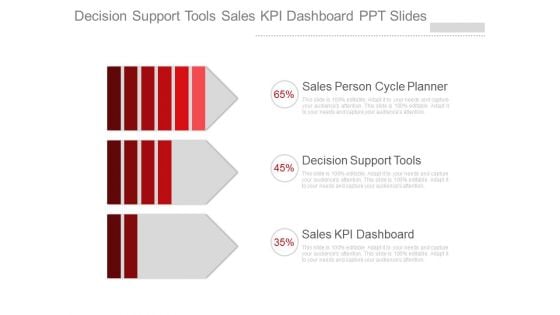
Decision Support Tools Sales Kpi Dashboard Ppt Slides
This is a decision support tools sales kpi dashboard ppt slides. This is a three stage process. The stages in this process are shapes, business, success.
Sales Rep Kpi Tracker Ppt PowerPoint Presentation Template
This is a sales rep kpi tracker ppt powerpoint presentation template. This is a four stage process. The stages in this process are business, strategy, marketing, analysis, table.
Sales KPI Tracker Ppt PowerPoint Presentation Outline Tips
This is a sales kpi tracker ppt powerpoint presentation outline tips. This is a six stage process. The stages in this process are finance, analysis, business, investment, marketing.
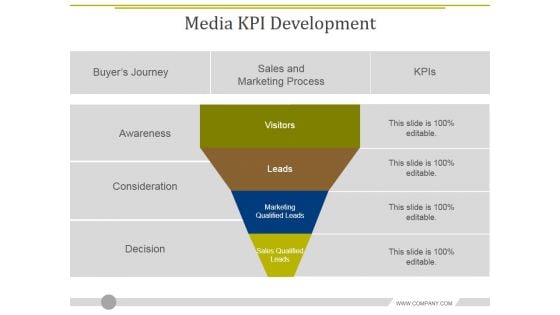
Media Kpi Development Ppt PowerPoint Presentation Slides Files
This is a media kpi development ppt powerpoint presentation slides files. This is a four stage process. The stages in this process are awareness, consideration, decision, visitors, leads.
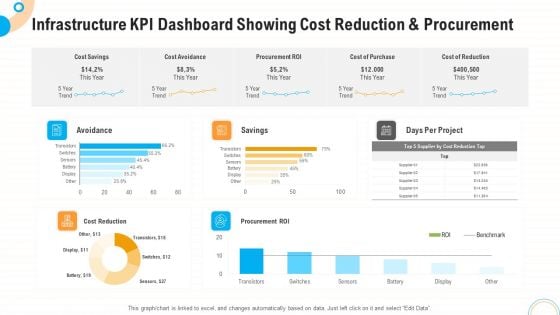
Infrastructure KPI Dashboard Showing Cost Reduction And Procurement Demonstration PDF
Deliver an awe inspiring pitch with this creative infrastructure kpi dashboard showing cost reduction and procurement demonstration pdf bundle. Topics like cost reduction, procurement roi, avoidance, savings can be discussed with this completely editable template. It is available for immediate download depending on the needs and requirements of the user.

Infrastructure KPI Dashboard Showing Cost Reduction And Procurement Mockup PDF
Deliver an awe inspiring pitch with this creative infrastructure kpi dashboard showing cost reduction and procurement mockup pdf bundle. Topics like cost reduction, procurement roi, avoidance, savings can be discussed with this completely editable template. It is available for immediate download depending on the needs and requirements of the user.
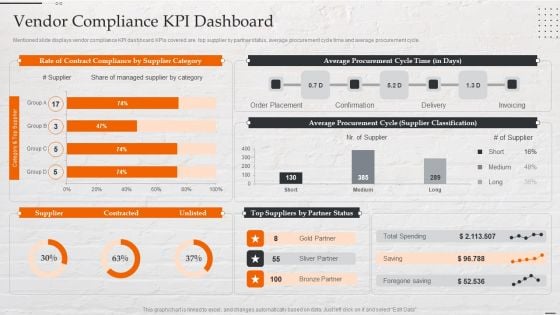
Capital Investment Options Vendor Compliance Kpi Dashboard Designs PDF
Mentioned slide displays vendor compliance KPI dashboard. KPIs covered are top supplier by partner status, average procurement cycle time and average procurement cycle. Deliver an awe inspiring pitch with this creative Capital Investment Options Vendor Compliance Kpi Dashboard Designs PDF bundle. Topics like Average Procurement, Cycle Time, Confirmation, Order Placement can be discussed with this completely editable template. It is available for immediate download depending on the needs and requirements of the user.
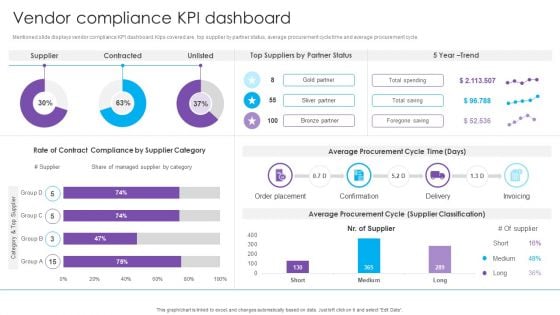
Vendor Compliance KPI Dashboard Real Estate Project Funding Inspiration PDF
Mentioned slide displays vendor compliance KPI dashboard. Kips covered are top supplier by partner status, average procurement cycle time and average procurement cycle.Deliver and pitch your topic in the best possible manner with this Vendor Compliance KPI Dashboard Real Estate Project Funding Inspiration PDF. Use them to share invaluable insights on Contract Compliance, Average Procurement, Order Placement and impress your audience. This template can be altered and modified as per your expectations. So, grab it now.
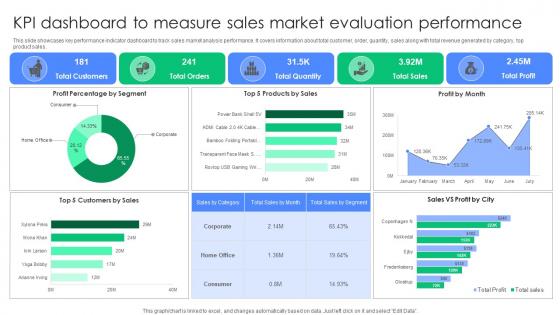
KPI Dashboard To Measure Sales Market Evaluation Performance Summary Pdf
This slide showcases key performance indicator dashboard to track sales market analysis performance. It covers information about total customer, order, quantity, sales along with total revenue generated by category, top product sales. Pitch your topic with ease and precision using this KPI Dashboard To Measure Sales Market Evaluation Performance Summary Pdf. This layout presents information on Profit Percentage Segment, Products Sales, Profit Month. It is also available for immediate download and adjustment. So, changes can be made in the color, design, graphics or any other component to create a unique layout. This slide showcases key performance indicator dashboard to track sales market analysis performance. It covers information about total customer, order, quantity, sales along with total revenue generated by category, top product sales.
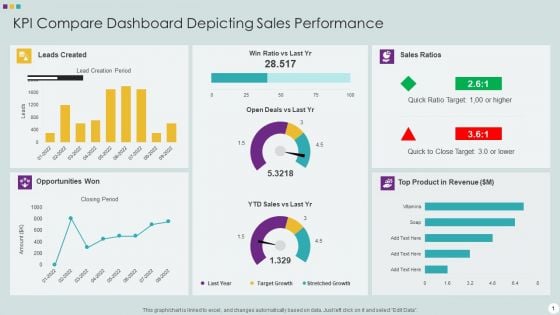
KPI Compare Dashboard Depicting Sales Performance Summary PDF
Pitch your topic with ease and precision using this KPI Compare Dashboard Depicting Sales Performance Summary PDF This layout presents information on KPI Compare Dashboard Depicting Sales Performance It is also available for immediate download and adjustment. So, changes can be made in the color, design, graphics or any other component to create a unique layout.
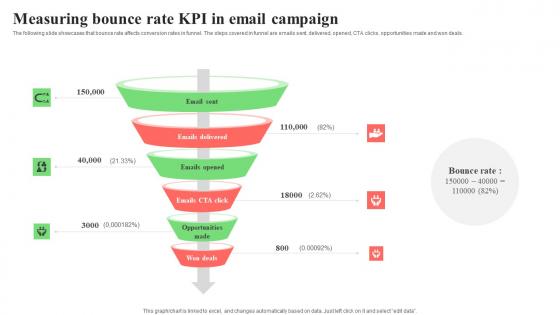
Measuring Bounce Rate KPI In Email Campaign Designs Pdf
The following slide showcases that bounce rate affects conversion rates in funnel. The steps covered in funnel are emails sent, delivered, opened, CTA clicks, opportunities made and won deals. Pitch your topic with ease and precision using this Measuring Bounce Rate KPI In Email Campaign Designs Pdf. This layout presents information on Delivered, Opened, CTA Clicks, Opportunities. It is also available for immediate download and adjustment. So, changes can be made in the color, design, graphics or any other component to create a unique layout. The following slide showcases that bounce rate affects conversion rates in funnel. The steps covered in funnel are emails sent, delivered, opened, CTA clicks, opportunities made and won deals.

Create A Restaurant Marketing Major KPI For Restaurants Marketing Plan
This slide shows major key performance indicators for restaurant promotion plan. The highlighted issues are lack of website traffic, low lead generation, decreasing ROI, leads not moving through the pipeline, and time-consuming low, quality leads Make sure to capture your audiences attention in your business displays with our gratis customizable Create A Restaurant Marketing Major KPI For Restaurants Marketing Plan. These are great for business strategies, office conferences, capital raising or task suggestions. If you desire to acquire more customers for your tech business and ensure they stay satisfied, create your own sales presentation with these plain slides. This slide shows major key performance indicators for restaurant promotion plan. The highlighted issues are lack of website traffic, low lead generation, decreasing ROI, leads not moving through the pipeline, and time-consuming low, quality leads
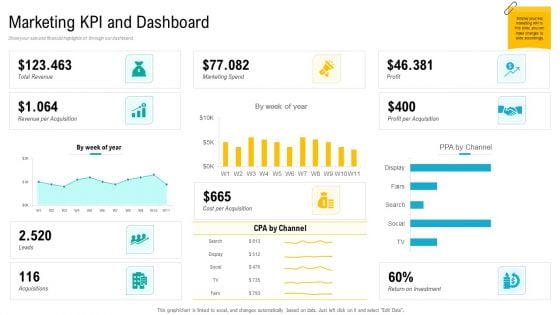
Product USP Marketing KPI And Dashboard Ppt Layouts Slides PDF
Show your sale and financial highlights of through our dashboard. Deliver an awe-inspiring pitch with this creative product usp marketing kpi and dashboard ppt layouts slides pdf bundle. Topics like marketing kpi and dashboard can be discussed with this completely editable template. It is available for immediate download depending on the needs and requirements of the user.
Sales Kpi Tracker Ppt PowerPoint Presentation Visual Aids Files
This is a sales kpi tracker ppt powerpoint presentation visual aids files. This is a six stage process. The stages in this process are leads created, sales ratio, opportunities won, top products in revenue, open deals vs last yr.
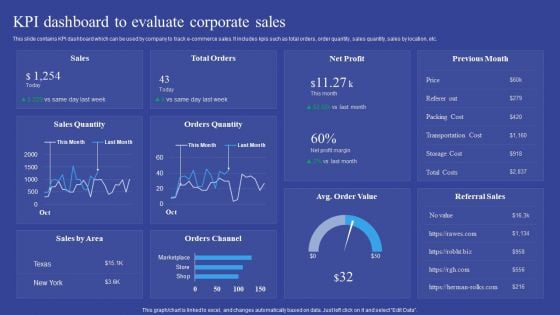
KPI Dashboard To Evaluate Corporate Sales Introduction PDF
This slide contains KPI dashboard which can be used by company to track e-commerce sales. It includes kpis such as total orders, order quantity, sales quantity, sales by location, etc. Pitch your topic with ease and precision using this KPI Dashboard To Evaluate Corporate Sales Introduction PDF. This layout presents information on KPI Dashboard, Evaluate Corporate Sales. It is also available for immediate download and adjustment. So, changes can be made in the color, design, graphics or any other component to create a unique layout.
Sales Kpi Tracker Ppt PowerPoint Presentation Pictures Layout Ideas
This is a sales kpi tracker ppt powerpoint presentation pictures layout ideas. This is a four stage process. The stages in this process are opportunities won, top products in revenue, leads created, win ratio vs last yr, open deals vs.

Sales Kpi Performance Summary Ppt PowerPoint Presentation Infographic Template Infographics
This is a sales kpi performance summary ppt powerpoint presentation infographic template infographics. This is a seven stage process. The stages in this process are revenue comparison, quantity comparison, product sales mix, regional sales mix.
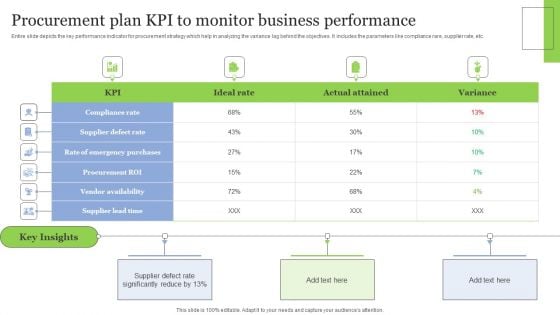
Procurement Plan Kpi To Monitor Business Performance Clipart PDF
Entire slide depicts the key performance indicator for procurement strategy which help in analyzing the variance lag behind the objectives. It includes the parameters like compliance rare, supplier rate, etc. Showcasing this set of slides titled Procurement Plan Kpi To Monitor Business Performance Clipart PDF. The topics addressed in these templates are Key Insights, Vendor Availability, Procurement ROI. All the content presented in this PPT design is completely editable. Download it and make adjustments in color, background, font etc. as per your unique business setting.
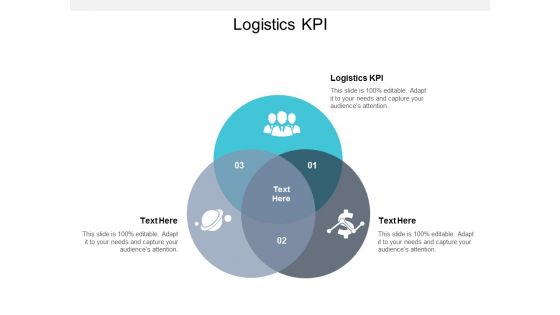
Logistics KPI Ppt PowerPoint Presentation Layouts Introduction Cpb
Presenting this set of slides with name logistics logistics kpi ppt powerpoint presentation layouts introduction cpb. This is an editable Powerpoint three stages graphic that deals with topics like logistics kpi to help convey your message better graphically. This product is a premium product available for immediate download and is 100 percent editable in Powerpoint. Download this now and use it in your presentations to impress your audience.
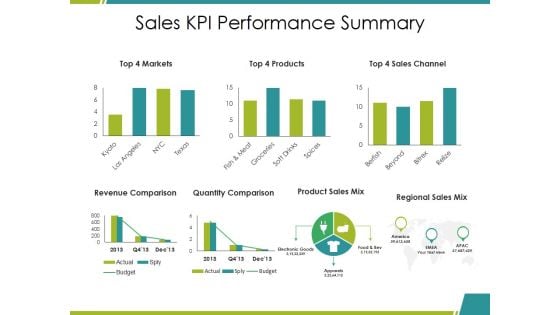
Sales Kpi Performance Summary Ppt PowerPoint Presentation Infographic Template Elements
This is a sales kpi performance summary ppt powerpoint presentation infographic template elements. This is a seven stage process. The stages in this process are revenue comparison, quantity comparison, product sales mix, regional sales mix, budget.

Sales Kpi Performance Summary Ppt PowerPoint Presentation Ideas Graphics Template
This is a sales kpi performance summary ppt powerpoint presentation ideas graphics template. This is a seven stage process. The stages in this process are revenue comparison, quantity comparison, product sales mix, regional sales mix.
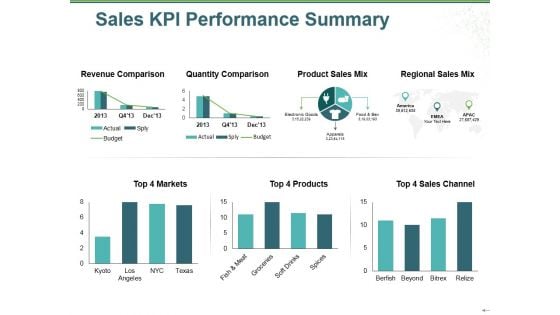
Sales Kpi Performance Summary Ppt PowerPoint Presentation Show Inspiration
This is a sales kpi performance summary ppt powerpoint presentation show inspiration. This is a two stage process. The stages in this process are revenue comparison, quantity comparison, product sales mix, regional sales mix, budget.

Sales Kpi Performance Summary Ppt PowerPoint Presentation Show Themes
This is a sales kpi performance summary ppt powerpoint presentation show themes. This is a three stage process. The stages in this process are revenue comparison, quantity comparison, product sales mix, markets, sales channel.
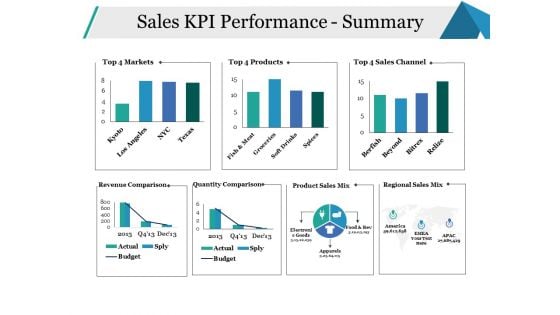
Sales KPI Performance Summary Ppt PowerPoint Presentation Infographics Model
This is a sales kpi performance summary ppt powerpoint presentation infographics model. This is a seven stage process. The stages in this process are sales channel, revenue comparison, quantity comparison, business, marketing.
Sales Kpi Tracker Ppt PowerPoint Presentation Pictures Designs
This is a sales kpi tracker ppt powerpoint presentation pictures designs. This is a two stage process. The stages in this process are leads created, sales ratio, opportunities won, top products in revenue, win ratio vs last yr.
Sales Kpi Tracker Ppt PowerPoint Presentation Gallery Shapes
This is a sales kpi tracker ppt powerpoint presentation gallery shapes. This is a six stage process. The stages in this process are target growth, leads created, sales ratio, last year, stretched growth.
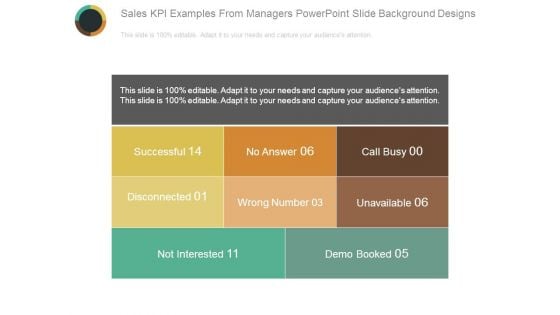
Sales Kpi Examples From Managers Powerpoint Slide Background Designs
This is a sales kpi examples from managers powerpoint slide background designs. This is a three stage process. The stages in this process are successful, no answer, call busy, disconnected, wrong number, unavailable, not interested, demo booked.


 Continue with Email

 Home
Home


