Purchase Kpi
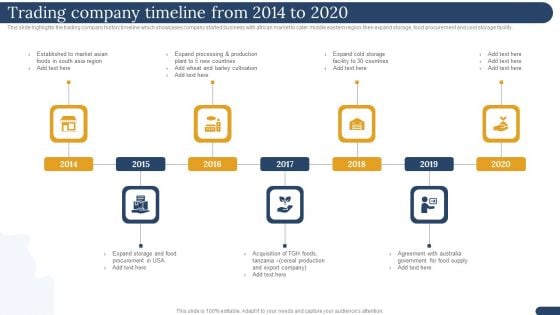
International Trading Business Export Company Trading Company Timeline From 2014 To 2020 Inspiration PDF
This slide highlights the trading company history timeline which showcases company started business with african market to cater middle eastern region, then expand storage, food procurement and cold storage facility. Presenting International Trading Business Export Company Trading Company Timeline From 2014 To 2020 Inspiration PDF to provide visual cues and insights. Share and navigate important information on eight stages that need your due attention. This template can be used to pitch topics like Established Market, Foods South, Barley Cultivation. In addtion, this PPT design contains high resolution images, graphics, etc, that are easily editable and available for immediate download.
Funnel Diagram With Technology Icons Powerpoint Template
Our above business slide has been designed with layout of funnel diagram with technology icons. This PPT diagram helps to portray digital marketing concept You can present your opinions using this impressive slide.
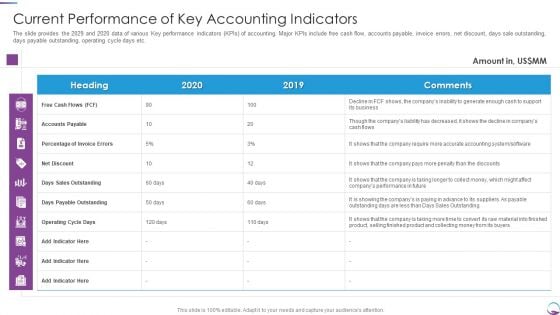
Current Performance Of Key Accounting Indicators Rules PDF
The slide provides the 2029 and 2020 data of various Key performance indicators KPIs of accounting. Major KPIs include free cash flow, accounts payable, invoice errors, net discount, days sale outstanding, days payable outstanding, operating cycle days etc. Deliver an awe inspiring pitch with this creative Current Performance Of Key Accounting Indicators Rules PDF bundle. Topics like Accounts Payable, Sales, Require, Material can be discussed with this completely editable template. It is available for immediate download depending on the needs and requirements of the user.
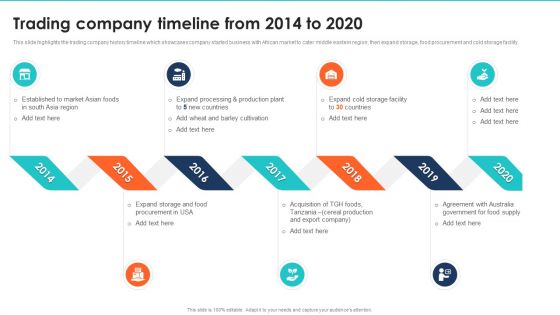
Export Management Company Profile Trading Company Timeline From 2014 To 2020 Formats PDF
This slide highlights the trading company history timeline which showcases company started business with African market to cater middle eastern region, then expand storage, food procurement and cold storage facility. Presenting Export Management Company Profile Trading Company Timeline From 2014 To 2020 Formats PDF to provide visual cues and insights. Share and navigate important information on seven stages that need your due attention. This template can be used to pitch topics like Procurement, Acquisition, Processing. In addtion, this PPT design contains high resolution images, graphics, etc, that are easily editable and available for immediate download.
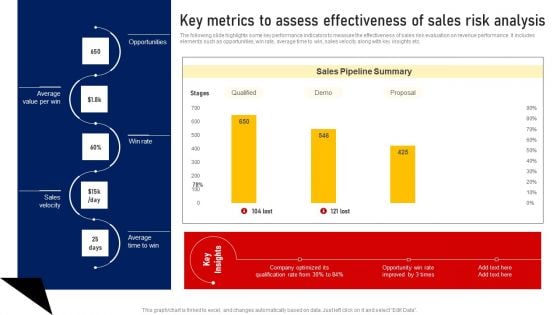
Performing Sales Risk Analysis Procedure Key Metrics To Assess Effectiveness Of Sales Risk Analysis Brochure PDF
The following slide highlights some key performance indicators to measure the effectiveness of sales risk evaluation on revenue performance. It includes elements such as opportunities, win rate, average time to win, sales velocity along with key insights etc. Get a simple yet stunning designed Performing Sales Risk Analysis Procedure Key Metrics To Assess Effectiveness Of Sales Risk Analysis Brochure PDF. It is the best one to establish the tone in your meetings. It is an excellent way to make your presentations highly effective. So, download this PPT today from Slidegeeks and see the positive impacts. Our easy to edit Performing Sales Risk Analysis Procedure Key Metrics To Assess Effectiveness Of Sales Risk Analysis Brochure PDF can be your go to option for all upcoming conferences and meetings. So, what are you waiting for Grab this template today.
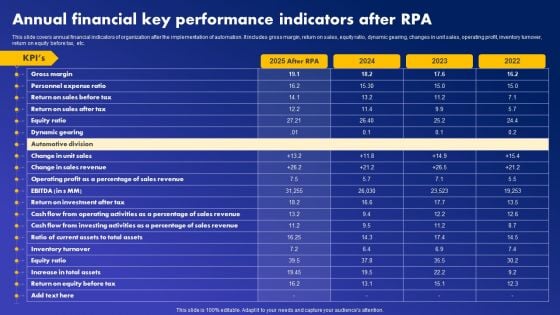
Annual Financial Key Performance Indicators After RPA Guidelines PDF
This slide covers annual financial indicators of organization after the implementation of automation. It includes gross margin, return on sales, equity ratio, dynamic gearing, changes in unit sales, operating profit, inventory turnover, return on equity before tax, etc. Create an editable Annual Financial Key Performance Indicators After RPA Guidelines PDF that communicates your idea and engages your audience. Whether you are presenting a business or an educational presentation, pre-designed presentation templates help save time. Annual Financial Key Performance Indicators After RPA Guidelines PDF is highly customizable and very easy to edit, covering many different styles from creative to business presentations. Slidegeeks has creative team members who have crafted amazing templates. So, go and get them without any delay.
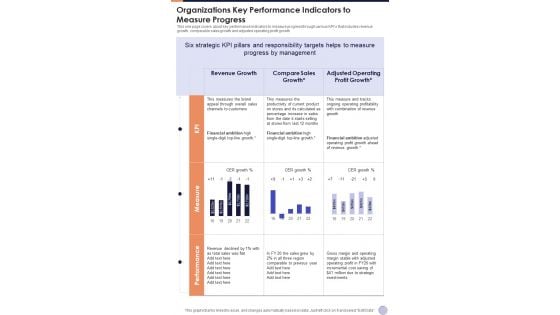
Organizations Key Performance Indicators To Measure Progress One Pager Documents
This one page covers about key performance indicators to measure progress through various KPIs that includes revenue growth, comparable sales growth and adjusted operating profit growth. Presenting you a fantastic Organizations Key Performance Indicators To Measure Progress One Pager Documents. This piece is crafted on hours of research and professional design efforts to ensure you have the best resource. It is completely editable and its design allow you to rehash its elements to suit your needs. Get this Organizations Key Performance Indicators To Measure Progress One Pager Documents A4 One-pager now.

Financial Metrics Of Commercial Vehicles Luxury Automobile Vehicles PPT Slide CP SS V
This slide showcases the financial metrics of commercial vehicles. It includes metrics such as sales volume in units, revenue in crores, domestic market share and EBITDA percent and Y-O-Y growth. Make sure to capture your audiences attention in your business displays with our gratis customizable Financial Metrics Of Commercial Vehicles Luxury Automobile Vehicles PPT Slide CP SS V. These are great for business strategies, office conferences, capital raising or task suggestions. If you desire to acquire more customers for your tech business and ensure they stay satisfied, create your own sales presentation with these plain slides. This slide showcases the financial metrics of commercial vehicles. It includes metrics such as sales volume in units, revenue in crores, domestic market share and EBITDA percent and Y-O-Y growth.
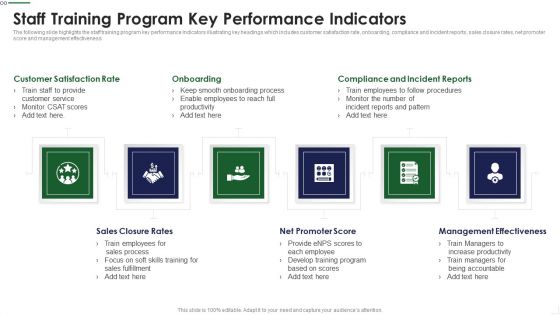
Staff Training Program Key Performance Indicators Diagrams PDF
The following slide highlights the staff training program key performance Indicators illustrating key headings which includes customer satisfaction rate, onboarding, compliance and incident reports, sales closure rates, net promoter score and management effectiveness Presenting Staff Training Program Key Performance Indicators Diagrams PDF to provide visual cues and insights. Share and navigate important information on six stages that need your due attention. This template can be used to pitch topics like Turnover Quarter, Turnover Type, Turnover Reasons In addtion, this PPT design contains high resolution images, graphics, etc, that are easily editable and available for immediate download.
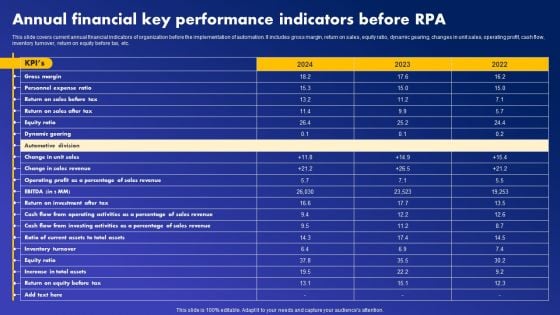
Annual Financial Key Performance Indicators Before RPA Download PDF
This slide covers current annual financial indicators of organization before the implementation of automation. It includes gross margin, return on sales, equity ratio, dynamic gearing, changes in unit sales, operating profit, cash flow, inventory turnover, return on equity before tax, etc. Slidegeeks is one of the best resources for PowerPoint templates. You can download easily and regulate Annual Financial Key Performance Indicators Before RPA Download PDF for your personal presentations from our wonderful collection. A few clicks is all it takes to discover and get the most relevant and appropriate templates. Use our Templates to add a unique zing and appeal to your presentation and meetings. All the slides are easy to edit and you can use them even for advertisement purposes.
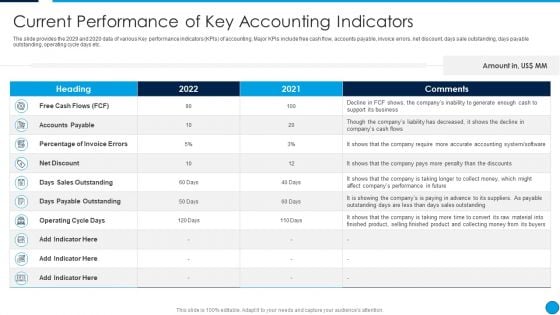
Summary Financial Current Performance Of Key Accounting Indicators Template PDF
The slide provides the 2029 and 2020 data of various Key performance indicators KPIs of accounting. Major KPIs include free cash flow, accounts payable, invoice errors, net discount, days sale outstanding, days payable outstanding, operating cycle days etc. Deliver an awe inspiring pitch with this creative Summary Financial Current Performance Of Key Accounting Indicators Template PDF bundle. Topics like Free Cash Flows, Accounts Payable, Percentage Of Invoice Errors, Net Discount can be discussed with this completely editable template. It is available for immediate download depending on the needs and requirements of the user.
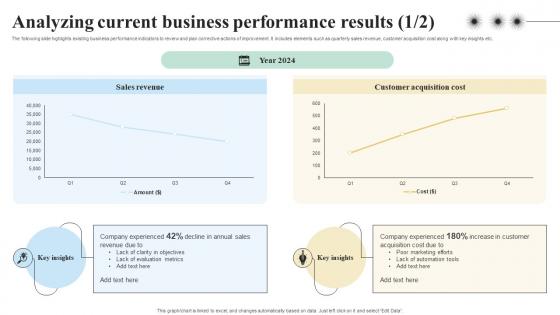
Analyzing Current Business Performance Results Objectives And Key Result Methodology For Business
The following slide highlights existing business performance indicators to review and plan corrective actions of improvement. It includes elements such as quarterly sales revenue, customer acquisition cost along with key insights etc. Slidegeeks is one of the best resources for PowerPoint templates. You can download easily and regulate Analyzing Current Business Performance Results Objectives And Key Result Methodology For Business for your personal presentations from our wonderful collection. A few clicks is all it takes to discover and get the most relevant and appropriate templates. Use our Templates to add a unique zing and appeal to your presentation and meetings. All the slides are easy to edit and you can use them even for advertisement purposes. The following slide highlights existing business performance indicators to review and plan corrective actions of improvement. It includes elements such as quarterly sales revenue, customer acquisition cost along with key insights etc.

House For Sale Symbol PowerPoint Templates And PowerPoint Themes 0812
House For Sale Symbol PowerPoint Templates And PowerPoint Themes 0812-Microsoft Powerpoint Templates and Background with house for sale Procure contracts with our House For Sale Symbol PowerPoint Templates And PowerPoint Themes 0812. Download without worries with our money back guaranteee.
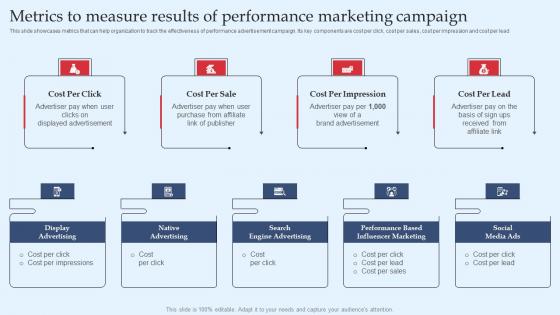
Strategic Performance Marketing Campaign Metrics To Measure Results Of Performance Themes Pdf
This slide showcases metrics that can help organization to track the effectiveness of performance advertisement campaign. Its key components are cost per click, cost per sales, cost per impression and cost per lead. Retrieve professionally designed Strategic Performance Marketing Campaign Metrics To Measure Results Of Performance Themes Pdf to effectively convey your message and captivate your listeners. Save time by selecting pre-made slideshows that are appropriate for various topics, from business to educational purposes. These themes come in many different styles, from creative to corporate, and all of them are easily adjustable and can be edited quickly. Access them as PowerPoint templates or as Google Slides themes. You do not have to go on a hunt for the perfect presentation because Slidegeeks got you covered from everywhere. This slide showcases metrics that can help organization to track the effectiveness of performance advertisement campaign. Its key components are cost per click, cost per sales, cost per impression and cost per lead.

Pipeline Management To Evaluate Sales Pipeline Metrics To Track Deal Value Professional PDF
This slide showcases the metrics to track sales pipeline deal which includes qualified, meeting held, proposal sent, terms accepted and deal won. The Pipeline Management To Evaluate Sales Pipeline Metrics To Track Deal Value Professional PDF is a compilation of the most recent design trends as a series of slides. It is suitable for any subject or industry presentation, containing attractive visuals and photo spots for businesses to clearly express their messages. This template contains a variety of slides for the user to input data, such as structures to contrast two elements, bullet points, and slides for written information. Slidegeeks is prepared to create an impression.
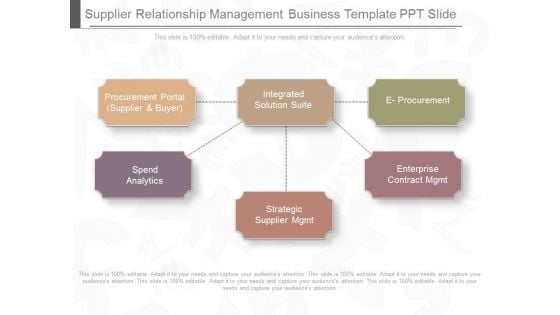
Supplier Relationship Management Business Template Ppt Slide
This is a supplier relationship management business template ppt slide. This is a six stage process. The stages in this process are procurement portal supplier and buyer, spend analytics, integrated solution suite, strategic supplier mgmt, e procurement, enterprise contract mgmt.
Supplier Relationship Management Business Template Ppt Slides
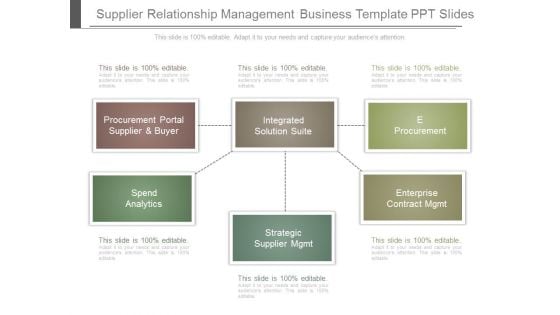
This is a supplier relationship management business template ppt slides. This is a five stage process. The stages in this process are procurement portal supplier and buyer, integrated solution suite, e procurement, spend analytics, strategic supplier mgmt, enterprise contract mgmt.
Supplier Relationship Management Sample Diagram Ppt Sample
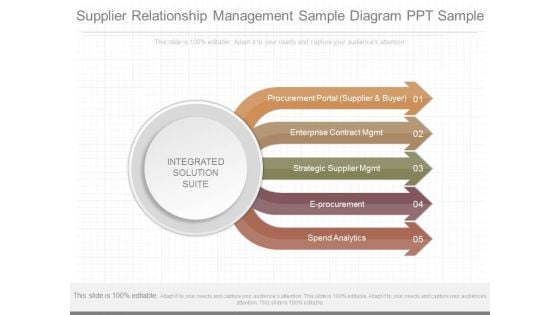
This is a supplier relationship management sample diagram ppt sample. This is a five stage process. The stages in this process are integrated solution suite, procurement portal supplier and buyer, enterprise contract mgmt, strategic supplier mgmt, e procurement, spend analytics.
Value Of Business Template Presentation Diagrams
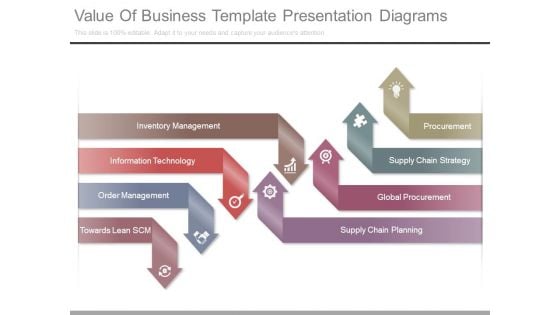
This is a value of business template presentation diagrams. This is a eight stage process. The stages in this process are inventory management, information technology, order management, towards lean scm, procurement, supply chain strategy, global procurement, supply chain planning.
Metric Dashboard Showcasing Management And Marketing Strategies For E Commerce Ideas Pdf
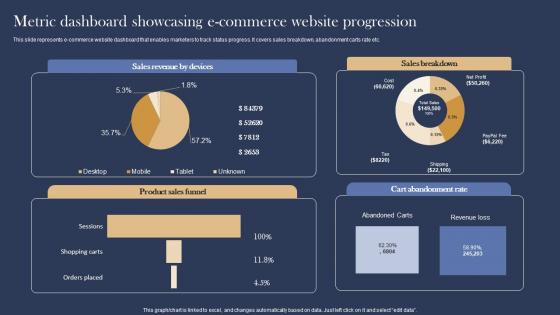
This slide represents e commerce website dashboard that enables marketers to track status progress. It covers sales breakdown, abandonment carts rate etc. Retrieve professionally designed Metric Dashboard Showcasing Management And Marketing Strategies For E Commerce Ideas Pdf to effectively convey your message and captivate your listeners. Save time by selecting pre made slideshows that are appropriate for various topics, from business to educational purposes. These themes come in many different styles, from creative to corporate, and all of them are easily adjustable and can be edited quickly. Access them as PowerPoint templates or as Google Slides themes. You do not have to go on a hunt for the perfect presentation because Slidegeeks got you covered from everywhere. This slide represents e commerce website dashboard that enables marketers to track status progress. It covers sales breakdown, abandonment carts rate etc.
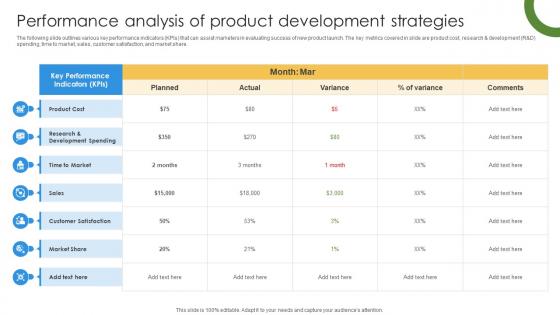
Marketing Growth Strategy To Strengthen Brand Performance Analysis Of Product Strategy SS V
The following slide outlines various key performance indicators KPIs that can assist marketers in evaluating success of new product launch. The key metrics covered in slide are product cost, research and development R and D spending, time to market, sales, customer satisfaction, and market share. If your project calls for a presentation, then Slidegeeks is your go-to partner because we have professionally designed, easy-to-edit templates that are perfect for any presentation. After downloading, you can easily edit Marketing Growth Strategy To Strengthen Brand Performance Analysis Of Product Strategy SS V and make the changes accordingly. You can rearrange slides or fill them with different images. Check out all the handy templates The following slide outlines various key performance indicators KPIs that can assist marketers in evaluating success of new product launch. The key metrics covered in slide are product cost, research and development R and D spending, time to market, sales, customer satisfaction, and market share.

Vendor Compliance Monitoring Dashboard Template PDF
Following slide shows vendor compliance monitoring dashboard. It covers KPIs namely top supplier by partner status, average procurement cycle time and average procurement cycle. Deliver an awe-inspiring pitch with this creative vendor compliance monitoring dashboard template pdf. bundle. Topics like rate of contract compliance by supplier category, procurement cycle time, procurement cycle, top suppliers by partner status can be discussed with this completely editable template. It is available for immediate download depending on the needs and requirements of the user.
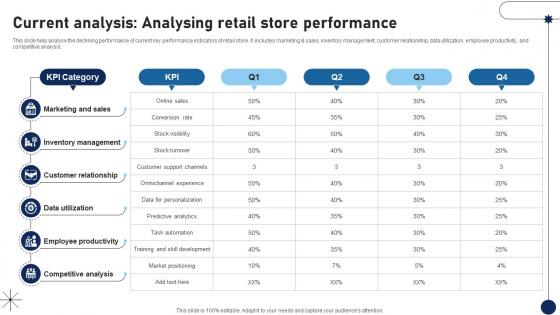
Current Analysis Analysing Retail Store Performance DT SS V
This slide help analyse the declining performance of current key performance indicators of retail store. It includes marketing and sales, inventory management, customer relationship, data utilization, employee productivity, and competitive analysis.Whether you have daily or monthly meetings, a brilliant presentation is necessary. Current Analysis Analysing Retail Store Performance DT SS V can be your best option for delivering a presentation. Represent everything in detail using Current Analysis Analysing Retail Store Performance DT SS V and make yourself stand out in meetings. The template is versatile and follows a structure that will cater to your requirements. All the templates prepared by Slidegeeks are easy to download and edit. Our research experts have taken care of the corporate themes as well. So, give it a try and see the results. This slide help analyse the declining performance of current key performance indicators of retail store. It includes marketing and sales, inventory management, customer relationship, data utilization, employee productivity, and competitive analysis.
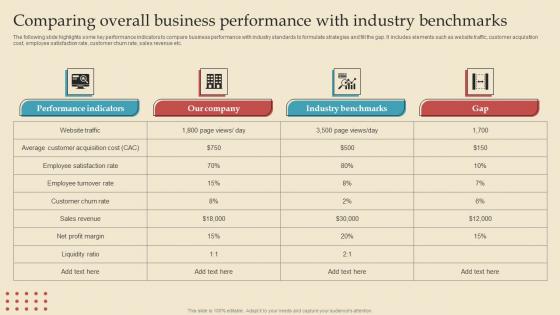
Comparing Overall Benchmarks Describing Business Performance Administration Goals Brochure Pdf
The following slide highlights some key performance indicators to compare business performance with industry standards to formulate strategies and fill the gap. It includes elements such as website traffic, customer acquisition cost, employee satisfaction rate, customer churn rate, sales revenue etc. The Comparing Overall Benchmarks Describing Business Performance Administration Goals Brochure Pdf is a compilation of the most recent design trends as a series of slides. It is suitable for any subject or industry presentation, containing attractive visuals and photo spots for businesses to clearly express their messages. This template contains a variety of slides for the user to input data, such as structures to contrast two elements, bullet points, and slides for written information. Slidegeeks is prepared to create an impression. The following slide highlights some key performance indicators to compare business performance with industry standards to formulate strategies and fill the gap. It includes elements such as website traffic, customer acquisition cost, employee satisfaction rate, customer churn rate, sales revenue etc.
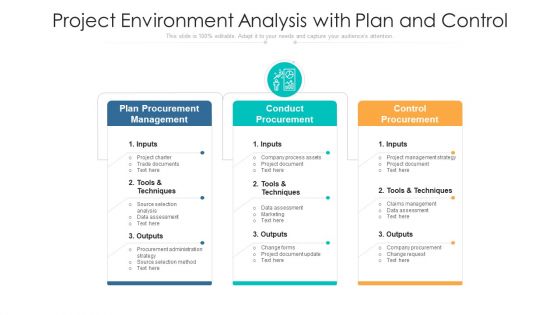
Project Environment Analysis With Plan And Control Ppt Show Brochure PDF
Showcasing this set of slides titled project environment analysis with plan and control ppt show brochure pdf. The topics addressed in these templates are plan procurement management, conduct procurement, control procurement. All the content presented in this PPT design is completely editable. Download it and make adjustments in color, background, font etc. as per your unique business setting.
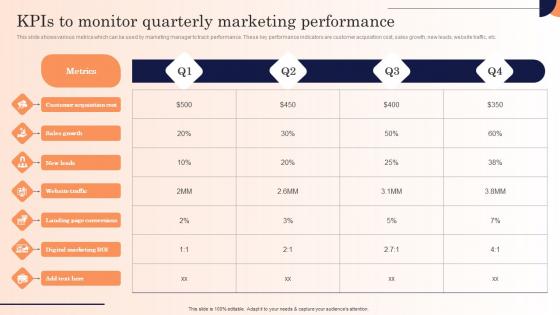
Kpis To Monitor Quarterly Marketing Performance Strategic Marketing Campaign Themes Pdf
This slide shows various metrics which can be used by marketing manager to track performance. These key performance indicators are customer acquisition cost, sales growth, new leads, website traffic, etc.Explore a selection of the finest Kpis To Monitor Quarterly Marketing Performance Strategic Marketing Campaign Themes Pdf here. With a plethora of professionally designed and pre-made slide templates, you can quickly and easily find the right one for your upcoming presentation. You can use our Kpis To Monitor Quarterly Marketing Performance Strategic Marketing Campaign Themes Pdf to effectively convey your message to a wider audience. Slidegeeks has done a lot of research before preparing these presentation templates. The content can be personalized and the slides are highly editable. Grab templates today from Slidegeeks. This slide shows various metrics which can be used by marketing manager to track performance. These key performance indicators are customer acquisition cost, sales growth, new leads, website traffic, etc.
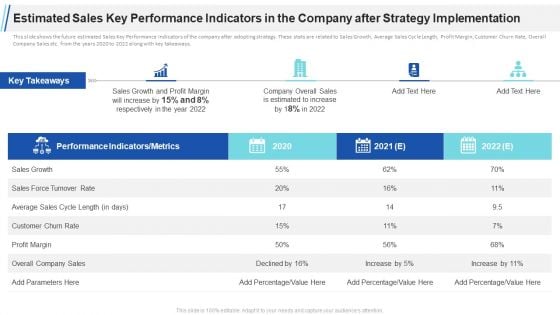
Estimated Sales Key Performance Indicators In The Company After Strategy Implementation Mockup PDF
This slide shows the future estimated Sales Key Performance Indicators of the company after adopting strategy. These stats are related to Sales Growth, Average Sales Cycle Length, Profit Margin, Customer Churn Rate, Overall Company Sales etc. from the years 2020 to 2022 along with key takeaways. Deliver an awe inspiring pitch with this creative estimated sales key performance indicators in the company after strategy implementation mockup pdf bundle. Topics like performance indicators, sales growth, profit margin, overall company sales, 2020 2022 can be discussed with this completely editable template. It is available for immediate download depending on the needs and requirements of the user.
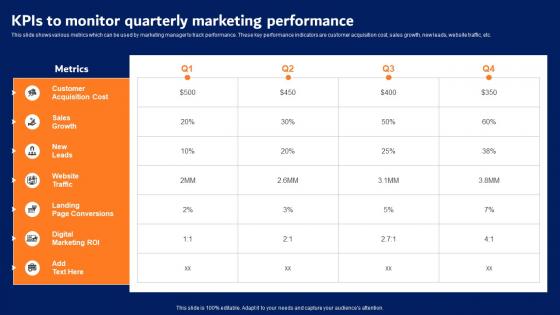
KPIs To Monitor Quarterly Marketing Performance Digital Advertising Strategies Mockup Pdf
This slide shows various metrics which can be used by marketing manager to track performance. These key performance indicators are customer acquisition cost, sales growth, new leads, website traffic, etc. Find a pre designed and impeccable KPIs To Monitor Quarterly Marketing Performance Digital Advertising Strategies Mockup Pdf. The templates can ace your presentation without additional effort. You can download these easy to edit presentation templates to make your presentation stand out from others. So, what are you waiting for Download the template from Slidegeeks today and give a unique touch to your presentation. This slide shows various metrics which can be used by marketing manager to track performance. These key performance indicators are customer acquisition cost, sales growth, new leads, website traffic, etc.
Business Sales Key Performance Indicators Report Ppt PowerPoint Presentation Icon Slideshow PDF
Showcasing this set of slides titled business sales key performance indicators report ppt powerpoint presentation icon slideshow pdf. The topics addressed in these templates are business sales key performance indicators report. All the content presented in this PPT design is completely editable. Download it and make adjustments in color, background, font etc. as per your unique business setting.
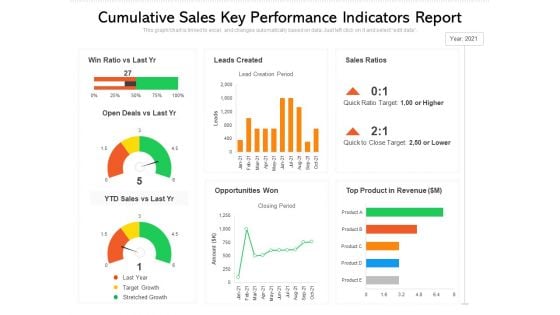
Cumulative Sales Key Performance Indicators Report Ppt PowerPoint Presentation Model Images PDF
Showcasing this set of slides titled cumulative sales key performance indicators report ppt powerpoint presentation model images pdf. The topics addressed in these templates are cumulative sales key performance indicators report. All the content presented in this PPT design is completely editable. Download it and make adjustments in color, background, font etc. as per your unique business setting.
Sales And Distribution Model Powerpoint Layout
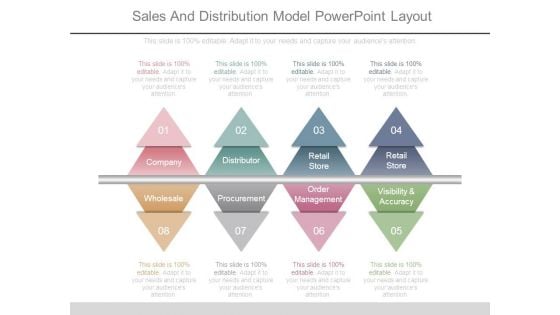
This is a sales and distribution model powerpoint layout. This is a eight stage process. The stages in this process are company, distributor, retail store, wholesale, procurement, order management, visibility and accuracy.
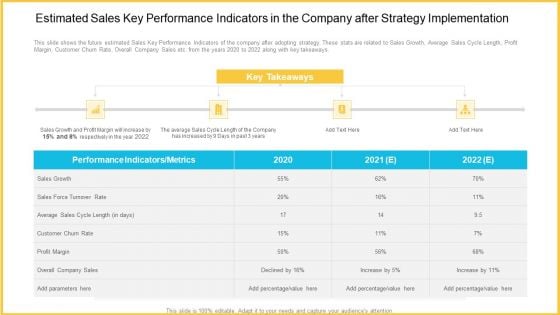
Estimated Sales Key Performance Indicators In The Company After Strategy Implementation Diagrams PDF
This slide shows the future estimated Sales Key Performance Indicators of the company after adopting strategy. These stats are related to Sales Growth, Average Sales Cycle Length, Profit Margin, Customer Churn Rate, Overall Company Sales etc. from the years 2020 to 2022 along with key takeaways. Deliver an awe-inspiring pitch with this creative estimated sales key performance indicators in the company after strategy implementation diagrams pdf. bundle. Topics like sales growth, sales force turnover rate, customer churn rate, profit margin, overall company sales can be discussed with this completely editable template. It is available for immediate download depending on the needs and requirements of the user.
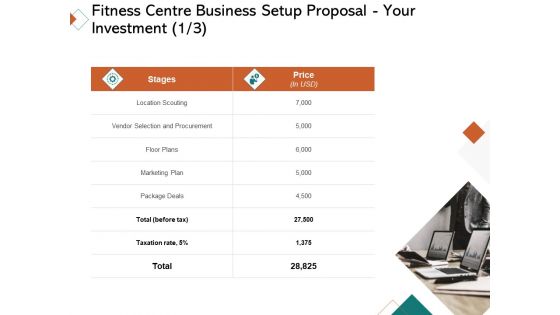
Fitness Centre Business Setup Proposal Your Investment Deals Ppt Gallery Smartart PDF
Presenting fitness centre business setup proposal your investment deals ppt gallery smartart pdf to provide visual cues and insights. Share and navigate important information on two stages that need your due attention. This template can be used to pitch topics like location scouting, vendor selection and procurement, floor plans, marketing plan, package deals. In addtion, this PPT design contains high resolution images, graphics, etc, that are easily editable and available for immediate download.
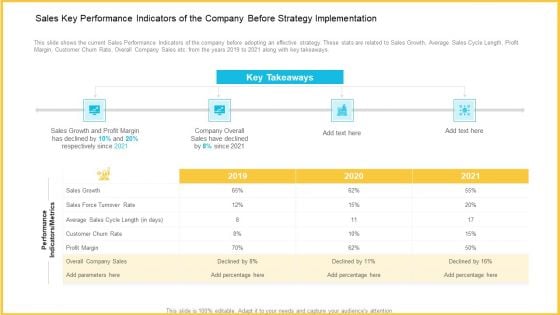
Sales Key Performance Indicators Of The Company Before Strategy Implementation Inspiration PDF
This slide shows the current Sales Performance Indicators of the company before adopting an effective strategy. These stats are related to Sales Growth, Average Sales Cycle Length, Profit Margin, Customer Churn Rate, Overall Company Sales etc. from the years 2019 to 2021 along with key takeaways. Deliver an awe-inspiring pitch with this creative sales key performance indicators of the company before strategy implementation inspiration pdf. bundle. Topics like sales growth, sales force turnover rate, customer churn rate, profit margin, overall company sales can be discussed with this completely editable template. It is available for immediate download depending on the needs and requirements of the user.
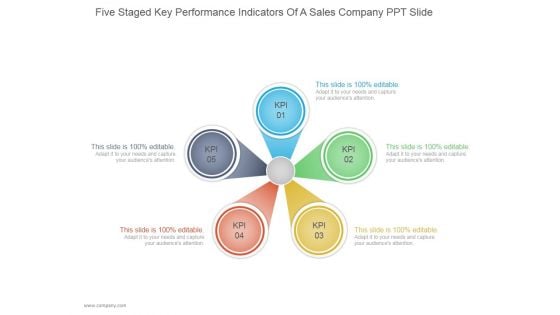
Five Staged Key Performance Indicators Of A Sales Company Ppt PowerPoint Presentation Summary
This is a five staged key performance indicators of a sales company ppt powerpoint presentation summary. This is a five stage process. The stages in this process are business, circular process, marketing, strategy, analysis.
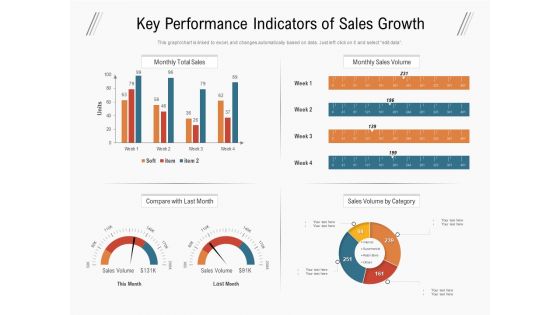
Key Performance Indicators Of Sales Growth Ppt PowerPoint Presentation Portfolio Clipart Images PDF
Presenting this set of slides with name key performance indicators of sales growth ppt powerpoint presentation portfolio clipart images pdf. The topics discussed in these slides are monthly total sales, monthly sales volume, compare with last month, sales volume by category. This is a completely editable PowerPoint presentation and is available for immediate download. Download now and impress your audience.
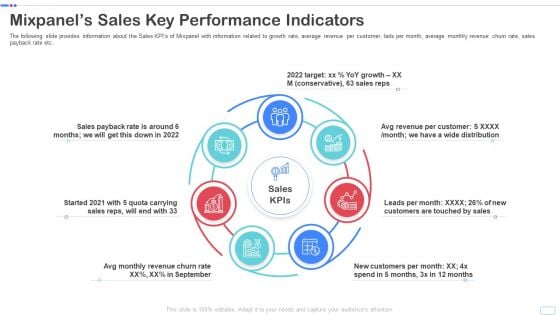
Mixpanel Capital Raising Pitch Deck Mixpanels Sales Key Performance Indicators Clipart PDF
The following slide provides information about the Sales KPIs of Mixpanel with information related to growth rate, average revenue per customer, lads per month, average monthly revenue churn rate, sales payback rate etc. This is a mixpanel capital raising pitch deck mixpanels sales key performance indicators clipart pdf template with various stages. Focus and dispense information on seven stages using this creative set, that comes with editable features. It contains large content boxes to add your information on topics like mixpanels sales key performance indicators. You can also showcase facts, figures, and other relevant content using this PPT layout. Grab it now.
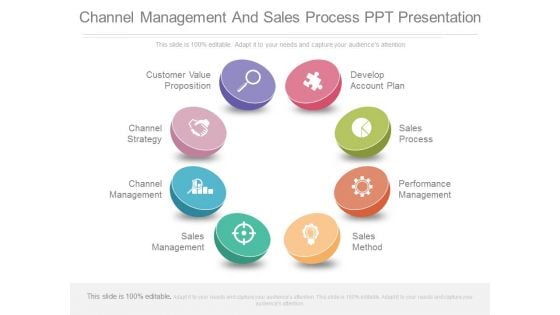
Channel Management And Sales Process Ppt Presentation
This is a channel management and sales process ppt presentation. This is a eight stage process. The stages in this process are marketing, business, process and flows.
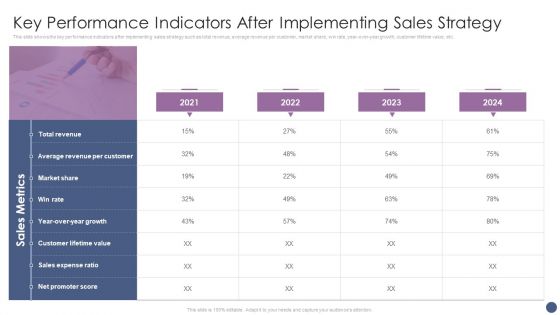
Competitive Sales Strategy Development Plan For Revenue Growth Key Performance Indicators Elements PDF
This slide shows the key performance indicators after implementing sales strategy such as total revenue, average revenue per customer, market share, win rate, year-over-year growth, customer lifetime value, etc. Presenting Competitive Sales Strategy Development Plan For Revenue Growth Key Performance Indicators Elements PDF to provide visual cues and insights. Share and navigate important information on four stages that need your due attention. This template can be used to pitch topics like Market Share, Total Revenue, Sales Expense Ratio. In addtion, this PPT design contains high resolution images, graphics, etc, that are easily editable and available for immediate download.
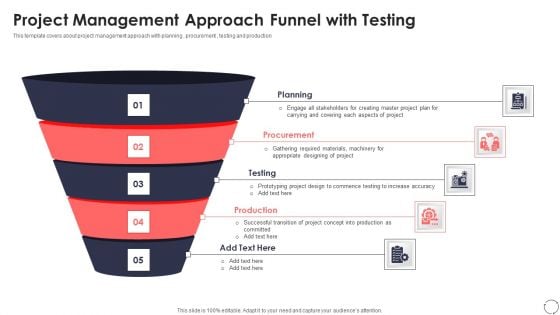
Project Management Approach Funnel With Testing Ppt PowerPoint Presentation Gallery Model PDF
This template covers about project management approach with planning , procurement , testing and production. Persuade your audience using this project management approach funnel with testing ppt powerpoint presentation gallery model pdf. This PPT design covers five stages, thus making it a great tool to use. It also caters to a variety of topics including planning, procurement, production. Download this PPT design now to present a convincing pitch that not only emphasizes the topic but also showcases your presentation skills.
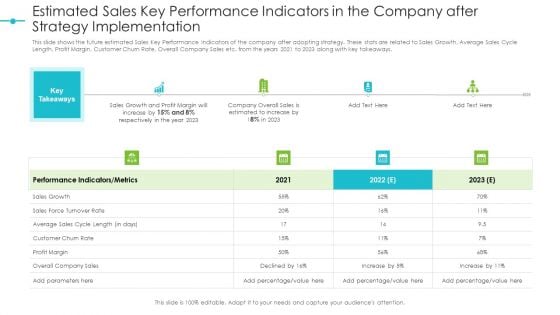
Estimated Sales Key Performance Indicators In The Company After Strategy Implementation Structure PDF
This slide shows the future estimated Sales Key Performance Indicators of the company after adopting strategy. These stats are related to Sales Growth, Average Sales Cycle Length, Profit Margin, Customer Churn Rate, Overall Company Sales etc. from the years 2021 to 2023 along with key takeaways. This is a estimated sales key performance indicators in the company after strategy implementation structure pdf template with various stages. Focus and dispense information on four stages using this creative set, that comes with editable features. It contains large content boxes to add your information on topics like performance, sales, growth, profit margin. You can also showcase facts, figures, and other relevant content using this PPT layout. Grab it now.
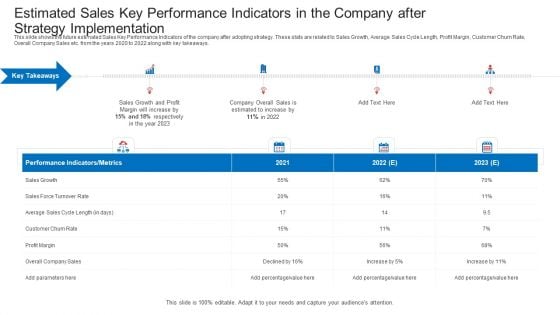
Estimated Sales Key Performance Indicators In The Company After Strategy Implementation Information PDF
This slide shows the future estimated Sales Key Performance Indicators of the company after adopting strategy. These stats are related to Sales Growth, Average Sales Cycle Length, Profit Margin, Customer Churn Rate, Overall Company Sales etc. from the years 2021 to 2023 along with key takeaways. This is a estimated sales key performance indicators in the company after strategy implementation information pdf template with various stages. Focus and dispense information on four stages using this creative set, that comes with editable features. It contains large content boxes to add your information on topics like performance, sales, growth, profit margin. You can also showcase facts, figures, and other relevant content using this PPT layout. Grab it now.
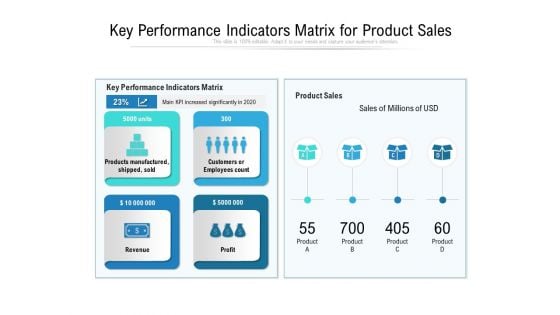
Key Performance Indicators Matrix For Product Sales Ppt PowerPoint Presentation File Clipart PDF
Presenting key performance indicators matrix for product sales ppt powerpoint presentation file clipart pdf to dispense important information. This template comprises four stages. It also presents valuable insights into the topics including manufactured, revenue, performance. This is a completely customizable PowerPoint theme that can be put to use immediately. So, download it and address the topic impactfully.
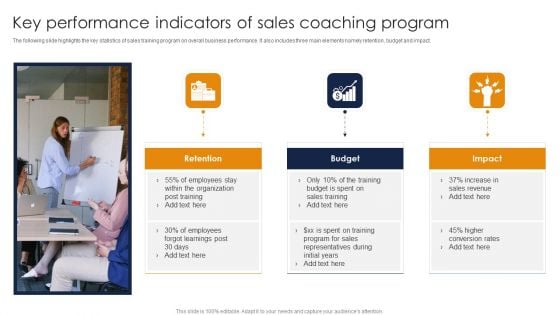
Key Performance Indicators Of Sales Coaching Program Ppt Styles Graphic Images PDF
The following slide highlights the key statistics of sales training program on overall business performance. It also includes three main elements namely retention, budget and impact. Presenting Key Performance Indicators Of Sales Coaching Program Ppt Styles Graphic Images PDF to dispense important information. This template comprises three stages. It also presents valuable insights into the topics including Retention, Budget, Impact, Employee. This is a completely customizable PowerPoint theme that can be put to use immediately. So, download it and address the topic impactfully.
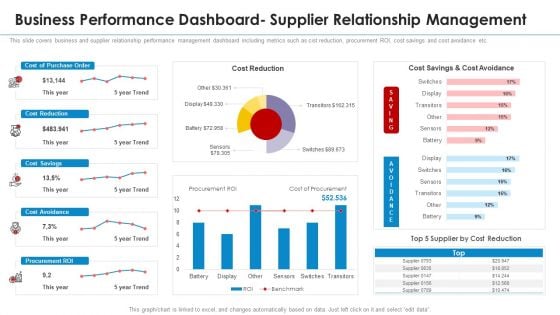
Business Performance Dashboard Supplier Relationship Management Background PDF
This slide covers business and supplier relationship performance management dashboard including metrics such as cist reduction, procurement ROI, cost savings and cost avoidance etc. Deliver an awe inspiring pitch with this creative business performance dashboard supplier relationship management background pdf bundle. Topics like business performance dashboard supplier relationship management can be discussed with this completely editable template. It is available for immediate download depending on the needs and requirements of the user.
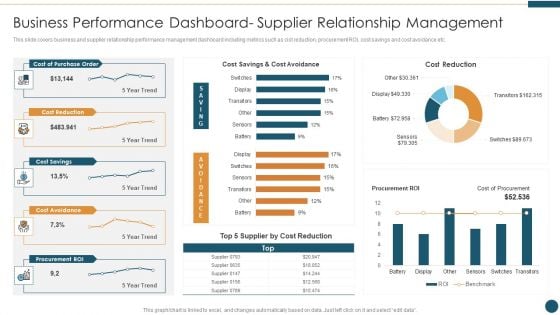
Supplier Relationship Management Business Performance Dashboard Supplier Formats PDF
This slide covers business and supplier relationship performance management dashboard including metrics such as cist reduction, procurement ROI, cost savings and cost avoidance etc. Deliver and pitch your topic in the best possible manner with this Supplier Relationship Management Business Performance Dashboard Supplier Formats PDF Use them to share invaluable insights on Business Performance Dashboard Supplier Relationship Management and impress your audience. This template can be altered and modified as per your expectations. So, grab it now.
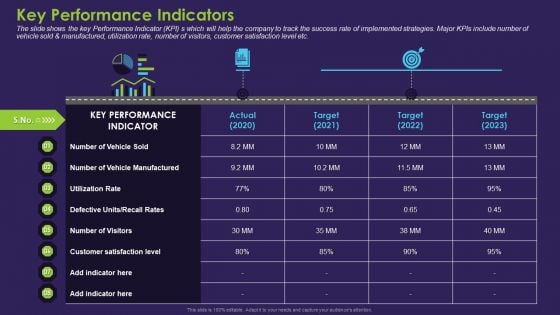
Business Case Contest Car Company Sales Deficit Key Performance Indicators Formats PDF
The slide shows the key Performance Indicator KPIs which will help the company to track the success rate of implemented strategies. Major KPIs include number of vehicle sold and manufactured, utilization rate, number of visitors, customer satisfaction level etc.Deliver an awe-inspiring pitch with this creative business case contest car company sales deficit key performance indicators formats pdf. bundle. Topics like number of vehicle sold, defective units recall rates, 2020 to 2023 can be discussed with this completely editable template. It is available for immediate download depending on the needs and requirements of the user.
Five Key Performance Indicators Of Sales Team With Icons Ppt PowerPoint Presentation Gallery Introduction PDF
Persuade your audience using this five key performance indicators of sales team with icons ppt powerpoint presentation gallery introduction pdf. This PPT design covers five stages, thus making it a great tool to use. It also caters to a variety of topics including sales, win, revenue. Download this PPT design now to present a convincing pitch that not only emphasizes the topic but also showcases your presentation skills.
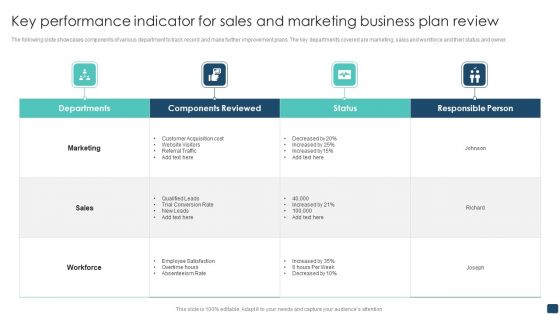
Key Performance Indicator For Sales And Marketing Business Plan Review Brochure PDF
The following slide showcases components of various department to track record and make further improvement plans. The key departments covered are marketing, sales and workforce and their status and owner. Pitch your topic with ease and precision using this Key Performance Indicator For Sales And Marketing Business Plan Review Brochure PDF. This layout presents information on Marketing, Sales, Workforce. It is also available for immediate download and adjustment. So, changes can be made in the color, design, graphics or any other component to create a unique layout.
Digital Sales Metrics Showing Enhancement Icons PDF
The following slide represents statistics of online sales key performance indicators KPIs which can assist marketing manager to review their performance and take necessary steps. It include different metrics such as add to cart rate, conversion rate, and revenue per session. Showcasing this set of slides titled Digital Sales Metrics Showing Enhancement Icons PDF. The topics addressed in these templates are Quarterly Online Sales Metrics, Targeted Right Customers, Offered Product Recommendations. All the content presented in this PPT design is completely editable. Download it and make adjustments in color, background, font etc. as per your unique business setting.
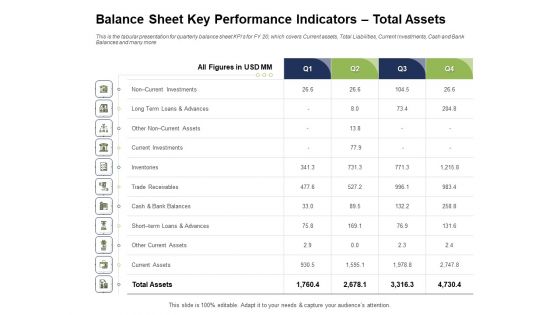
Ways To Bounce Back From Insolvency Balance Sheet Key Performance Indicators Total Assets Diagrams PDF
Presenting this set of slides with name ways to bounce back from insolvency balance sheet key performance indicators total assets diagrams pdf. The topics discussed in these slides are investments, trade receivables, current assets, inventories. This is a completely editable PowerPoint presentation and is available for immediate download. Download now and impress your audience.
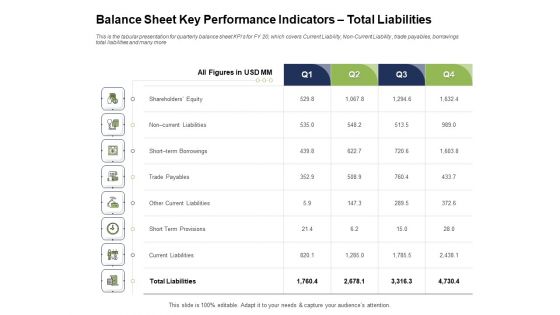
Ways To Bounce Back From Insolvency Balance Sheet Key Performance Indicators Total Liabilities Inspiration PDF
Presenting this set of slides with name ways to bounce back from insolvency balance sheet key performance indicators total liabilities inspiration pdf. The topics discussed in these slides are equity, current liabilities, term borrowings, trade payables, short term provisions. This is a completely editable PowerPoint presentation and is available for immediate download. Download now and impress your audience.
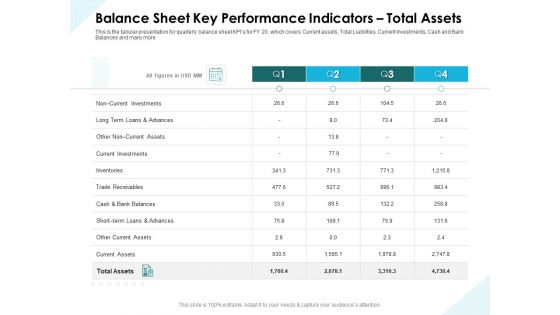
Issues Which Leads To Insolvency Balance Sheet Key Performance Indicators Total Assets Portrait PDF
Presenting this set of slides with name issues which leads to insolvency balance sheet key performance indicators total assets portrait pdf. The topics discussed in these slides are investments, trade receivables, current assets, inventories. This is a completely editable PowerPoint presentation and is available for immediate download. Download now and impress your audience.
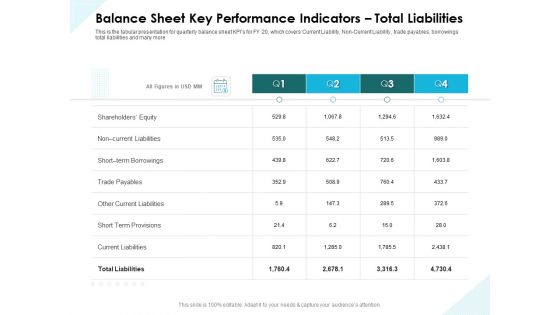
Issues Which Leads To Insolvency Balance Sheet Key Performance Indicators Total Liabilities Background PDF
Presenting this set of slides with name issues which leads to insolvency balance sheet key performance indicators total liabilities background pdf. The topics discussed in these slides are equity, current liabilities, term borrowings, trade payables, short term provisions. This is a completely editable PowerPoint presentation and is available for immediate download. Download now and impress your audience.
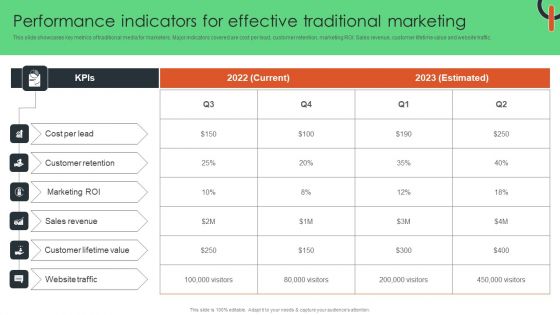
Performance Indicators For Effective Traditional Marketing Guidelines PDF
This slide showcases key metrics of traditional media for marketers. Major indicators covered are cost per lead, customer retention, marketing ROI. Sales revenue, customer lifetime value and website traffic. Create an editable Performance Indicators For Effective Traditional Marketing Guidelines PDF that communicates your idea and engages your audience. Whether you are presenting a business or an educational presentation, pre-designed presentation templates help save time. Performance Indicators For Effective Traditional Marketing Guidelines PDF is highly customizable and very easy to edit, covering many different styles from creative to business presentations. Slidegeeks has creative team members who have crafted amazing templates. So, go and get them without any delay.
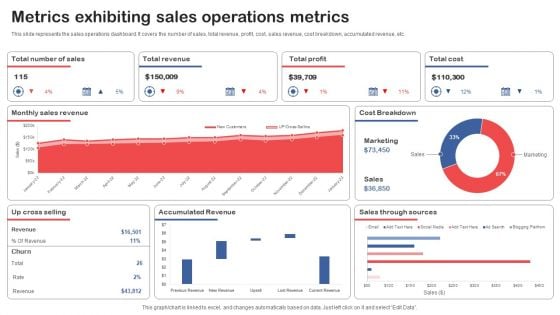
Metrics Exhibiting Sales Operations Metrics Topics PDF
This slide represents the sales operations dashboard. It covers the number of sales, total revenue, profit, cost, sales revenue, cost breakdown, accumulated revenue, etc. Showcasing this set of slides titled Metrics Exhibiting Sales Operations Metrics Topics PDF. The topics addressed in these templates are Total Revenue, Total Profit, Total Cost. All the content presented in this PPT design is completely editable. Download it and make adjustments in color, background, font etc. as per your unique business setting.
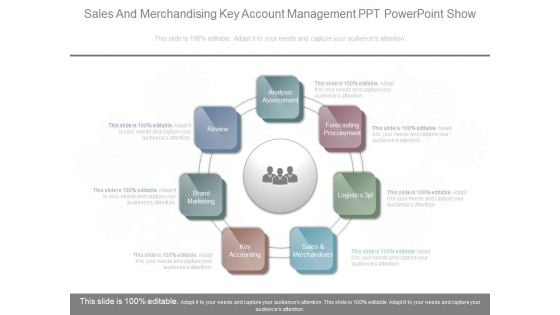
Sales And Merchandising Key Account Management Ppt Powerpoint Show
This is a sales and merchandising key account management ppt powerpoint show. This is a seven stage process. The stages in this process are analysis assessment, review, brand marketing, key accounting, forecasting procurement, logistics, sales and merchandises.
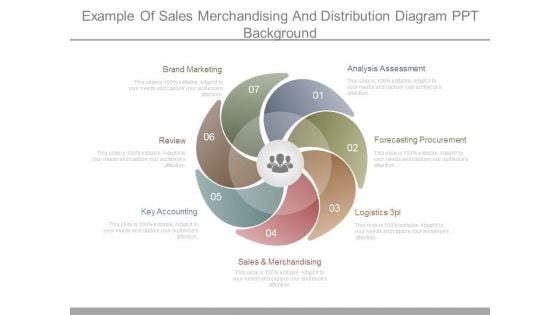
Example Of Sales Merchandising And Distribution Diagram Ppt Background
This is a example of sales merchandising and distribution diagram ppt background. This is a seven stage process. The stages in this process are brand marketing, review, key accounting, sales and merchandising, logistics 3pl, forecasting procurement, analysis assessment.
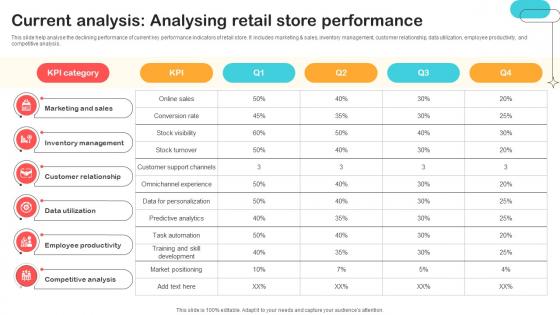
Current Analysis Analysing Retail Store Performance Optimizing Retail Operations With Digital DT SS V
This slide help analyse the declining performance of current key performance indicators of retail store. It includes marketing and sales, inventory management, customer relationship, data utilization, employee productivity, and competitive analysis.Whether you have daily or monthly meetings, a brilliant presentation is necessary. Current Analysis Analysing Retail Store Performance Optimizing Retail Operations With Digital DT SS V can be your best option for delivering a presentation. Represent everything in detail using Current Analysis Analysing Retail Store Performance Optimizing Retail Operations With Digital DT SS V and make yourself stand out in meetings. The template is versatile and follows a structure that will cater to your requirements. All the templates prepared by Slidegeeks are easy to download and edit. Our research experts have taken care of the corporate themes as well. So, give it a try and see the results. This slide help analyse the declining performance of current key performance indicators of retail store. It includes marketing and sales, inventory management, customer relationship, data utilization, employee productivity, and competitive analysis.
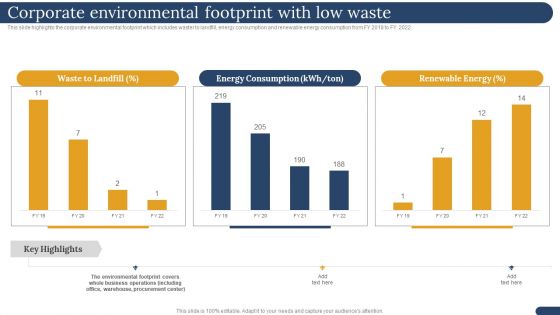
International Trading Business Export Company Corporate Environmental Footprint With Low Waste Background PDF
This slide highlights the corporate environmental footprint which includes waster to landfill, energy consumption and renewable energy consumption from FY 2018 to FY 2022.Deliver and pitch your topic in the best possible manner with this International Trading Business Export Company Corporate Environmental Footprint With Low Waste Background PDF. Use them to share invaluable insights on Environmental Footprint, Business Operations, Warehouse Procurement and impress your audience. This template can be altered and modified as per your expectations. So, grab it now.


 Continue with Email

 Home
Home


