Purchasing Dashboard
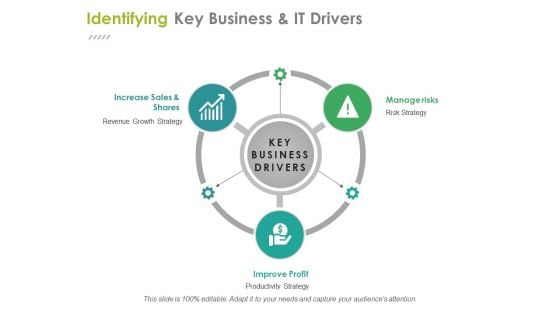
Identifying Key Business And It Drivers Ppt PowerPoint Presentation Ideas Files
This is a identifying key business and it drivers ppt powerpoint presentation ideas files. This is a three stage process. The stages in this process are increase sales and shares, improve profit, manage risks, business, management.
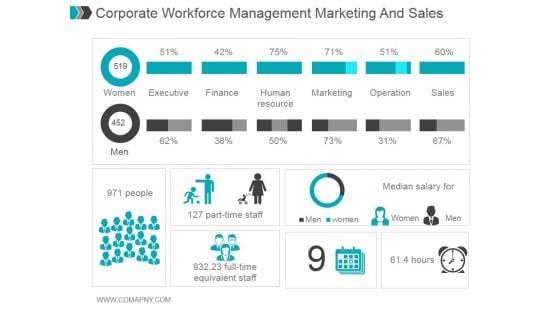
Corporate Workforce Management Marketing And Sales Ppt PowerPoint Presentation Information
This is a corporate workforce management marketing and sales ppt powerpoint presentation information. This is a two stage process. The stages in this process are women, executive, finance, human resource, marketing, operation, sales, median salary for, people, part time staff, full time equivalent staff.
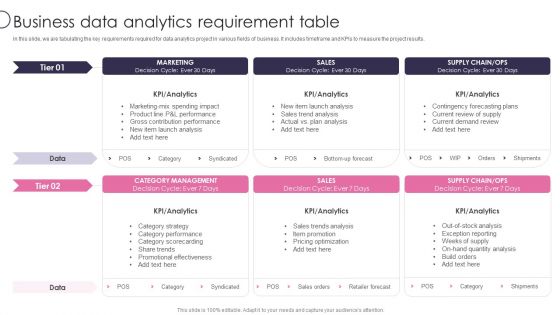
Information Transformation Process Toolkit Business Data Analytics Requirement Table Microsoft PDF
In this slide, we are tabulating the key requirements required for data analytics project in various fields of business. It includes timeframe and KPIs to measure the project results. Deliver an awe inspiring pitch with this creative Information Transformation Process Toolkit Business Data Analytics Requirement Table Microsoft PDF bundle. Topics like Marketing, Sales, Supply Chain can be discussed with this completely editable template. It is available for immediate download depending on the needs and requirements of the user.
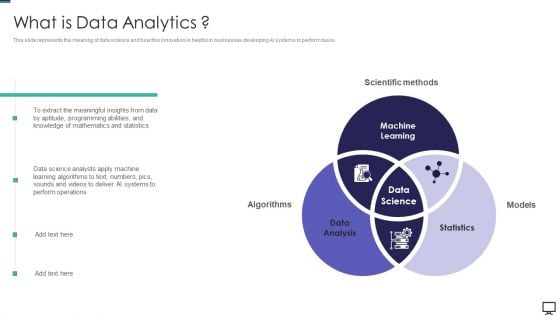
What Is Data Analytics Ppt Professional Slide PDF
This slide represents the meaning of data science and how this innovation is helpful in businesses developing AI systems to perform tasks. Presenting what is data analytics ppt professional slide pdf to provide visual cues and insights. Share and navigate important information on three stages that need your due attention. This template can be used to pitch topics like data analysis, statistics, machine learning. In addtion, this PPT design contains high resolution images, graphics, etc, that are easily editable and available for immediate download.
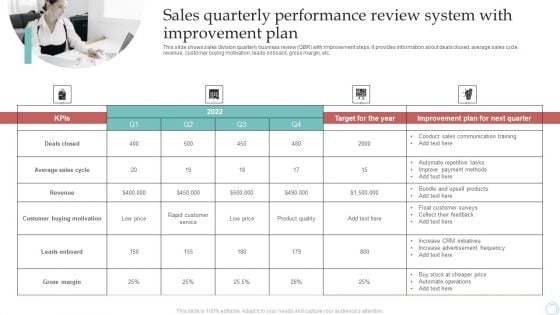
Sales Quarterly Performance Review System With Improvement Plan Infographics PDF
This slide shows sales division quarterly business review QBR with improvement steps. It provides information about deals closed, average sales cycle, revenue, customer buying motivation, leads onboard, gross margin, etc. Presenting Sales Quarterly Performance Review System With Improvement Plan Infographics PDF to dispense important information. This template comprises four stages. It also presents valuable insights into the topics including Deals Closed, Average Sales Cycle, Revenue. This is a completely customizable PowerPoint theme that can be put to use immediately. So, download it and address the topic impactfully.
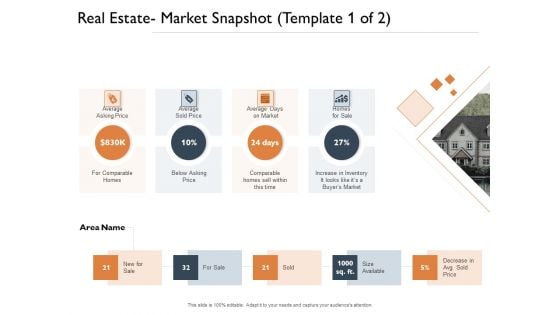
Real Estate Development Real Estate Market Snapshot Price Ppt PowerPoint Presentation Show Icon PDF
Presenting this set of slides with name real estate development real estate market snapshot price ppt powerpoint presentation show icon pdf. This is a four stage process. The stages in this process are average asking price, average sold price, average days market, homes sale, size available. This is a completely editable PowerPoint presentation and is available for immediate download. Download now and impress your audience.
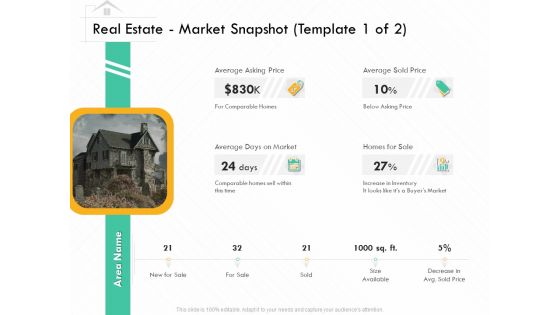
Freehold Property Business Plan Real Estate Market Snapshot Ppt PowerPoint Presentation Show Design Templates PDF
Presenting this set of slides with name freehold property business plan real estate market snapshot ppt powerpoint presentation show design templates pdf. This is a four stage process. The stages in this process are average asking price, average sold price, average days market, homes sale, size available. This is a completely editable PowerPoint presentation and is available for immediate download. Download now and impress your audience.
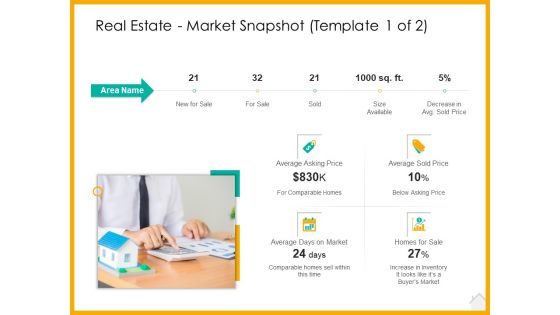
Selling Home Property Real Estate Market Snapshot Average Ppt Portfolio Good PDF
This is a selling home property real estate market snapshot average ppt portfolio good pdf template with various stages. Focus and dispense information on four stages using this creative set, that comes with editable features. It contains large content boxes to add your information on topics like price, market, sale. You can also showcase facts, figures, and other relevant content using this PPT layout. Grab it now.
Real Estate Property Management System Real Estate Market Snapshot Average Ppt Infographics Graphics Example PDF
This is a real estate property management system real estate market snapshot average ppt infographics graphics example pdf template with various stages. Focus and dispense information on four stages using this creative set, that comes with editable features. It contains large content boxes to add your information on topics like sale, market, inventory, price. You can also showcase facts, figures, and other relevant content using this PPT layout. Grab it now.
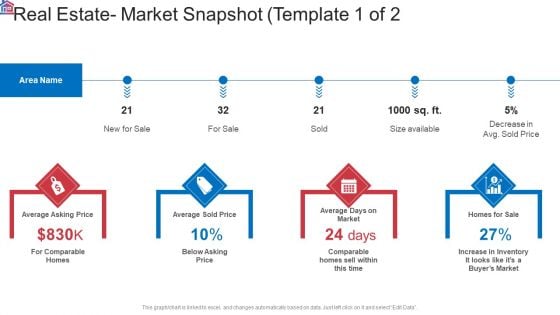
Market Research Analysis Of Housing Sector Real Estate Market Snapshot Average Ppt Outline Example File PDF
Presenting market research analysis of housing sector real estate market snapshot average ppt outline example file pdf to provide visual cues and insights. Share and navigate important information on four stages that need your due attention. This template can be used to pitch topics like sale, market, inventory, price. In addtion, this PPT design contains high resolution images, graphics, etc, that are easily editable and available for immediate download.
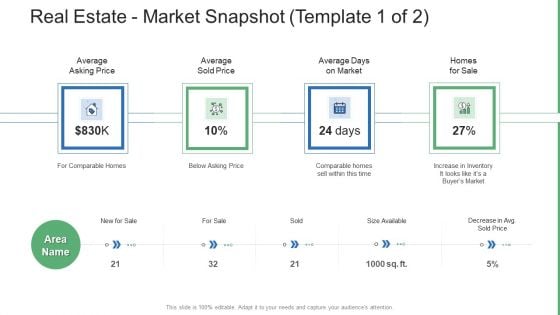
Commercial Property Administration And Advancement Real Estate Market Snapshot Average Template PDF
This is a commercial property administration and advancement real estate market snapshot average template pdf template with various stages. Focus and dispense information on four stages using this creative set, that comes with editable features. It contains large content boxes to add your information on topics like sale, market, inventory, price. You can also showcase facts, figures, and other relevant content using this PPT layout. Grab it now.
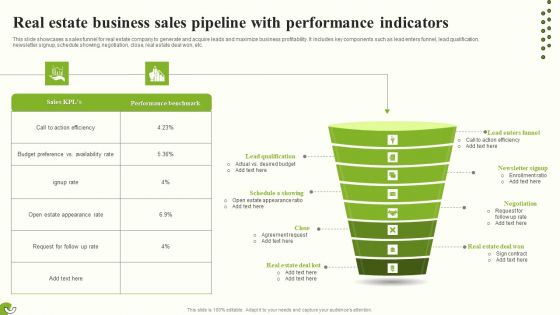
Real Estate Business Sales Pipeline With Performance Indicators Background PDF
This slide showcases a sales funnel for real estate company to generate and acquire leads and maximize business profitability. It includes key components such as lead enters funnel, lead qualification, newsletter signup, schedule showing, negotiation, close, real estate deal won, etc. Presenting Real Estate Business Sales Pipeline With Performance Indicators Background PDF to dispense important information. This template comprises eight stages. It also presents valuable insights into the topics including Budget Preference, Newsletter Signup, Real Estate Deal Won. This is a completely customizable PowerPoint theme that can be put to use immediately. So, download it and address the topic impactfully.
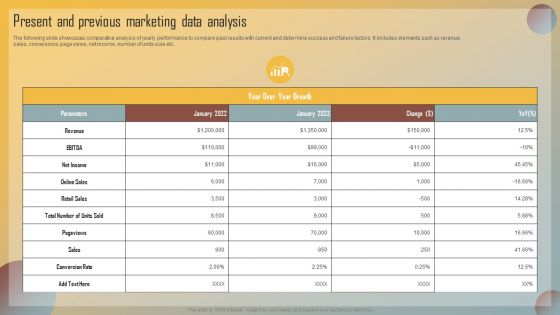
Guide For Marketing Analytics To Improve Decisions Present And Previous Marketing Data Analysis Rules PDF
The following slide showcases comparative analysis of yearly performance to compare past results with current and determine success and failure factors. It includes elements such as revenue, sales, conversions, page views, net income, number of units sole etc. Formulating a presentation can take up a lot of effort and time, so the content and message should always be the primary focus. The visuals of the PowerPoint can enhance the presenters message, so our Guide For Marketing Analytics To Improve Decisions Present And Previous Marketing Data Analysis Rules PDF was created to help save time. Instead of worrying about the design, the presenter can concentrate on the message while our designers work on creating the ideal templates for whatever situation is needed. Slidegeeks has experts for everything from amazing designs to valuable content, we have put everything into Guide For Marketing Analytics To Improve Decisions Present And Previous Marketing Data Analysis Rules PDF
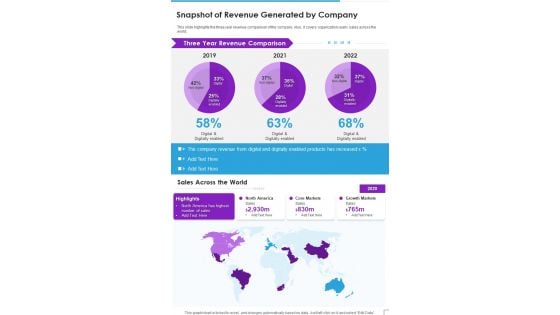
Snapshot Of Revenue Generated By Company Template 348 One Pager Documents
This slide highlights the three year revenue comparison of the company. Also, it covers organization yearly sales across the world. Presenting you a fantastic Snapshot Of Revenue Generated By Company Template 348 One Pager Documents. This piece is crafted on hours of research and professional design efforts to ensure you have the best resource. It is completely editable and its design allow you to rehash its elements to suit your needs. Get this Snapshot Of Revenue Generated By Company Template 348 One Pager Documents A4 One-pager now.
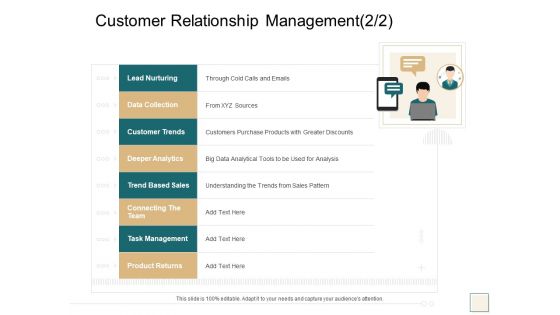
B2B Trade Management Customer Relationship Management Lead Nurturing Ideas PDF
Deliver an awe-inspiring pitch with this creative b2b trade management customer relationship management lead nurturing ideas pdf bundle. Topics like lead nurturing, data collection, customer trends, deeper analytics can be discussed with this completely editable template. It is available for immediate download depending on the needs and requirements of the user.
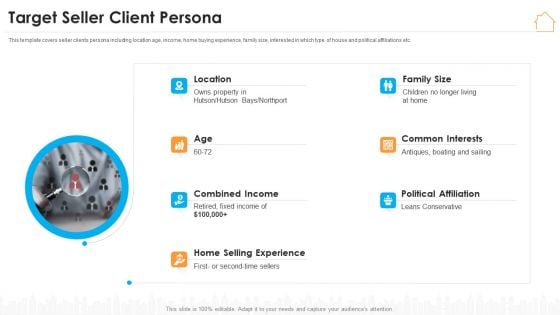
Real Estate Marketing Strategy Vendors Target Seller Client Persona Microsoft PDF
This template covers seller clients persona including location age, income, home buying experience, family size, interested in which type of house and political affiliations etc. This is a real estate marketing strategy vendors target seller client persona microsoft pdf template with various stages. Focus and dispense information on seven stages using this creative set, that comes with editable features. It contains large content boxes to add your information on topics like location, political affiliation, selling experience. You can also showcase facts, figures, and other relevant content using this PPT layout. Grab it now.
Sales Growth Report Deals And Proposals Ppt PowerPoint Presentation Icon Diagrams PDF
Persuade your audience using this sales growth report deals and proposals ppt powerpoint presentation icon diagrams pdf. This PPT design covers one stages, thus making it a great tool to use. It also caters to a variety of topics including sales growth report deals and proposals. Download this PPT design now to present a convincing pitch that not only emphasizes the topic but also showcases your presentation skills.

Analysing Business Monthly Sales Revenue Report Strategic Approaches To Corporate Financial
This slide showcases the sales revenue report in order to monitor, analyze and track monthly sales trends. Key reasons for the decline include new competitors in the market, unable to adopt new technology, and production haltered. Boost your pitch with our creative Analysing Business Monthly Sales Revenue Report Strategic Approaches To Corporate Financial. Deliver an awe-inspiring pitch that will mesmerize everyone. Using these presentation templates you will surely catch everyones attention. You can browse the ppts collection on our website. We have researchers who are experts at creating the right content for the templates. So you do not have to invest time in any additional work. Just grab the template now and use them. This slide showcases the sales revenue report in order to monitor, analyze and track monthly sales trends. Key reasons for the decline include new competitors in the market, unable to adopt new technology, and production haltered.
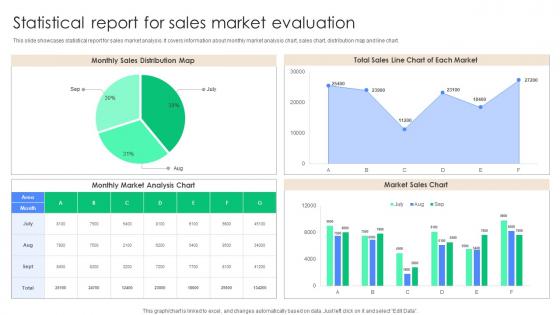
Statistical Report For Sales Market Evaluation Clipart Pdf
This slide showcases statistical report for sales market analysis. It covers information about monthly market analysis chart, sales chart, distribution map and line chart. Showcasing this set of slides titled Statistical Report For Sales Market Evaluation Clipart Pdf. The topics addressed in these templates are Monthly Market Analysis Chart, Market Sales Chart, Sales Chart Each Market. All the content presented in this PPT design is completely editable. Download it and make adjustments in color, background, font etc. as per your unique business setting. This slide showcases statistical report for sales market analysis. It covers information about monthly market analysis chart, sales chart, distribution map and line chart.
Balance Sheet Kpis Trade Payables Ppt Powerpoint Presentation Gallery Icon
This is a balance sheet kpis trade payables ppt powerpoint presentation gallery icon. This is a four stage process. The stages in this process are finance, marketing, management, investment, analysis.
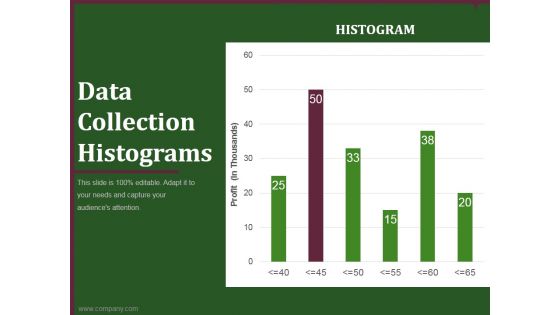
data collection histograms ppt powerpoint presentation example
This is a data collection histograms ppt powerpoint presentation example. This is a six stage process. The stages in this process are business, planning, marketing, histograms, graph.
Icon For Sales Market Evaluation Report Mockup Pdf
Showcasing this set of slides titled Icon For Sales Market Evaluation Report Mockup Pdf. The topics addressed in these templates are Icon Sales Market, Evaluation Report. All the content presented in this PPT design is completely editable. Download it and make adjustments in color, background, font etc. as per your unique business setting. Our Icon For Sales Market Evaluation Report Mockup Pdf are topically designed to provide an attractive backdrop to any subject. Use them to look like a presentation pro.
Qualifying Sales Ppt PowerPoint Presentation Professional Rules Cpb
Presenting this set of slides with name qualifying sales ppt powerpoint presentation professional rules cpb. This is an editable Powerpoint one stages graphic that deals with topics like qualifying sales to help convey your message better graphically. This product is a premium product available for immediate download and is 100 percent editable in Powerpoint. Download this now and use it in your presentations to impress your audience.
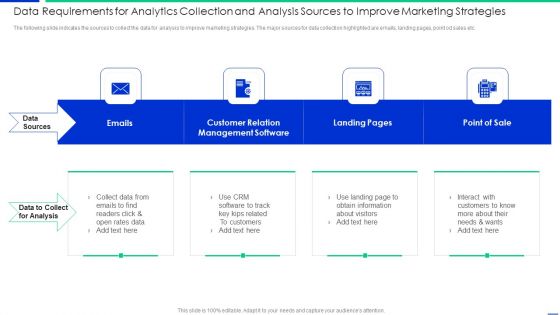
Data Requirements For Analytics Collection And Analysis Sources To Improve Marketing Strategies Download PDF
The following slide indicates the sources to collect the data for analysis to improve marketing strategies. The major sources for data collection highlighted are emails, landing pages, point od sales etc. Persuade your audience using this data requirements for analytics collection and analysis sources to improve marketing strategies download pdf. This PPT design covers four stages, thus making it a great tool to use. It also caters to a variety of topics including emails, management, customers. Download this PPT design now to present a convincing pitch that not only emphasizes the topic but also showcases your presentation skills.
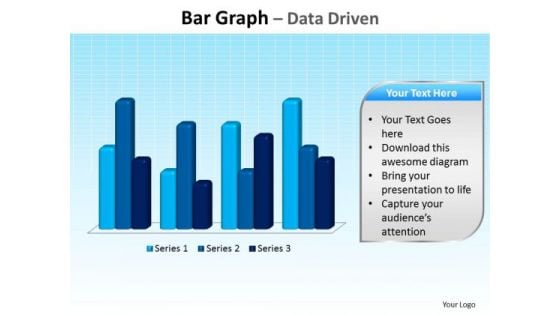
Business Education PowerPoint Templates Business Bar Graph Data Driven Ppt Slides
Business Education PowerPoint Templates Business bar graph data driven PPT Slides-This PowerPoint slide is a data driven Columns Chart. The number of columns depend on the data.-Business Editable PowerPoint Templates Business beveled column chart PPT Slides-This ppt can be used for concepts relating to-chart,, graph, growth, investment, , market, percentage, , presentation report, results, statistics, stock, success and business. Our Business Education PowerPoint Templates Business Bar Graph Data Driven Ppt Slides keep the faith alive. Belief in you will get stronger.
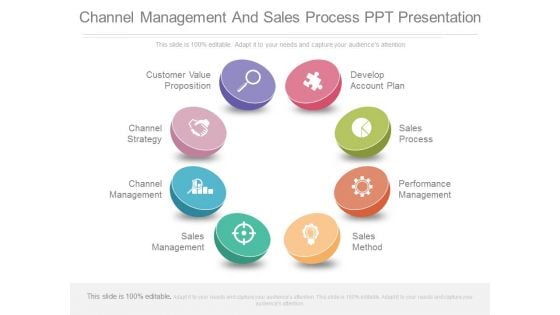
Channel Management And Sales Process Ppt Presentation
This is a channel management and sales process ppt presentation. This is a eight stage process. The stages in this process are marketing, business, process and flows.
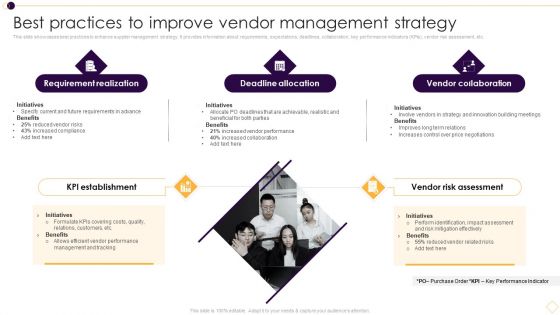
Supplier Management For Enhanced SCM And Procurement Best Practices To Improve Vendor Management Strategy Introduction PDF
This slide showcases best practices to enhance supplier management strategy. It provides information about requirements, expectations, deadlines, collaboration, key performance indicators KPIs, vendor risk assessment, etc. Deliver and pitch your topic in the best possible manner with this Supplier Management For Enhanced SCM And Procurement Best Practices To Improve Vendor Management Strategy Introduction PDF. Use them to share invaluable insights on Requirement Realization, Deadline Allocation, Vendor Collaboration and impress your audience. This template can be altered and modified as per your expectations. So, grab it now.
Magnifying Glass Ppt PowerPoint Presentation Icon
This is a magnifying glass ppt powerpoint presentation icon. This is a one stage process. The stages in this process are business, marketing, management, planning, magnifying glass.
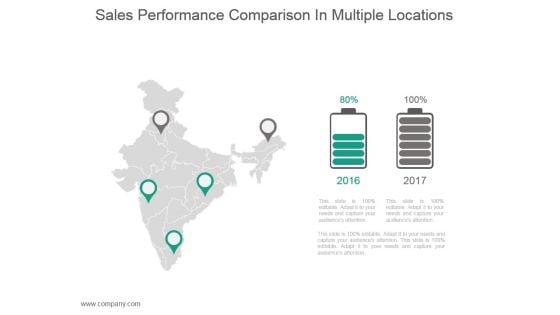
Sales Performance Comparison In Multiple Locations Ppt Slides
This is a sales performance comparison in multiple locations ppt slides. This is a two stage process. The stages in this process are business, marketing, location, finance, strategy, analysis.

Case Study Trend Analysis For Telecommunications Business Product Analytics Implementation Data Analytics V
This slide provides a case study highlighting use of trend analysis in a telecom company to improve its sales. It covers challenges faced, initiatives undertaken and outcomes on costs and sales Slidegeeks is here to make your presentations a breeze with Case Study Trend Analysis For Telecommunications Business Product Analytics Implementation Data Analytics V With our easy-to-use and customizable templates, you can focus on delivering your ideas rather than worrying about formatting. With a variety of designs to choose from, you are sure to find one that suits your needs. And with animations and unique photos, illustrations, and fonts, you can make your presentation pop. So whether you are giving a sales pitch or presenting to the board, make sure to check out Slidegeeks first This slide provides a case study highlighting use of trend analysis in a telecom company to improve its sales. It covers challenges faced, initiatives undertaken and outcomes on costs and sales
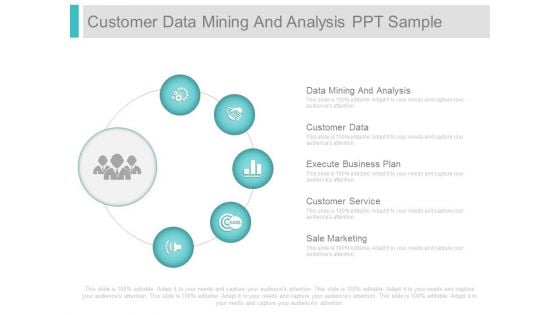
Customer Data Mining And Analysis Ppt Sample
This is a customer data mining and analysis ppt sample. This is a five stage process. The stages in this process are data mining and analysis, customer data, execute business plan, customer service, sale marketing.
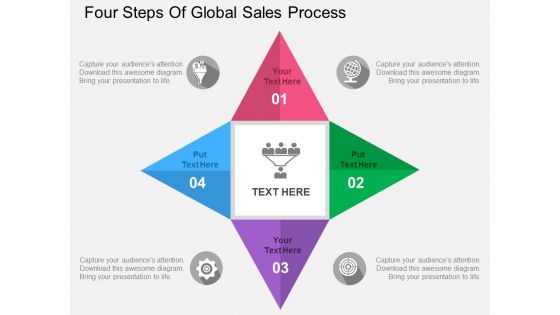
Four Steps Of Global Sales Process Powerpoint Templates
The above PPT slide contains four steps infographic layout. This PPT slide helps to portray steps of global sales process. Download this slide to make professional presentations.

Retail Outlet Opening To Enhance Product Sale Kpis To Measure The Performance Infographics PDF
The following slide showcases multiple key performance indicator which will assist the managers to evaluate the business performance of new retail store. The key metrics are sales per square foot, average transaction value, sales per employee, footfall and customer retention rate. Slidegeeks is here to make your presentations a breeze with Retail Outlet Opening To Enhance Product Sale Kpis To Measure The Performance Infographics PDF With our easy to use and customizable templates, you can focus on delivering your ideas rather than worrying about formatting. With a variety of designs to choose from, you are sure to find one that suits your needs. And with animations and unique photos, illustrations, and fonts, you can make your presentation pop. So whether you are giving a sales pitch or presenting to the board, make sure to check out Slidegeeks first.
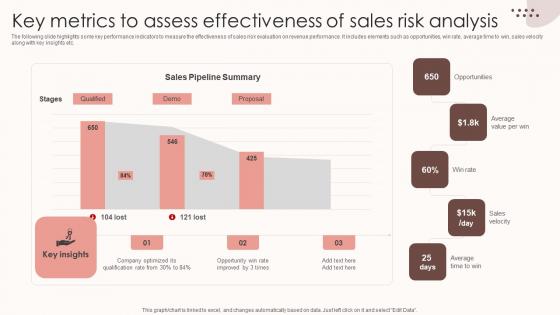
Assessing Sales Risks Key Metrics To Assess Effectiveness Of Sales Risk Analysis Diagrams PDF
The following slide highlights some key performance indicators to measure the effectiveness of sales risk evaluation on revenue performance. It includes elements such as opportunities, win rate, average time to win, sales velocity along with key insights etc. This Assessing Sales Risks Key Metrics To Assess Effectiveness Of Sales Risk Analysis Diagrams PDF is perfect for any presentation, be it in front of clients or colleagues. It is a versatile and stylish solution for organizing your meetings. The Assessing Sales Risks Key Metrics To Assess Effectiveness Of Sales Risk Analysis Diagrams PDF features a modern design for your presentation meetings. The adjustable and customizable slides provide unlimited possibilities for acing up your presentation. Slidegeeks has done all the homework before launching the product for you. So, do not wait, grab the presentation templates today The following slide highlights some key performance indicators to measure the effectiveness of sales risk evaluation on revenue performance. It includes elements such as opportunities, win rate, average time to win, sales velocity along with key insights etc.
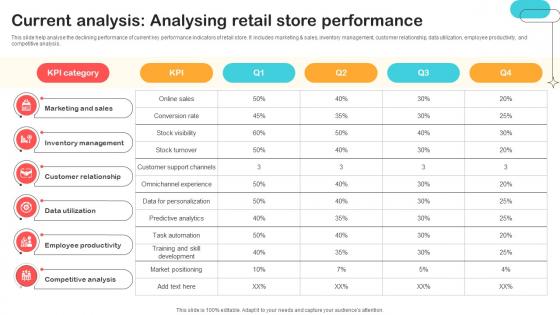
Current Analysis Analysing Retail Store Performance Optimizing Retail Operations With Digital DT SS V
This slide help analyse the declining performance of current key performance indicators of retail store. It includes marketing and sales, inventory management, customer relationship, data utilization, employee productivity, and competitive analysis.Whether you have daily or monthly meetings, a brilliant presentation is necessary. Current Analysis Analysing Retail Store Performance Optimizing Retail Operations With Digital DT SS V can be your best option for delivering a presentation. Represent everything in detail using Current Analysis Analysing Retail Store Performance Optimizing Retail Operations With Digital DT SS V and make yourself stand out in meetings. The template is versatile and follows a structure that will cater to your requirements. All the templates prepared by Slidegeeks are easy to download and edit. Our research experts have taken care of the corporate themes as well. So, give it a try and see the results. This slide help analyse the declining performance of current key performance indicators of retail store. It includes marketing and sales, inventory management, customer relationship, data utilization, employee productivity, and competitive analysis.
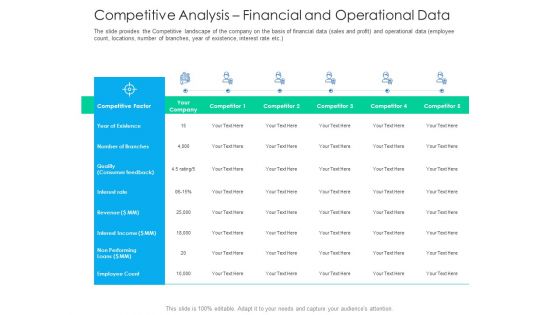
After Hours Trading Competitive Analysis Financial And Operational Data Graphics PDF
Deliver and pitch your topic in the best possible manner with this after hours trading competitive analysis financial and operational data graphics pdf. Use them to share invaluable insights on competitive factor, number of branches, interest rate and impress your audience. This template can be altered and modified as per your expectations. So, grab it now.
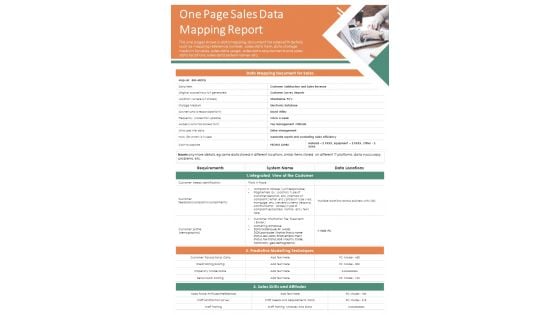
One Page Sales Data Mapping Report PDF Document PPT Template
Here an illustrative One Page Sales Data Mapping Report PDF Document PPT Template. This one-pager template is designed to match your needs. It is 100 percent editable, which allows you to make changes as you seem fit to suit your purpose. Grab this One Page Sales Data Mapping Report PDF Document PPT Template Download now.
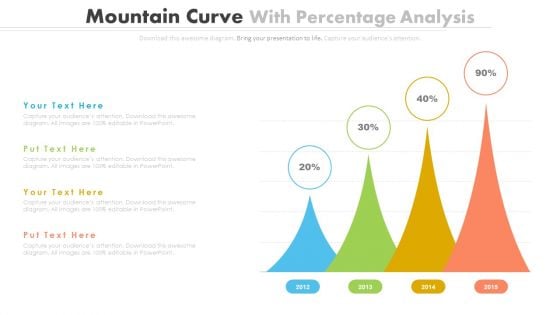
Percentage Data Growth Chart Powerpoint Slides
This PowerPoint template has been designed with percentage data growth chart. Download this PPT chart to depict financial ratio analysis. This PowerPoint slide is of great help in the business sector to make realistic presentations and provides effective way of presenting your newer thoughts.
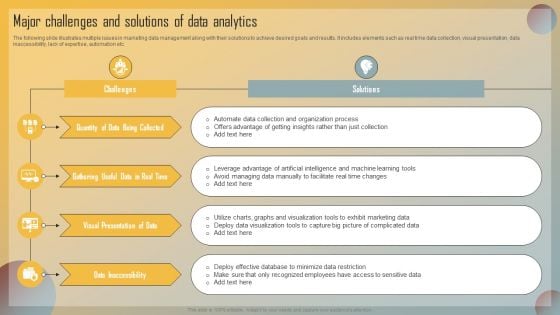
Guide For Marketing Analytics To Improve Decisions Major Challenges And Solutions Of Data Analytics Formats PDF
The following slide illustrates multiple issues in marketing data management along with their solutions to achieve desired goals and results. It includes elements such as real time data collection, visual presentation, data inaccessibility, lack of expertise, automation etc. Make sure to capture your audiences attention in your business displays with our gratis customizable Guide For Marketing Analytics To Improve Decisions Major Challenges And Solutions Of Data Analytics Formats PDF. These are great for business strategies, office conferences, capital raising or task suggestions. If you desire to acquire more customers for your tech business and ensure they stay satisfied, create your own sales presentation with these plain slides.
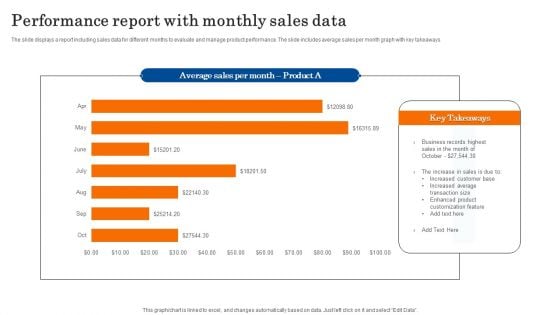
Performance Report With Monthly Sales Data Diagrams PDF
The slide displays a report including sales data for different months to evaluate and manage product performance. The slide includes average sales per month graph with key takeaways. Showcasing this set of slides titled Performance Report With Monthly Sales Data Diagrams PDF. The topics addressed in these templates are Business, Sales, Customization. All the content presented in this PPT design is completely editable. Download it and make adjustments in color, background, font etc. as per your unique business setting.
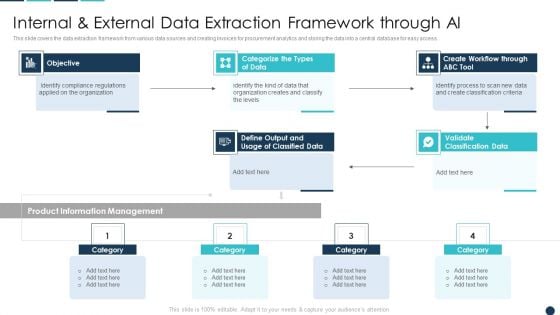
Internal And External Data Extraction Framework Through AI Guidelines PDF
This slide covers the data extraction framework from various data sources and creating invoices for procurement analytics and storing the data into a central database for easy access.Deliver an awe inspiring pitch with this creative Internal And External Data Extraction Framework Through AI Guidelines PDF bundle. Topics like Classification Data, Information Management, Compliance Regulations can be discussed with this completely editable template. It is available for immediate download depending on the needs and requirements of the user.
Business Diagram Icons And Charts For Business Growth Presentation Template
Our above slide contains graphics of business charts and icons. It helps to display business reports and analysis. Use this diagram to impart more clarity to data and to create more sound impact on viewers.

Internal And External Data Extraction Framework Through AI Download PDF
This slide covers the data extraction framework from various data sources and creating invoices for procurement analytics and storing the data into a central database for easy access.Deliver and pitch your topic in the best possible manner with this Internal And External Data Extraction Framework Through AI Download PDF. Use them to share invaluable insights on Document Normalization, Business Requirement, Business Rules and impress your audience. This template can be altered and modified as per your expectations. So, grab it now.
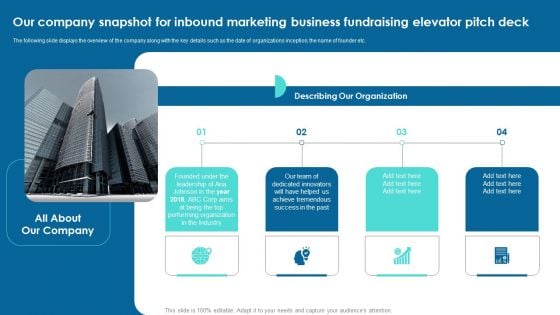
Our Company Snapshot For Inbound Marketing Business Fundraising Elevator Pitch Deck Clipart PDF
The following slide displays the overview of the company along with the key details such as the date of organizations inception, the name of founder etc. Slidegeeks is here to make your presentations a breeze with Our Company Snapshot For Inbound Marketing Business Fundraising Elevator Pitch Deck Clipart PDF With our easy-to-use and customizable templates, you can focus on delivering your ideas rather than worrying about formatting. With a variety of designs to choose from, youre sure to find one that suits your needs. And with animations and unique photos, illustrations, and fonts, you can make your presentation pop. So whether youre giving a sales pitch or presenting to the board, make sure to check out Slidegeeks first.
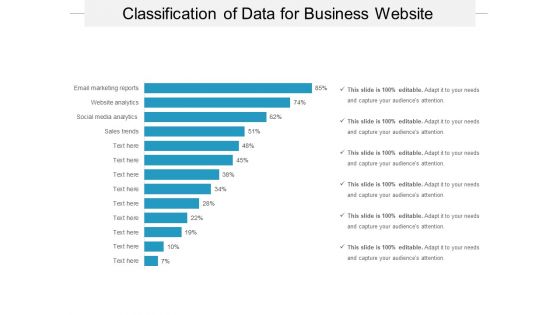
Classification Of Data For Business Website Ppt PowerPoint Presentation Styles Layout PDF
Presenting this set of slides with name classification of data for business website ppt powerpoint presentation styles layout pdf. The topics discussed in these slides are sales trends, social media analytics, website analytics, email marketing reports. This is a completely editable PowerPoint presentation and is available for immediate download. Download now and impress your audience.
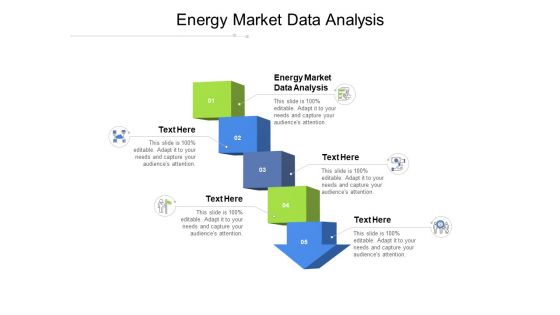
Energy Market Data Analysis Ppt PowerPoint Presentation Ideas Graphic Images Cpb Pdf
Presenting this set of slides with name energy market data analysis ppt powerpoint presentation ideas graphic images cpb pdf. This is an editable Powerpoint five stages graphic that deals with topics like energy market data analysis to help convey your message better graphically. This product is a premium product available for immediate download and is 100 percent editable in Powerpoint. Download this now and use it in your presentations to impress your audience.

Driving Business Growth By Implementing Effective Procurement Techniques Table Of Contents Slides PDF
The Driving Business Growth By Implementing Effective Procurement Techniques Table Of Contents Slides PDF is a compilation of the most recent design trends as a series of slides. It is suitable for any subject or industry presentation, containing attractive visuals and photo spots for businesses to clearly express their messages. This template contains a variety of slides for the user to input data, such as structures to contrast two elements, bullet points, and slides for written information. Slidegeeks is prepared to create an impression.
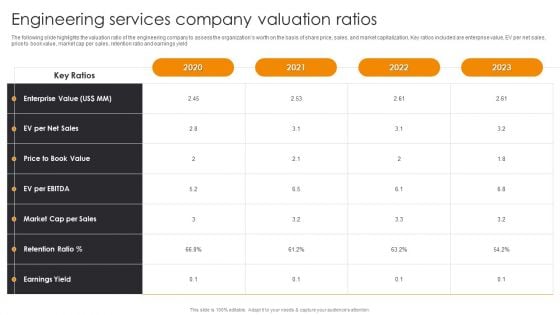
Engineering Services Company Valuation Ratios Engineering Company Financial Analysis Report Brochure PDF
The following slide highlights the valuation ratio of the engineering company to assess the organizations worth on the basis of share price, sales, and market capitalization, Key ratios included are enterprise value, EV per net sales, price to book value, market cap per sales, retention ratio and earnings yield. The Engineering Services Company Valuation Ratios Engineering Company Financial Analysis Report Brochure PDF is a compilation of the most recent design trends as a series of slides. It is suitable for any subject or industry presentation, containing attractive visuals and photo spots for businesses to clearly express their messages. This template contains a variety of slides for the user to input data, such as structures to contrast two elements, bullet points, and slides for written information. Slidegeeks is prepared to create an impression.
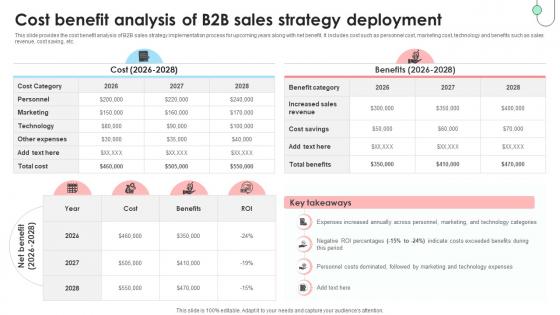
Navigating B2B Sales Cost Benefit Analysis Of B2B Sales Strategy Deployment SA SS V
This slide provides the cost benefit analysis of B2B sales strategy implementation process for upcoming years along with net benefit. It includes cost such as personnel cost, marketing cost, technology and benefits such as sales revenue, cost saving, etc. The Navigating B2B Sales Cost Benefit Analysis Of B2B Sales Strategy Deployment SA SS V is a compilation of the most recent design trends as a series of slides. It is suitable for any subject or industry presentation, containing attractive visuals and photo spots for businesses to clearly express their messages. This template contains a variety of slides for the user to input data, such as structures to contrast two elements, bullet points, and slides for written information. Slidegeeks is prepared to create an impression. This slide provides the cost benefit analysis of B2B sales strategy implementation process for upcoming years along with net benefit. It includes cost such as personnel cost, marketing cost, technology and benefits such as sales revenue, cost saving, etc.
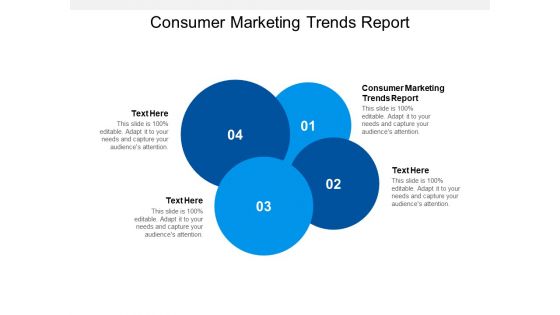
Consumer Marketing Trends Report Ppt PowerPoint Presentation Pictures Sample Cpb
Presenting this set of slides with name consumer marketing trends report ppt powerpoint presentation pictures sample cpb. This is an editable Powerpoint four stages graphic that deals with topics like consumer marketing trends report to help convey your message better graphically. This product is a premium product available for immediate download and is 100 percent editable in Powerpoint. Download this now and use it in your presentations to impress your audience.
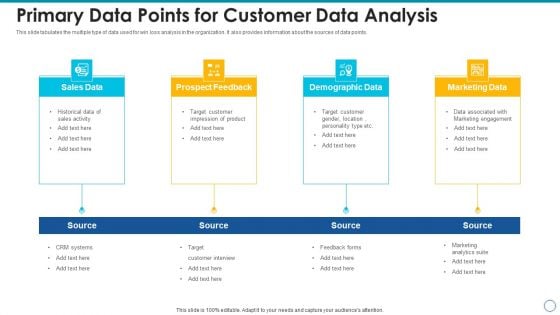
Primary Data Points For Customer Data Analysis Ideas PDF
This slide tabulates the multiple type of data used for win loss analysis in the organization. It also provides information about the sources of data points. Presenting primary data points for customer data analysis ideas pdf to dispense important information. This template comprises four stages. It also presents valuable insights into the topics including sales data, prospect feedback, demographic data, marketing data. This is a completely customizable PowerPoint theme that can be put to use immediately. So, download it and address the topic impactfully.

B2B Trade Management E Commerce Trends Ppt Gallery Display PDF
Presenting b2b trade management e commerce trends ppt gallery display pdf to provide visual cues and insights. Share and navigate important information on four stages that need your due attention. This template can be used to pitch topics like increase loyalty, growth E commerce, voice assistants, mobile E commerce. In addtion, this PPT design contains high-resolution images, graphics, etc, that are easily editable and available for immediate download.
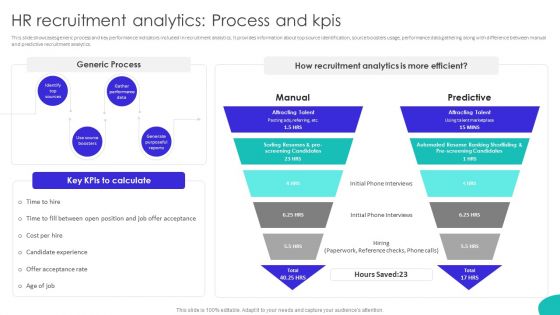
Improving Technology Based HR Recruitment Analytics Process And Kpis Designs PDF
This slide showcases generic process and key performance indicators included in recruitment analytics. It provides information about top source identification, source boosters usage, performance data gathering along with difference between manual and predictive recruitment analytics. Are you in need of a template that can accommodate all of your creative concepts This one is crafted professionally and can be altered to fit any style. Use it with Google Slides or PowerPoint. Include striking photographs, symbols, depictions, and other visuals. Fill, move around, or remove text boxes as desired. Test out color palettes and font mixtures. Edit and save your work, or work with colleagues. Download Improving Technology Based HR Recruitment Analytics Process And Kpis Designs PDF and observe how to make your presentation outstanding. Give an impeccable presentation to your group and make your presentation unforgettable.
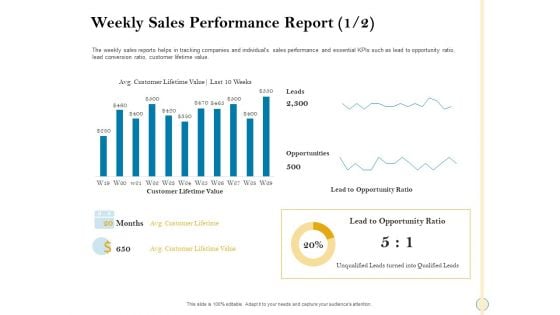
Sales Optimization Best Practices To Close More Deals Weekly Sales Performance Report Customer Clipart PDF
The weekly sales reports helps in tracking companies and individuals sales performance and essential KPIs such as lead to opportunity ratio, lead conversion ratio, customer lifetime value. Deliver and pitch your topic in the best possible manner with this sales optimization best practices to close more deals weekly sales performance report customer clipart pdf. Use them to share invaluable insights on weekly sales performance report and impress your audience. This template can be altered and modified as per your expectations. So, grab it now.
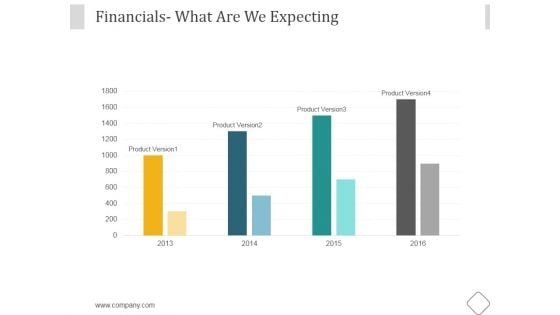
Financials Ppt PowerPoint Presentation Samples
This is a financials ppt powerpoint presentation samples. This is a four stage process. The stages in this process are business, marketing, management, financial, expecting.
Business Sales Key Performance Indicators Report Ppt PowerPoint Presentation Icon Slideshow PDF
Showcasing this set of slides titled business sales key performance indicators report ppt powerpoint presentation icon slideshow pdf. The topics addressed in these templates are business sales key performance indicators report. All the content presented in this PPT design is completely editable. Download it and make adjustments in color, background, font etc. as per your unique business setting.
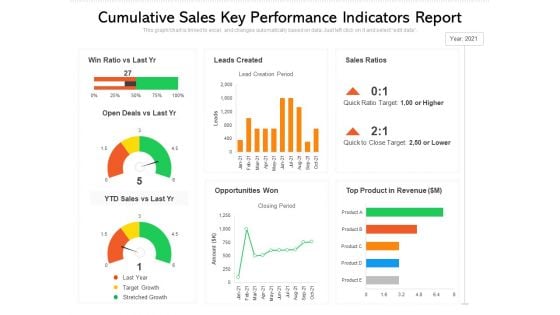
Cumulative Sales Key Performance Indicators Report Ppt PowerPoint Presentation Model Images PDF
Showcasing this set of slides titled cumulative sales key performance indicators report ppt powerpoint presentation model images pdf. The topics addressed in these templates are cumulative sales key performance indicators report. All the content presented in this PPT design is completely editable. Download it and make adjustments in color, background, font etc. as per your unique business setting.
Managing Technical And Non Various Kpis For Tracking Business Performance
Mentioned slide provide insights into various key performance indicators to determine business performance. It includes KPIs such as business financials, website traffic, customer case, customer engagement, conversion rate, customer retention, customer bounce rate, employee turnover, etc. Make sure to capture your audiences attention in your business displays with our gratis customizable Managing Technical And Non Various Kpis For Tracking Business Performance. These are great for business strategies, office conferences, capital raising or task suggestions. If you desire to acquire more customers for your tech business and ensure they stay satisfied, create your own sales presentation with these plain slides. Mentioned slide provide insights into various key performance indicators to determine business performance. It includes KPIs such as business financials, website traffic, customer case, customer engagement, conversion rate, customer retention, customer bounce rate, employee turnover, etc.
Comprehensive Guide For Website Various Kpis For Tracking Business Performance
Mentioned slide provide insights into various key performance indicators to determine business performance. It includes KPIs such as business financials, website traffic, customer case, customer engagement, conversion rate, customer retention, customer bounce rate, employee turnover, etc. Make sure to capture your audiences attention in your business displays with our gratis customizable Comprehensive Guide For Website Various Kpis For Tracking Business Performance. These are great for business strategies, office conferences, capital raising or task suggestions. If you desire to acquire more customers for your tech business and ensure they stay satisfied, create your own sales presentation with these plain slides. Mentioned slide provide insights into various key performance indicators to determine business performance. It includes KPIs such as business financials, website traffic, customer case, customer engagement, conversion rate, customer retention, customer bounce rate, employee turnover, etc.

Financial Data Analysis Sample Diagram Presentation Slide
This is a financial data analysis sample diagram presentation slide. This is a four stage process. The stages in this process are finance, sales and marketing, operations, credit and risk.


 Continue with Email

 Home
Home


