Qualitative Data
Risk Management Framework Table Icon With Umbrella Template PDF
Persuade your audience using this Risk Management Framework Table Icon With Umbrella Template PDF. This PPT design covers three stages, thus making it a great tool to use. It also caters to a variety of topics including Risk Management Framework, Table Icon, Umbrella. Download this PPT design now to present a convincing pitch that not only emphasizes the topic but also showcases your presentation skills.
Testing Framework Icon For System Automated Ppt Professional Guide PDF
Persuade your audience using this Testing Framework Icon For System Automated Ppt Professional Guide PDF. This PPT design covers three stages, thus making it a great tool to use. It also caters to a variety of topics including Testing Framework Icon, System Automated. Download this PPT design now to present a convincing pitch that not only emphasizes the topic but also showcases your presentation skills.
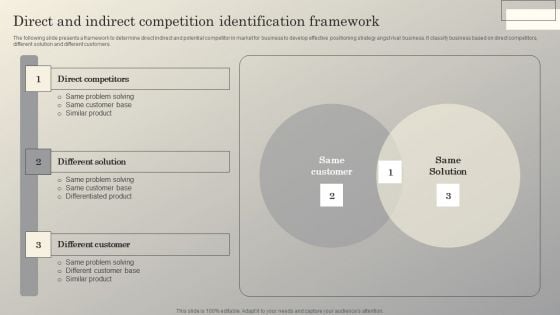
Steps To Conduct Competitor Analysis Direct And Indirect Competition Identification Microsoft PDF
The following slide presents a framework to determine direct indirect and potential competitor in market for business to develop effective positioning strategy angst rival business. It classify business based on direct competitors, different solution and different customers. Boost your pitch with our creative Steps To Conduct Competitor Analysis Direct And Indirect Competition Identification Microsoft PDF. Deliver an awe-inspiring pitch that will mesmerize everyone. Using these presentation templates you will surely catch everyones attention. You can browse the ppts collection on our website. We have researchers who are experts at creating the right content for the templates. So you do not have to invest time in any additional work. Just grab the template now and use them.
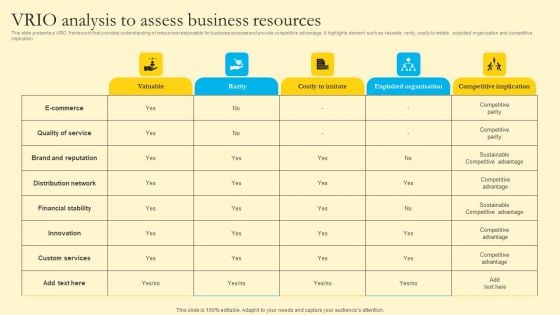
Comprehensive Guide For Sales And Advertising Processes VRIO Analysis To Assess Business Resources Formats PDF
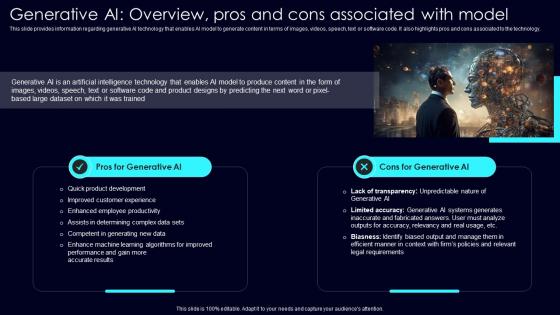
Generative AI Overview Pros Exploring Rise Of Generative AI In Artificial Intelligence Clipart Pdf
This slide provides information regarding generative AI technology that enables AI model to generate content in terms of images, videos, speech, text or software code. It also highlights pros and cons associated to the technology. This Generative AI Overview Pros Exploring Rise Of Generative AI In Artificial Intelligence Clipart Pdf from Slidegeeks makes it easy to present information on your topic with precision. It provides customization options, so you can make changes to the colors, design, graphics, or any other component to create a unique layout. It is also available for immediate download, so you can begin using it right away. Slidegeeks has done good research to ensure that you have everything you need to make your presentation stand out. Make a name out there for a brilliant performance. This slide provides information regarding generative AI technology that enables AI model to generate content in terms of images, videos, speech, text or software code. It also highlights pros and cons associated to the technology.

Swot Analysis Business PowerPoint Templates And PowerPoint Backgrounds 0811
Microsoft PowerPoint Template and Background with a set of project management buttons Redesign your organization with our Swot Analysis Business PowerPoint Templates And PowerPoint Backgrounds 0811. Download without worries with our money back guaranteee.

Graph Analysis Arrow Business PowerPoint Themes And PowerPoint Slides 0211
Microsoft PowerPoint Theme and Slide with a man analyzing a graph showing growth Help yourself win with our Graph Analysis Arrow Business PowerPoint Themes And PowerPoint Slides 0211. Make sure your presentation gets the attention it deserves.

Swot Analysis Business PowerPoint Themes And PowerPoint Slides 0811
Microsoft PowerPoint Theme and slide with a set of project management buttons Leave a good taste with our Swot Analysis Business PowerPoint Themes And PowerPoint Slides 0811. They always add to the fare.
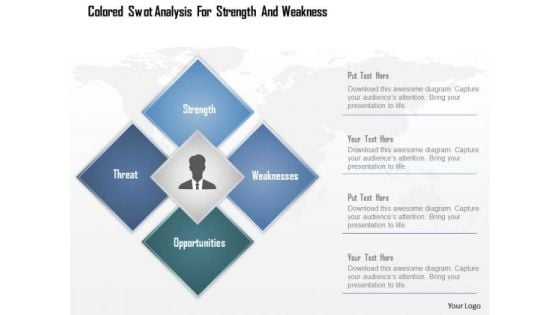
Colored Swot Analysis For Strength And Weakness PowerPoint Template
Concept of SWOT analysis has been displayed in this power point template. This PPT contains the graphic of colored square. This PPT diagram contains the weakness and strength. Use this PPT for your management and business related presentations.
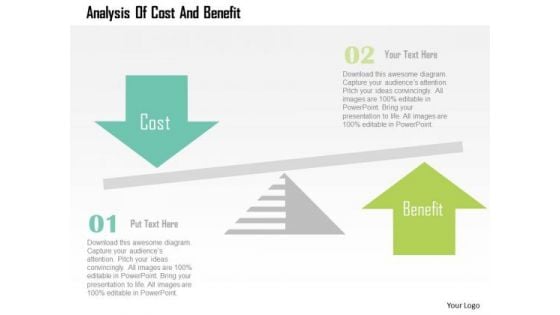
Business Diagram Analysis Of Cost And Benefit Presentation Template
This business diagram contains graphics of balancing scale with arrows of cost and benefit. You may use this diagram for analysis of cost and benefit. Communicate effectively with your group through this slide.
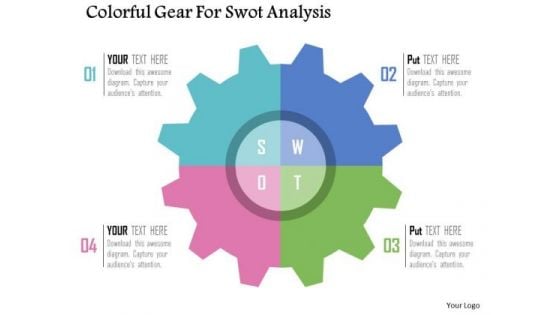
Business Diagram Colorful Gear For Swot Analysis Presentation Template
This business slide has been designed with graphics of colorful gear divided into four parts. Download this diagram to present SWOT analysis. Cement your ideas in the minds of your listeners with this slide.
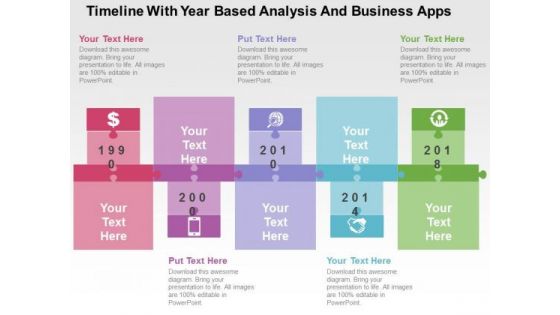
Timeline With Year Based Analysis And Business Apps PowerPoint Template
Create dynamic presentations with our professional template containing graphics of timeline with business icons. This diagram may be used to display planning and analysis. Download this template to leave permanent impression on your audience.
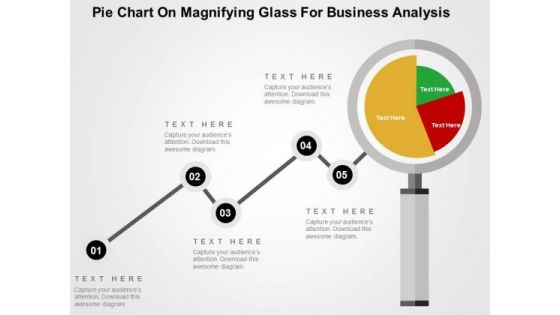
Pie Chart On Magnifying Glass For Business Analysis PowerPoint Template
Visually support your presentation with our above template showing pie chart on magnifying glass. This slide has been professionally designed to emphasize the concept of market research and analysis. Deliver amazing presentations to mesmerize your audience.
Circles With Icons For Swot Analysis PowerPoint Template
Visually support your presentation with our above template showing four circles with icons. This slide has been professionally designed to present SWOT analysis. This template offers an excellent background to build impressive presentation.
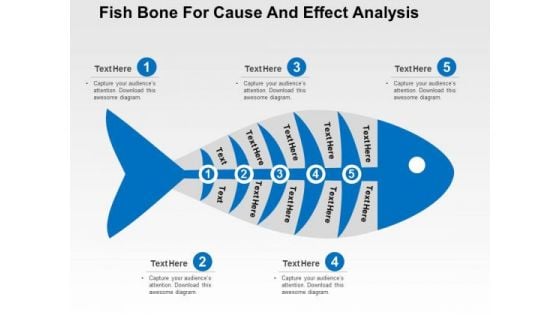
Fish Bone For Cause And Effect Analysis PowerPoint Templates
This PPT slide has been designed with graphic fish bone diagram. Download this fishbone slide to present cause and effect analysis. Accelerate the impact of your ideas using this image.
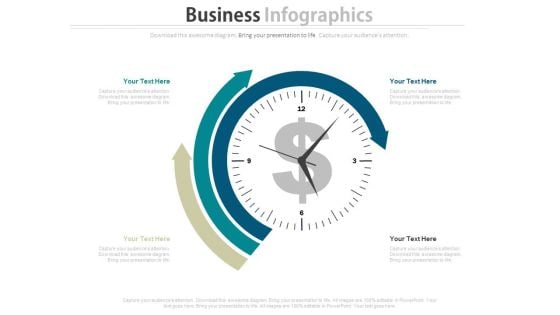
Dashboard Diagram For Finance And Strategic Analysis Powerpoint Slides
This PowerPoint template display graphics of clock with arrows around it and dollar symbol in center. You may use this PPT slide for financial and strategic analysis. This dashboard slide may useful for multilevel status report creation and approval process.
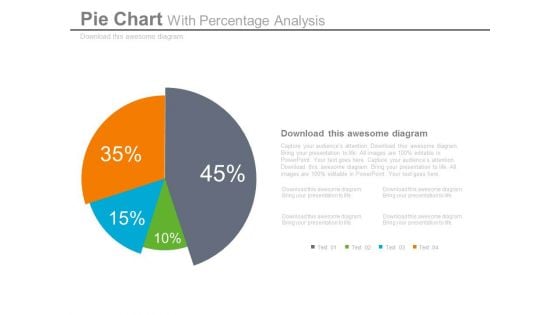
Pie Chart Dashboard Style For Percentage Analysis Powerpoint Slides
This dashboard PPT template contains graphics of pie chart. This dashboard PowerPoint template helps to display percentage analysis in a visual manner. Download this PPT slide for quick decision-making.
Pie Chart With Icons For Business Analysis Powerpoint Slides
This dashboard template contains graphics of pie chart with icons. This dashboard PowerPoint template helps to display business analysis in a visual manner. Download this template to make impressive presentations.
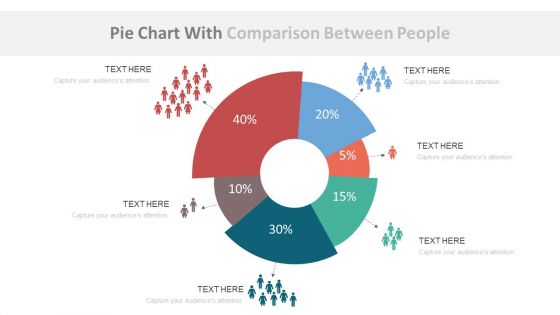
Pie Chart With Population Ratio Analysis Powerpoint Slides
This dashboard template contains graphics of pie chart with icons. This dashboard PowerPoint template helps to display population ratio analysis in a visual manner. Download this template to make impressive presentations.
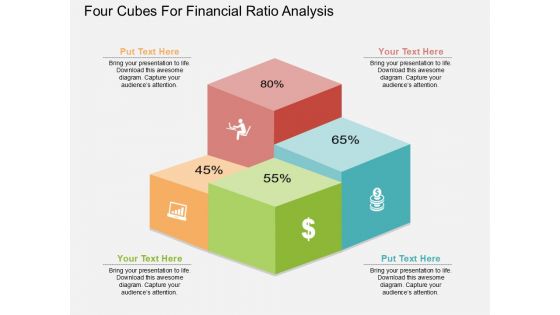
Four Cubes For Financial Ratio Analysis Powerpoint Template
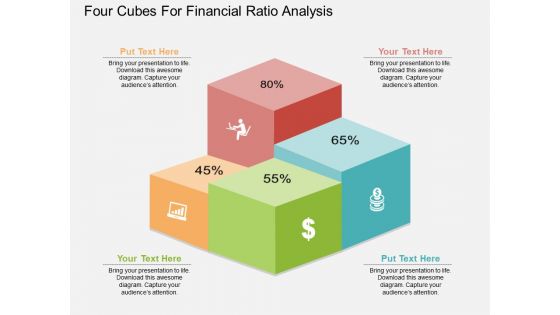
Four Cubes For Fnancial Ratio Analysis Powerpoint Template
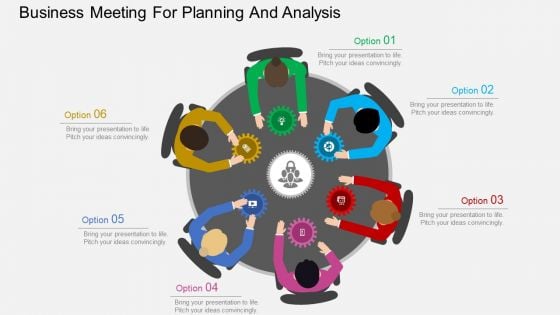
Business Meeting For Planning And Analysis Powerpoint Template
Graphic of business meeting has been used to design this power point template diagram. This PPT diagram contains the concept of business planning and analysis. Use this PPT diagram for business and marketing related presentations.
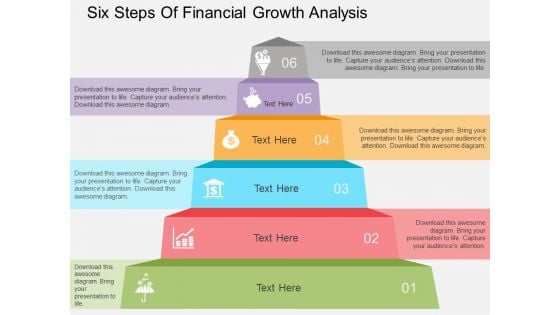
Six Steps Of Financial Growth Analysis Powerpoint Templates
Financial growth analysis can be defined with this business diagram slide. This PowerPoint template contains the graphic of six steps with business icons. Download this editable diagram slide to build unique presentations.
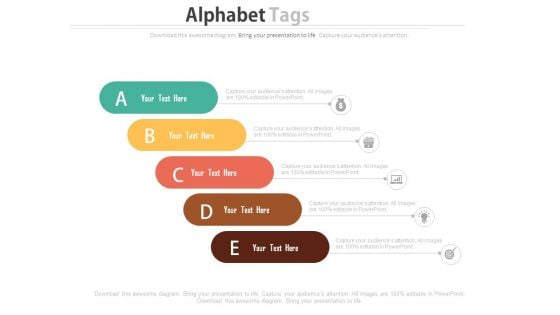
Alphabet Steps For Financial Strategy Analysis Powerpoint Slides
This PowerPoint template has been designed with alphabet steps with icons. This PPT slide may be used to display financial strategy analysis. Make outstanding business presentation with this template.
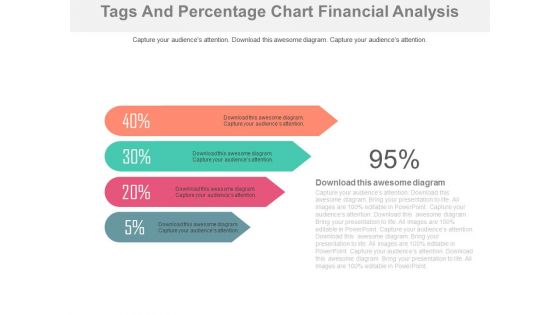
Four Percentage Tags For Financial Analysis Powerpoint Slides
This PowerPoint template contains design of four percentage tags. You may download this PPT slide to display financial analysis. You can easily customize this template to make it more unique as per your need.
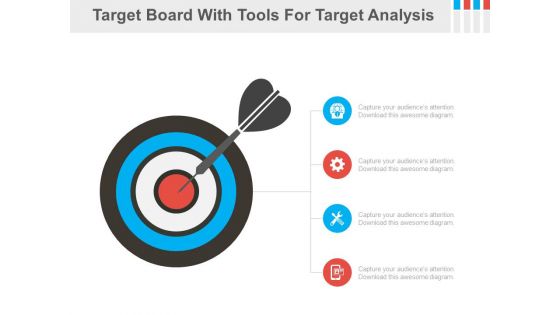
Four Tools For Marketing Target Analysis Powerpoint Slides
This PPT slide contains graphics of target board with four icons. You may download this PPT slide as tool for marketing target analysis. Impress your audiences by using this PPT slide.
Five Mountain Chart With Icons For Financial Analysis Powerpoint Slides
Our above PPT slide contains five mountains with icons and financial values. This PowerPoint template helps to exhibit financial analysis for business growth. Use this diagram to impart more clarity to subject and to create more sound impact on viewers.
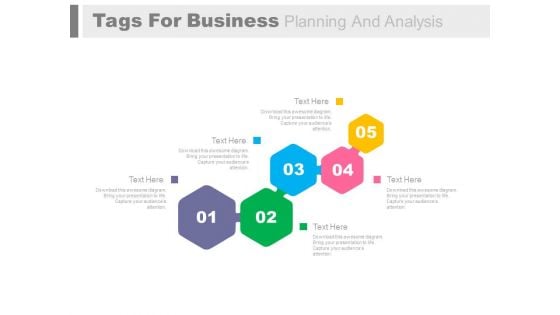
Five Steps For Business Process And Analysis Powerpoint Slides
Five steps process flow have been displayed in this business slide. This business diagram helps to exhibit business process and analysis. Use PowerPoint template to build an exclusive presentation.
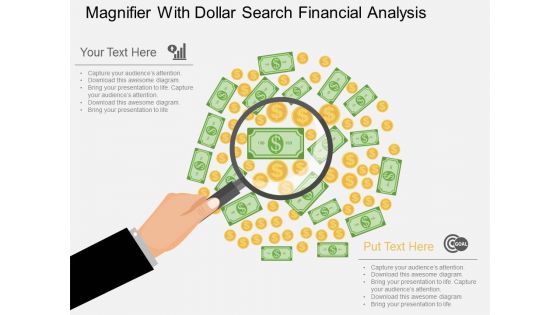
Magnifier With Dollar Search Financial Analysis Powerpoint Template
Our above business slide contains graphics of magnifier on dollar notes. This diagram can be used to display dollar search and financial analysis. Capture the attention of your audience with this professional slide.

Business Vision And Mission Strategy Analysis Powerpoint Slides
This PowerPoint template displays pictures of corporate team member. You may download this PPT slide to depict corporate vision, mission and strategy analysis. Add this slide to your presentation and impress your superiors.
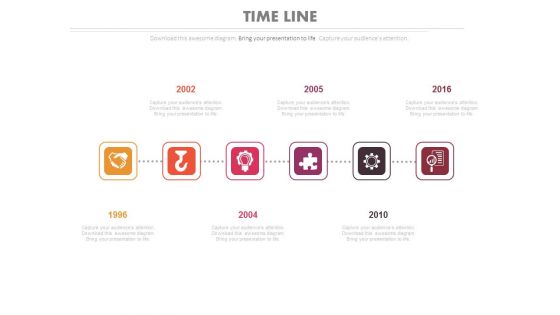
Linear Timeline Steps For Year Based Analysis Powerpoint Slides
This PowerPoint template has been designed with linear timeline steps. This PPT slide may be helpful to display year based business analysis. Download this PowerPoint timeline template to make impressive presentations.
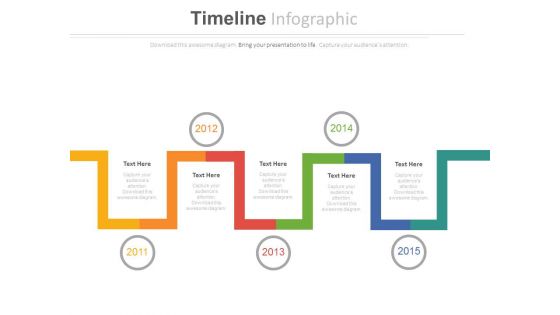
Timeline Steps For Year Based Analysis Powerpoint Slides
This PowerPoint timeline template can be used for multiple purposes including vision planning, new milestones and tasks. This PPT slide may be helpful to display timeline steps and year based analysis. Download this PowerPoint timeline template to make impressive presentations.

Three Person Tags For Management Analysis Powerpoint Slides
This PowerPoint template has been designed with three persons tags. You may use this slide to display management analysis. Make your mark with this unique slide and create an impression that will endure.
Four Steps And Icons For Business Analysis Powerpoint Template
Our above PPT slide contains four steps with icons. This PowerPoint template helps to display business strategy and analysis. Use this diagram to impart more clarity to subject and to create more sound impact on viewers.
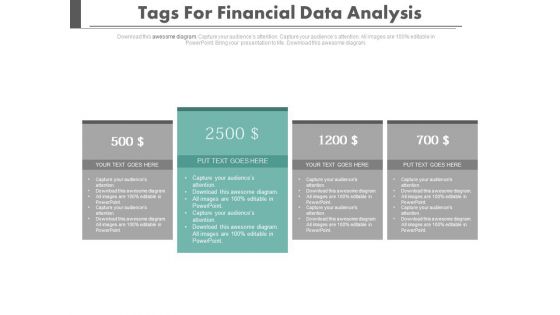
Four Tags For Financial Review And Analysis Powerpoint Slides
This PowerPoint template has been designed with four tags and financial values. This PowerPoint template helps to exhibit financial review and analysis. Use this diagram slide to build an exclusive presentation.
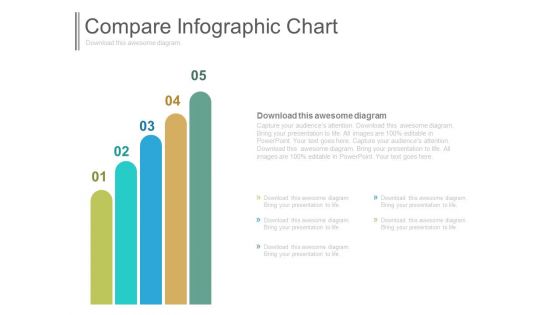
Five Bars For Marketing Research And Analysis Powerpoint Template
This business slide contains diagram of five colorful bars. This diagram provides schematic representation of marketing research and analysis. Visual effect this slide helps in maintaining the flow of the discussion and provides more clarity to the subject.
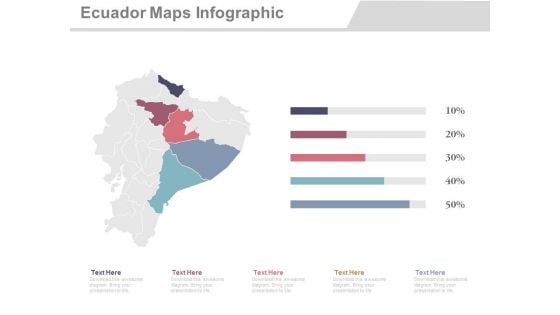
Ecuador Map With States Economic Analysis Powerpoint Slides
This PowerPoint template displays graphics of Ecuador map with different locations and percentage values. This Map template can be used in business presentations to depict economic analysis. This slide can also be used by school students for educational projects.
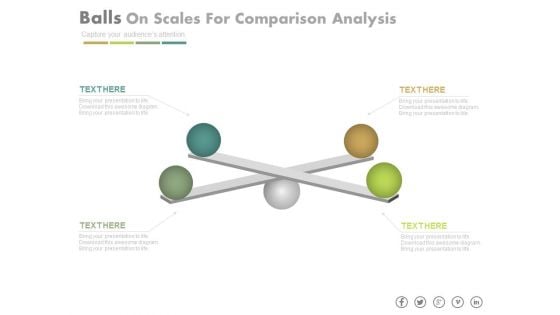
Four Balls On Scales For Comparison And Analysis Powerpoint Slides
This PowerPoint template has been designed with four balls on scales. You may download this PPT slide to depict comparison and analysis. Add this slide to your presentation and impress your superiors.
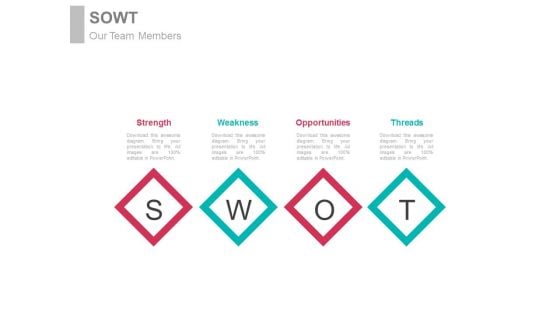
Swot Analysis Design For Management Studies Powerpoint Template
This Power Point template has been designed with SWOT analysis diagram. This PPT diagram may be used for projects in management studies. Use this PPT diagram for business and education related presentations.
Four Arrows With Icons For Business Analysis Powerpoint Slides
This professional slide contains graphics of four arrows with icons. You may use this PowerPoint template for business analysis. Add this PPT slide to your presentation and impress your superiors.
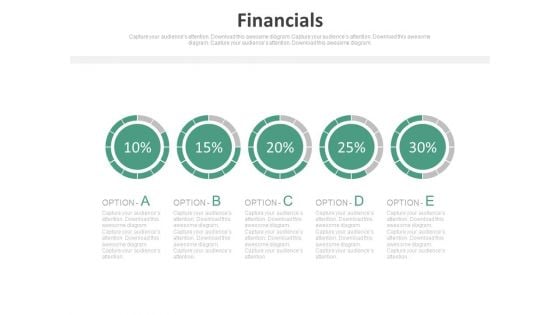
Pie Charts For Percentage Value Analysis Powerpoint Slides
Our above PPT slide displays graphics of Pie charts. This PowerPoint template may be used to display percentage value analysis. Download this template to leave permanent impression on your audience.
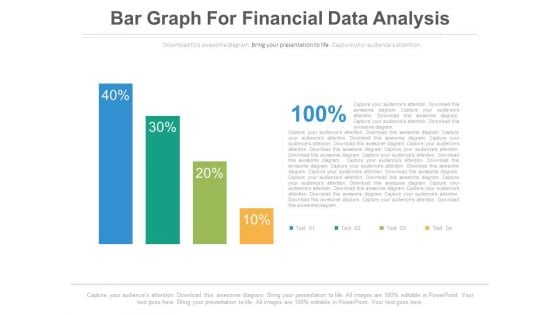
Bar Graph For Profit Growth Analysis Powerpoint Slides
This PowerPoint template has been designed with bar graph with percentage values. This diagram is useful to exhibit profit growth analysis. This diagram slide can be used to make impressive presentations.
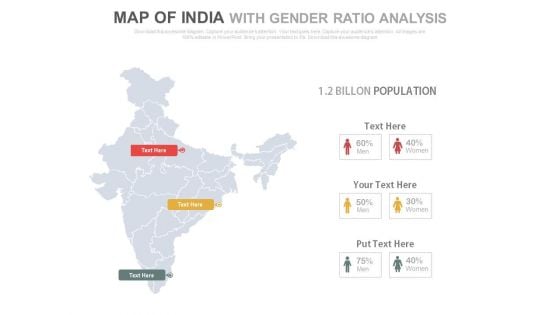
India Map Of With Gender Ratio Analysis Powerpoint Slides
This PowerPoint template displays graphics of India map with male female icons. This Map template can be used in presentations to depict gender ratio analysis. This slide can also be used by school students for educational projects.
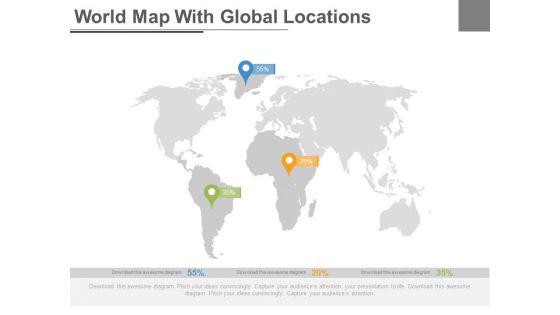
World Map With Global Economic Analysis Powerpoint Slides
This PowerPoint template has been designed with graphics of world map. You can download this diagram to exhibit global business analysis. Above PPT slide is suitable for business presentation.
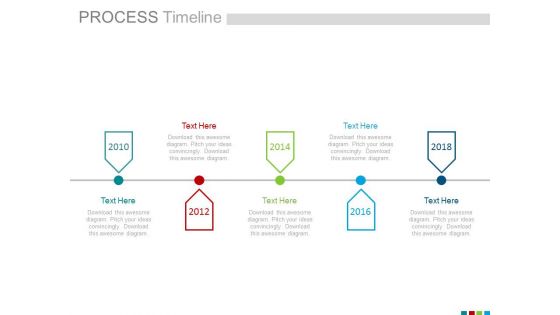
Five Year Tags Analysis Timeline Diagram Powerpoint Slides
This PowerPoint template has been designed with five years tags. This PPT slide may be helpful to display year based business analysis. Download this PowerPoint timeline template to make impressive presentations.

Three Circles With Percentage Values For Financial Analysis Powerpoint Slides
This PowerPoint template has been designed with three circles and percentage values. This PPT slide may be used to display financial analysis for business. Download this slide to build unique presentation.
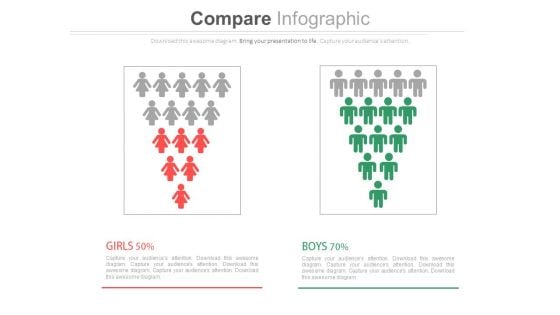
Male Female Gender Ratio Analysis Comparison Chart Powerpoint Slides
This PowerPoint template has been designed with graphics of male and female icons. Download this PPT slide to depict gender ratio analysis. Grab the attention of your team with this eye catching template.
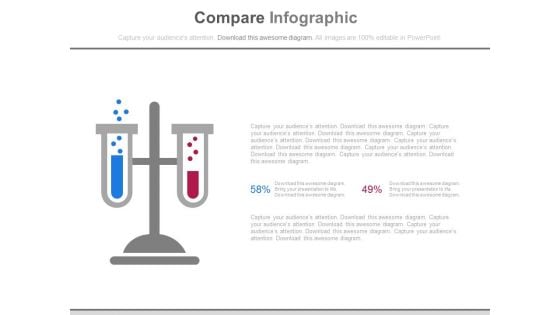
Two Test Tubes For Compare Analysis Powerpoint Slides
This PPT slide contains graphics of two test tubes. Download this PowerPoint template for comparison and analysis. Deliver amazing presentations to mesmerize your audience by using this PPT slide design.
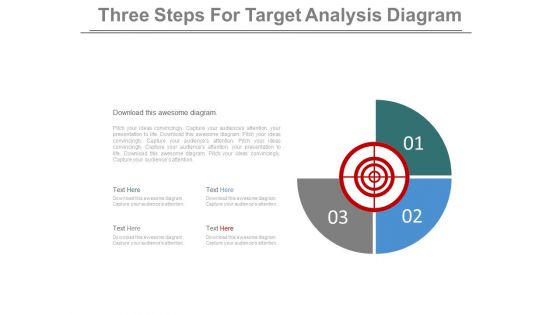
Three Steps For Target Analysis Diagram Powerpoint Slides
Our above business slide contains circular graphics of with three steps. This slide is suitable to present target analysis steps. Develop your strategy and communicate with your team with this professional slide design.
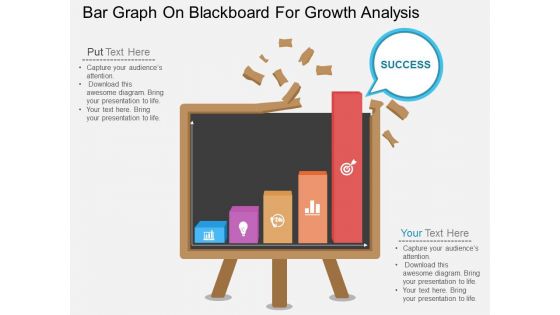
Bar Graph On Blackboard For Growth Analysis Powerpoint Template
Visually support your presentation with our above template containing bar graph on blackboard. This PowerPoint template helps to display growth analysis. Etch your views in the brains of your audience with this diagram slide.
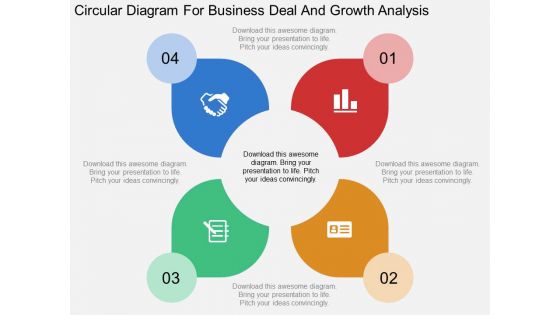
Circular Diagram For Business Deal And Growth Analysis Powerpoint Template
This PowerPoint template has been designed with graphics of circular diagram. You may download this PPT diagram slide to display business deal and growth analysis. Chart the course you intend to take with this slide
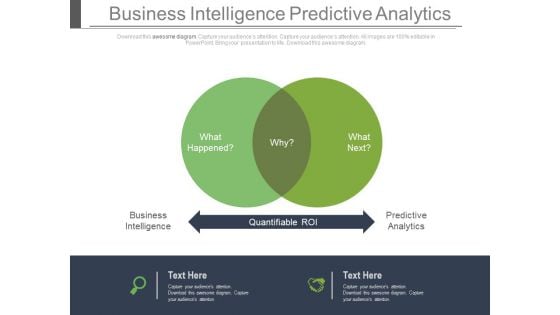
Venn Diagram For Business Intelligence And Predictive Analysis Powerpoint Slides
This power point template has been designed with two steps Venn diagram. Use this Venn diagram for business intelligence and predictive analysis. Illustrate your ideas and imprint them in the minds of your team with this template.
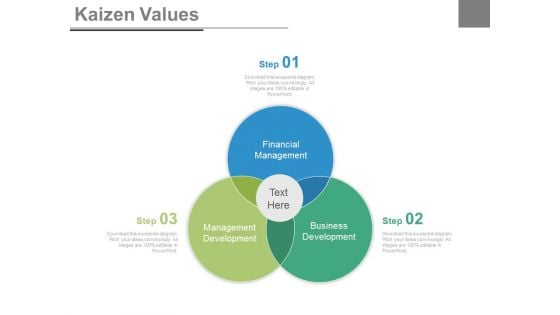
Venn Diagram For Kaizen Values Analysis Powerpoint Slides
This power point template has been designed with graphic of Venn diagram. Use this Venn diagram to display kaizen value analysis. Illustrate your ideas and imprint them in the minds of your team with this template.
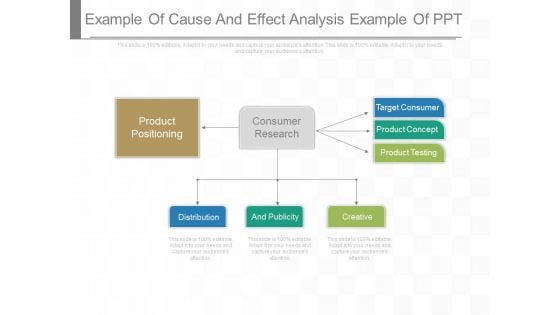
Example Of Cause And Effect Analysis Example Of Ppt
This is an example of cause and effect analysis example of ppt. This is a one stage process. The stages in this process are product positioning, consumer research, target consumer, product concept, product testing, distribution, and publicity, creative.\n\n
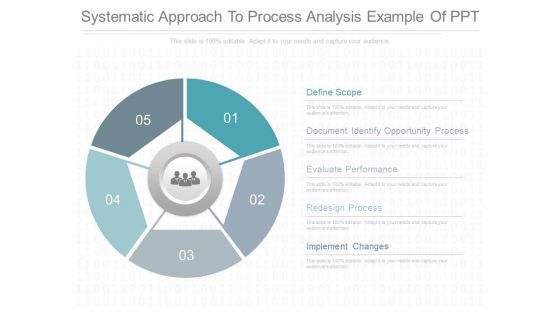
Systematic Approach To Process Analysis Example Of Ppt
This is a systematic approach to process analysis example of ppt. This is a five stage process. The stages in this process are define scope, document identify opportunity process, evaluate performance, redesign process, implement changes.
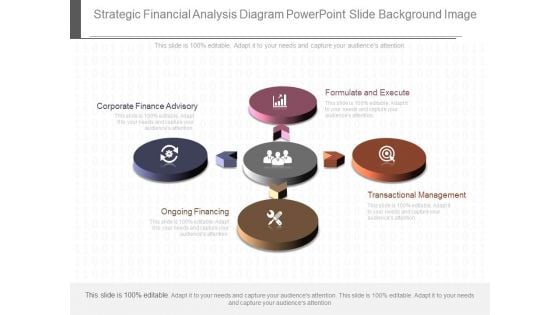
Strategic Financial Analysis Diagram Powerpoint Slide Background Image
This is a strategic financial analysis diagram powerpoint slide background image. This is a four stage process. The stages in this process are formulate and execute, transactional management, ongoing financing, corporate finance advisory.
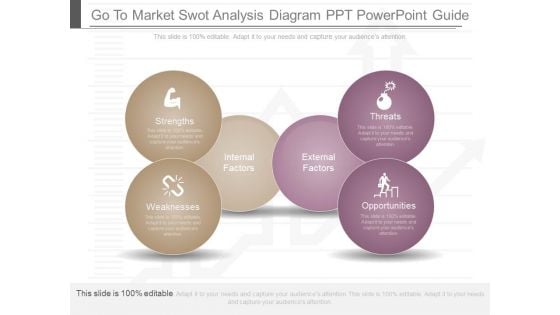
Go To Market Swot Analysis Diagram Ppt Powerpoint Guide
This is a go to market swot analysis diagram ppt powerpoint guide. This is a six stage process. The stages in this process are strengths, weaknesses, internal factors, external factors, threats, opportunities.

Five Forces Analysis Template Diagram Example Of Ppt
This is a five forces analysis template diagram example of ppt. This is a four stage process. The stages in this process are potential entrants, buyer power, supplier power, threat of substitutes.
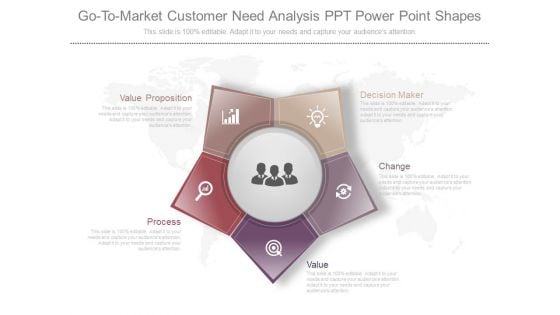
Go To Market Customer Need Analysis Ppt Powerpoint Shapes
This is a go to market customer need analysis ppt powerpoint shapes. This is a five stage process. The stages in this process are decision maker, change, value, process, value proposition.
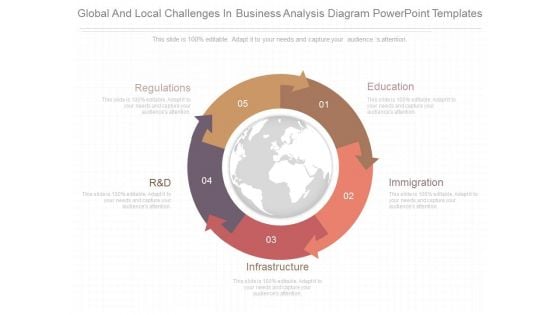
Global And Local Challenges In Business Analysis Diagram Powerpoint Templates
This is a global and local challenges in business analysis diagram powerpoint templates. This is a four stage process. The stages in this process are regulations, education, immigration, infrastructure, r and d.


 Continue with Email

 Home
Home


