Qualitative Data
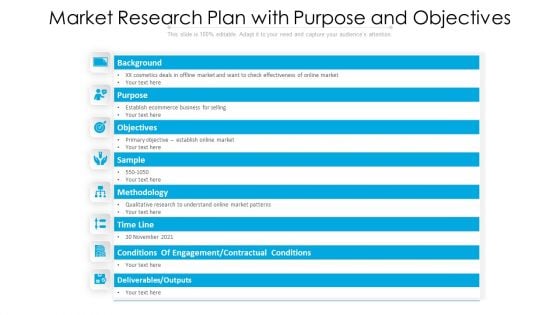
Market Research Plan With Purpose And Objectives Ppt PowerPoint Presentation Inspiration Elements PDF
Showcasing this set of slides titled market research plan with purpose and objectives ppt powerpoint presentation inspiration elements pdf. The topics addressed in these templates are establish ecommerce business for selling, qualitative research to understand online market patterns, objectives. All the content presented in this PPT design is completely editable. Download it and make adjustments in color, background, font etc. as per your unique business setting.
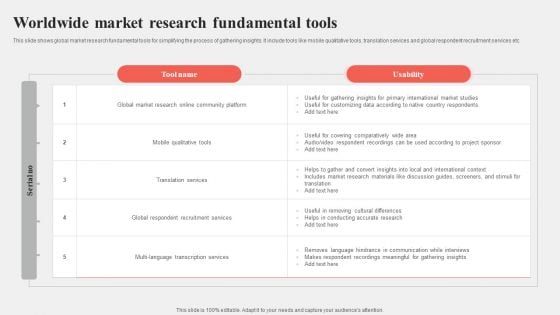
Worldwide Market Research Fundamental Tools Inspiration PDF
This slide shows global market research fundamental tools for simplifying the process of gathering insights. It include tools like mobile qualitative tools, translation services and global respondent recruitment services etc Showcasing this set of slides titled Worldwide Market Research Fundamental Tools Inspiration PDF. The topics addressed in these templates are Tool Name, Usability, Market Research. All the content presented in this PPT design is completely editable. Download it and make adjustments in color, background, font etc. as per your unique business setting.
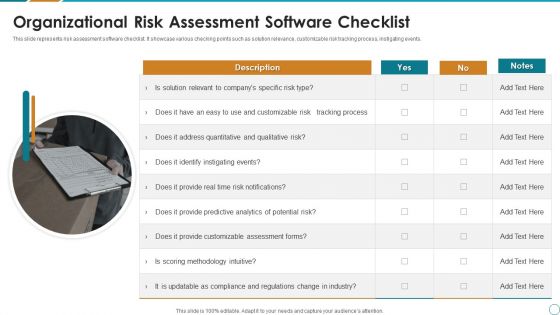
Organizational Risk Assessment Software Checklist Ppt PowerPoint Presentation File Format PDF
This slide represents risk assessment software checklist. It showcase various checking points such as solution relevance, customizable risk tracking process, instigating events. Presenting Organizational Risk Assessment Software Checklist Ppt PowerPoint Presentation File Format PDF to dispense important information. This template comprises one stages. It also presents valuable insights into the topics including Qualitative Risk, Provide Customizable Assessment, Identify Instigating Events. This is a completely customizable PowerPoint theme that can be put to use immediately. So, download it and address the topic impactfully.
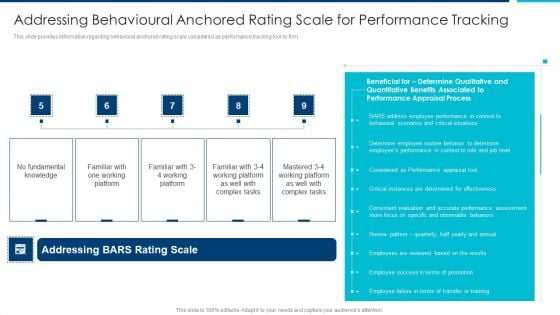
Enhanced Workforce Effectiveness Structure Addressing Behavioural Anchored Rating Scale Brochure PDF
This slide provides information regarding behavioral anchored rating scale considered as performance tracking tool by firm.Deliver and pitch your topic in the best possible manner with this Enhanced Workforce Effectiveness Structure Addressing Behavioural Anchored Rating Scale Brochure PDF Use them to share invaluable insights on Fundamental Knowledge, Working Platform, Determine Qualitative and impress your audience. This template can be altered and modified as per your expectations. So, grab it now.
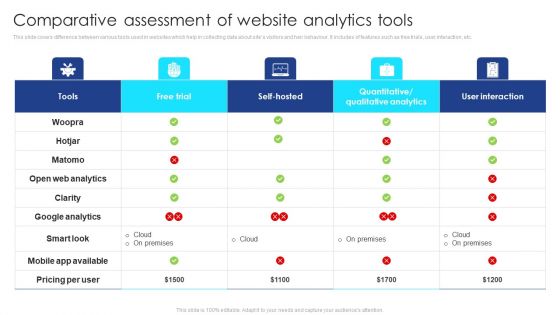
Comparative Assessment Of Website Analytics Tools Infographics PDF
This slide covers difference between various tools used in websites which help in collecting data about sites visitors and heir behaviour. It includes of features such as free trials, user interaction, etc. Pitch your topic with ease and precision using this Comparative Assessment Of Website Analytics Tools Infographics PDF. This layout presents information on Tools, Free Trial, Self-Hosted, Quantitative Or Qualitative Analytics, User Interaction. It is also available for immediate download and adjustment. So, changes can be made in the color, design, graphics or any other component to create a unique layout.
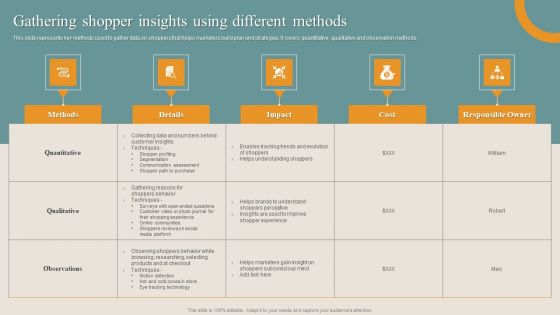
Shopper Advertisement Strategies Gathering Shopper Insights Using Different Methods Themes PDF
This slide represents key methods used to gather data on shoppers that helps marketers build plan and strategies. It covers quantitative, qualitative and observation methods. If your project calls for a presentation, then Slidegeeks is your go-to partner because we have professionally designed, easy-to-edit templates that are perfect for any presentation. After downloading, you can easily edit Shopper Advertisement Strategies Gathering Shopper Insights Using Different Methods Themes PDF and make the changes accordingly. You can rearrange slides or fill them with different images. Check out all the handy templates.
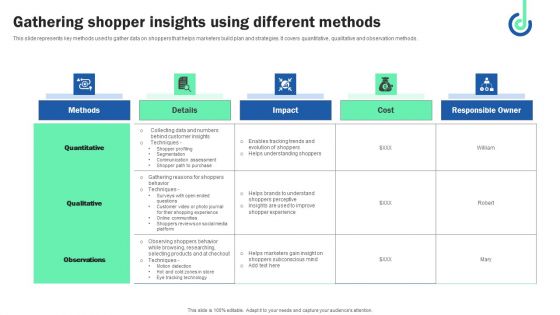
Gathering Shopper Insights Using Different Methods Slides PDF
This slide represents key methods used to gather data on shoppers that helps marketers build plan and strategies. It covers quantitative, qualitative and observation methods. Take your projects to the next level with our ultimate collection of Gathering Shopper Insights Using Different Methods Slides PDF. Slidegeeks has designed a range of layouts that are perfect for representing task or activity duration, keeping track of all your deadlines at a glance. Tailor these designs to your exact needs and give them a truly corporate look with your own brand colors they will make your projects stand out from the rest.
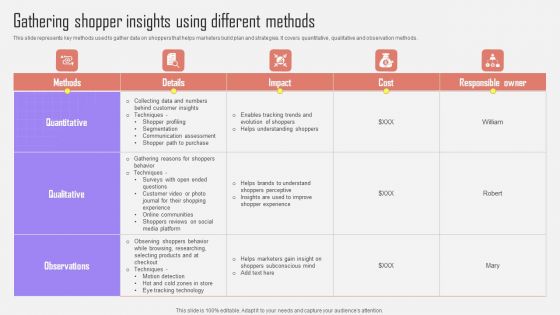
Gathering Shopper Insights Using Different Methods Optimizing Customer Purchase Experience By Executing Topics PDF
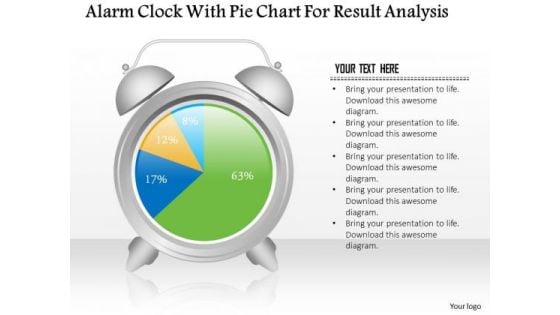
Business Diagram Alarm Clock With Pie Chart For Result Analysis PowerPoint Slide
This business slide displays alarm clock with pie chart. This diagram is a data visualization tool that gives you a simple way to present statistical information. This slide helps your audience examine and interpret the data you present.
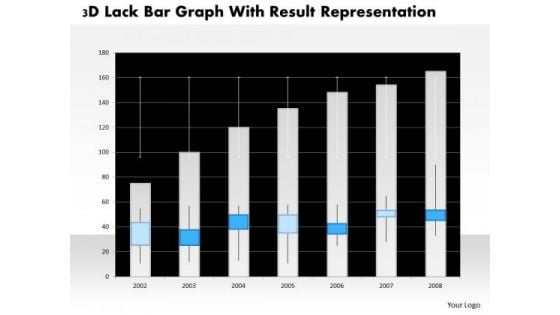
Business Diagram 3d Lack Bar Graph With Result Representation PowerPoint Slide
This business diagram has graphic of 3d lack bar graph. This diagram is a data visualization tool that gives you a simple way to present statistical information. This slide helps your audience examine and interpret the data you present.
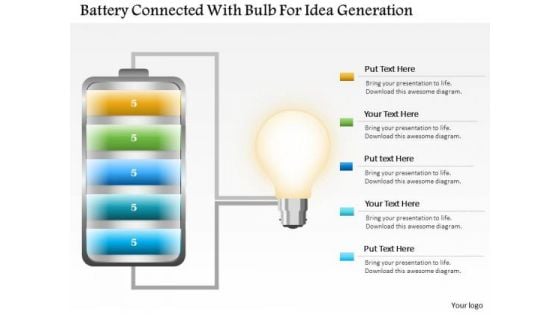
Business Diagram Battery Connected With Bulb For Idea Generation PowerPoint Slide
This business slide displays battery icon connected with bulb. This diagram is a data visualization tool that gives you a simple way to present statistical information. This slide helps your audience examine and interpret the data you present.

Human Resources Planning Development Methods Ppt PowerPoint Presentation Complete Deck With Slides
This is a human resources planning development methods ppt powerpoint presentation complete deck with slides. This is a one stage process. The stages in this process are finance, data analysis, graph representation, planning, process.
Statistics Dashboard Vector Icon Ppt PowerPoint Presentation Pictures Visual Aids
Presenting this set of slides with name statistics dashboard vector icon ppt powerpoint presentation pictures visual aids. This is a one stage process. The stages in this process are data visualization icon, research analysis, business focus. This is a completely editable PowerPoint presentation and is available for immediate download. Download now and impress your audience.
Bar Graph Icon For Research Analysis Ppt PowerPoint Presentation Summary Portfolio
Presenting this set of slides with name bar graph icon for research analysis ppt powerpoint presentation summary portfolio. This is a three stage process. The stages in this process are data visualization icon, research analysis, business focus. This is a completely editable PowerPoint presentation and is available for immediate download. Download now and impress your audience.
Information Visualization Vector Icon Ppt PowerPoint Presentation Ideas Microsoft
Presenting this set of slides with name information visualization vector icon ppt powerpoint presentation ideas microsoft. This is a three stage process. The stages in this process are data visualization icon, research analysis, business focus. This is a completely editable PowerPoint presentation and is available for immediate download. Download now and impress your audience.
Bar Chart Business Analytics Vector Icon Ppt PowerPoint Presentation Layouts Shapes
Presenting this set of slides with name bar chart business analytics vector icon ppt powerpoint presentation layouts shapes. This is a three stage process. The stages in this process are data visualization icon, research analysis, business focus. This is a completely editable PowerPoint presentation and is available for immediate download. Download now and impress your audience.
Business Performance Graph On Screen Icon Ppt PowerPoint Presentation Show Layouts
Presenting this set of slides with name business performance graph on screen icon ppt powerpoint presentation show layouts. This is a three stage process. The stages in this process are data visualization icon, research analysis, business focus. This is a completely editable PowerPoint presentation and is available for immediate download. Download now and impress your audience.
Business Performance Mapping Vector Icon Ppt PowerPoint Presentation Outline Show
Presenting this set of slides with name business performance mapping vector icon ppt powerpoint presentation outline show. This is a three stage process. The stages in this process are data visualization icon, research analysis, business focus. This is a completely editable PowerPoint presentation and is available for immediate download. Download now and impress your audience.
Computer Screen With Cloud Icon Ppt PowerPoint Presentation Outline Designs
Presenting this set of slides with name computer screen with cloud icon ppt powerpoint presentation outline designs. This is a three stage process. The stages in this process are data visualization icon, research analysis, business focus. This is a completely editable PowerPoint presentation and is available for immediate download. Download now and impress your audience.
Illustration Of Business Trends Icon Ppt PowerPoint Presentation Gallery Example
Presenting this set of slides with name illustration of business trends icon ppt powerpoint presentation gallery example. This is a two stage process. The stages in this process are data visualization icon, research analysis, business focus. This is a completely editable PowerPoint presentation and is available for immediate download. Download now and impress your audience.
Visual Analytics Vector Icon Ppt PowerPoint Presentation Visual Aids Show
Presenting this set of slides with name visual analytics vector icon ppt powerpoint presentation visual aids show. This is a three stage process. The stages in this process are data visualization icon, research analysis, business focus. This is a completely editable PowerPoint presentation and is available for immediate download. Download now and impress your audience.
Business Focus Vector Icon Ppt PowerPoint Presentation Portfolio Background Image
Presenting this set of slides with name business focus vector icon ppt powerpoint presentation portfolio background image. This is a one stage process. The stages in this process are data visualization icon, research analysis, business focus. This is a completely editable PowerPoint presentation and is available for immediate download. Download now and impress your audience.
Human Eye Observation And Monitoring Icon Ppt PowerPoint Presentation Layouts Graphics
Presenting this set of slides with name human eye observation and monitoring icon ppt powerpoint presentation layouts graphics. This is a three stage process. The stages in this process are data visualization icon, research analysis, business focus. This is a completely editable PowerPoint presentation and is available for immediate download. Download now and impress your audience.
Upward Profit Growth Arrow Graph Vector Icon Ppt PowerPoint Presentation Styles Templates
Presenting this set of slides with name upward profit growth arrow graph vector icon ppt powerpoint presentation styles templates. This is a one stage process. The stages in this process are data visualization icon, research analysis, business focus. This is a completely editable PowerPoint presentation and is available for immediate download. Download now and impress your audience.
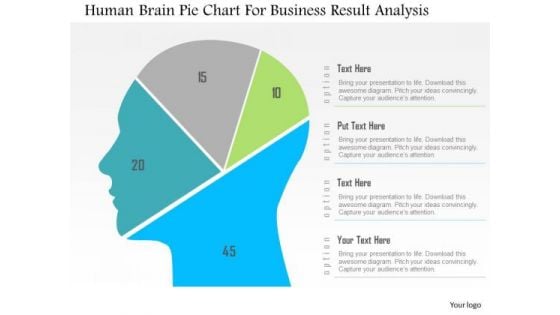
Business Diagram Human Brain Pie Chart For Business Result Analysis PowerPoint Slide
This diagram displays human face graphic divided into sections. This section can be used for data display. Use this diagram to build professional presentations for your viewers.
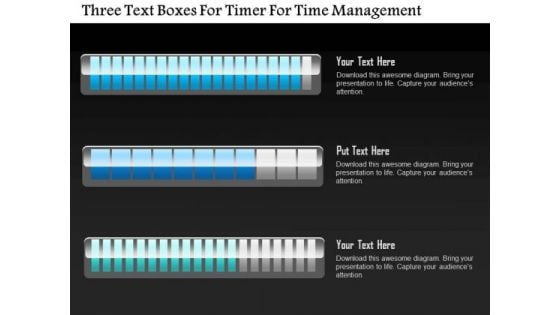
Business Diagram Three Text Boxes For Timer For Time Management PowerPoint Slide
This business diagram displays three text boxes. This diagram contains text boxes for data representation. Use this diagram to display business process workflows in any presentations.
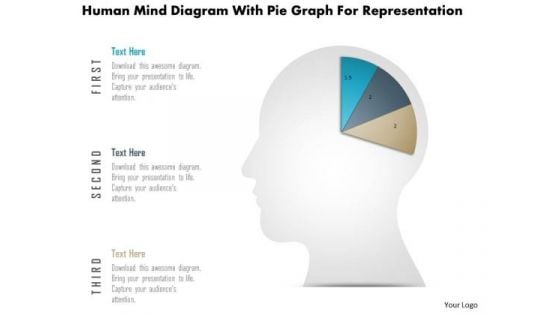
Business Diagram Human Mind Diagram With Pie Graph For Representation PowerPoint Slide
This diagram displays human face graphic divided into sections. This section can be used for data display. Use this diagram to build professional presentations for your viewers.
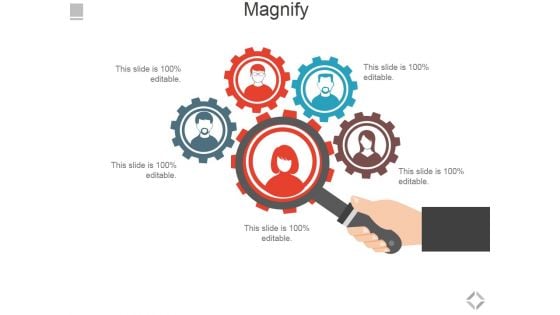
Magnify Ppt PowerPoint Presentation Summary Portfolio
This is a magnify ppt powerpoint presentation summary portfolio. This is a five stage process. The stages in this process are magnify, business, technology, data analysis, marketing.
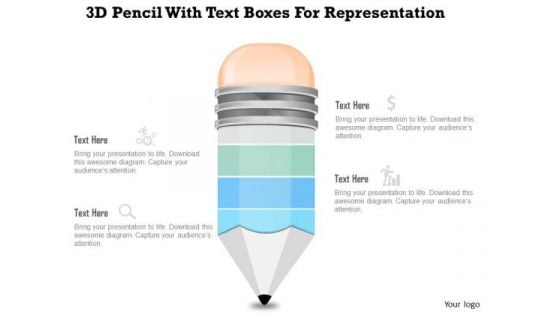
Business Diagram 3d Pencil With Text Boxes For Representation PowerPoint Slide
This Power Point diagram displays graphic of pencil with icons and text spaces. It contains diagram of colorful pencil for data display. Use this diagram to build professional presentations for your viewers.
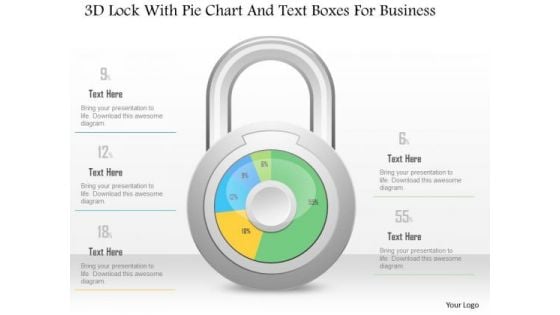
Business Diagram 3d Lock With Pie Chart And Text Boxes For Business PowerPoint Slide
This Power Point diagram has been crafted with pie chart in shape of lock. It contains diagram of lock pie chart to compare and present data in an effective manner. Use this diagram to build professional presentations for your viewers.
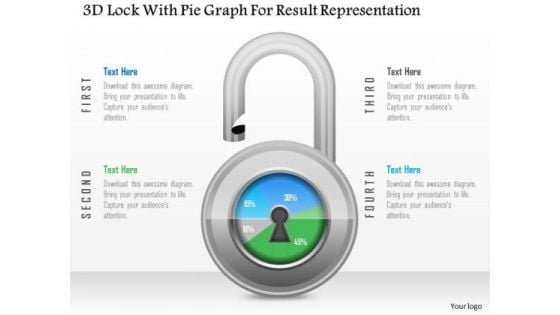
Business Diagram 3d Lock With Pie Graph For Result Representation PowerPoint Slide
This Power Point diagram has been crafted with pie chart in shape of lock. It contains diagram of lock pie chart to compare and present data in an effective manner. Use this diagram to build professional presentations for your viewers.
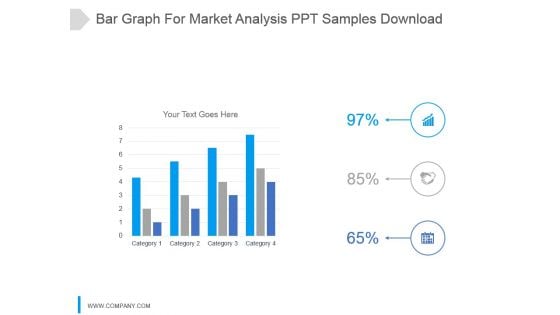
Bar Graph For Market Analysis Ppt Samples Download
This is a bar graph for market analysis ppt samples download. This is a four stage process. The stages in this process are category.
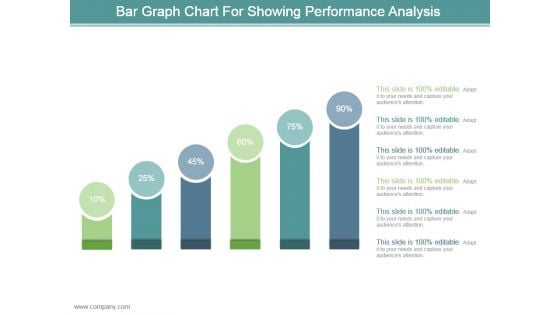
Bar Graph Chart For Showing Performance Analysis Ppt Design
This is a bar graph chart for showing performance analysis ppt design. This is a six stage process. The stages in this process are business, marketing, process, success, presentation.
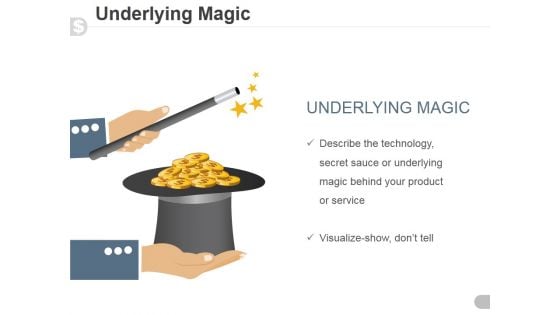
Underlying Magic Ppt PowerPoint Presentation Inspiration
This is a underlying magic ppt powerpoint presentation inspiration. This is a one stage process. The stages in this process are business, marketing, magic, technology, product.
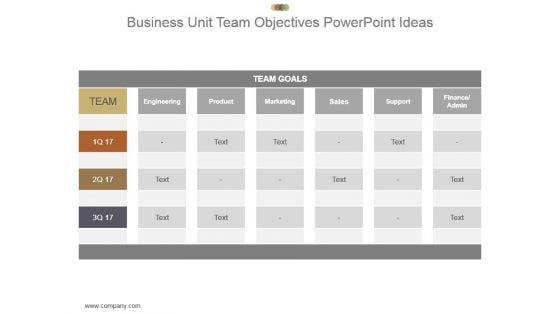
Business Unit Team Objectives Powerpoint Ideas
This is a business unit team objectives powerpoint ideas. This is a four stage process. The stages in this process are team, team goals, engineering, product, marketing, sales, support, finance admin.
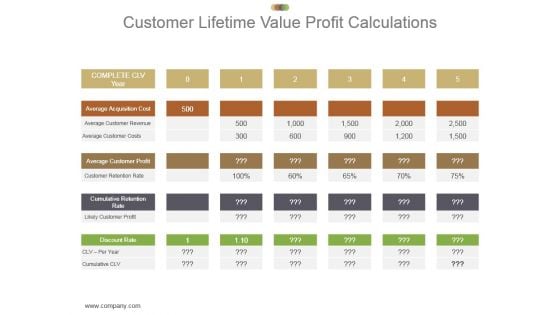
Customer Lifetime Value Profit Calculations Ppt Presentation
This is a customer lifetime value profit calculations ppt presentation. This is a five stage process. The stages in this process are complete clv year, average acquisition cost, average customer revenue, average customer costs, average customer profit, customer retention rate, cumulative retention rate, likely customer profit, discount rate.
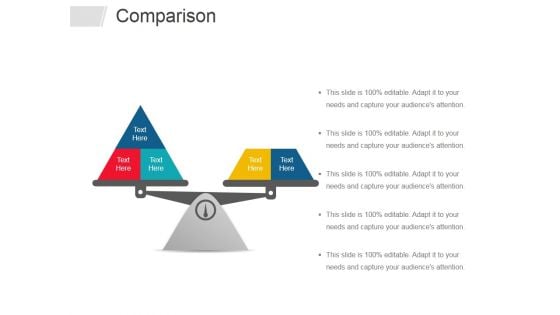
Comparison Ppt PowerPoint Presentation Infographic Template Graphics Tutorials
This is a comparison ppt powerpoint presentation infographic template graphics tutorials. This is a two stage process. The stages in this process are comparison, planning, business, management, marketing.
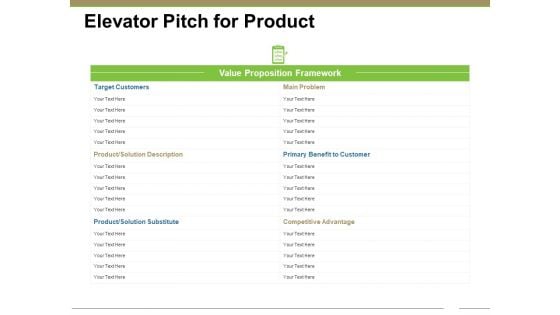
Elevator Pitch For Product Ppt PowerPoint Presentation Infographic Template Infographic Template
This is a elevator pitch for product ppt powerpoint presentation infographic template infographic template. This is a three stage process. The stages in this process are target customers, main problem, primary benefit to customer, competitive advantage, product solution description.

ROI Calculation Ppt PowerPoint Presentation Complete Deck With Slides
This is a roi calculation ppt powerpoint presentation complete deck with slides. This is a one stage process. The stages in this process are business, planning, strategy, marketing, management.

Business Diagram Six Staged Pie Charts For Text Representation PowerPoint Slide
This slide displays graphic six staged pie charts. Download this diagram to present and compare business data. Use this diagram to display business process workflows in any presentation.
Business Diagram Human Icons With Bubbles And Different Icons Inside PowerPoint Slide
This diagram displays graph with percentage value growth. This business slide is suitable to present and compare business data. Use this diagram to build professional presentations for your viewers.

Business Diagram Three Staged Pencil Diagram For Graph Formation PowerPoint Slide
This business diagram displays set of pencils. This Power Point template has been designed to compare and present business data. Download this diagram to represent stages of business growth.
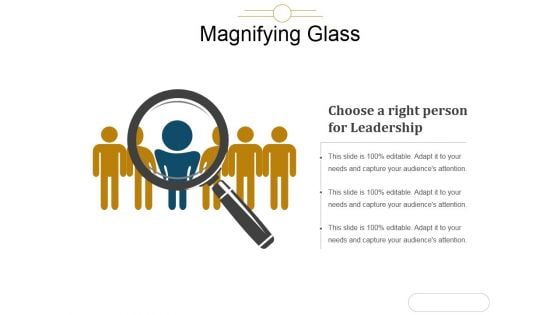
Magnifying Glass Ppt PowerPoint Presentation Ideas
This is a magnifying glass ppt powerpoint presentation ideas. This is a one stage process. The stages in this process are choose a right person for leadership, business, big data, marketing, technology.
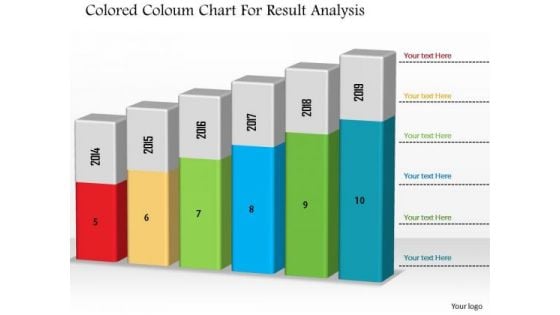
Business Diagram Colored Column Chart For Result Analysis PowerPoint Slide
This Power Point diagram has been designed with graphic of column chart. It contains diagram of bar char depicting annual business progress report. Use this diagram to build professional presentations for your viewers.
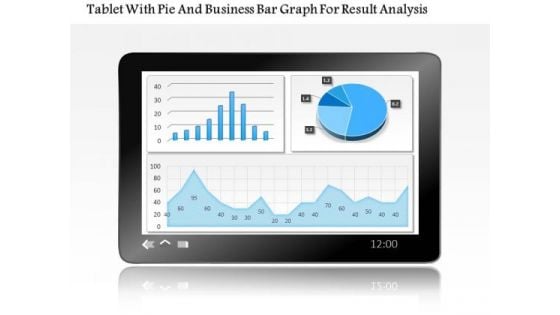
Business Diagram Tablet With Pie And Business Bar Graph For Result Analysis PowerPoint Slide
This PowerPoint template displays technology gadgets with various business charts. Use this diagram slide, in your presentations to make business reports for statistical analysis. You may use this diagram to impart professional appearance to your presentations.
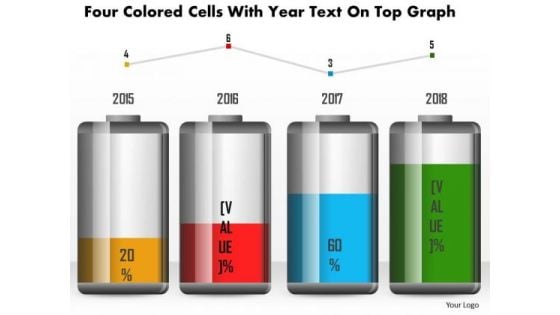
Business Diagram Four Colored Cells With Year Text On Top Graph PowerPoint Slide
This business diagram has been designed with battery cell graphic for business timeline. This slide can be used for business planning and management. Use this diagram for your business and success milestones related presentations.
Business Diagram Battery Icon With Power Icons Energy Technology PowerPoint Slide
This business diagram displays battery icon with power charging. Use this diagram, in your presentations to display energy saving, battery and technology. Create professional presentations using this diagram slide.
Business Diagram Battery With Alert Sign And Dices Power Technology PowerPoint Slide
This business diagram displays risk alert on battery icon. Use this diagram, in your presentations to display energy saving, battery and technology. Create professional presentations using this diagram slide.
Business Diagram Green Battery Cell With Full Charging Symbol PowerPoint Slide
This business diagram displays full battery charge icon. Use this diagram, in your presentations to display energy saving, battery and technology. Create professional presentations using this diagram slide.
Business Diagram Battery With Empty Sign For Power Generation PowerPoint Slide
This business diagram displays empty sign alert on battery icon. Use this diagram, in your presentations to display energy saving, battery and technology. Create professional presentations using this diagram slide.
Business Diagram Hour Glass With 3d Man And Icons PowerPoint Slide
This diagram displays 3d man with hour glass and icons. This diagram contains concept of communication and technology. Use this diagram to display business process workflows in any presentations.
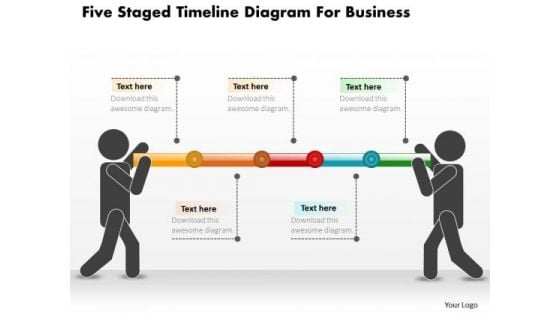
Business Diagram Five Staged Timeline Diagram For Business PowerPoint Slide
This PowerPoint template displays five points timeline diagram. This business diagram has been designed with graphic of timeline with five points, text space and start, end points. Use this diagram, in your presentations to display process steps, stages, timelines and business management. Make wonderful presentations using this business slide.
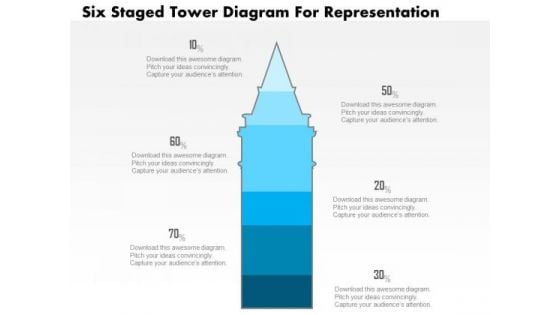
Business Diagram Five Staged Tower Diagram For Representation PowerPoint Slide
This business slide displays five staged tower diagram. It contains blue tower graphic divided into five parts. This diagram slide depicts processes, stages, steps, points, options information display. Use this diagram, in your presentations to express your views innovatively.
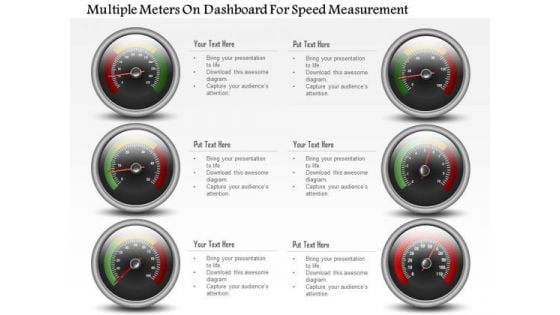
Business Diagram Multiple Meters On Dashboard For Speed Measurement PowerPoint Slide
This business diagram has been designed with multiple meters on dashboard. This slide can be used for business planning and progress. Use this diagram for your business and success milestones related presentations.
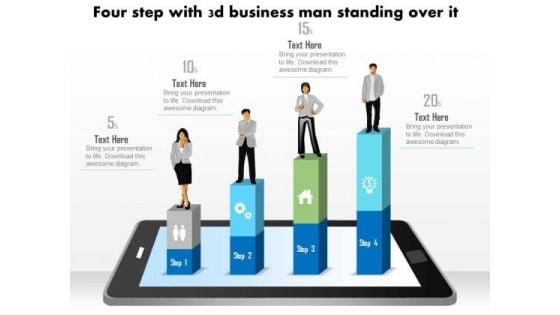
Business Diagram Four Steps With 3d Business Person Standing Over It PowerPoint Slide
This business diagram displays bar graph with business person standing on it. This Power Point template has been designed to display personal growth. You may use this diagram to impart professional appearance to your presentations.
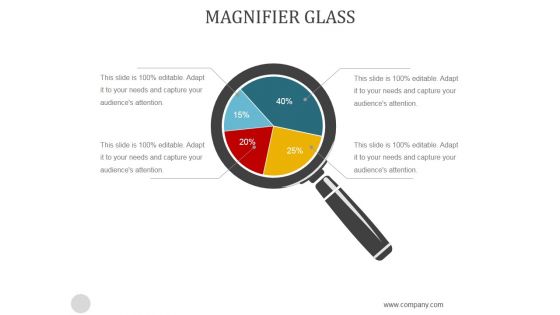
Magnifier Glass Ppt PowerPoint Presentation Example
This is a magnifier glass ppt powerpoint presentation example. This is a four stage process. The stages in this process are magnifier, searching, strategy, analysis, business.

Magnifying Glass Ppt PowerPoint Presentation Layouts Guide
This is a magnifying glass ppt powerpoint presentation layouts guide. This is a six stage process. The stages in this process are magnifying glass, process, business, marketing, technology.
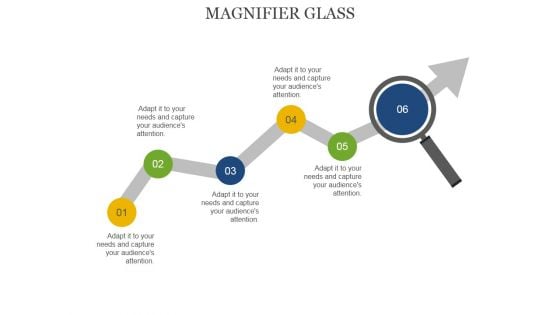
Magnifier Glass Ppt PowerPoint Presentation Summary Microsoft
This is a magnifier glass ppt powerpoint presentation summary microsoft. This is a five stage process. The stages in this process are magnifying glass, arrows, marketing, technology, business.
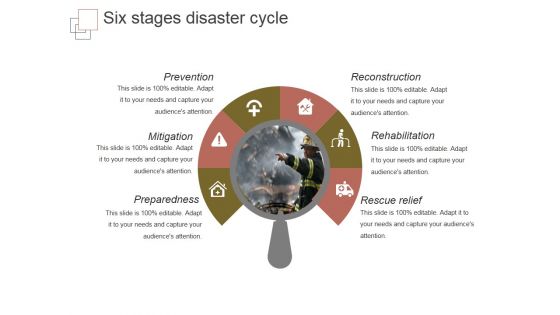
Six Stages Disaster Cycle Ppt PowerPoint Presentation Designs Download
This is a six stages disaster cycle ppt powerpoint presentation designs download. This is a six stage process. The stages in this process are prevention, mitigation, preparedness, reconstruction, rehabilitation.
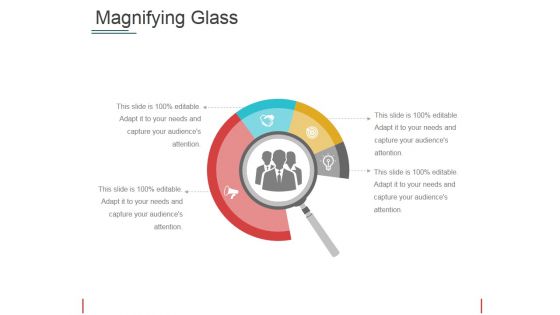
Magnifying Glass Ppt PowerPoint Presentation File Grid
This is a magnifying glass ppt powerpoint presentation file grid. This is a four stage process. The stages in this process are magnifying glass, icons, marketing, business, management.


 Continue with Email

 Home
Home


